1. Introduction
Diabetes is a widespread chronic disease that affects many people worldwide. It is a major human health problem related to microvascular abnormalities. As a consequence, diabetic retinopathy (DR) is one of the most severe chronic diseases affecting the human eye. It is caused by damage to the blood vessels of the light-sensitive tissue at the back of the eye, i.e., the retina, and can lead to blindness [
1]. Luckily, early identification and effective treatment can prevent many new cases from emerging [
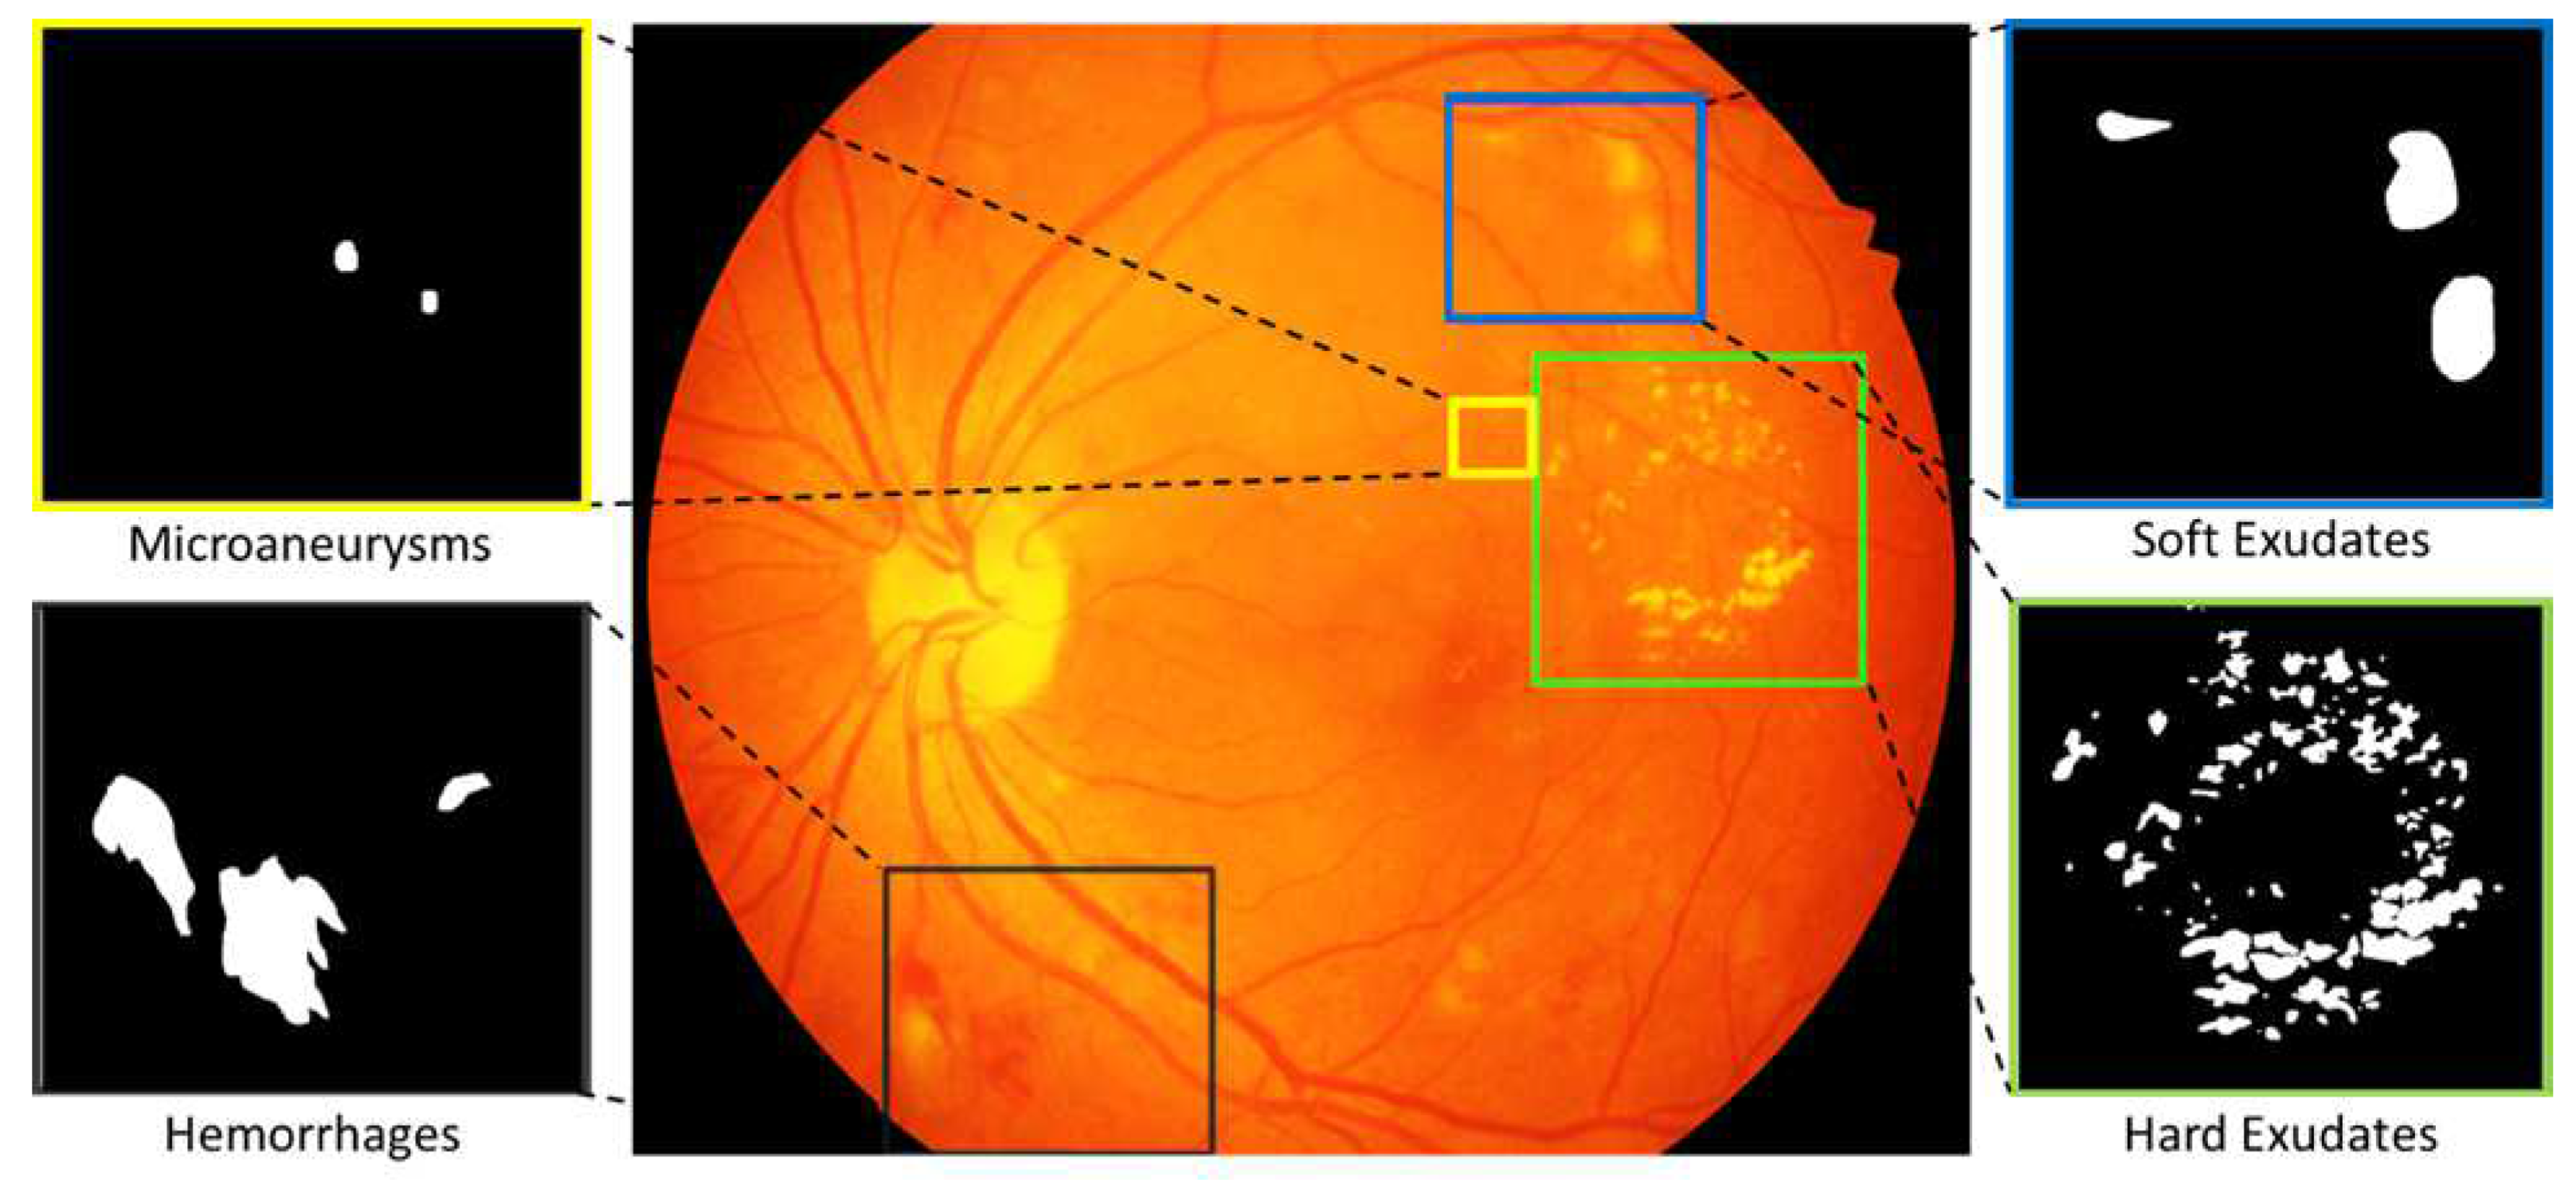
2]. Fundus images of the human eye have been widely used for early screening and detection of various diseases, including DR and glaucoma. Different signs of retinal eye lesions, such as hard exudates (EX), microaneurysm (MA), hemorrhages (HE), and soft exudates (SE), can be found in fundus images, indicating the presence and severity of DR.
Figure 1 shows some examples of these lesions. MA and HE appear in a fundus image as abnormal red lesions and indicate the early stages of DR, whereas EX and SE appear as light lesions, indicating advanced stages of DR disease [
3].
The manual detection and segmentation of small objects, like lesions, in fundus images is a painstaking process that consumes ophthalmologists’ time and effort [
4]. Furthermore, it is difficult for ophthalmology professionals to recognize lesions effectively and analyze a large number of fundus images at once, due to the complicated structure of lesions, their varied sizes, differences in brightness, and their inter-class similarities with other tissues [
5]. Moreover, training new workers on this kind of diagnosis based on these complicated images requires significant time, to build knowledge through regular practice [
6].
Different computer-aided diagnosis (CAD) systems utilizing artificial intelligence models have been proposed in the last two decades to deal with these challenges, where lesion detection and segmentation are performed automatically [
7,
8]. Deep learning techniques have recently become the core of CAD systems, due to their high accuracy compared to other traditional machine learning and computer vision methods. Several deep learning-based CAD systems have been proposed for segmenting retinal eye lesions based on an encoder–decoder network method, which is widely used in medical image segmentation [
3,
9].
However, most of the deep learning-based CAD systems proposed in the literature, such as [
3,
10,
11,
12], did not reach sufficient segmentation accuracy and employed heavyweight deep learning models, which made them less reliable and computationally expensive during the training and testing phases. Additionally, many methods may perform well with one type of retinal lesion and fail with others [
3,
13], or they work well with some datasets but not with others [
14].
Therefore, there is still a need to develop a deep learning-based segmentation model that performs well in all eye lesion segmentation tasks (i.e., EX, MA, HE, and SE segmentation), while having a reasonable computational cost.
Driven by the aforementioned discussion, in this paper, we propose an efficient deep learning method for segmenting the different kinds of retinal lesion. Specifically, we propose two multi-scale modules to enhance deep-learning segmentation model performance [
15], for extracting relevant features from fundus images. Additionally, we integrate data augmentation techniques based on affine transformations. These methods mimic the actual deformations happening in the human eye, addressing the challenge of misclassification of tiny objects by generating a more realistic synthetic training dataset. The contributions of this paper can be listed as follows:
Proposing an effective multi-scale attention (SAT) module in the decoder, to capture a wider range of lesion-relevant features by mixing low- and high-resolution data from different decoder layer sources. The goal is to enhance the concentration towards the small objects that might be lost during the image reconstruction in the decoder block;
Integration of a gated skip connection (GSC) mechanism in the decoder layers to help the network focus on retinal lesion features coming from the encoder;
Application of affine transformations as data augmentation for generating geometric distortions or deformations that occur with non-ideal image angles, leading to enhancing the performance of the segmentation model;
Considering the same method for segmentation of the four different types of lesion of the retina. Experimentation was conducted on well-known public datasets: IDRiD and E-ophtha. For the four retinal lesions, our model achieved an acceptable and competitive performance compared to state-of-the-art methods;
Generalization capability of the LezioSeg segmentation model with a low-resolution DDR fundus dataset. Our model achieved a competitive performance compared to state-of-the-art results without training the model on the dataset.
The rest of this paper is organized as follows:
Section 2 reviews recent studies on eye lesion segmentation in fundus images.
Section 3 presents the proposed retinal lesion segmentation model.
Section 4 provides the results and discusses them. Finally,
Section 5 gives the conclusions and future work.
2. Related Work
Retinal lesion segmentation in the human eye has been tackled using various deep learning-based automated techniques. The task remains challenging due to the diverse characteristics of lesions, including the variations in size, shape, location, color, and texture in fundus images. Several methods based on convolutional neural networks (CNNs) have been developed to address these challenges.
A widely adopted architecture for lesion segmentation is UNet [
16], leveraging its ability to automatically learn representative high-level features. For instance, in [
11], the authors proposed GlobalNet and LocalNet networks, employing an encoder–decoder architecture similar to UNet for MA, SE, EX, and HE segmentation. However, their method relies on two encoders, demanding significant computational resources and resulting in resource consumption issues.
CARNet [
17] introduced a multi-lesion segmentation approach based on ResNets networks [
18]. Despite acceptable results on the IDRiD, E-ophtha, and DDR datasets, the use of two heavy ResNets encoders poses a resource-intensive challenge.
EAD-Net [
3] proposed a CNN-based system incorporating an encoder module, a dual attention module, and a decoder. While achieving acceptable results on the ophtha_EX dataset, it struggled with MA and SE segmentation on the IDRiD dataset, reporting AUPR scores of 24.1% and 60.8%, respectively.
In [
19], a scale-aware attention mechanism with various backbones was introduced, achieving good results on the IDRiD and DDR datasets for some lesions. However, simultaneous success on the same dataset was limited, with low AUPR scores of 41.5% and 19.33% for MA on the IDRiD and DDR datasets, respectively.
Methods utilizing VGGNet networks, known for their heavyweight, have also been explored. For example, L-Seg [
12] proposed a unified framework based on a modified VGG16 [
20] encoder, achieving favorable results on the IDRiD dataset for all lesions. However, the performance dropped on the E-ophtha and DDR datasets, particularly for MA, with AUPR scores of 16.8% and 10.5%, respectively.
In [
10], the authors employed the HEDNet edge detector with a conditional generative adversarial network based on VGGNet for semantic segmentation of retinal lesions. While achieving an AUPR of 84.1% for EX, the performance for other lesions, such as MA, HE, and SE, fell below 50% on the IDRiD dataset.
Furthermore, several works in the literature have shown that combining deep learning architectures with a multi-scale attention mechanism shows promise for enhancing feature representational strength and target localization for medical image classification and segmentation [
21,
22,
23].
Hence, the current work aimed to develop an accurate lesion segmentation method for fundus images using lightweight backbone architectures within a single network model, incorporating scale-aware attention and gated skip connections. This approach significantly reduces computational costs compared to methods relying on heavy backbone architectures like ResNets and VGGs or those dependent on multiple backbone encoders.
3. Methodology
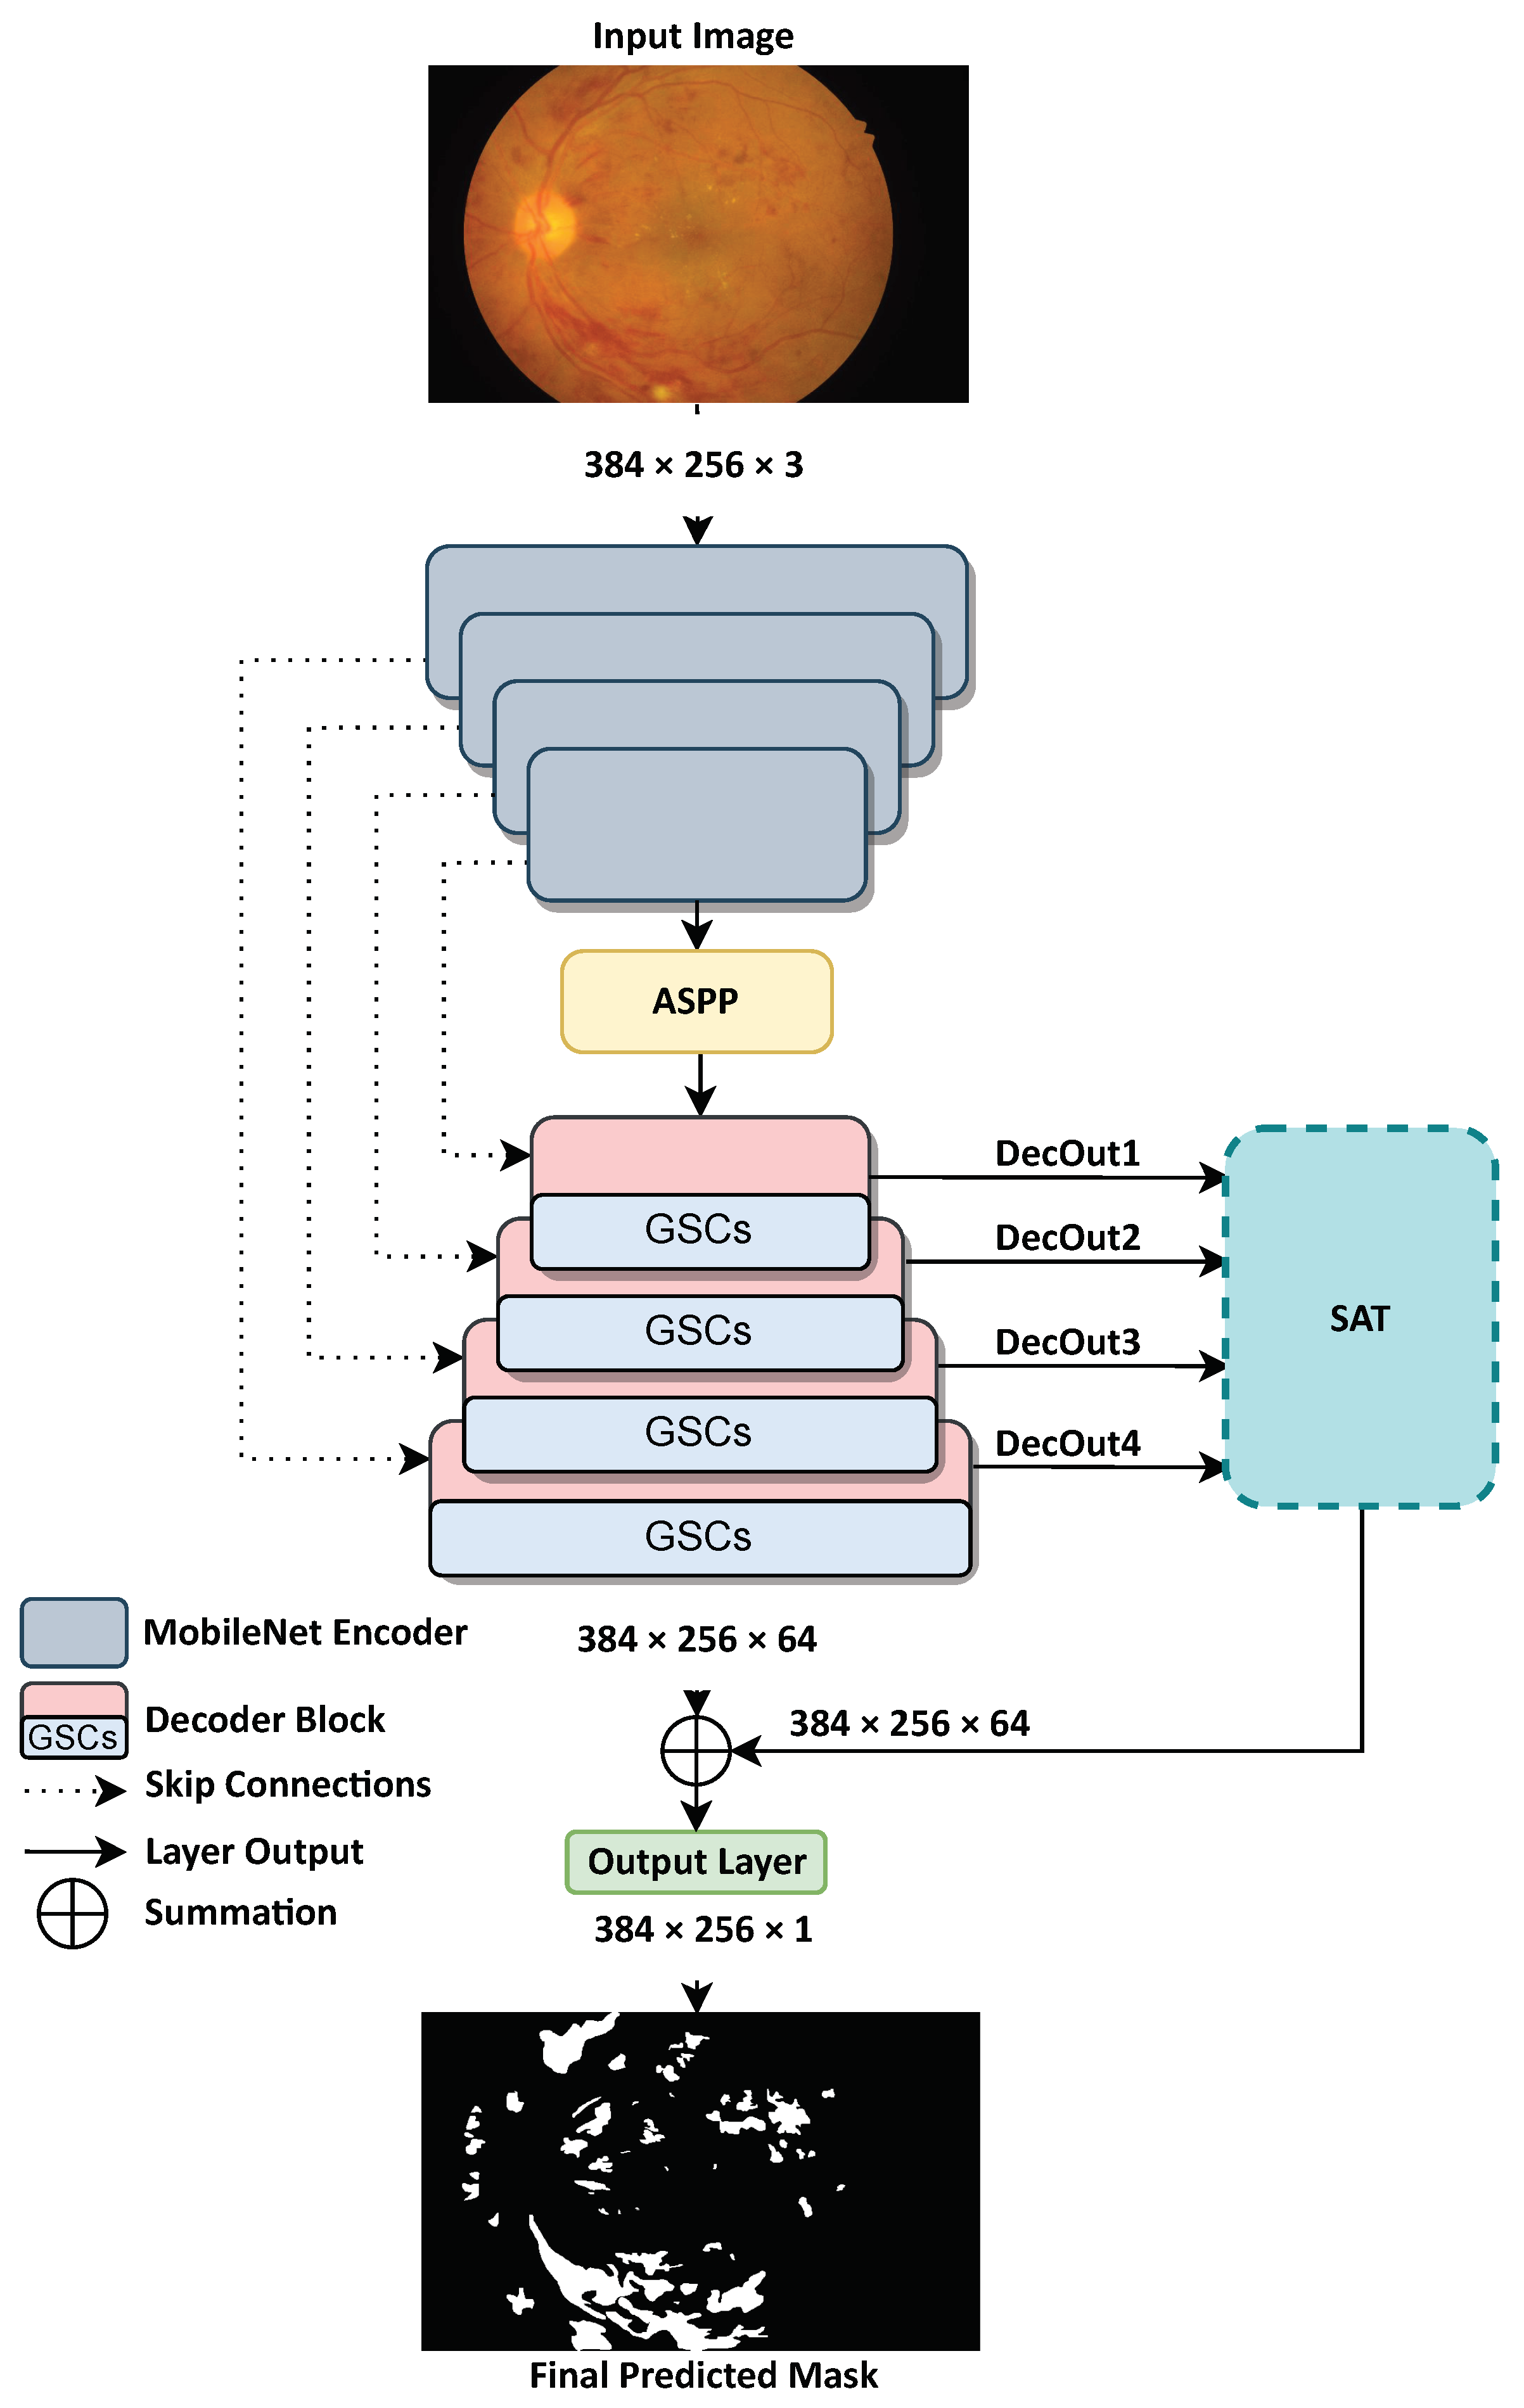
This section explains in detail the architecture of the proposed method, LezioSeg, which is composed of three parts, as shown in
Figure 2. First, the encoder network (i.e., the backbone) encodes the input image and generates feature maps. Second, we insert an atrous spatial pyramid pooling (ASPP) [
24] layer after the encoder network (i.e., the neck) that can capture contextual information at multiple scales, to generate better representations of the small lesions of the retinal eye. Third, the decoder network (i.e., the head) contains four blocks, each having a GSC mechanism [
25] to encourage the model to learn eye-lesion-relevant features. Finally, a multi-scale attention (SAT) mechanism is connected with each decoder block as an additional lesion segmentation, to enhance learning efficiency by combining low and high-resolution data from different sources. After presenting these three parts of the method, we focus on the loss function and propose the use of an affine transformation for data augmentation.
3.1. Encoder Network
In this study, we employ an ImageNet pretrained MobileNet [
26] encoder as a backbone. MobileNet was selected because it is a lightweight deep neural network with effective feature extraction capabilities and a cutting-edge foundation for many computer vision tasks [
27,
28].
MobileNet uses depth-wise separable convolution, comprised of two layers: depth-wise convolution, and point-wise convolution. The depth-wise convolution layer applies a single filter to each input channel. The point-wise convolution layer combines the output depthwise using a 1 × 1 convolution to create new feature maps. Furthermore, MobileNet has two different global hyperparameters, to reduce the computational cost-effectiveness: the width multiplayer, and the resolution-wise multiplayer.
The backbone in our suggested model includes four layers. It aims to encode the input eye fundus image and extract abstract information about retinal lesions at various levels of generality.
3.2. Neck of the Network
The LezioSeg architecture includes an atrous spatial pyramid pooling (ASPP) module, to aid in the extraction of multi-scale feature maps and to maximize the capture of contextual data of the small lesions. ASPP includes four parallel atrous convolutions with varying atrous rates. It combines atrous convolution with spatial pyramid pooling. ASPP [
29] is expressed as follows:
Atrous convolution is applied to the input x for each pixel p on the output y and filter f with length k, where the rate r determines the stride of sampling of the input image. The input x is convolved with the filters produced by inserting zeros between two consecutive filter values in atrous convolution. We can change the filter’s receptive field by adjusting the rate r. The ASPP module in this study is made up of one 1 × 1 convolution and three parallel 3 × 3 convolutions with rates of 6, 12, and 18, respectively, as well as an image-level feature produced through global average pooling. The features of the branches are concatenated and upsampled to the input size. The output of ASPP is the concatenation of the results of multi-scale feature maps passed through another 1 × 1 convolution. The decoder network follows the neck block of the network.
3.3. Decoder Network
The decoder network comprises four layers, a SAT mechanism, and an output layer that produces the final mask. Each decoder layer employs the GSCs mechanism followed by double convolution layers, batch normalization, and a rectified linear unit activation function. Below, we introduce the GSC and SAT mechanisms.
3.3.1. Gated Skip Connections (GSCs)
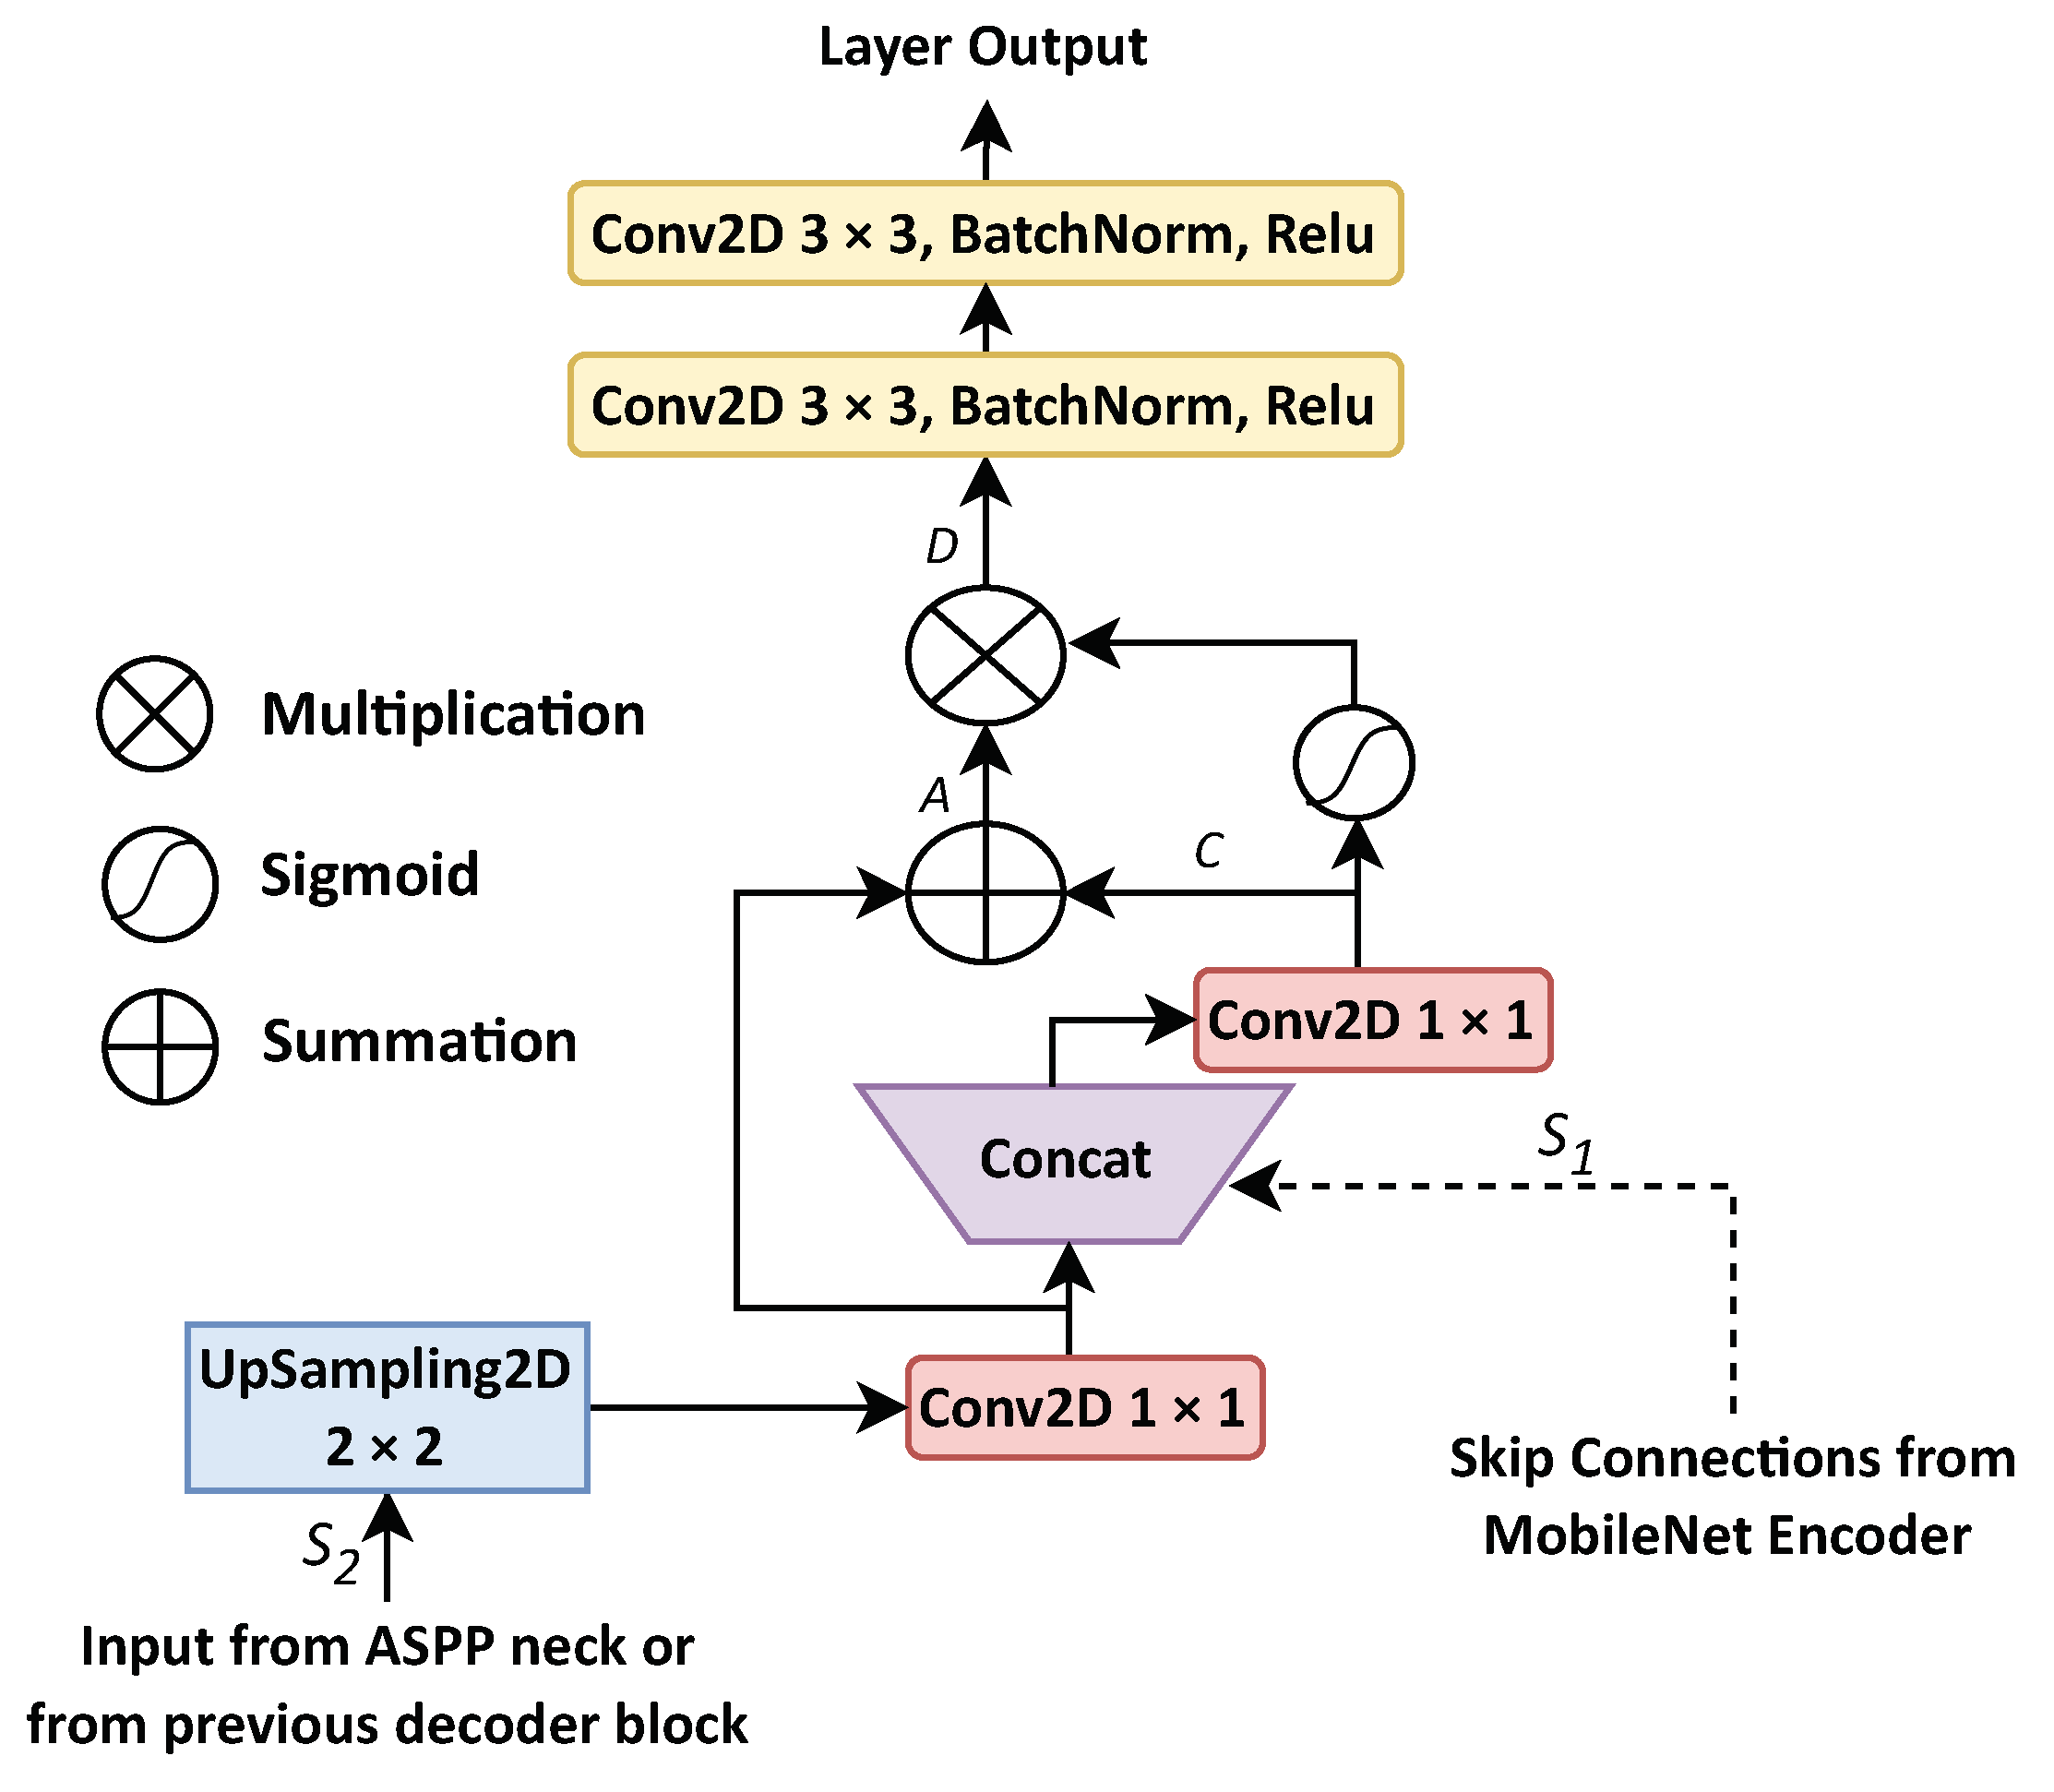
The LezioSeg method uses four GSC blocks to boost feature map production and improve discrimination between the lesion and background pixels in retinal eye lesion segmentation. All four decoder blocks share the same GSC architecture, represented in
Figure 3.
Each GSC decoder block receives feature maps expressed as
from the corresponding Mobilenet encoder block, which are concatenated with the feature maps produced by the previous block (either the ASPP neck block or a previous decoder block, expressed as
). These feature maps can be expressed as
and
, where
h,
w, and
f stand for height, width, and the filter’s number of features. Then, to produce feature maps
, the
is fed into an UpSampled2D transposed convolution layer with a kernel size of 2 × 2. After that, a concatenation is performed of the same width and height of
and
as follows:
where
indicates the kernel size of the 1 × 1 of convolution operation and
signifies the concatenation function. A sigmoid activation function is performed on the
C feature maps to generate the weights
, which enhances the discrimination process between the lesion pixels and background pixels for the segmentation of retinal eye lesions. As a result of
D, the generated weights
are multiplied by the summation of
A, where
A indicates summation of
and
C, as follows:
After that,
D enhanced feature maps are fed into double convolution layers, followed by batch normalization and a rectified linear unit activation function. Finally, the output of each decoder layer is fed into the second multi-scale block, as explained in
Section 3.3.2 (
Figure 3), where a binary image will be generated as a final mask.
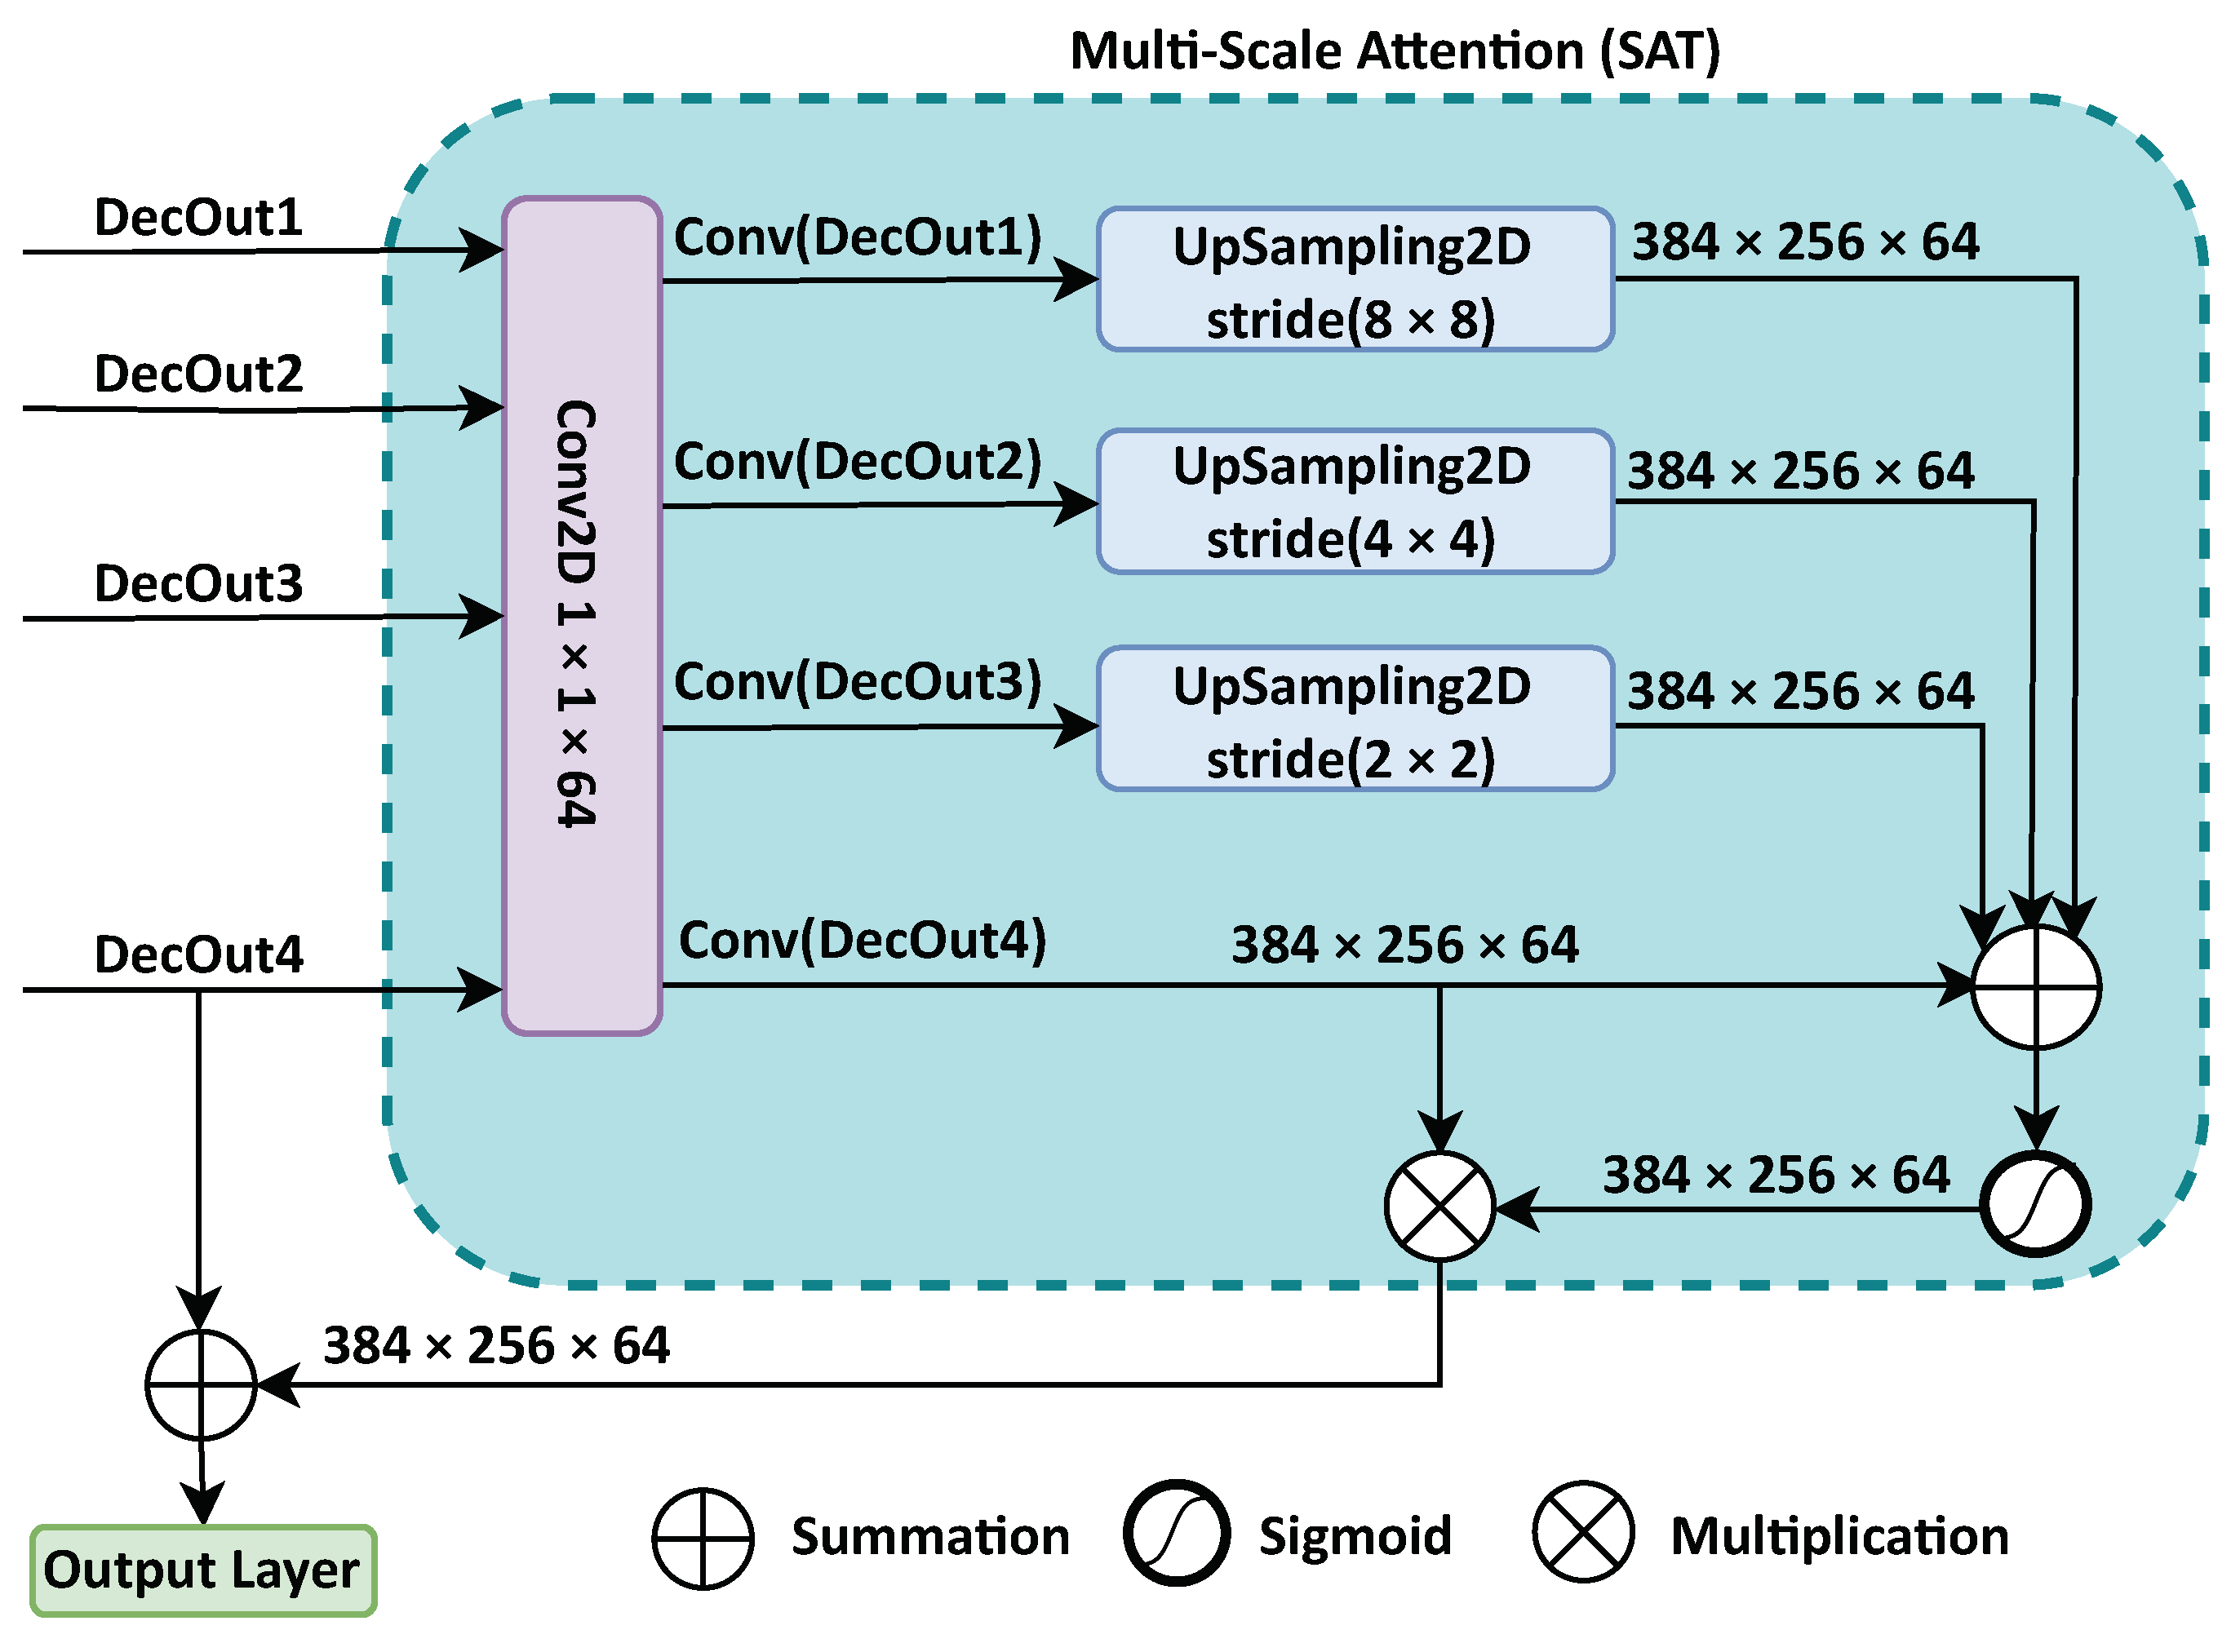
3.3.2. Multi-Scale Attention (SAT) Mechanism
The multi-scale mechanism used to capture a wider range of relevant features with attention helps the model to maintain the multi-scale nature of each decoder block output, to consider features from the four decoder blocks.
Figure 4 shows the SAT block. In SAT, we first collect the four different copies of the features from the different stages of the decoder, to extract features and to reduce the dimensions of features from coarser stages to the finest scale. Then, we unify the different scales using a 1 × 1 convolutional with a Kernal of 64.
Next, we upsample each scale size to the original size of the input image using UpSampled2D transposed convolution with different strides, to make four upscaled feature copies of the output features of the decoder blocks. SAT can be expressed as follows:
In this expression,
L indicates the decoder network layer output,
stands for the sigmoid activation function, ↑ indicates the UpSampled2D transposed convolution layer with a kernel size of 3 × 3, and
stands for the convolution operation with a kernel size of 1 × 1, where the
feature maps pass to a ↑ by
stride
and fuse them. Next, the fusion feature results are added to
and passed to sigmoid activation function weights, which help to improve the discrimination between the lesion pixels and background pixels. Then, the sigmoid results are multiplied by
. After that, we use another fusion to improve the model performance in lesion segmentation by adding the SAT result to the final decoder network output, which is fed into 1 × 1 convolutional with 64 kernals, to be balanced with SAT output as follows:
where
stands for the final output of the decoder network.
Finally, the output layer of the model takes Z to generate the predicted mask for lesion segmentation.
3.4. Loss Function
To optimize the performance of our method in segmenting retinal lesions, we trained the network with cross-entropy loss, which is the most commonly used loss function in classification problems [
9,
16,
30]. The binary cross-entropy loss
[
31] function is defined as follows:
where
y,
, and
indicate the predicted value, while
y indicates the ground truth label.
returns the average loss across all pixels based on minimizing the pixel-wise error.
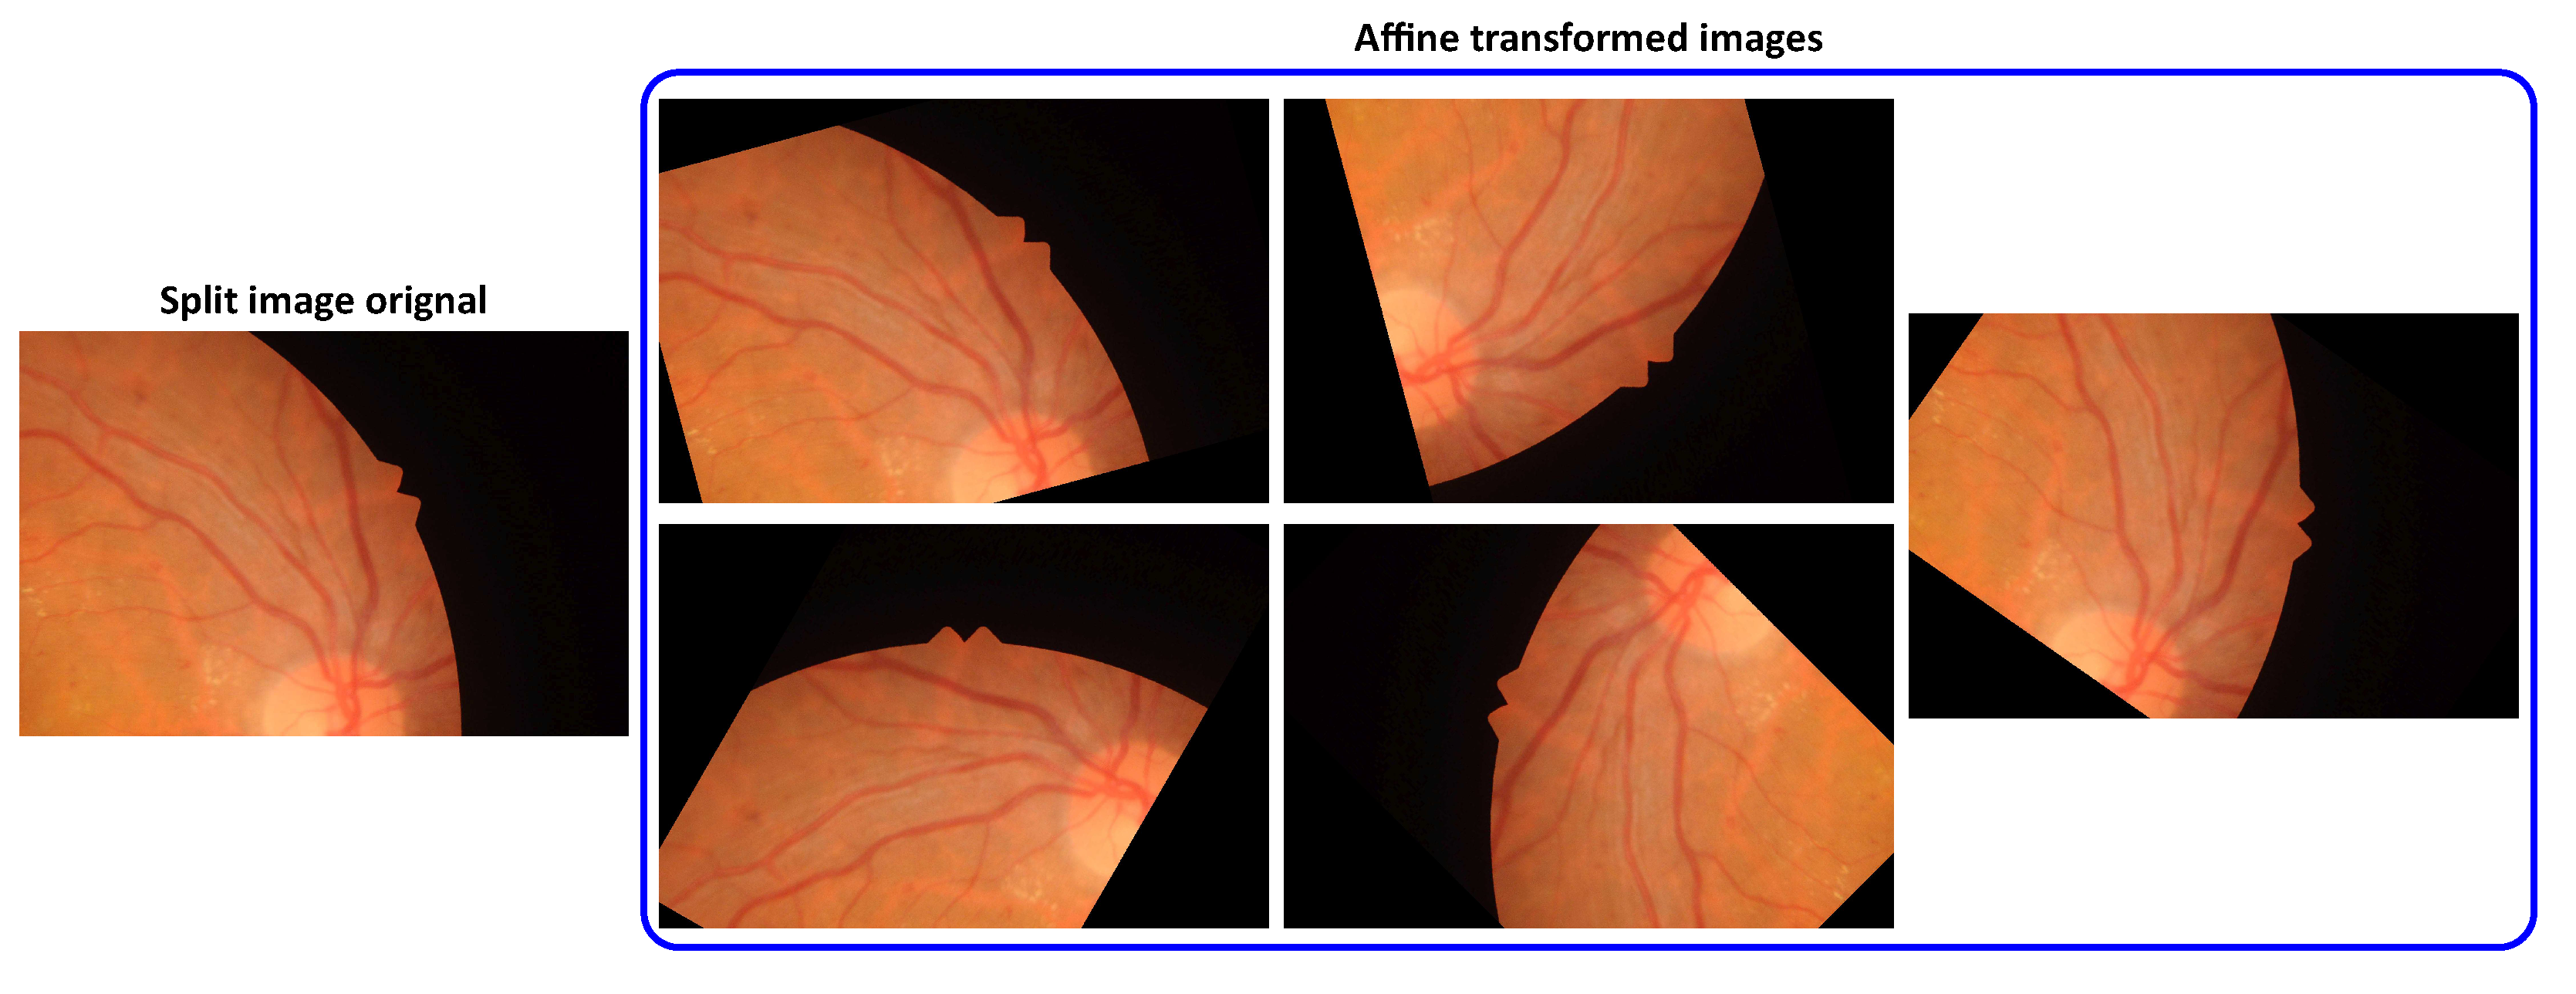
3.5. Affine-Based Augmentation
It has been proven that advanced data augmentation techniques, such as affine-based methods and generative adversarial network (GAN)-based augmentation, can play a key role in enhancing the generalization of models, while mitigating overfitting challenges, especially in tasks like small object segmentation, such as of retinal eye lesions. Unlike conventional augmentation approaches, these methods not only expand the scale of small datasets but also create synthetic samples with diverse variations by mimicking the actual deformations occurring in the human eye [
32,
33,
34]. Therefore, for correcting geometric distortions or deformations that occur with non-ideal camera angles, we use an affine-based transformation technique (also known as affinity) [
35]. There are many types of affinity, such as rotation, translation, and shear.
In this study, we apply rotational affine transformation to the training data of fundus images and their labels with many angles, to increase the robustness and accuracy of the deep learning model [
36,
37]. This transformation may give better results than other traditional augmentation methods, such as flipping, brightness, and simple rotation, due to a greater flexibility and capability to perform a broader range of geometric modifications and corrections, specifically in cases of small and irregular objects, such as retinal lesions.
Figure 5 shows some affine transformations applied to fundus images.
An affine transformation can be expressed as follows:
where
indicates the angle of rotation,
and
are the new points of
x and
y after rotation,
stands for scaled
x axis, and
stands for scaled
y axis.
4. Experimental Results and Discussion
In this section, we describe the experiments conducted to evaluate the performance of the proposed model, including a description of the datasets, experimental setup, and evaluation metrics, as well as an analysis of the results.
4.1. Dataset, Preprocessing, and Experimental Setup
To demonstrate the efficacy of LezioSeg, we employed three public and well-known datasets, namely the Indian Diabetic Retinopathy Image Dataset (IDRiD) [
38], E-ophtha [
39], and DDR [
40].
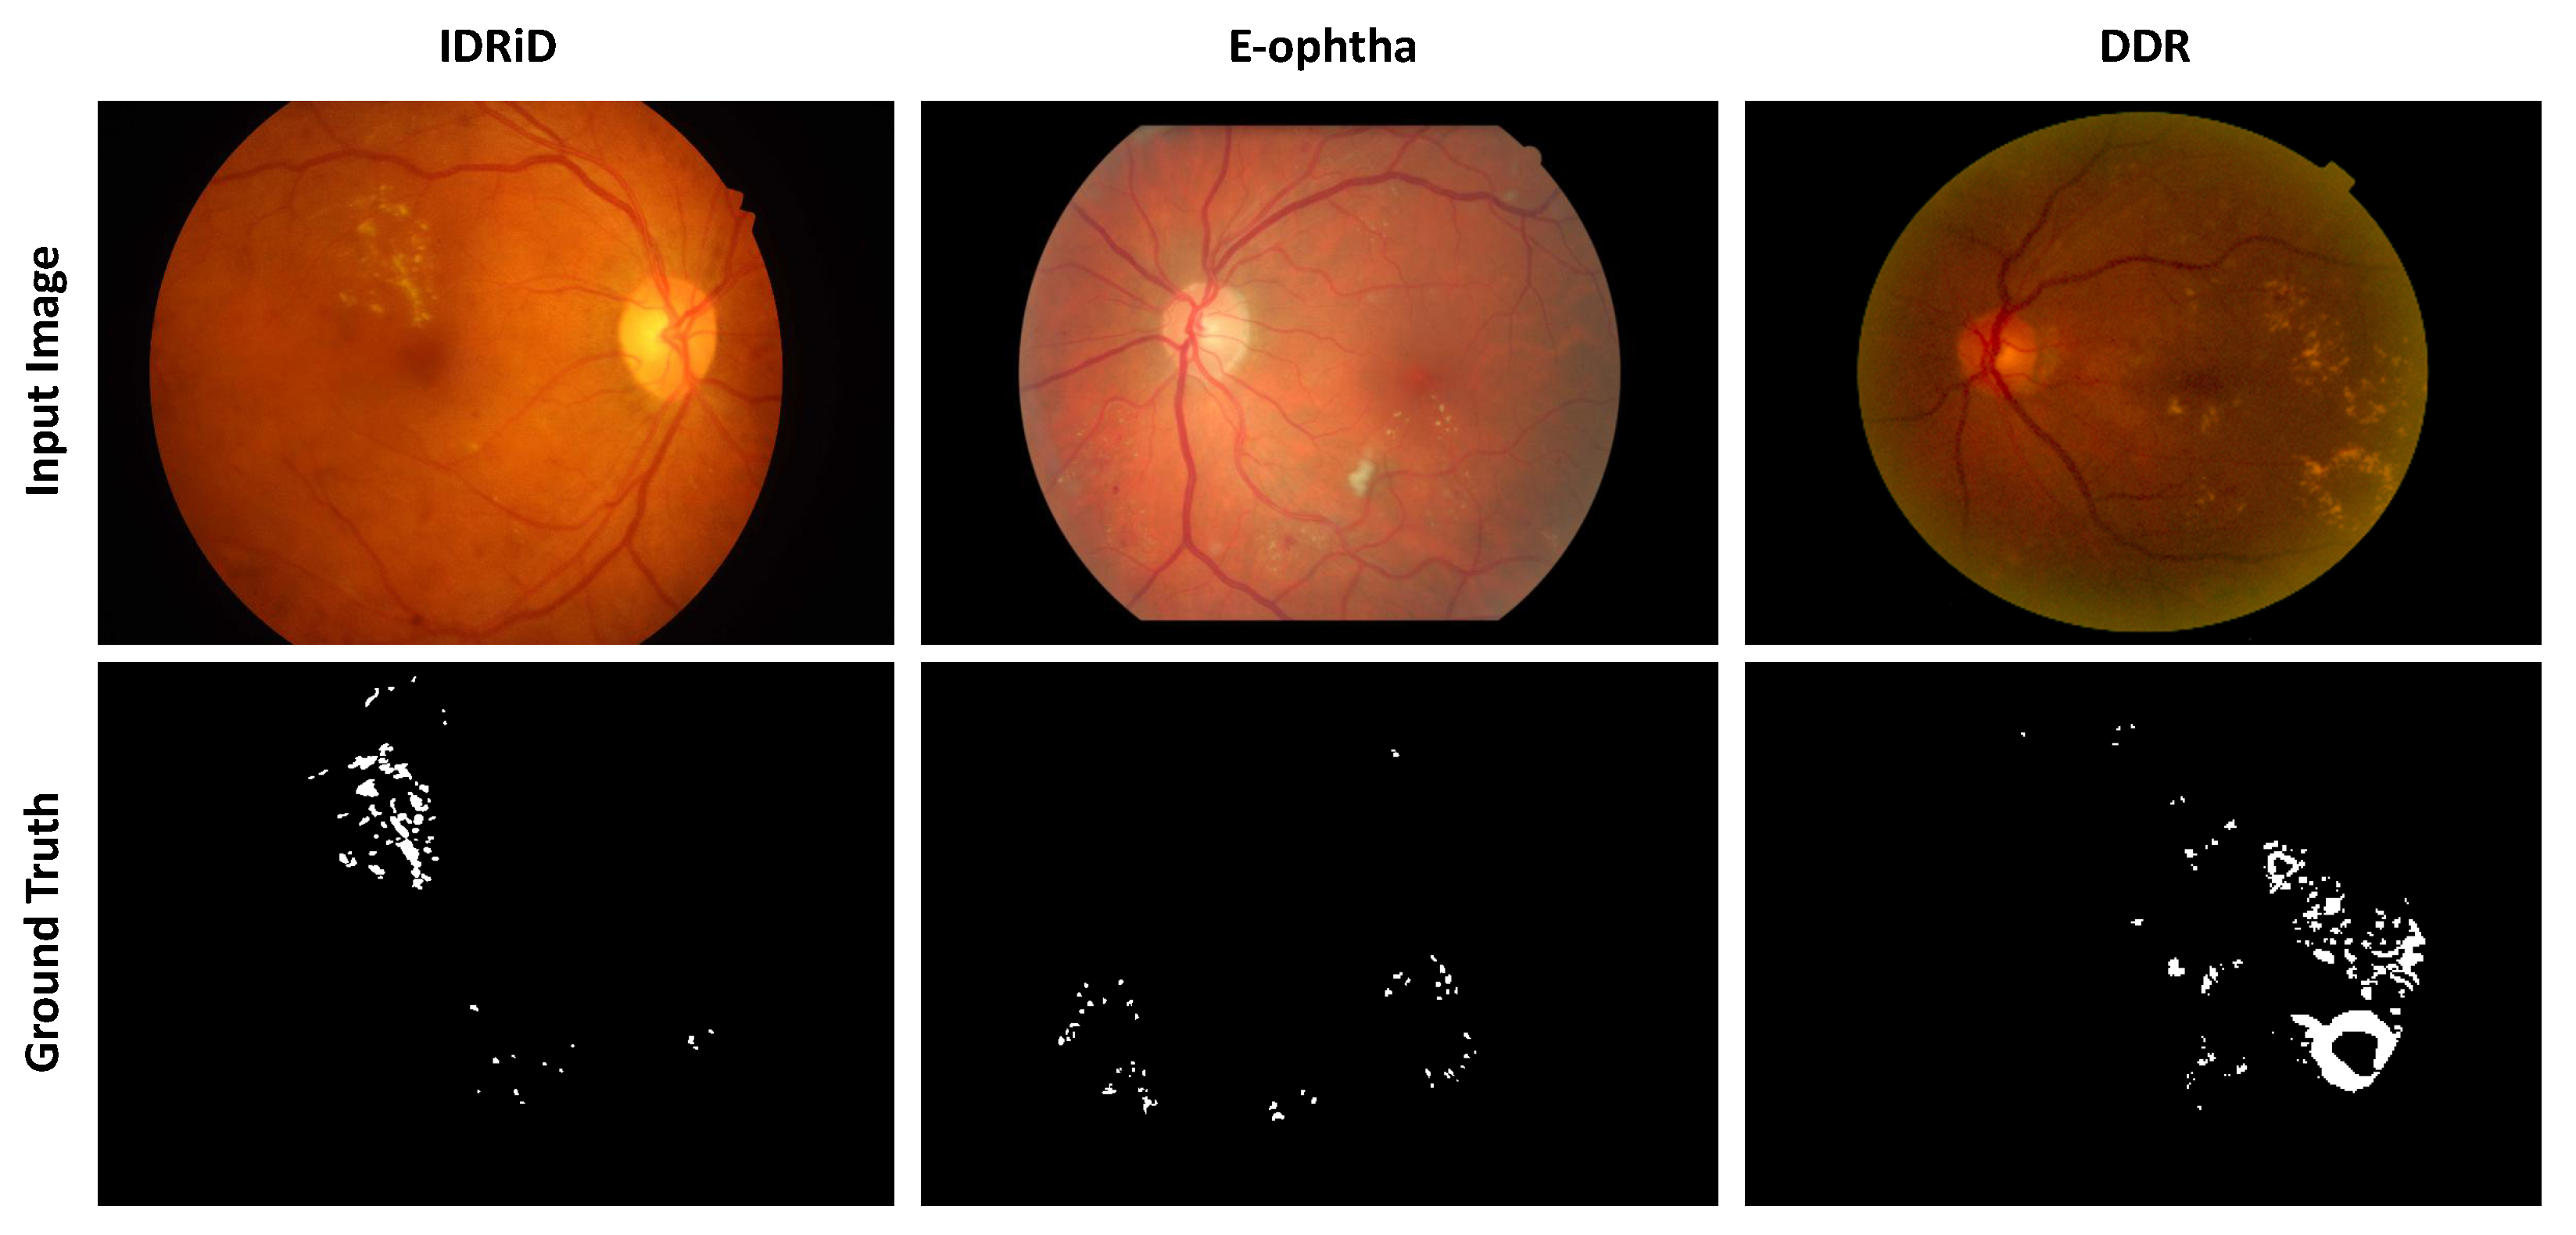
Table 1 shows general information, and
Figure 6 shows an example of an image from each of these datasets, with the corresponding ground truth for exudates, EX.
The IDRiD dataset includes 81 high-resolution retinal fundus images sized . This dataset has images with at least one labeled mask for each of the four types of DR lesion: EX, SE, MA, and HE. The dataset was split into 2/3 for training (distributed as 54, 54, 54, and 26 for EX, HE, MA, and SE, respectively) and 1/3 for testing (distributed as 26, 27, 27, and 14 for EX, HE, MA, and SE).
The E-ophtha dataset contains 47 images with masks for exudate lesions and 148 images with microaneurysms. We randomly divided the dataset into two parts: 80% of images for training and 20% for testing. From the DDR dataset, we only used the test set to examine the model generalization.
To increase the amount of data and improve the regularity of the model, we employed the following training pipeline (including some data augmentation techniques) to process the images in the training set.
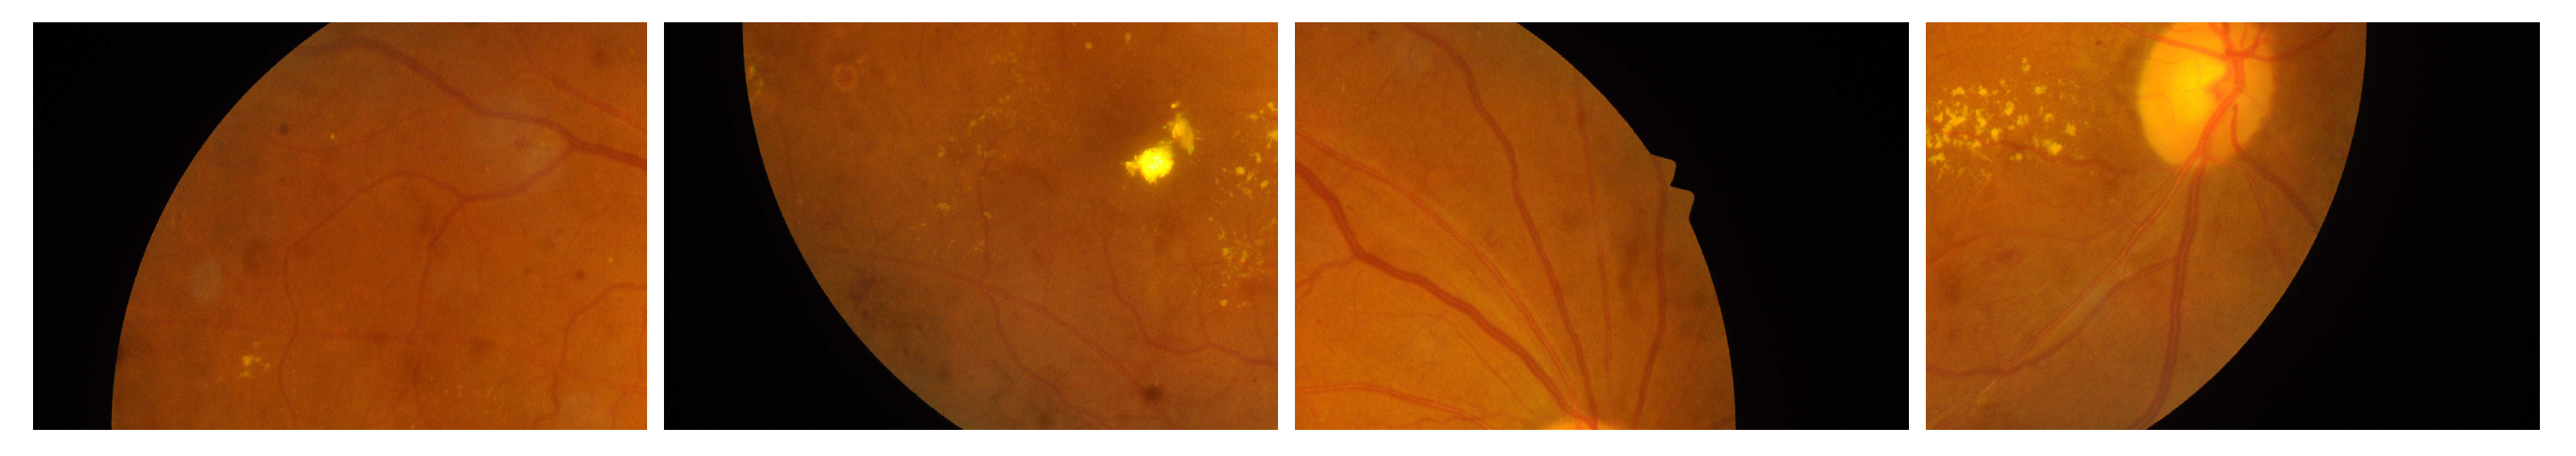
First, as shown in
Figure 7, each image was divided into four non-overlapping sub-images with corresponding sub-masks. Negative sub-images (i.e., sub-images with only a background mask) were discarded. To reduce the GPU memory limitation, we resized the sub-images and sub-masks to
. We applied cubic interpolation to the images, whereas for the masks, we used the nearest neighbor. Then, to enhance the generalization of the LezioSeg model, we applied standard augmentation techniques, such as horizontal, flipping, and simple rotation. Additionally, we utilized affine augmentation methods with different angles, such as 15°, 60°, 135°, −35°, and −75°, because of its ability to perform a broader range of geometric modifications and corrections for the 12 repetitions of each dataset used.
Each model was trained on a single RTX 3080 Ti GPU (Nvidia Corporation, Santa Clara, CA, USA) with 12 GB RAM for 50 epochs, with an Adam optimizer, batch size of 4, and learning rate of 0.001, while binary cross-entropy was used as a loss function. To save the best checkpoint for the trained models, we sampled a subset (20%) of the training set as a validation set. During the inference phase, we only resized the input image to 768 × 512 and utilized an entire image segmentation process (i.e., no image splitting or image augmentation was used in the testing phase).
4.2. Evaluation Metrics
In this study, we used the following evaluation metrics to assess the performance of our segmentation model [
41,
42]:
The term TP refers to the true positive (the pixels were labeled as foreground, i.e., retinal lesion pixels, and correctly classified); FP stands for false positive (the pixels were labeled as background and misclassified as foreground); TN is true negative, referring to healthy pixels correctly classified by the network; and FN is a false negative representing lesion pixels misclassified as healthy pixels.
4.3. Ablation Study
In this section, we assess the performance of the proposed architecture with an ablation study, using the testing images of the IDRiD and E-ophtha datasets. We separately conducted five experiments for each retinal lesion with the different architectures: Baseline (indicates the Unet model with MobileNet backbone encoder), Baseline + GSCs, Baseline + SAT, Baseline + GSCs + SAT (i.e., LezioSeg method), and the LezioSeg + Affine methods.
Table 2 and
Table 3 present the performance of the EX, SE, HE, and MA retinal lesion segmentation models on the IDRiD dataset. Similarly, we conducted the same five experiments on the E-ophtha dataset for the EX and MA retinal lesions (see
Table 4).
4.3.1. Experiments on the IDRiD Dataset
As we can see from
Table 2 and
Table 3, the LezioSeg model achieved the best results for all metrics of the EX, SE, HE, and MA retinal lesions on the IDRiD dataset; specifically with the AUPR metric, a popular metric used for the IDRiD dataset challenge. Merging the GSC and SAT techniques generally increased the results’ robustness; since the GSCs help filter the results produced from the encoder block and SAT helps filter the results produced by the decoder blocks. Moreover, a significant improvement in the segmentation results was achieved when we added affine to the LezioSeg, obtaining AUPR values of 86.03, 81.05, 40.04, and 69.11% for EX, SE, HE, and MA, respectively.
The mean ± standard deviations of the evaluation metrics for the test dataset of the IDRiD dataset are reported in
Table 2 and
Table 3, and the results of our LezioSeg and LezioSeg + Affine models were within the range of the means ± one standard deviation. These effects revealed that LezioSeg, with or without Affine, presented a more precise and robust segmentation.
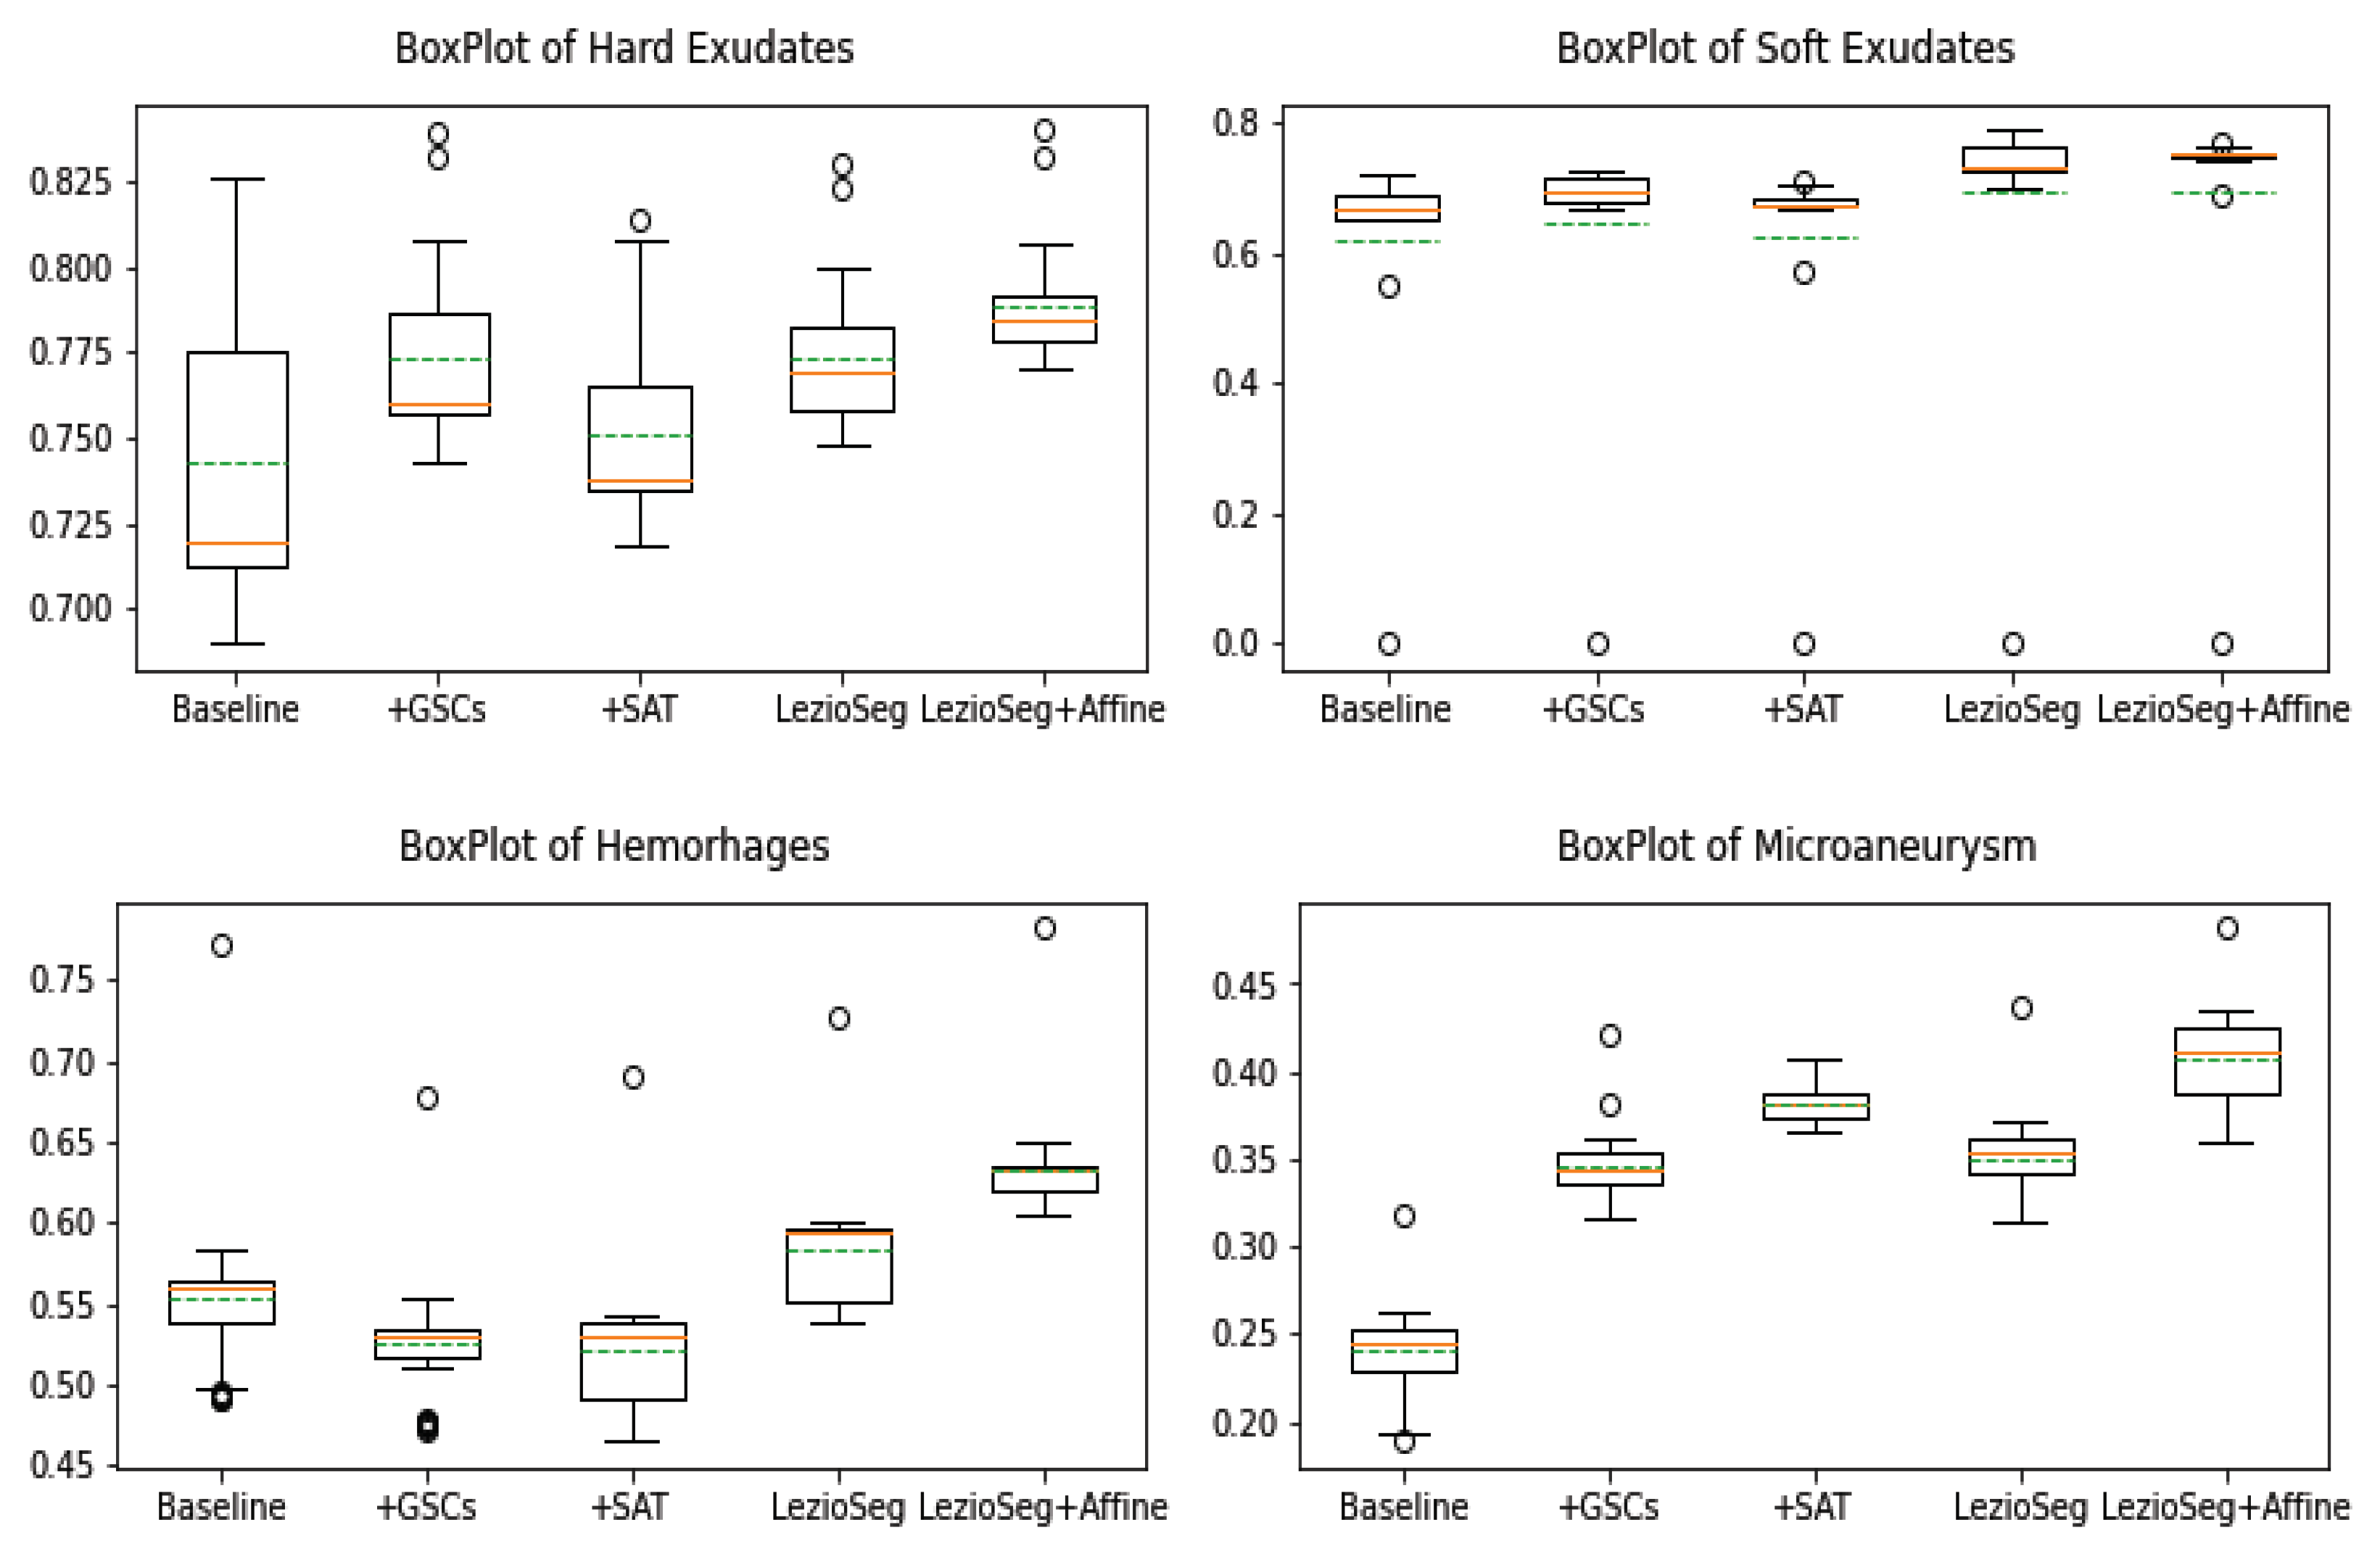
Figure 8 shows the boxplots of the F1 metric of the Baseline, +GSCs, +SAT, LezioSeg, and LezioSeg + Affine models on the IDRiD dataset for SE, EX, HE, and MA retinal lesions. From the figure, among the tested models, we can see that the LezioSeg + Affine model had the highest mean and median for all lesions. In addition, it had the smallest standard deviation of EX and HE, and the outliers were in the top whisker, which were positive outliers for EX, HE, and MA. Using the boxplots, we can see that the LezioSeg + Affine provided the best performance for all lesions, while achieving the best mean and median values.
Moreover, it is helpful to refer to the statistical significance of the differences in performance between the proposed LezioSeg + Affine and the Baseline model in terms of the F1 and IOU for each lesion. To accomplish this, we used Student’s
t-test (significance level < 0.05) to reveal the distinction between F1 values. At the same time, we used this to specify the distinction between IOU values. The
p-values for F1 and IOU terms were less than 0.05, indicating statistical significance for EX, HE, and MA, and higher than 0.05 for SE with the IDRiD dataset.
Table 5 displays the average increase in percentage
as each component was added to the Baseline model for the AUPR metric. As we can see, merging the GSCs and SAT into the Baseline model notably enhanced the results. In addition, adding affine to them resulted in a huge performance improvement.
4.3.2. Experiments on the E-Ophtha Dataset
We conducted the same five experiments used on the IDRiD dataset on the E-ophtha dataset for EX and MA (the only lesions given in the E-ophtha dataset), to show the impact of introducing LezioSeg and LezioSeg + Affine. As shown in
Table 4, the LezioSeg model achieved the best segmentation results for MA for all metrics, with IOU = 63.37%, F1 = 42.21%, and AUPR = 36.30%. At the same time, it achieved the highest values for EX segmentation, with an IOU and F1 of 70.62 and 58.57%. On the other hand, LezioSeg + Affine significantly enhanced the results of all metrics for MA and EX. For MA segmentation, it obtained an IOU, F1, and AUPR of 64.12, 44.06, and 60.8%, respectively, and it obtained an IOU, F1, and AUPR of 71.74, 60.8, and 63.04%, respectively, for EX segmentation.
The results of the LezioSeg and LezioSeg + Affine models for the mean ± standard deviation of the evaluation metrics for the test dataset for the E-ophtha dataset were within the range of the mean ± one standard deviation, as shown in
Table 4. These results show that the LezioSeg and LezioSeg + Affine data augmentation could provide a more precise and robust segmentation. In
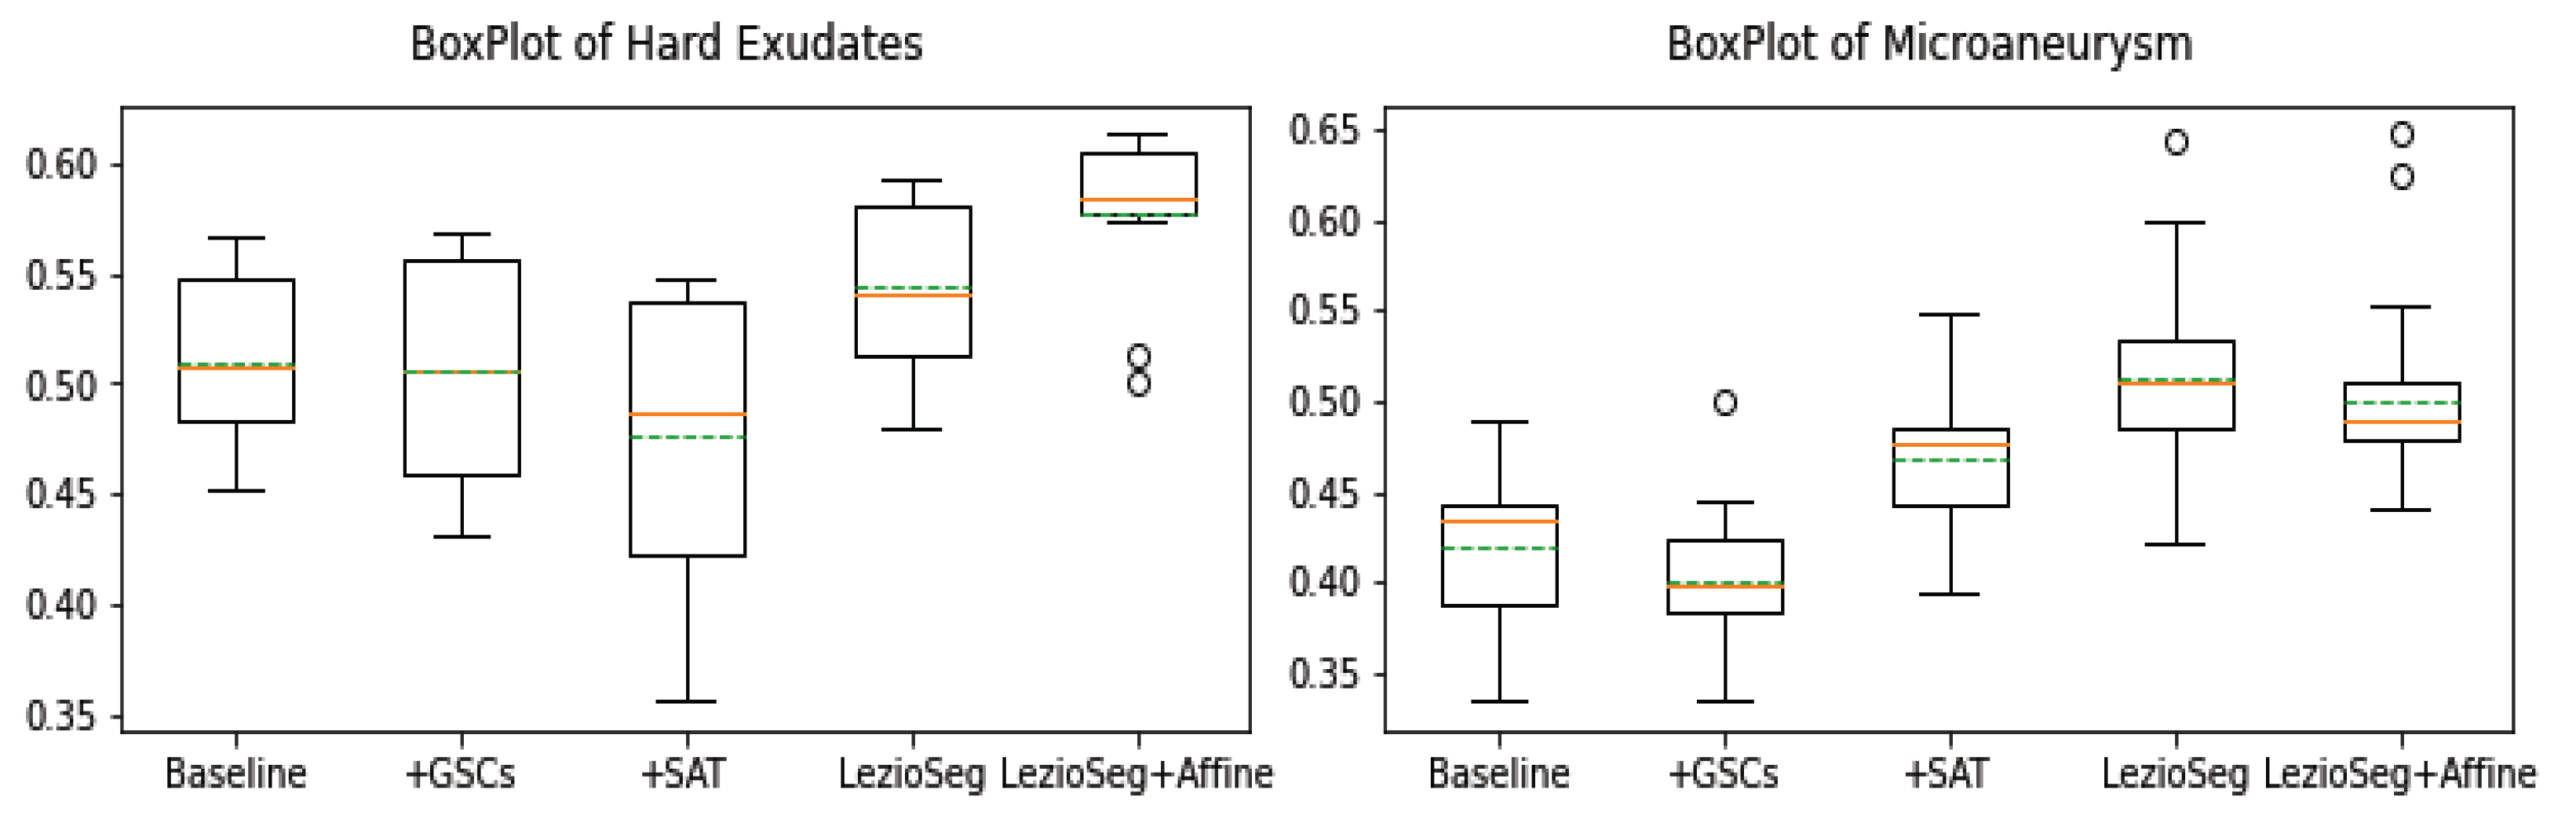
Figure 9, we show the boxplots for the F1 metric on the E-ophtha dataset for EX and MA retinal lesions for the Baseline, +GSCs, +SAT, LezioSeg, and LezioSeg + Affine models. From the figure, among the tested models, we can see that Ex had the highest mean and median, and smallest standard deviation when using the LezioSeg + Affine model. The LezioSeg + Affine model also gave the smallest standard deviation and the second-best mean and median. In comparison, the LezioSeg + Affine outliers were on the positive side (top whisker) of MA and higher than the bottom whisker of all related models in the case of EX.
Using the boxplots, we can see that the proposed method, LezioSeg + Affine, achieved the best performance for EX, while achieving the second-best performance for MA, considering the F1 evaluation metric.
Finally, the Student’s t-test for statistical differences in performance between the LezioSeg method and the Baseline model for the terms F1 and IOU clearly showed that p-values less than 0.05 indicated statistical significance for EX and MA with the E-ophtha dataset.
4.3.3. Visualization
To show the influence of the LezioSeg and LezioSeg + Affine segmentation models compared to the Baseline model, we show realistic segmentation cases from the IDRiD and E-ophtha datasets.
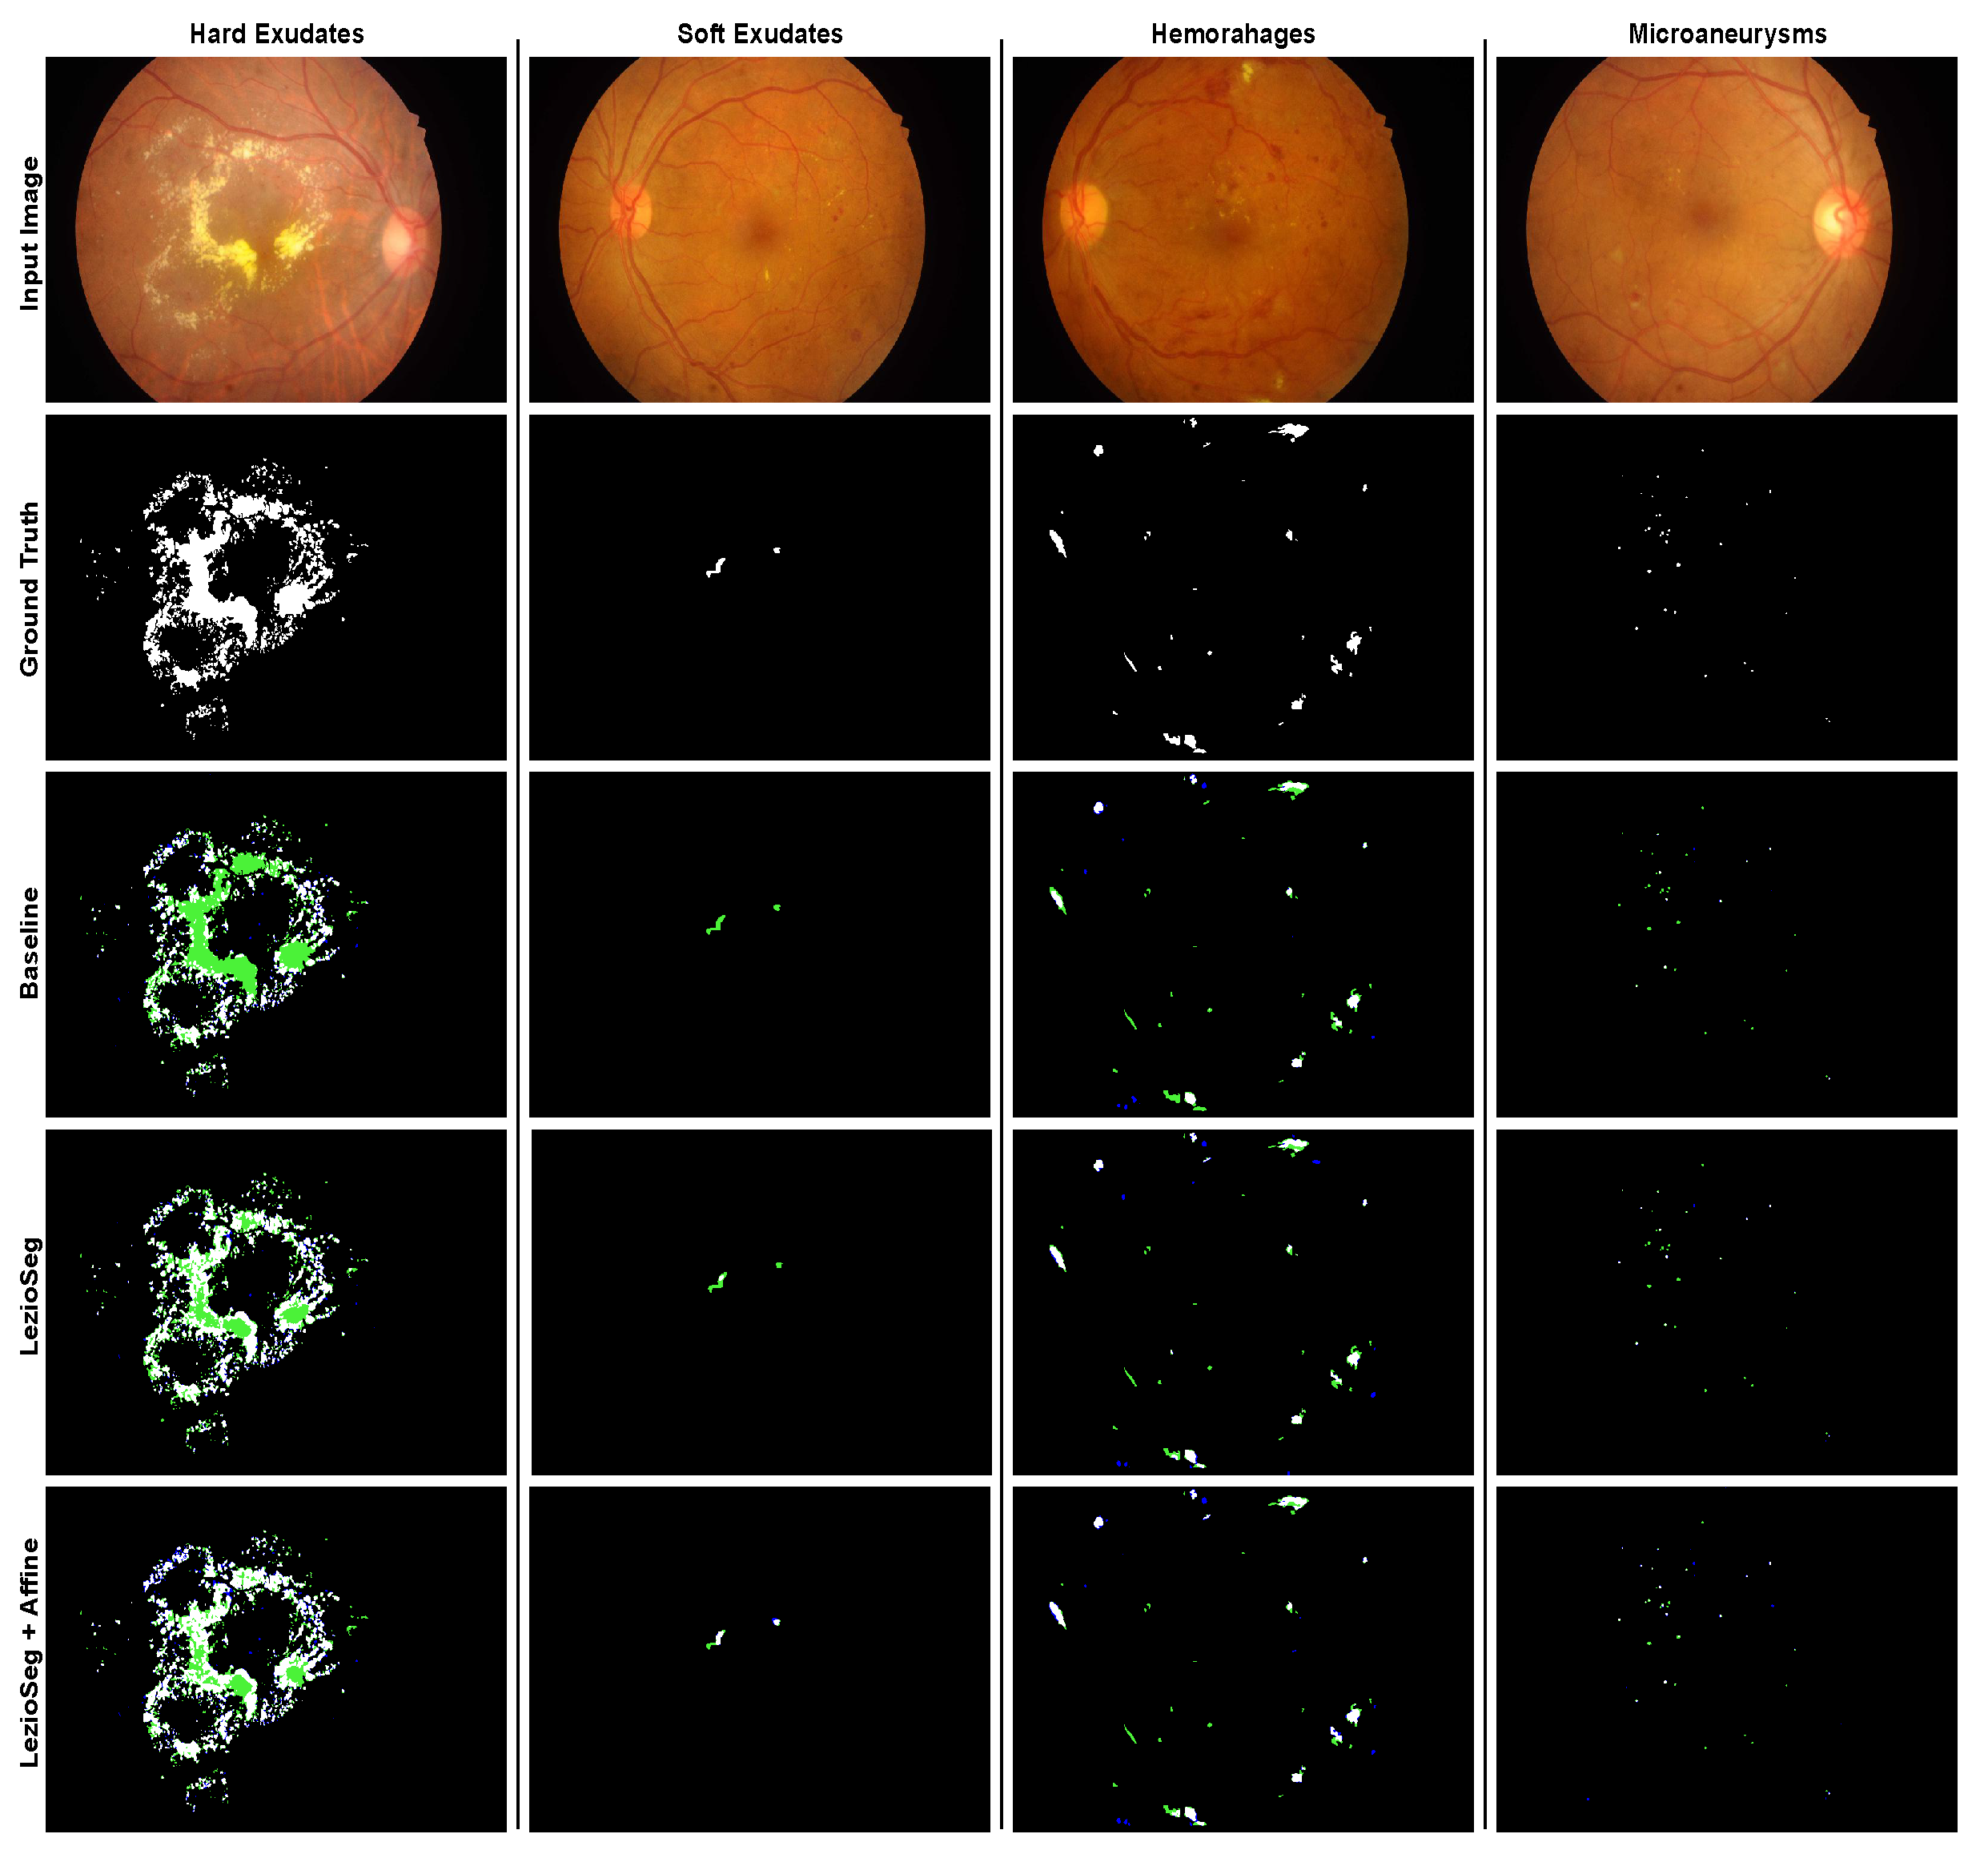
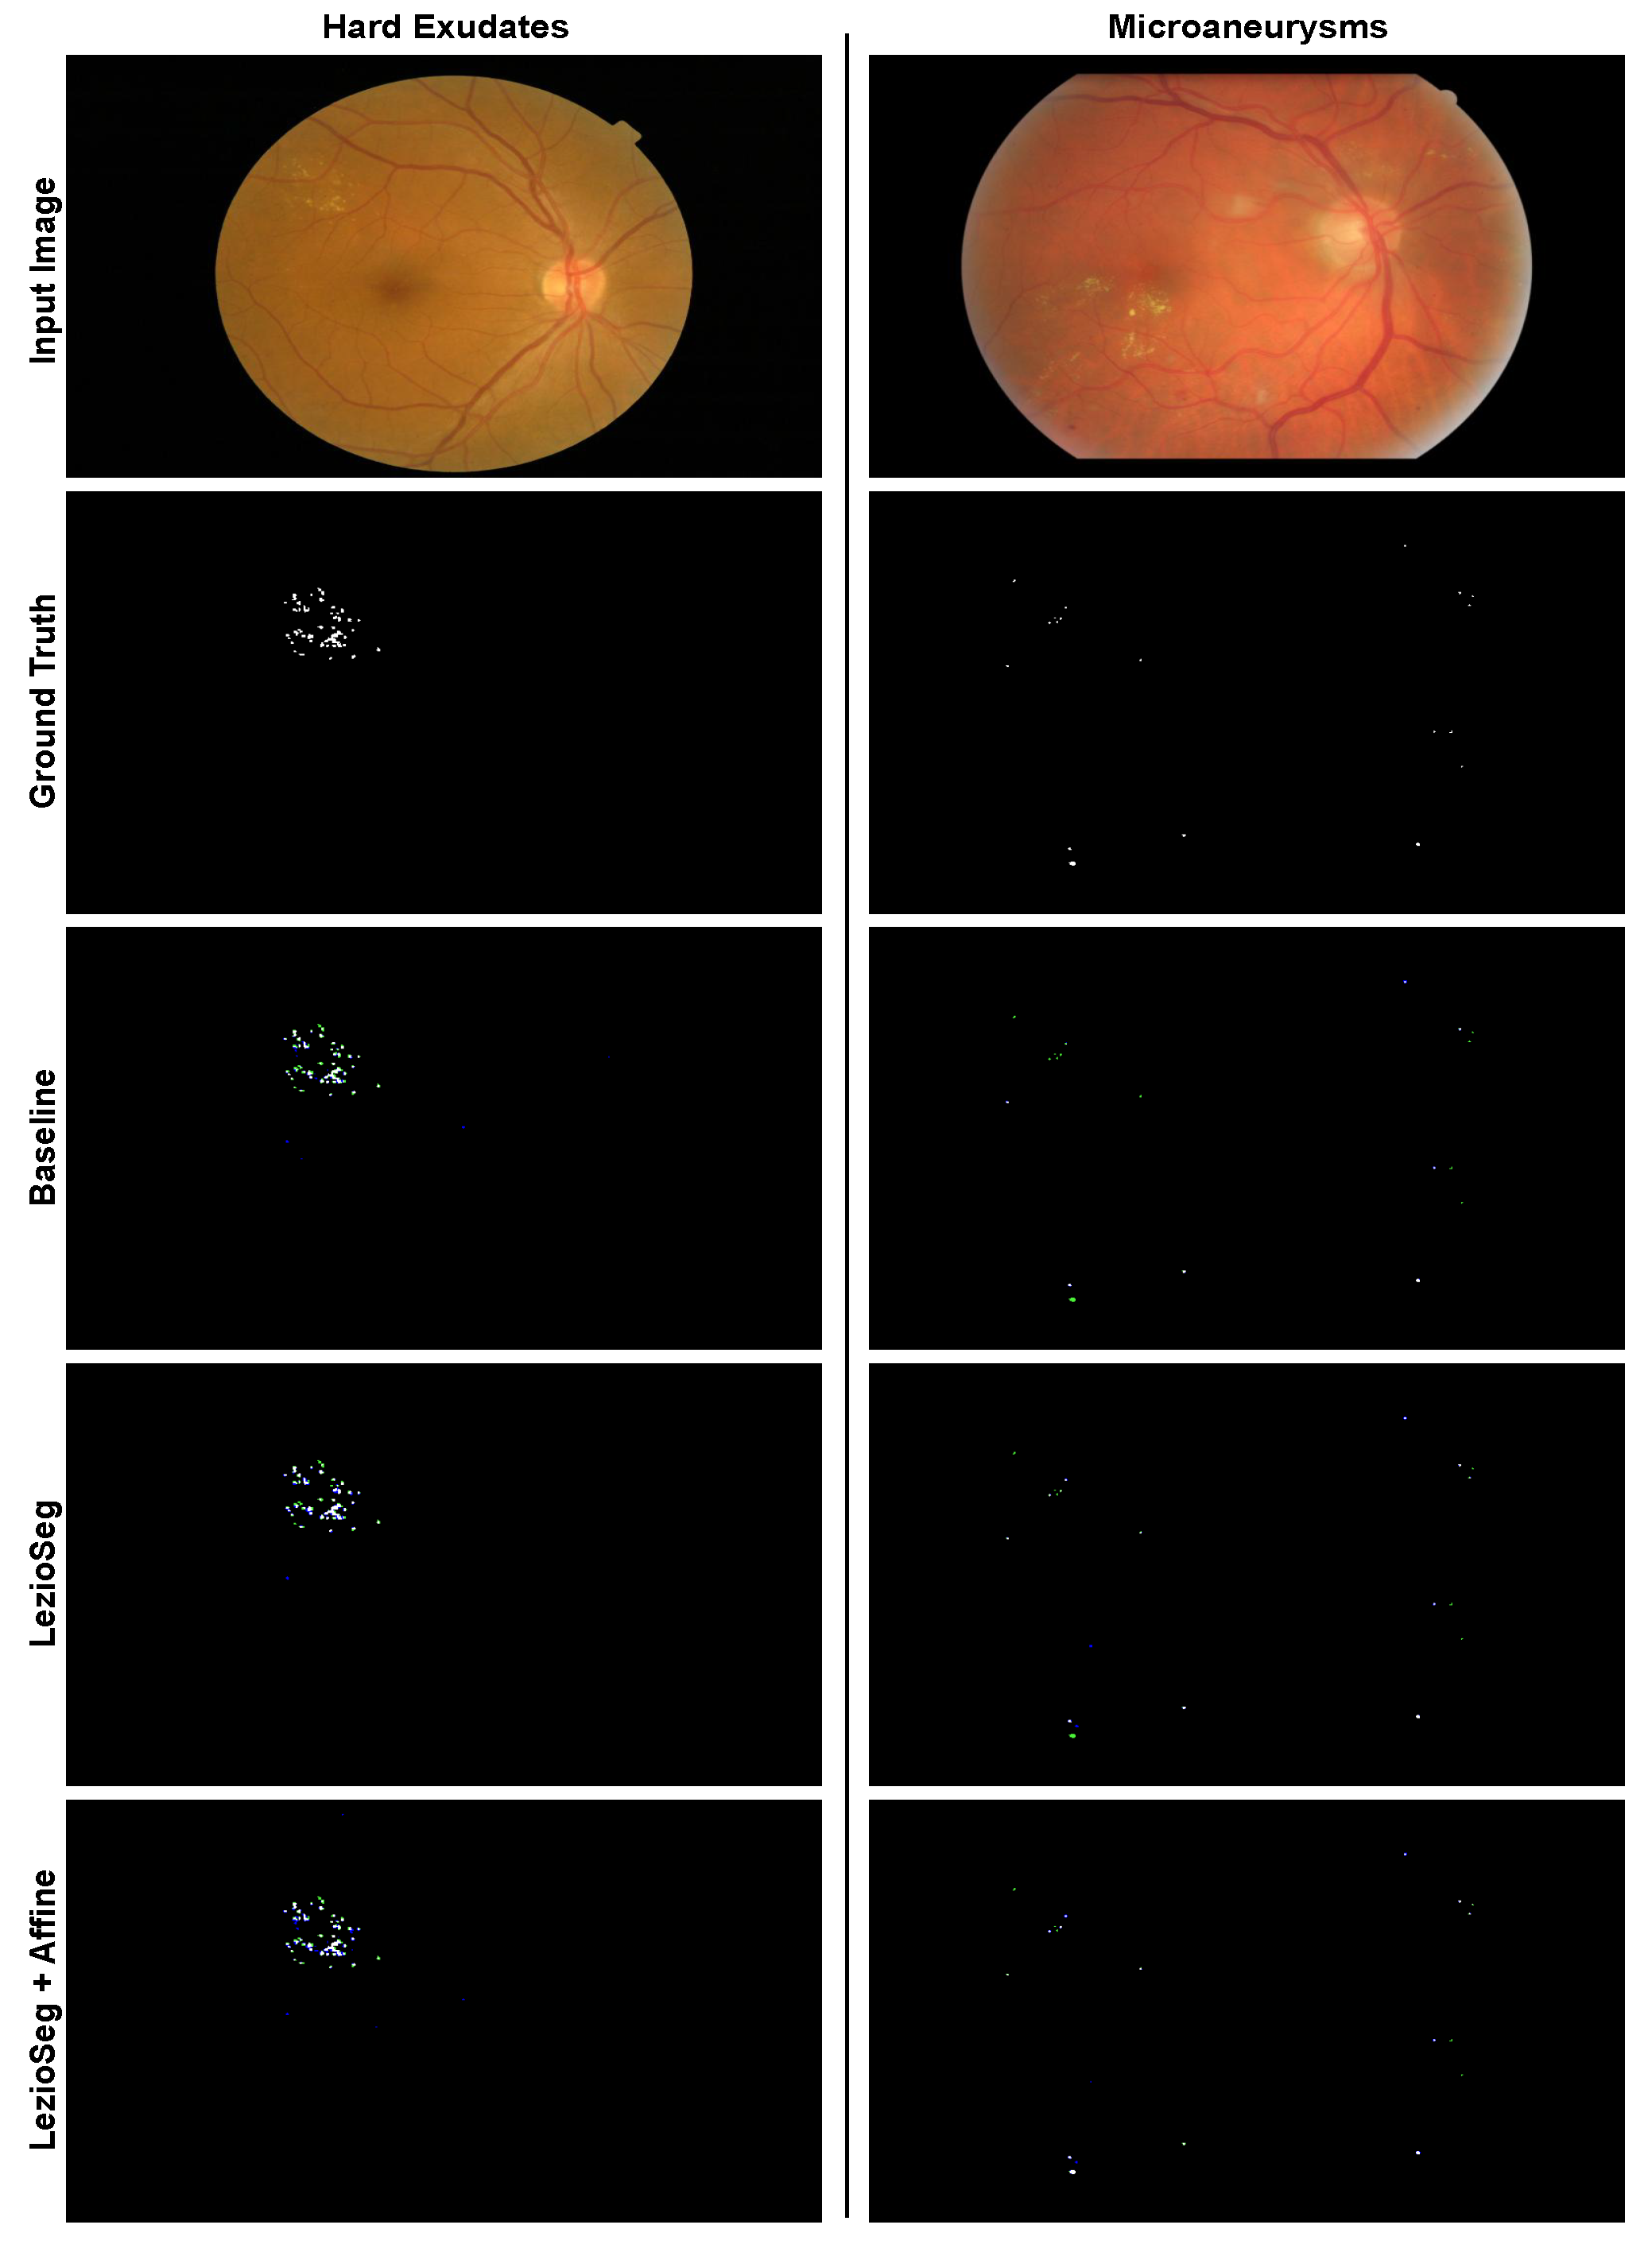
Figure 10 shows samples from the IDRiD dataset for EX, SE, HE, and MA segmentation. In addition,
Figure 11 shows samples from the E-ophtha dataset, to demonstrate the segmentation efficacy of EX and MA. The blue color illustrates the false positives, whereas the green color indicates the false negatives. From the cases shown, LezioSeg + Affine worked well on small and large lesions.
4.4. Comparison with Existing Lesion Segmentation Methods
To ensure the proposed method’s efficacy, we compared LezioSeg + Affine and some state-of-the-art methods using the AUPR metric of the IDRiD and E-ophtha datasets. The comparison of IDRiD included the top-3 IDRiD challenge teams [
43], L-Seg [
12], CASENet [
14], DeepLabV3+ [
13], HEDNet + cGAN [
10], CARNet [
17], EAD-Net [
3], PMCNet [
44], and PBDA [
33].
Table 6 shows that the LezioSeg + Affine model achieved a significant improvement in performance in segmenting retinal lesions. It achieved the best AUPR of SE (81.05%) and the second best for HE (69.11%). In addition, LezioSeg + Affine obtained a high average value for the mean of area under precision-recall (mAUPR) over all lesions, with a value of 69.06%, only surpassed by PBDA.
Furthermore, for the E-ophtha dataset, the comparison included CASENet [
14], L-Seg [
12], PMCNet [
44], DeepLabV3+ [
13], and PBDA [
33].
Table 7 shows that LezioSeg + Affine surpassed most of the previous works by a considerable margin. We can also observe that it was slightly better than PBDA for the two types of lesion available in this dataset.
From the results on these two datasets, we can see that LezioSeg + Affine performed fairly comparably to PBDA for the IDRiD dataset and was superior to it for the E-ophtha dataset, by 0.92, 1.82, and 1.26% for EX, MA segmentation, and mAUPR, respectively.
4.5. Evaluating the Generalization Capability of LezioSeg + Affine
It was also meaningful to study the generalization capability of the methods over various domains and imaging conditions. We used our models pretrained on the IDRiD dataset to verify their effectiveness and generalization ability with the low-resolution test data of the DDR fundus image dataset. The comparison included DeepLabV3+ [
13], CASENet [
14], L-Seg [
12], and PMCNet [
44]. LezioSeg + Affine obtained a performance for EX, SE, HE, and MA with the AUPR metric of 56.12, 28.62, 22.21, and 33.81%, and an mAUPR of 35.19%, as shown in
Table 8. Furthermore, LezioSeg + Affine outperformed all state-of-the-art approaches for segmenting MA and EX without training, which was much better than the PMCNet and L-Seg models, by 2.27 and 0.66% for MA and EX, respectively, and it also achieved the second-best result for SE and mAUPR.
4.6. Computational Complexity
To confirm the efficacy of our network, we examined different models on the IDRiD dataset, in terms of parameters, flop, test time, and mAUPR. In comparison, we achieved the second-best average value for the AUPR metric. However, our model achieved the best computing parameter with 10.7M and the best test time of 0.17 s, which were significantly lower than the models using dual networks and a cascade architecture, such as CARNet [
17] and PBDA [
33], and those models based on ResNet or VGGNet encoders, such as L-Seg [
12], and CARNet. Furthermore, our model obtained the best value compared to the reported models’ flop values, with 177.8 G. As shown in
Table 9.
5. Conclusions
The automatic segmentation of the retinal lesions in fundus images (SE, EX, HE, and MA of the human eye) was performed in this paper using a new deep-learning architecture. The new model, called LezioSeg, comprises four main elements: two multi-scale modules, an ASPP at the neck of the network and a SAT unit after the decoder of the network, a MobileNet backbone encoder, and a modified UNet decoder block using several GSCs. It is worth highlighting that, in terms of parameters, LezioSeg is much lighter than those models that depend on ResNets or VGGNets backbones and those models that use dual networks or a cascading architecture.
The extension of the proposed model with affine transformations improved the segmentation performance of retinal eye lesions for the IDRiD and E-ophtha datasets. Extensive experiments showed that LezioSeg + Affine had a competitive performance with the other state-of-the-art models, achieving the top performance for segmenting SE and second-best for HE of over 81.0 and 69.11% for AUPR and the second-best mAUPR of 69.06% with the IDRiD dataset. Moreover, with the E-ophtha dataset, LezioSeg showed a high performance of 63.04 and 37.50% for segmenting EX and MA for AUPR and achieved the best mAUPR of 50.27%. LezioSeg showed a competitive performance when it was generalized on the DDR dataset, which had images taken in different conditions and in a different population.
LezioSeg + Affine proved that it is a reliable and robust method for lesion segmentation of fundus images, which may prove an excellent help for ophthalmologists in detecting diabetic retinopathy. One of its main features is that it can be applied to real-world color fundus images taken with different camera settings, which is often a handicap of other techniques. This new architecture may also be applied to other medical images where the identification of small objects is needed.
In future work, we plan to use the presented lesion segmentation model to create an integrated application for retinal eye illnesses such as DR, glaucoma, and age-related macular degeneration.
Author Contributions
Conceptualization, M.Y.S.A., M.A.-N., M.B. and A.V.; data curation: M.Y.S.A. and M.B.; formal analysis: M.Y.S.A., M.A.-N. and A.V.; methodology: M.Y.S.A., M.A.-N. and M.J.; project administration: A.V.; software: M.Y.S.A. and M.J.; supervision: A.V., M.A.-N. and M.B.; validation: M.Y.S.A., M.A.-N. and M.J.; visualization: M.Y.S.A. and M.J.; writing—original draft preparation: M.Y.S.A. and M.A.-N.; writing—review and editing: A.V. and M.J.; funding acquisition: A.V. All authors have read and agreed to the published version of the manuscript.
Funding
This work was funded by the research projects PI21/00064 from Instituto de Salud Carlos III & FEDER funds. The University Rovira i Virgili also supported this work with the projects 2023PFR-URV-114 and 2022PFR-URV-41.
Data Availability Statement
All data used in this article are available in public databases, including eye fundus images and their masks. IDRiD is available at [
38], E-ophtha is available at [
39], and DDR is available at [
40]. We did not generate any other datasets in this work.
Conflicts of Interest
The authors declare no conflict of interest. The funders had no role in the design of the study; in the collection, analyses, or interpretation of data; in the writing of the manuscript, or in the decision to publish the results.
References
- Mary, V.S.; Rajsingh, E.B.; Naik, G.R. Retinal fundus image analysis for diagnosis of glaucoma: A comprehensive survey. IEEE Access 2016, 4, 4327–4354. [Google Scholar] [CrossRef]
- American Diabetes Association. 11. Microvascular complications and foot care: Standards of medical care in diabetes—2020. Diabetes Care 2020, 43, S135–S151. [Google Scholar] [CrossRef] [PubMed]
- Wan, C.; Chen, Y.; Li, H.; Zheng, B.; Chen, N.; Yang, W.; Wang, C.; Li, Y. EAD-net: A novel lesion segmentation method in diabetic retinopathy using neural networks. Dis. Markers 2021, 2021, 6482665. [Google Scholar] [CrossRef] [PubMed]
- Escorcia-Gutierrez, J.; Cuello, J.; Barraza, C.; Gamarra, M.; Romero-Aroca, P.; Caicedo, E.; Valls, A.; Puig, D. Analysis of Pre-trained Convolutional Neural Network Models in Diabetic Retinopathy Detection Through Retinal Fundus Images. In Proceedings of the International Conference on Computer Information Systems and Industrial Management, Barranquilla, Colombia, 15–17 July 2022; Springer: Cham, Switzerland, 2022; pp. 202–213. [Google Scholar]
- Ali, M.Y.S.; Abdel-Nasser, M.; Valls, A.; Baget, M.; Jabreel, M. EDBNet: Efficient Dual-Decoder Boosted Network for Eye Retinal Exudates Segmentation. Artif. Intell. Res. Dev. 2022, 356, 308–317. [Google Scholar]
- De La Torre, J.; Valls, A.; Puig, D. A deep learning interpretable classifier for diabetic retinopathy disease grading. Neurocomputing 2020, 396, 465–476. [Google Scholar] [CrossRef]
- Jani, K.; Srivastava, R.; Srivastava, S.; Anand, A. Computer aided medical image analysis for capsule endoscopy using conventional machine learning and deep learning. In Proceedings of the 2019 7th International Conference on Smart Computing & Communications (ICSCC), Sarawak, Malaysia, 28–30 June 2019; pp. 1–5. [Google Scholar]
- Ali, M.Y.S.; Abdel-Nasser, M.; Jabreel, M.; Valls, A.; Baget, M. Exu-Eye: Retinal Exudates Segmentation based on Multi-Scale Modules and Gated Skip Connection. In Proceedings of the 2022 5th International Conference on Multimedia, Signal Processing and Communication Technologies (IMPACT), Aligarh, India, 26–27 November 2022; pp. 1–5. [Google Scholar]
- Ali, M.Y.S.; Abdel-Nasser, M.; Jabreel, M.; Valls, A.; Baget, M. Segmenting the Optic Disc Using a Deep Learning Ensemble Model Based on OWA Operators. Artif. Intell. Res. Dev. 2021, 339, 305–314. [Google Scholar]
- Xiao, Q.; Zou, J.; Yang, M.; Gaudio, A.; Kitani, K.; Smailagic, A.; Costa, P.; Xu, M. Improving lesion segmentation for diabetic retinopathy using adversarial learning. In Proceedings of the International Conference on Image Analysis and Recognition, Waterloo, ON, Canada, 27–29 August 2019; Springer: Cham, Switzerland, 2019; pp. 333–344. [Google Scholar]
- Yan, Z.; Han, X.; Wang, C.; Qiu, Y.; Xiong, Z.; Cui, S. Learning mutually local-global u-nets for high-resolution retinal lesion segmentation in fundus images. In Proceedings of the 2019 IEEE 16th International Symposium on Biomedical Imaging (ISBI 2019), Venice, Italy, 8–11 April 2019; pp. 597–600. [Google Scholar]
- Guo, S.; Li, T.; Kang, H.; Li, N.; Zhang, Y.; Wang, K. L-Seg: An end-to-end unified framework for multi-lesion segmentation of fundus images. Neurocomputing 2019, 349, 52–63. [Google Scholar] [CrossRef]
- Chen, L.C.; Zhu, Y.; Papandreou, G.; Schroff, F.; Adam, H. Encoder-decoder with atrous separable convolution for semantic image segmentation. In Proceedings of the European Conference on Computer Vision (ECCV), Munich, Germany, 8–14 September 2018; pp. 801–818. [Google Scholar]
- Yu, Z.; Feng, C.; Liu, M.Y.; Ramalingam, S. Casenet: Deep category-aware semantic edge detection. In Proceedings of the IEEE Conference on Computer Vision and Pattern Recognition, Honolulu, HI, USA, 21–26 July 2017; pp. 5964–5973. [Google Scholar]
- Elizar, E.; Zulkifley, M.A.; Muharar, R.; Zaman, M.H.M.; Mustaza, S.M. A Review on Multiscale-Deep-Learning Applications. Sensors 2022, 22, 7384. [Google Scholar] [CrossRef]
- Ronneberger, O.; Fischer, P.; Brox, T. U-net: Convolutional networks for biomedical image segmentation. In Proceedings of the International Conference on Medical Image Computing and Computer-Assisted Intervention, Munich, Germany, 5–9 October 2015; Springer: Cham, Switzerland, 2015; pp. 234–241. [Google Scholar]
- Guo, Y.; Peng, Y. CARNet: Cascade attentive RefineNet for multi-lesion segmentation of diabetic retinopathy images. Complex Intell. Syst. 2022, 8, 1681–1701. [Google Scholar] [CrossRef]
- He, K.; Zhang, X.; Ren, S.; Sun, J. Deep residual learning for image recognition. In Proceedings of the IEEE Conference on Computer Vision and Pattern Recognition, Las Vegas, NV, USA, 27–30 June 2016; pp. 770–778. [Google Scholar]
- Bo, W.; Li, T.; Liu, X.; Wang, K. SAA: Scale-Aware Attention Block for Multi-Lesion Segmentation of Fundus Images. In Proceedings of the 2022 IEEE 19th International Symposium on Biomedical Imaging (ISBI), Kolkata, India, 28–31 March 2022; pp. 1–5. [Google Scholar]
- Simonyan, K.; Zisserman, A. Very deep convolutional networks for large-scale image recognition. arXiv 2014, arXiv:1409.1556. [Google Scholar]
- Al-Antary, M.T.; Arafa, Y. Multi-scale attention network for diabetic retinopathy classification. IEEE Access 2021, 9, 54190–54200. [Google Scholar] [CrossRef]
- Zhao, R.; Li, Q.; Wu, J.; You, J. A nested U-shape network with multi-scale upsample attention for robust retinal vascular segmentation. Pattern Recognit. 2021, 120, 107998. [Google Scholar] [CrossRef]
- Gade, A.; Dash, D.K.; Kumari, T.M.; Ghosh, S.K.; Tripathy, R.K.; Pachori, R.B. Multiscale Analysis Domain Interpretable Deep Neural Network for Detection of Breast Cancer using Thermogram Images. IEEE Trans. Instrum. Meas. 2023, 72, 4011213. [Google Scholar] [CrossRef]
- Fang, X.; Yan, P. Multi-organ segmentation over partially labeled datasets with multi-scale feature abstraction. IEEE Trans. Med. Imaging 2020, 39, 3619–3629. [Google Scholar] [CrossRef] [PubMed]
- Jabreel, M.; Abdel-Nasser, M. Promising crack segmentation method based on gated skip connection. Electron. Lett. 2020, 56, 493–495. [Google Scholar] [CrossRef]
- Howard, A.G.; Zhu, M.; Chen, B.; Kalenichenko, D.; Wang, W.; Weyand, T.; Andreetto, M.; Adam, H. Mobilenets: Efficient convolutional neural networks for mobile vision applications. arXiv 2017, arXiv:1704.04861. [Google Scholar]
- Widiansyah, M.; Rasyid, S.; Wisnu, P.; Wibowo, A. Image segmentation of skin cancer using MobileNet as an encoder and linknet as a decoder. J. Phys. Conf. Ser. 2021, 1943, 012113. [Google Scholar] [CrossRef]
- Mohamed, N.A.; Zulkifley, M.A.; Abdani, S.R. Spatial pyramid pooling with atrous convolutional for mobilenet. In Proceedings of the 2020 IEEE Student Conference on Research and Development (SCOReD), Batu Pahat, Malaysia, 27–29 September 2020; pp. 333–336. [Google Scholar]
- Chen, L.C.; Papandreou, G.; Kokkinos, I.; Murphy, K.; Yuille, A.L. Deeplab: Semantic image segmentation with deep convolutional nets, atrous convolution, and fully connected crfs. IEEE Trans. Pattern Anal. Mach. Intell. 2017, 40, 834–848. [Google Scholar] [CrossRef]
- Liu, L.; Cheng, J.; Quan, Q.; Wu, F.X.; Wang, Y.P.; Wang, J. A survey on U-shaped networks in medical image segmentations. Neurocomputing 2020, 409, 244–258. [Google Scholar] [CrossRef]
- Yeung, M.; Sala, E.; Schönlieb, C.B.; Rundo, L. Unified Focal loss: Generalising Dice and cross entropy-based losses to handle class imbalanced medical image segmentation. Comput. Med. Imaging Graph. 2022, 95, 102026. [Google Scholar] [CrossRef]
- Zhu, W.; Qiu, P.; Lepore, N.; Dumitrascu, O.M.; Wang, Y. Self-supervised equivariant regularization reconciles multiple-instance learning: Joint referable diabetic retinopathy classification and lesion segmentation. In Proceedings of the 18th International Symposium on Medical Information Processing and Analysis, Valparaíso, Chile, 9–11 November 2022; SPIE: Bellingham, WA, USA, 2023; Volume 12567, pp. 100–107. [Google Scholar]
- Wang, H.; Zhou, Y.; Zhang, J.; Lei, J.; Sun, D.; Xu, F.; Xu, X. Anomaly segmentation in retinal images with poisson-blending data augmentation. Med. Image Anal. 2022, 81, 102534. [Google Scholar] [CrossRef] [PubMed]
- You, A.; Kim, J.K.; Ryu, I.H.; Yoo, T.K. Application of generative adversarial networks (GAN) for ophthalmology image domains: A survey. Eye Vis. 2022, 9, 6. [Google Scholar] [CrossRef] [PubMed]
- Weisstein, E.W. Affine Transformation. 2004. Available online: https://mathworld.wolfram.com/ (accessed on 15 November 2023).
- Han, Y.; Zhang, S.; Geng, Z.; Wei, Q.; Ouyang, Z. Level set based shape prior and deep learning for image segmentation. IET Image Process. 2020, 14, 183–191. [Google Scholar] [CrossRef]
- Chaitanya, K.; Karani, N.; Baumgartner, C.F.; Erdil, E.; Becker, A.; Donati, O.; Konukoglu, E. Semi-supervised task-driven data augmentation for medical image segmentation. Med. Image Anal. 2021, 68, 101934. [Google Scholar] [CrossRef]
- Porwal, P.; Pachade, S.; Kamble, R.; Kokare, M.; Deshmukh, G.; Sahasrabuddhe, V.; Meriaudeau, F. Indian diabetic retinopathy image dataset (IDRiD): A database for diabetic retinopathy screening research. Data 2018, 3, 25. [Google Scholar] [CrossRef]
- Decenciere, E.; Cazuguel, G.; Zhang, X.; Thibault, G.; Klein, J.C.; Meyer, F.; Marcotegui, B.; Quellec, G.; Lamard, M.; Danno, R.; et al. TeleOphta: Machine learning and image processing methods for teleophthalmology. IRBM 2013, 34, 196–203. [Google Scholar] [CrossRef]
- Li, T.; Gao, Y.; Wang, K.; Guo, S.; Liu, H.; Kang, H. Diagnostic assessment of deep learning algorithms for diabetic retinopathy screening. Inf. Sci. 2019, 501, 511–522. [Google Scholar] [CrossRef]
- Boyd, K.; Eng, K.H.; Page, C.D. Area under the precision-recall curve: Point estimates and confidence intervals. In Proceedings of the Joint European Conference on Machine Learning and Knowledge Discovery in Databases, Prague, Czech Republic, 23–27 September 2013; Springer: Berlin/Heidelberg, Germany, 2013; pp. 451–466. [Google Scholar]
- Taha, A.A.; Hanbury, A. Metrics for evaluating 3D medical image segmentation: Analysis, selection, and tool. BMC Med. Imaging 2015, 15, 29. [Google Scholar] [CrossRef]
- Porwal, P.; Pachade, S.; Kokare, M.; Deshmukh, G.; Son, J.; Bae, W.; Liu, L.; Wang, J.; Liu, X.; Gao, L.; et al. Idrid: Diabetic retinopathy—Segmentation and grading challenge. Med. Image Anal. 2020, 59, 101561. [Google Scholar] [CrossRef]
- He, A.; Wang, K.; Li, T.; Bo, W.; Kang, H.; Fu, H. Progressive Multi-scale Consistent Network for Multi-class Fundus Lesion Segmentation. IEEE Trans. Med. Imaging 2022, 41, 3146–3157. [Google Scholar] [CrossRef]
Figure 1.
An example of a fundus image showing EX, MA, HE, and SE retinal lesions.
Figure 1.
An example of a fundus image showing EX, MA, HE, and SE retinal lesions.
Figure 2.
Architecture of the network for lesion segmentation in fundus images.
Figure 2.
Architecture of the network for lesion segmentation in fundus images.
Figure 3.
The architecture of the GSC mechanism.
Figure 3.
The architecture of the GSC mechanism.
Figure 4.
Structure of the SAT block.
Figure 4.
Structure of the SAT block.
Figure 5.
Sample of split fundus image before affine transformation (left), and after (right).
Figure 5.
Sample of split fundus image before affine transformation (left), and after (right).
Figure 6.
Samples of images and the ground truth from the three datasets.
Figure 6.
Samples of images and the ground truth from the three datasets.
Figure 7.
Samples of a split image.
Figure 7.
Samples of a split image.
Figure 8.
Box plots of F1 for EX, SE, HE, and MA segmentation results for the IDRiD dataset (green dashed lines indicate the mean, and the oranges indicate the median). Outliers are values that fell outside the whiskers, denoted by the (∘) symbol.
Figure 8.
Box plots of F1 for EX, SE, HE, and MA segmentation results for the IDRiD dataset (green dashed lines indicate the mean, and the oranges indicate the median). Outliers are values that fell outside the whiskers, denoted by the (∘) symbol.
Figure 9.
Box plots of F1 for EX, SE, HE, and MA segmentation results on the E-ophtha dataset (green dashed lines indicate the mean and the oranges indicate the median). Outliers are values that fall outside the whiskers, denoted by the (∘) symbol.
Figure 9.
Box plots of F1 for EX, SE, HE, and MA segmentation results on the E-ophtha dataset (green dashed lines indicate the mean and the oranges indicate the median). Outliers are values that fall outside the whiskers, denoted by the (∘) symbol.
Figure 10.
Sample of the segmentation results of SE, EX, HE, and MA on the IDRiD dataset (blue and green indicate FP and FN).
Figure 10.
Sample of the segmentation results of SE, EX, HE, and MA on the IDRiD dataset (blue and green indicate FP and FN).
Figure 11.
Sample of the segmentation results for EX and MA on the E-ophtha dataset (blue and green indicate FP and FN).
Figure 11.
Sample of the segmentation results for EX and MA on the E-ophtha dataset (blue and green indicate FP and FN).
Table 1.
Number of images in the experimental datasets for each lesion.
Table 1.
Number of images in the experimental datasets for each lesion.
| Dataset | EX | HE | MA | SE | Total | Country |
|---|
| IDRiD | 80 | 81 | 81 | 40 | 81 | India |
| E-ophtha | 47 | - | 148 | - | 195 | France |
| DDR | 171 | 194 | 124 | 42 | 225 | China |
Table 2.
IDRiD dataset experimental results for the EX and SE. Value ± (standard deviation). Bold highlighting values denote the highest results.
Table 2.
IDRiD dataset experimental results for the EX and SE. Value ± (standard deviation). Bold highlighting values denote the highest results.
| Method | EX | SE |
|---|
| IOU | F1 | AUPR | IOU | F1 | AUPR |
|---|
| Baseline | 78.13 ± 0.025 | 72.44 ± 0.039 | 80.93 ± 0.15 | 74.02 ± 0.07 | 65.13 ± 0.18 | 67.48 ± 0.31 |
| +GSCs | 80.37 ± 0.016 | 75.94 ± 0.024 | 83.85 ± 0.15 | 75.68 ± 0.07 | 68.06 ± 0.18 | 69.97 ± 0.27 |
| +SAT | 78.98 ± 0.015 | 73.77 ± 0.024 | 82.95 ± 0.17 | 75.18 ± 0.07 | 67.17 ± 0.17 | 73.56 ± 0.21 |
| LezioSeg | 80.27 ± 0.013 | 75.77 ± 0.020 | 84.54 ± 0.17 | 78.52 ± 0.08 | 72.78 ± 0.19 | 77.64 ± 0.24 |
| LezioSeg + Affine | 81.62 ± 0.011 | 77.81 ± 0.016 | 86.03 ± 0.18 | 80.10 ± 0.08 | 75.28 ± 0.19 | 81.05 ± 0.24 |
Table 3.
IDRiD dataset experimental results for MA and HE. Value ± (standard deviation). Bold highlighting values denote the highest results.
Table 3.
IDRiD dataset experimental results for MA and HE. Value ± (standard deviation). Bold highlighting values denote the highest results.
| Method | MA | HE |
|---|
| IOU | F1 | AUPR | IOU | F1 | AUPR |
|---|
| Baseline | 57.03 ± 0.008 | 24.81 ± 0.026 | 32.56 ± 0.12 | 69.15 ± 0.028 | 56.20 ± 0.052 | 62.53 ± 0.21 |
| +GSCs | 60.02 ± 0.007 | 33.96 ± 0.020 | 33.69 ± 0.12 | 67.63 ± 0.019 | 53.01 ± 0.038 | 58.56 ± 0.22 |
| +SAT | 61.41 ± 0.004 | 37.28 ± 0.010 | 35.79 ± 0.10 | 68.03 ± 0.022 | 53.85 ± 0.044 | 60.58 ± 0.22 |
| LezioSeg | 60.57 ± 0.009 | 35.03 ± 0.023 | 37.06 ± 0.11 | 70.82 ± 0.019 | 59.50 ± 0.035 | 65.76 ± 0.19 |
| LezioSeg + Affine | 63.50 ± 0.011 | 42.65 ± 0.026 | 40.04 ± 0.12 | 72.65 ± 0.019 | 63.01 ± 0.031 | 69.11 ± 0.18 |
Table 4.
E-ophtha dataset experimental results for EX and MA. Value ± (standard deviation). Bold highlighting values denote the highest results.
Table 4.
E-ophtha dataset experimental results for EX and MA. Value ± (standard deviation). Bold highlighting values denote the highest results.
| Method | EX | MA |
|---|
| IOU | F1 | AUPR | IOU | F1 | AUPR |
|---|
| Baseline | 69.43 ± 0.018 | 56.13 ± 0.039 | 62.84 ± 0.10 | 60.09 ± 0.015 | 33.6 ± 0.038 | 30.01 ± 0.17 |
| +GSCs | 69.69 ± 0.022 | 56.67 ± 0.050 | 58.25 ± 0.11 | 60.43 ± 0.013 | 34.57 ± 0.033 | 29.6 ± 0.21 |
| +SAT | 68.75 ± 0.027 | 54.72 ± 0.063 | 58.74 ± 0.14 | 62.29 ± 0.015 | 39.49 ± 0.034 | 32.24 ± 0.19 |
| LezioSeg | 70.62 ± 0.018 | 58.57 ± 0.037 | 61.98 ± 0.10 | 63.37 ± 0.020 | 42.21 ± 0.045 | 36.30 ± 0.20 |
| LezioSeg + Affine | 71.74 ± 0.018 | 60.8 ± 0.037 | 63.04 ± 0.10 | 64.12 ± 0.020 | 44.06 ± 0.043 | 37.50 ± 0.19 |
Table 5.
IDRiD dataset ablation studies for the different experiments. This table displays the AUPR, mean AUPR (mAUPR), and average increase percentage over Baseline ↑. Bold highlighting values denote the highest results.
Table 5.
IDRiD dataset ablation studies for the different experiments. This table displays the AUPR, mean AUPR (mAUPR), and average increase percentage over Baseline ↑. Bold highlighting values denote the highest results.
| Method | EX | HE | MA | SE | mAUPR | |
|---|
| Baseline | 80.93 | 62.53 | 32.56 | 67.48 | 60.88 | - |
| +GSCs | 83.85 | 58.56 | 33.69 | 69.97 | 61.52 | ↑ 0.64 |
| +SAT | 82.95 | 60.58 | 35.69 | 73.56 | 63.20 | ↑ 2.32 |
| LezioSeg | 84.54 | 65.76 | 37.06 | 77.64 | 66.30 | ↑ 5.38 |
| LezioSeg + Affine | 86.03 | 69.11 | 40.04 | 81.05 | 69.06 | ↑ 8.18 |
Table 6.
Comparison with existing methods for lesion segmentation on the IDRiD dataset. (-) stands for ‘not reported’. Bold highlighting values denote the highest results.
Table 6.
Comparison with existing methods for lesion segmentation on the IDRiD dataset. (-) stands for ‘not reported’. Bold highlighting values denote the highest results.
| Method | EX | HE | SE | MA | mAUPR |
|---|
| VRT (1st) [43] | 71.27 | 68.04 | 69.95 | 49.51 | 64.69 |
| PATech (2nd) [43] | 88.50 | 64.90 | - | 47.40 | - |
| iFLYTEK-MIG (3rd) [43] | 87.41 | 55.88 | 65.88 | 50.17 | 64.84 |
| L-Seg [12] | 79.45 | 63.74 | 71.13 | 46.27 | 65.15 |
| CASENet [14] | 75.64 | 44.62 | 39.92 | 32.75 | 48.23 |
| DeepLabV3+ [13] | 71.18 | 47.72 | 59.12 | 15.14 | 48.29 |
| HEDNet + cGAN [10] | 84.05 | 48.12 | 48.39 | 43.92 | 56.12 |
| CARNet [17] | 86.75 | 63.89 | 71.25 | 51.48 | 68.34 |
| EAD-Net [3] | 78.18 | 56.49 | 60.83 | 24.08 | 54.90 |
| PMCNet [44] | 87.24 | 67.05 | 71.11 | 46.94 | 68.08 |
| PBDA [33] | 86.43 | 71.53 | 73.07 | 53.41 | 71.11 |
| LezioSeg + Affine | 86.03 | 69.11 | 81.05 | 40.04 | 69.06 |
Table 7.
Comparison with existing methods for lesion segmentation on the E-ophtha dataset. Bold highlighting values denote the highest results.
Table 7.
Comparison with existing methods for lesion segmentation on the E-ophtha dataset. Bold highlighting values denote the highest results.
| Method | EX | MA | mAUPR |
|---|
| CASENet [14] | 17.15 | 15.65 | 16.40 |
| DeepLabV3+ [13] | 55.12 | 0.45 | 27.78 |
| L-Seg [12] | 41.71 | 16.87 | 29.29 |
| PMCNet [44] | 51.20 | 30.60 | 40.90 |
| PBDA [33] | 62.32 | 35.68 | 49.01 |
| LezioSeg + Affine | 63.04 | 37.50 | 50.27 |
Table 8.
Performance comparison of the generalization of the different methods. Bold highlighting values denote the highest results.
Table 8.
Performance comparison of the generalization of the different methods. Bold highlighting values denote the highest results.
| Method | EX | HE | MA | SE | mAUPR |
|---|
| DeepLabV3+ [13] | 53.49 | 38.94 | 2.23 | 21.20 | 28.97 |
| CASENet [14] | 27.77 | 26.25 | 10.05 | 13.04 | 19.28 |
| L-Seg [12] | 55.46 | 35.86 | 10.52 | 26.48 | 32.08 |
| PMCNet [44] | 54.30 | 39.87 | 19.94 | 31.64 | 36.44 |
| LezioSeg + Affine | 56.12 | 33.81 | 22.21 | 28.62 | 35.19 |
Table 9.
Computational complexity of the different lesion segmentation models on the IDRiD dataset. (-) stands for ‘not reported’. Bold highlighting values denote the highest results.
Table 9.
Computational complexity of the different lesion segmentation models on the IDRiD dataset. (-) stands for ‘not reported’. Bold highlighting values denote the highest results.
| Method | Parameters (M) | Flops (G) | Time (S) | mAUPR |
|---|
| L-Seg [12] | ≈14.3 | - | - | 65.15 |
| DeepLabV3+ [13] | ≈41.1 | 621.6 | 0.32 | 48.29 |
| CARNet [17] | ≈22 | - | 0.2 | 68.34 |
| PBDA [33] | ≈24.6 | 1554.11 | 0.26 | 71.11 |
| LezioSeg | ≈10.7 | 177.8 | 0.17 | 69.06 |
| Disclaimer/Publisher’s Note: The statements, opinions and data contained in all publications are solely those of the individual author(s) and contributor(s) and not of MDPI and/or the editor(s). MDPI and/or the editor(s) disclaim responsibility for any injury to people or property resulting from any ideas, methods, instructions or products referred to in the content. |
© 2023 by the authors. Licensee MDPI, Basel, Switzerland. This article is an open access article distributed under the terms and conditions of the Creative Commons Attribution (CC BY) license (https://creativecommons.org/licenses/by/4.0/).

 ,
, 


