Article

IoV Vulnerability Classification Algorithm Based on Knowledge Graph

School of Information Science and Engineering, Linyi University, Linyi 276000, China
*
Author to whom correspondence should be addressed.
Electronics 2023, 12(23), 4749; https://doi.org/10.3390/electronics12234749
Submission received: 19 October 2023 / Revised: 14 November 2023 / Accepted: 19 November 2023 / Published: 23 November 2023

Abstract

:
With the rapid development of smart technologies, the Internet of Vehicles (IoV) is revolutionizing transportation and mobility. However, the complexity and interconnectedness of IoV systems lead to a growing number of security incidents caused by vulnerabilities. Current vulnerability classification algorithms often struggle to address the low occurrence frequency and incomplete information associated with IoV vulnerabilities, resulting in decreased precision and recall rates of classifiers. To address these challenges, an effective vulnerability classification algorithm (KG-KNN), is proposed, designed to handle imbalanced sample data. KG-KNN integrates the vulnerability information of IoV and the association relationship between features by constructing a feature knowledge graph to form a complete knowledge system. It adds the correlation relationship between features to the similarity calculation, calculates vulnerability similarity from multiple dimensions, and improves the prediction performance of the classifier. The experimental results show that compared to the k-NearestNeighbor (KNN), Support Vector Machine (SVM), Deep Nueral Network (DNN) and TFI-DNN classification algorithms, KG-KNN can effectively deal with imbalanced sample data and has different degrees of improvement in precision, recall, and the F1 score.

1. Introduction

With the booming development of the field of IoV [1], the Internet of Vehicles (IoV)—a deep integration of vehicles and information technology—changes transportation and mobility with an unprecedented speed. The IoV system is a comprehensive system that organically integrates the traditional vehicle self-organizing network and the Internet of Things (IoT). Telematics takes mobile vehicles as the carrier of information perception and utilizes next-generation information and communication technologies, such as sensor network technology [2] and radio frequency identification technology [3], to connect vehicles to the Internet. A variety of innovative applications have been realized, including intelligent navigation [4], remote diagnosis, vehicle automation [5], and so on. The rapid development of IoV has not only greatly enhanced the driving experience at the technological level but has also positively impacted society in a number of areas, including enhancing road safety, improving transportation efficiency, and contributing to environmental sustainability. In the future, as technology continues to advance, IoV will continue to drive innovation in mobility, bringing even greater improvements in urban mobility and road safety, as well as providing people with more convenient and sustainable mobility options.
In IoV, with the rapid development of connected vehicles and intelligent transportation systems [6], cybersecurity has become a crucial topic. The complexity and high degree of interconnectivity of connected IoV systems, while enhancing convenience and efficiency, are also accompanied by potential cybersecurity risks. Hackers can utilize potential vulnerabilities to invade IoV systems, thereby threatening road safety, personal privacy, and data security. In recent years, there has been a proliferation of IoV security incidents triggered by vulnerabilities. For example, in March 2022, Mitsui Bussan Secure Directions, a Japanese cybersecurity firm, announced that a group calling itself “Pandora” had threatened to disclose Denso’s trade secrets on the dark web. The group claimed to have stolen more than 157,000 purchase orders, emails, and sketches, totaling 1.4 terabytes of data. Pandora used ransomware to carry out a cyberattack on Denso, which encrypts company data and places companies at risk of data leakage if they do not pay the ransom. Therefore, it has become particularly important to study and solve the problem of IoV vulnerabilities. Network security managers must pay close attention to the vulnerability situation and fix the vulnerabilities in a timely manner in order to safeguard the security of IoV devices and systems.
The uneven distribution of vulnerabilities in the IoV drives a huge challenge for cyber security. IoV integrates information technology and vehicles and involves numerous complex systems and components, from intelligent vehicles to back-end servers, which can be potential targets of vulnerability attacks. The diversity of components and systems leads to the trend of an uneven distribution of vulnerabilities in the IoV; therefore, effective management and application of vulnerability information and keeping up-to-date with the latest vulnerabilities are crucial for securing the cybersecurity of the IoV system [7]. Although the National Vulnerability Database (NVD), Information Security Vulnerability Portal (VULHUB), and Common Vulnerabilities and Exposures (CVE) have been developed in the U.S., it is not easy for them to manage and apply vulnerability information in a timely manner. Moreover, different vulnerability repositories use different categorization methods and naming conventions, resulting in the same vulnerability taking different forms in each repository [8]. This makes it necessary for cybersecurity managers to consume a lot of time and effort to collect, integrate, and filter information from multiple vulnerability repositories. Classification of vulnerabilities in IoV [9] can discover vulnerability information in a timely and effective manner, help cybersecurity managers to quickly recognize vulnerabilities, and also prioritize vulnerabilities so as to target vulnerability remediation and defense strategies to improve the overall security of the IoV system.
Existing vulnerability classification algorithms suffer from a low precision rate, recall rate, and F1 score when dealing with unbalanced sample data. This makes it difficult for them to effectively deal with the large amount of vulnerability information emerging from IoV. Vulnerability classification [10] is essentially a processing method for vulnerability information, which analyzes and categorizes vulnerabilities based on their characteristics, attributes, etc., by choosing appropriate classification algorithms [11]. However, there are multiple types of vulnerabilities in the telematics environment [12,13,14], some of which occur less frequently, resulting in their relatively small sample size and incomplete vulnerability information. With such uneven sample data, existing vulnerability classification algorithms may not be able to adequately extract the vulnerability features from the few classes and instead misclassify the samples into the more numerous feature-rich vulnerability classes. Such misclassification may lead to the neglect of important vulnerabilities, thus bringing potential risks to the cybersecurity of telematics. Only through continuous innovation and improvement can vulnerability classification algorithms better address the challenges posed by the massive number of vulnerabilities in the IoV environment, enhance the ability of cybersecurity management, and safeguard user privacy and data security.
In order to overcome the limitations of vulnerability classification algorithms in the face of imbalanced samples, a new vulnerability classification algorithm, KG-KNN, is proposed, which is based on weighted Euclidean distance and a feature knowledge graph, which improves the classification of imbalanced vulnerability samples. The algorithm employs knowledge graph to assist vulnerability classification, which transforms the correlation relationship between feature words into the shortest path between feature word nodes in the knowledge graph. Considering that a few categories of samples cannot fully extract feature values, the concept of association distance is introduced to improve the traditional Euclidean distance algorithm [15], and a weighted Euclidean distance algorithm is proposed. The algorithm adds the association distance between features to the Euclidean distance calculation and calculates the similarity between loophole features from multiple dimensions. Then, the similarity between features is applied to the K-nearest neighbor (KNN) classification algorithm to classify vulnerability information. To obtain the optimal features, the features describing the text are extracted using the term frequency–inverse document frequency (TF-IDF) algorithm. In addition, to integrate vulnerability information and obtain the correlation distance between features, this paper proposes that multiple information sources can be integrated so a unified knowledge graph of vulnerabilities in IoV can be established, and the vulnerability information and the correlation relationship between feature words can be stored in the knowledge graph to form a more complete knowledge system. Classifying vulnerability information through the above steps can help security managers manage vulnerabilities and effectively respond to various network security threats.
The main contributions of this paper are as follows:
  • We propose a new vulnerability classification algorithm. To improve the classification performance of imbalanced samples, we offer a new vulnerability classification algorithm, KG-KNN, based on weighted Euclidean distance and the feature knowledge graph. This algorithm increases the correlation distance between features in a similarity calculation, achieving a multi-dimensional similarity calculation and overcoming the limitations of imbalanced sample classification.
  • Construct the feature knowledge graph based on the optimal feature word set. This paper integrates vulnerability information from multiple sources, extracts the optimal feature word set, and constructs a feature knowledge graph to solve the problem of dispersed vulnerability information of the IoV and obtain the association distance.
  • We propose a weighted Euclidean distance algorithm. This paper introduces the concept of association distance, improves the traditional Euclidean distance algorithm, and presents a weighted Euclidean distance algorithm to solve the problem that the samples of a few categories cannot fully extract the feature values.
The structure of this article is as follows. Section 2 reviews the related research at home and abroad. Section 3 provides the background knowledge. Section 4 introduces the design strategy of the algorithm. Section 5 describes the process of vulnerability classification and proposes an improved vulnerability classification algorithm. Section 6 outlines the conclusion of this paper.

2. Related Work

Many factors affect the effectiveness of vulnerability classification, among which the main elements are dimensionality reduction processing techniques [16] and classification algorithms [17]. The purpose of dimensionality reduction processing techniques is to convert a high-dimensional vulnerability dataset into a low-dimensional representation while trying to preserve the structure and information of the vulnerability data, that is, how to represent a vulnerability with as few feature words as possible; classification algorithms are the process of automatically classifying unknown vulnerability information based on known vulnerability training datasets.

2.1. Dimensionality Reduction Processing Technique

The preprocessed vulnerability dataset contains massive features, which can increase computational complexity and storage space, thereby reducing the efficiency of the classification model. Therefore, to improve the classification efficiency, the dimensionality reduction processing of the dataset is a hotspot researched by many experts and scholars. Researchers focus on two commonly used dimensionality reduction methods: feature selection and feature extraction.
Feature selection [18] refers to selecting the most relevant features from the original data and removing those not helpful for the model’s performance to reduce dimensionality. In 1997, Yang et al. [19] proposed a feature selection algorithm based on document frequency, in which the authors remove features which have a lower frequency than a certain threshold to reduce feature set dimension. The algorithm is simple and easy to use but is invalid in dealing with complex nonlinear data. Zhang et al. [20] proposed a multi-label feature selection algorithm based on information entropy in 2013, which filters important features and removes irrelevant features using a threshold value by calculating the information gain between the parts and the set of labels to improve the prediction performance of multi-label classification models. However, this algorithm ignores the effect of the relationships between elements on labels and performs poorly in situations where feature correlation is high.
Feature extraction [16] uses synthetic transformations to construct new feature terms from the original feature set, thus forming a feature subset. Lewis et al. [21] first proposed mutual nearest neighbor clustering in 1992, which clusters feature words by calculating the similarity between words, thus achieving the purpose of feature extraction. In 2020, Rahman et al. [22] proposed a method that uses mixed principal component analysis and t-statistics to extract features of EEG emotional signals and applies these extracted features to classifiers such as SVM, LDA, and KNN for classification. The experimental results show that this method achieves excellent classification performance. However, there are thousands of statistical features in the time, frequency, and time-frequency domains, yet this method only considers commonly used features. Alqahtani et al. [23] designed an IDS-IVN system for vehicular networks in 2022, using convolutional neural and long short-term memory networks to extract features and classify them using latent space representation. This method shows high accuracy on the ROAD dataset.
This paper uses the TF-IDF algorithm [24] to extract the optimal features. TF-IDF can emphasize the words in the text that occur frequently in a particular document but are relatively uncommon across the entire corpus of text, thus highlighting the features and essential information of the text. Through this dimensionality reduction processing, the text data reduces the feature dimensions while retaining critical features, resulting in a more compact and efficient feature representation.

2.2. Classification Algorithm

Vulnerability information is mainly presented in textual form, so the classification of vulnerability information primarily relies on text classification. Many researchers have successfully applied machine learning methods to vulnerability classification in recent years. Domeniconi et al. [25] proposed a locally adaptive nearest-neighbor classification method in 2000, which divides the clusters in the subspace with the local weights of the features and can improve the classification accuracy of KNN. However, this scheme consumes vast computational resources and is less efficient. Chen et al. [26] proposed an SVM-based automatic vulnerability classification model in 2018, which builds SVM classifiers for each vulnerability category and uses vulnerability descriptive information for training, by which it can accurately and automatically classify new unlabeled vulnerability descriptive information. Song et al. [27] proposed an IDS model based on deep CNN (DCNN) in 2019, which was optimized for the data traffic of the controller area network (CAN) bus. The model shows high accuracy on the car hacking dataset. Zhang [28] designed the Direct-CS-KNN classifier and Distance-CS-KNN classifier in 2020, which improved the classification efficiency of imbalanced data by combining several enhancement strategies, such as smoothing, feature selection, and ensemble selection. Yang et al. [29] proposed a tree-based stacking algorithm in 2021 to detect known and unknown attacks on vehicular networks. This method is feasible and shows excellent performance in real-time vehicle systems.
Although the above standard vulnerability classification algorithms have been widely studied and improved, they may not adequately extract the vulnerability features in a few classes when dealing with imbalanced sample data, leading to unsatisfactory classification results [30]. For this reason, this paper proposes an improved vulnerability classification algorithm for the IoT vulnerability dataset imbalance problem, which introduces the correlation between features in the process of vulnerability classification using the KNN algorithm and calculates the similarity between vulnerabilities from multiple dimensions, thus effectively enhancing the performance of the vulnerability classification algorithm when dealing with imbalanced sample data.

3. Background

This section will introduce the main tools used in KG-KNN, including the knowledge graph, K-nearest neighbor classification algorithm, and vulnerability classification.

3.1. Knowledge Graph

Google formally introduced the concept of knowledge graph [31] (KG) in 2012, aiming to realize a more intelligent search engine, and then KG began to be widely used in academia. Its core idea is to organize knowledge into a graphical structure, where nodes represent entities and edges define relationships between entities. This graphic structure makes the associations between knowledge intuitive and easy to understand. The construction of a knowledge graph typically involves several key steps, including knowledge extraction, knowledge fusion, knowledge storage, and other related processes [32]. The construction process is shown in Figure 1.
Knowledge extraction is the first step in building a knowledge graph. Different processing methods are used for different types of data. For semi-structured data, entities, relationships, and attributes need to be further extracted to transform the information into structured information. Unstructured data needs to be processed by natural language processing technology. In the knowledge fusion stage, knowledge from different data sources needs to be integrated to eliminate conflicts, duplications, and inconsistencies. This involves the alignment of various entities, the disambiguation of entities with the same name, the merging of relationships, etc., to provide more complete and accurate data for building knowledge graphs.
In the knowledge storage stage, structured semantic network data are mainly stored in the database. The general storage medium is various types of graph databases. Neo4j is a typical, high-performance graph database. Compared with other non-relational databases, it supports ACID transactions and has all the characteristics of a mature database. It can solve the vulnerability areas of low data value density and large quantity questions.
Knowledge application refers to applying the constructed knowledge graph to actual scenarios to support various intelligent applications and decision-making needs. The knowledge graph obtained through the above steps can provide rich knowledge support and semantic associations for various fields.

3.2. K-Nearest Neighbor Classification Algorithm

The K-nearest neighbor classification algorithm (also known as the KNN algorithm) [33], a traditional pattern recognition method, is widely used in text automatic classification research and is accurate. The idea is that for each sample, the K-nearest neighbors can be taken as the basis for classifying this sample. Among the commonly used methods to calculate the distance are the Euclidean distance [34], Manhattan distance [35], cosine distance [36], Chebyshev distance [37], and so on.
Euclidean distance is a commonly used distance metric to measure the similarity or distance between samples. It calculates the straight-line distance between two points in Euclidean space, also known as Euclidean distance. The main steps are to compute the difference between two vectors in each dimension, then square the difference and sum it, and finally square the sum of squares to obtain the Euclidean distance. For two n-dimensional vectors x = ( x 1 , x 2 , , x n ) and y = ( y 1 , y 2 , , y n ) , the equation for Euclidean distance is shown below:
d ( x , y ) = ( x 1 y 1 ) 2 + ( x 2 y 2 ) 2 + + ( x n y n ) 2 ,
Here, d ( x , y ) denotes the Euclidean distance between vector x and vector y.
The procedure of the KNN algorithm is as follows:
  • Divide the preprocessed samples into a training sample set and a test sample set;
  • Choose an appropriate distance equation to calculate the distance between the word vectors in the test samples and the word vectors in each training sample;
  • Sort the word vectors of the training samples in the order of distance from most petite to most significant;
  • Setting the value of parameter k and selecting the top K-word vectors from the previously sorted queue as the set of neighbors;
  • Calculate the frequency of occurrence of the first K vectors and record it;
  • Return the category with the highest frequency of occurrence of the first K vectors as the predicted classification of the test sample.
The KNN algorithm is simple to operate and has high accuracy; however, the algorithm has some problems in calculating similarity using Euclidean distance. When the target samples are highly imbalanced, the minority class samples are easily affected by the majority class samples when determining the categories, which leads to a poorer classification effect, resulting in a bias in the prediction results.

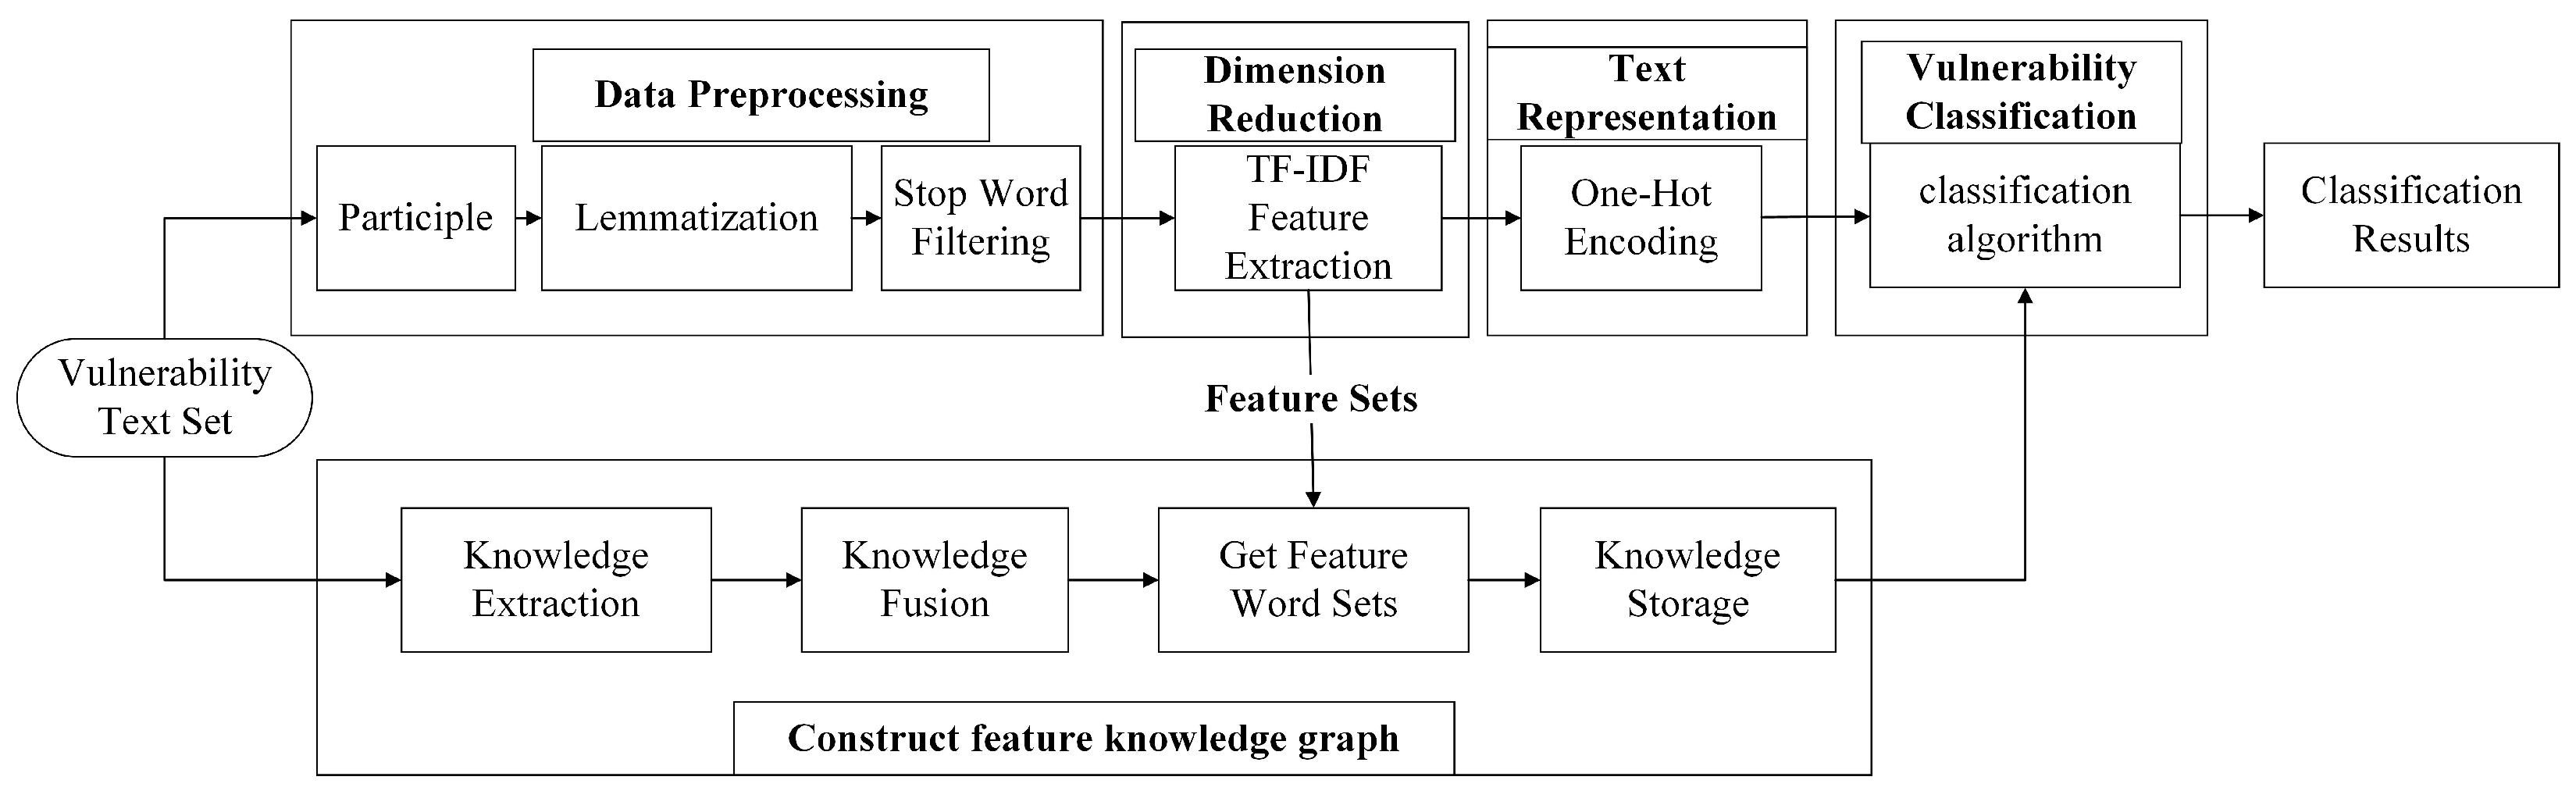
3.3. Vulnerability Classification

Vulnerability classification is the process of categorizing and labeling known vulnerability information according to a developed system or standard and then organizing the vulnerability information into one or more categories. This process is mainly completed automatically by computer. The detailed operation of vulnerability classification is illustrated in Figure 2. Initially, the vulnerability text undergoes preprocessing, after which the data is dimensionally reduced to obtain low-dimensional data for vector representation. The vector representation of the dataset is divided into a training set and a test set. The training set is input into the classifier for training to obtain the appropriate classifier parameters, and then the test set is input into the classifier to obtain the classification results.
  • Text preprocessing: Before classifying the vulnerability text, preprocessing operations are necessary. These typically involve removing punctuation, splitting words, reducing linguistic complexity, and applying deactivation filtering.
  • Dimensionality reduction processing: Dimensionality reduction processing techniques are used to filter irrelevant or redundant features and retain the most distinguishable and relevant features to form the optimal set of features;
  • Text representation: The classifier cannot recognize the form of the above feature set, and it needs to be converted into a declaration that the machine learning algorithm can identify to carry out the next classification task;
  • Classification: According to the characteristics of the vulnerability text, select the appropriate classification algorithm, use the training set for training, obtain the proper classifier parameters, and then input the test set into the classifier to obtain the classification results.

4. Design Strategy

4.1. System Design

This paper adopts a knowledge graph to integrate the dispersed vulnerability information to improve the classification effect of imbalanced sample data. It combines the screened important features to construct a unique feature knowledge graph. Firstly, we analyze the calculation principle of Euclidean distance and then combine it with the knowledge graph to realize the calculation of association distance and the weighting operation of Euclidean distance to propose a new vulnerability classification algorithm.
The KNN algorithm is affected by the number of features when calculating the similarity distance between training and testing samples. Therefore, this article adopts a bidirectional breadth-first search algorithm to obtain the shortest path between feature words in the feature knowledge graph. The average of the sum of the shortest paths between all the vital feature words stored in the knowledge graph of the two samples is used as the correlation distance between the samples and fused with the Euclidean distance to realize the weighting operation on the Euclidean distance to obtain the final sample distance. This approach assigns different association weights to the samples and calculates the similarity between the samples from multiple dimensions to enhance the accuracy of the similarity estimation actively.
As shown in Figure 3, the overall design can be divided into the following two modules:
  • Feature knowledge graph construction: After the vulnerability text is processed by dimensionality reduction, its feature set is fused into the IoV vulnerability knowledge graph to construct a unique feature knowledge graph;
  • Improvement in vulnerability classification algorithm: Calculate the association distance between feature words according to the feature knowledge graph and use its combination with the Euclidean distance to calculate the text similarity to realize the improvement in the vulnerability classification algorithm.

4.2. Performance Metrics

The improved vulnerability classification model will be evaluated in the following aspects:

4.2.1. Precision Rate

The precision rate is the ratio of the number of correct samples predicted by the classifier to belong to a particular category to the number of all models predicted to belong to that category, which is especially suitable for evaluating the performance of the classifier in an imbalanced dataset. The higher the precision rate, the better the classifier can predict positive categories. The equation is as follows:
P = T P ( T P + F P )
where P represents the precision rate, T P represents the number of correctly categorized texts, and F P represents the number of incorrectly categorized texts.

4.2.2. Recall Rate

Recall is the ratio of the number of correct samples predicted by the classifier to belong to a category to the number of samples that belong to that category. The recall rate takes the range of 0 to 1, and closer to 1 means that the classifier is more capable of recognizing a particular type. The equation is given below:
R = T P ( T P + F N )
where R represents the recall rate and F N indicates the number of texts that belong to a category but are incorrectly predicted by the classifier to belong to other types.

4.2.3. F1 Score

The F1 score combines precision and recall. When both precision and recall are high, the F1 score increases, indicating the classifier’s ability to recognize positives and accurately classify harmful instances. The equation is as follows:
F 1 = 2 × P × R ( P + R )
which F 1 referents F1 score.

4.2.4. Macro Average

In a multi-categorization problem, we employ the macro average method to calculate the performance metrics for each category. First, we calculate each type’s performance metrics separately. Then, we average the metrics for all classes to derive the final macro average. For multi-category classification with n categories, the macro-averaging equation is as follows:
M P = 1 n i = 1 n X
Here, X represents various metrics, including the precision rate, recall rate, and F1 score.

4.2.5. Weighted Average

Weighted averaging is an improvement in macro averaging that considers the number of samples of each category as a proportion of the total samples. There is a set of data x = ( x 1 , x 2 , , x n ) whose corresponding weights w = ( w 1 , w 2 , , w n ) , and the equation for the weighted average is as follows:
W = w 1 · x 1 + w 2 · x 2 + + w n · x n w 1 + w 2 + + w n

5. Methodology

In this section, we will describe the specific steps involved in classifying vulnerability data using the vulnerability classification algorithm proposed in this paper. Figure 4 illustrates the flowchart of this section.
This section is divided into five blocks to introduce the steps in detail: data preprocessing, dimensionality reduction processing, constructing the feature knowledge graph, text representation, and the vulnerability classification algorithm based on the feature knowledge graph (KG-KNN).

5.1. Data Preprocessing

Data preprocessing is a crucial step for vulnerability classification, which refers to the processing and conversion of the original vulnerability data to make it better adapted to the vulnerability classification algorithm. In this paper, there is a large amount of text data in the vulnerability description text set that is not useful for vulnerability classification, and this text data has a significant impact on the efficiency and accuracy of feature extraction, so it is necessary to preprocess the text data before vulnerability classification.
This paper mainly divides the vulnerability description text preprocessing into three steps: word division, word shape reduction, and deactivation word filtering.
  • Participle. The purpose of word separation is to cut the continuous text sequence into separate words or lexical units, which provides the basis for the subsequent text-processing tasks. With its diverse segmentation patterns and wide range of application areas, Jieba word segmentation has become the most commonly used Chinese text segmentation tool in China. In this paper, we use the precise mode of stuttering participle, which will try to cut the text into the most reasonable word combinations according to the dictionary and algorithm.
  • Lemmatization. The purpose of lexical reduction is to reduce different forms of words to their root forms to reduce the vocabulary’s diversity and dimensionality. This paper uses the NLTK natural language processing tool library for the word form reduction operation. After decomposing each text into a list of words, we perform word form reduction on each word by referencing the word form relations in the WordNet database to convert the terms into their original forms or stems.
  • Stop word filtering. The purpose of deactivation word filtering is to reduce the noise and redundant information in the text to improve the efficiency and accuracy of the subsequent text analysis task. In this paper, we utilize the TF-IDF algorithm to filter out stop words, and we apply Equation (9) to identify and exclude frequently occurring words that do not contribute significantly to the classification task. These words are then incorporated into the Chinese stop words list to create a specialized stop words list tailored to the characteristics of vulnerability data.
Following the data preprocessing steps outlined above, we can mitigate the impact of extraneous information, thereby enhancing the efficiency and precision of feature extraction. Consequently, we can furnish more refined input data to bolster the performance of the subsequent classification task.

5.2. Dimension Reduction

Dimension reduction is crucial to the effectiveness of vulnerability classification algorithms, which mainly reduces the computational complexity by reducing the number of feature dimensions. In this section, we apply the TF-IDF algorithm to extract features from the vulnerability description text and identify more significant keywords for vulnerability classification.
The following describes the specific steps of dimensionality reduction processing.
  • Calculate the value of each word using Equation (7)
    T F = n i , j 1 k n k , j
    where i denotes the word, j denotes the document, n i , j is the number of times word i appears in document j, and 1 k n k , j is the sum of the number of times all words appear in document j.
  • Calculate the value of each word using Equation (8)
    I D F = log 2 D j : i d j + 1
    where D denotes the total number of documents in the corpus, j : i d j denotes the number of documents containing the word i, and to avoid the denominator being 0, it is generally used j : i d j + 1 .
  • Calculate the value of each word using Equation (9)
    T F - I D F = T F × I D F
  • 800 feature words are selected, which have larger T F - I D F values.
    Table 1 shows a vulnerability description and its dimensionality reduction results.

5.3. Construct Feature Knowledge Graph

Constructing a feature knowledge graph is a necessary step before vulnerability classification. In this study, we employ a feature knowledge graph as a vital tool to integrate IoT vulnerability information, depict the interrelationships among features, and provide a more precise and comprehensive feature similarity metric within the vulnerability classification process. This approach significantly enhances the effectiveness of vulnerability classification.
The construction of the feature knowledge graph mainly involves the following steps.
  • Knowledge extraction. The first step in constructing a knowledge graph is knowledge extraction. This paper obtains a large amount of structured data after the automated extraction of IoV vulnerability data from vulnerability repositories such as NVD, VULHUB, and CVE. Each data column is considered a specific entity, attribute, and relationship, and the table structure and data in the vulnerability repositories are converted into RDF graphs through direct mapping.
  • Knowledge fusion. After executing the knowledge extraction operation, the next crucial step involves integrating the IoV vulnerability data sourced from different vulnerability repositories. This integration process aims to resolve conflicts, eliminate duplications, and rectify inconsistencies, encompassing essential tasks such as entity alignment, entity disambiguation, and attribute alignment. The refined and processed data will be stored in documents, serving as a robust and precise basis for the subsequent construction of the knowledge graph.
  • Get feature word sets. After fusing the vulnerability data, we proceed with the preprocessing and dimensionality reduction of the vulnerability description text to extract the most relevant features and their correlations. Simultaneously, we store the generated optimal feature vocabulary and associated vulnerability information in a CSV file. We have elucidated the detailed steps of these preprocessing and dimensionality reduction operations in Section 5.1 and Section 5.2.
  • Knowledge storage. We have selected the Neo4j graph database for storing vulnerability data. We reserved the above-mentioned integrated data in CSV files and imported them into Neo4j. We constructed entities and relationships using the Cypher query language, ultimately creating the feature knowledge graph. As illustrated in Figure 5, CVE-2021-43963 is the assigned vulnerability number, categorized as having a medium risk level, falling under the information exposure type, and matching the keyword ‘mode’.

5.4. Text Representation

In vulnerability classification algorithms, it is imperative to convert textual data into computationally tractable vectors via text representation techniques, facilitating the execution of subsequent tasks. The standard text representation methods are one-hot encoding, bag-of-words model, word2vec, etc. Since the category labels in this paper are discrete features, we use one-hot encoding to represent the filtered features in binary form to ensure the efficiency of vector construction. The one-hot encoding extends the discrete attribute feature values of each vulnerability text into the Euclidean distance, and the importance of the attribute features corresponds to a certain point in the Euclidean distance to realize the vulnerability text’s representation.
The specific steps are as follows:
  • Determine the categorization variables. First, it is necessary to determine which features are categorization variables, i.e., the number of elements;
  • Establish a vocabulary. A vocabulary needs to be built for each categorical variable, listing all its possible values and assigning a unique index or number to each matter;
  • One-hot encoding. For each sample categorical variable, map its raw fetches to the corresponding vocabulary index and convert that index to a binary vector. In this vector, the element corresponding to the index position is 1, and the rest of the parts are 0. The vector representation of the partial vulnerability description text is shown in Table 2.

5.5. Vulnerability Classification Algorithm Based on Feature Knowledge Graph (KG-KNN)

This subsection proposes a new vulnerability classification algorithm (KG-KNN) based on the weighted Euclidean distance algorithm and feature knowledge graph. It adds the correlation distance between features to the similarity computation, which realizes the multi-dimensional calculation for a few categories and improves the vulnerability classification effect.
Below, we will introduce the specific process of classification using KG-KNN, and Figure 6 illustrates the flowchart.
  • Data preprocessing. The obtained vulnerability description text set is subjected to preprocessing operations such as word splitting, word shape reduction, and deactivation word filtering on the training and test text sets. The detailed steps are described in Section 5.1.
  • Dimension reduction. Use the TF-IDF algorithm to reduce dimensionality on the training text set and test text set after the preprocessing operations to form the training text feature set and test text feature set. The detailed steps are described in Section 5.2.
  • Text representation. The text representation is of the training text feature set and test text feature set using solo thermal coding to obtain the feature representation set. The detailed steps are described in Section 5.3.
  • Partition the dataset. Following an 8:2 split, the feature representation set is divided into two mutually exclusive parts. One part serves as the training text feature set, while the remaining data is designated as the test text feature set.
  • Calculate the word vector distance. Let x = ( x 1 , x 2 , , x n ) is the n-dimensional vector after the text representation of the test text feature set and y = ( y 1 , y 2 , , y n ) is the n-dimensional sample vector in the training set x = y = n . Calculate the distance between the word vectors in the test text and the word vectors in each training text as follows:
    Set two-word vectors x 1 and y 1 and use them f ( x , y ) to represent the similarity distance between the test text set and the training text set;
    Calculate the Euclidean distance between word vectors d ( x , y ) using Equation (1);
    Obtain the shortest path length l ( x 1 , y 1 ) of the two-word vectors corresponding to the feature words in the feature knowledge graph, where l ( x 1 , y 1 ) = 0 when x 1 = y 1 ;
    Calculate the average value of the sum of the shortest path lengths of all feature words in the sample vector in the knowledge graph according to Equation (10), called the association distance p ( x , y ) , where m represents the number of feature words with the shortest path not being 0;
    P ( x , y ) = 1 m i = 1 n l ( x i , y i )
    According to Equation (11), use the correlation distance to weigh the Euclidean distance and obtain the final sample distance f ( x , y ) .
    f ( x , y ) = d ( x , y ) × p ( x , y )
  • Training data sorting. Sort the vectors of training data in the order of final sample distances from the most minor to the most significant;
  • Select k neighbors. Set the size of parameter k and select the top k vectors from the above-sorted queue as the set of neighbors;
  • Calculate frequency. Calculate the frequency of occurrence of the first k vectors and sort them in descending order;
  • Return prediction results. Return the category with the highest frequency as the predicted classification of the test data.

6. Experiment

6.1. Experiment Configuration

In this paper, we will experimentally verify the classification effect of the proposed KG-KNN and compare it with other common classification algorithms to confirm whether the improved algorithm has better experimental results.
The experiment uses PyCharm as the integrated development environment, and the building information of the experiment configuration is shown in Table 3.

6.2. Experimental Dataset

This paper randomly selected 3121 IoV vulnerability data. The experiments involved 27 vulnerability types in CWE, and the number of vulnerabilities in each category is shown in Figure 7. The numbers 1–27 are used in Figure 7 to present the IoV vulnerability information better to indicate 27 data types, including SQL injection, code injection, code issues, trust management issues, exposure of sensitive information to an unauthorized actor, key management errors, command injection, security features, cryptographic issues, insufficient validation of data authenticity, improper authentication, missing encryption of sensitive data, data processing errors, improper access control, injections, improper privilege management, race condition, memory buffer errors, incorrect default permissions, resource management errors, cross-site scripting, cross-site request forgery, path traversal, improper input validation, link following, configuration, and communication channel errors. Each vulnerability information contains the vulnerability name (lname), vulnerability number (CVE), vulnerability type number (CWE), vulnerability type (ltype), vulnerability class (CVSS), and vulnerability description (ldetail). Some information on IoV vulnerability data is shown in Table 4.

6.3. Analysis of Experimental Results

6.3.1. Validation Experiment

The category falls within a limited number of classes, as evident in Figure 7. This observation implies that KG-KNN has demonstrated an improved precision rate when classifying these select categories. We also vectorize the text and labels to obtain a vulnerability feature representation set. The dataset is divided into a training dataset and a test dataset according to 8:2 to observe the classification effect of KG-KNN and the original algorithm (KNN) under the same dataset. The test results are shown in Figure 8, Figure 9 and Figure 10, where yellow represents the KNN and blue represents the KG-KNN. A–W denotes the categories in the test set, which are, in order of priority, SQL injection, code injection, code issues, trust management issues, exposure of sensitive information to an unauthorized actor, critical management errors, command injection, security features, cryptographic problems, insufficient verification of data authenticity, improper authentication, missing encryption of sensitive data, improper access control, injections, improper privilege management, race condition, memory buffer errors, incorrect default permissions, resource management errors, cross-site scripting, cross-site request forgery, path traversal, and improper input validation.
The comparison of the precision rate of the KG-KNN and the original classification algorithm is given in Figure 8. From Figure 8, it can be seen that the KG-KNN proposed in this paper has a better precision rate compared to the previous model. In particular, the code injection category has a precision rate of 0 in the original model, while the new model successfully classifies it correctly. As can be seen from the data in Figure 7, the code injection category belongs to a very small number of categories in the dataset, and the original model cannot classify it correctly, which means that it may be challenged by imbalanced data. The successful classification of the KG-KNN model shows its improvement in handling imbalanced data, which helps to improve the balance of the overall classification performance.
Figure 9 shows that the proposed KG-KNN has advantages in recall rate, especially for the code injection category. Compared with KG-KNN, KNN is terrible since it has a very low recall rate and even 0 recall for some cases.However, KG-KNN successfully increased the recall of this category from 0% to 100%, which is a significant improvement. This means that KG-KNN captures relevant samples more effectively when processing minority class data, ensuring that this key information will not be missed, thus improving the overall recall rate.
The comparison between KG-KNN and the original classification algorithm in terms of the F1 score is shown in Figure 10. KG-KNN shows significant improvements in handling very few categories such as code injection and cryptographic security issues. This means that KG-KNN achieves a better balance and improves the F1 score when classifying these important but relatively uncommon categories.
The F1 score takes into account precision and recall, and therefore reflects the overall performance of the model in data classification. The improvement in the F1 score of KG-KNN shows its effectiveness in handling imbalanced data and classifying key information.
In summary, KG-KNN has different degrees of improvement in the precision rate, recall rate, and F1 score relative to the KNN algorithm, so the KG-KNN algorithm is more effective in coping with imbalanced samples.

6.3.2. Comparative Experiment

To verify the applicability of KG-KNN, this paper selects the widely used SVM model [38], KNN model [39], DNN security model [40], and TFI-DNN [41] model for comparison.
The SVM model achieves data discrimination and classification by finding a hyperplane in the feature space that maximizes the interval between different categories. In imbalanced classification problems, support vectors are usually samples of minority categories, which help improve the model’s classification performance for minority categories. The KNN model uses a feature weighting algorithm to allocate weights to various features of the training set and then finds the K neighbors most similar to the target vector by calculating the similarity between vectors, by combining feature weighting and KNN to balance the focus on minority classes. The DNN security model is a machine learning model based on the neuron hierarchy, which performs feature learning and representation learning through multiple hidden layers to gradually extract the abstract representation of the input data and ultimately achieve efficient modeling and prediction of complex tasks. The TFI-DNN model uses TF-IDF to calculate the frequency and weight of each word from the vulnerability description, uses information gain for feature selection, obtains an optimal set of feature words, and then uses the DNN neural network model to build an automatic vulnerability classifier, thus enabling an effective vulnerability classification.
We separately calculate each classification algorithm’s macro-averaged precision rate, recall rate, and F1 score to provide a more intuitive view of these classification models. The results are presented in tabular form. As shown in Table 5, from top to bottom is a representation of the comparison models selected in this article: SVM, KNN, DNN security, TFI-DNN, and KG-KNN. Each column represents the performance results of each model under different metrics.
The experimental results show that the KG-KNN proposed in this paper improves the precision rate by 5.9%, the recall rate by 12.5%, and the F1 score by 6.5%, compared to the KNN classification algorithm. It indicates that the classification result of KG-KNN is better than the text classification algorithm based on KNN, and the experimental results show that the improvement in the KNN classification algorithm achieves the expected purpose. Compared with the SVM text classification algorithm, there is an improvement of 71%, 140%, and 106% in the precision rate, recall rate, and F1 score, respectively. It shows that compared to the SVM-based text classification algorithm, KG-KNN is good at classification.
Compared with the DNN security model, it shows improvements of 50% in the precision rate, 71% in the recall rate, and 57% in the F1 score. It indicates that KG-KNN is more suitable for classifying imbalanced samples than the DNN security model—although TFI-DNN achieves better classification results compared with the above models. However, the KG-KNN model improved the precision rate, recall rate, and F1 score by 24%, 31%, and 18%, respectively. It shows that the KG-KNN model is more suitable for classifying imbalanced samples.
However, the vulnerability samples are predominantly imbalanced datasets, and evaluating the classification model using the weighted average is preferable to using the macro average. Therefore, this paper also calculates the weighted average, and the results are presented in Table 6.
The results presented in Table 6 demonstrate that KG-KNN outperforms the text classification algorithms of KNN, SVM, DNN security, and TFI-DNN in terms of accuracy, recall, and the F1 score. This observation underscores KG-KNN’s superior ability to classify imbalanced samples and validates its applicability, as proposed in this paper.

7. Conclusions

To improve the classification effect of imbalanced samples, this article proposes an improved vulnerability classification algorithm. This algorithm uses the calculation principle of Euclidean distance and combines the critical path algorithm of the knowledge graph to calculate the correlation distance and the weighted operation of Euclidean distance. It effectively utilizes the correlation between vulnerability features to improve the performance of the classification algorithm. Through experiments with three classic classification models and comparing the results of the macro average and weighted average, it was found that the vulnerability classification algorithm based on the feature knowledge graph is better than other models in terms of precision, recall rate, and F1 score. The experimental results reflect that the algorithm can better classify imbalanced samples and verify the effectiveness of the algorithm proposed in this article. This algorithm is expected to play an important role in the field of vulnerability research and security protection, providing useful exploration and practice for improving system security and reducing potential risks.
The limitation of our current research lies in the reliance on the TF-IDF algorithm for vulnerability feature extraction, which predominantly considers the impact of features at a global level while neglecting their concurrent influence at the local level. It makes the algorithm have certain shortcomings in capturing local information, specific context, and subtle differences. Future research directions need to explore feature extraction methods that are more adaptable to complex contexts to better capture global and local information and improve the model’s performance. CNN’s proficiency in capturing spatial hierarchies and complex patterns will alleviate the lack of consideration of the local effects in current models, allowing for more detailed and comprehensive analyses. Therefore, future work plans to introduce CNN into this model, use CNN to extract local features of vulnerabilities, and combine global features with local features to better optimize the classification model.

Author Contributions

Conceptualization, J.W.; methodology, Y.W.; software, Y.W.; validation, Y.W., J.S. and H.C.; formal analysis, J.W.; investigation, J.W. and H.C.; resources, Y.W. and J.S.; data curation, H.C.; writing—original draft preparation, Y.W., J.S. and H.C.; writing—review and editing, Y.W.; visualization, Y.W.; supervision, J.S.; project administration, H.C.; funding acquisition, J.W. All authors have read and agreed to the published version of the manuscript.

Funding

This research was funded by the Major Science and Technology Innovation Project of Shandong Province 2019JZZY010134, and the Natural Science Foundation of Shandong Province ZR2020MF058, and Shandong Province Science and Technology smes Innovation Enhancement Project 2022TSGC2544.

Data Availability Statement

These data are not publicly available due to the experimental data involving another unpublished paper.

Conflicts of Interest

The authors declare no conflict of interest. The funders had no role in the design of the study; in the collection, analyses, or interpretation of data; in the writing of the manuscript; or in the decision to publish the results.

References

  1. Chen, C.; Li, H.; Li, H.; Fu, R.; Liu, Y.; Wan, S. Efficiency and Fairness Oriented Dynamic Task Offloading in Internet of Vehicles. IEEE Trans. Green Commun. Netw. 2022, 6, 1481–1493. [Google Scholar] [CrossRef]
  2. Liu, X.; Zhao, S.; Tan, L.; Tan, Y.; Wang, Y.; Ye, Z.; Hou, C.; Xu, Y.; Liu, S.; Wang, G. Frontier and hot topics in electrochemiluminescence sensing technology based on CiteSpace bibliometric analysis. Biosens. Bioelectron. 2022, 201, 113932. [Google Scholar] [CrossRef]
  3. Sarkar, B.; Takeyeva, D.; Guchhait, R.; Sarkar, M. Optimized radio-frequency identification system for different warehouse shapes. Knowl.-Based Syst. 2022, 258, 109811. [Google Scholar] [CrossRef]
  4. Friji, H.; Khanfor, A.; Ghazzai, H.; Massoud, Y. An End-to-End Smart IoT-Driven Navigation for Social Distancing Enforcement. IEEE Access 2022, 10, 76824–76841. [Google Scholar] [CrossRef]
  5. Domeyer, J.E.; Lee, J.D.; Toyoda, H.; Mehler, B.; Reimer, B. Driver-Pedestrian Perceptual Models Demonstrate Coupling: Implications for Vehicle Automation. IEEE Trans. Hum.-Mach. Syst. 2022, 52, 557–566. [Google Scholar] [CrossRef]
  6. Wu, Y.; Dai, H.N.; Wang, H.; Xiong, Z.; Guo, S. A Survey of Intelligent Network Slicing Management for Industrial IoT: Integrated Approaches for Smart Transportation, Smart Energy, and Smart Factory. IEEE Commun. Surv. Tutor. 2022, 24, 1175–1211. [Google Scholar] [CrossRef]
  7. Bang, A.O.; Rao, U.P.; Visconti, A.; Brighente, A.; Conti, M. An IoT Inventory Before Deployment: A Survey on IoT Protocols, Communication Technologies, Vulnerabilities, Attacks, and Future Research Directions. Comput. Secur. 2022, 123, 102914. [Google Scholar] [CrossRef]
  8. Man, D.; Zeng, F.; Lv, J.; Xuan, S.; Yang, W.; Guizani, M. AI-based Intrusion Detection for Intelligence Internet of Vehicles. IEEE Consum. Electron. Mag. 2021, 12, 109–116. [Google Scholar] [CrossRef]
  9. Alabbad, Y.; Demir, I. Comprehensive flood vulnerability analysis in urban communities: Iowa case study. Int. J. Disaster Risk Reduct. 2022, 74, 102955. [Google Scholar] [CrossRef]
  10. Li, B.; Xu, H.; Zhao, Q.; Su, P.; Chabbi, M.; Jiao, S.; Liu, X. OJXPerf: Featherlight object replica detection for Java programs. In Proceedings of the 44th International Conference on Software Engineering, Pittsburgh, PA, USA, 8–27 May 2022; pp. 1558–1570. [Google Scholar]
  11. Li, B.; Zhao, Q.; Jiao, S.; Liu, X. DroidPerf: Profiling Memory Objects on Android Devices. In Proceedings of the 29th Annual International Conference on Mobile Computing and Networking, Madrid, Spain, 2–6 October 2023; pp. 1–15. [Google Scholar]
  12. Luo, Q.; Liu, J. Wireless telematics systems in emerging intelligent and connected vehicles: Threats and solutions. IEEE Wirel. Commun. 2018, 25, 113–119. [Google Scholar] [CrossRef]
  13. Li, B.; Su, P.; Chabbi, M.; Jiao, S.; Liu, X. DJXPerf: Identifying Memory Inefficiencies via Object-Centric Profiling for Java. In Proceedings of the 21st ACM/IEEE International Symposium on Code Generation and Optimization, Montréal, QC, Canada, 25 February–1 March 2023; pp. 81–94. [Google Scholar]
  14. Guo, J.; Liu, Z.; Tian, S.; Huang, F.; Li, J.; Li, X.; Igorevich, K.K.; Ma, J. Tfl-dt: A trust evaluation scheme for federated learning in digital twin for mobile networks. IEEE J. Sel. Areas Commun. 2023, 41, 3548–3560. [Google Scholar] [CrossRef]
  15. Bundak, C.E.A.; Abd Rahman, M.A.; Karim, M.K.A.; Osman, N.H. Fuzzy rank cluster top k Euclidean distance and triangle based algorithm for magnetic field indoor positioning system. Alex. Eng. J. 2022, 61, 3645–3655. [Google Scholar] [CrossRef]
  16. Zebari, R.; Abdulazeez, A.; Zeebaree, D.; Zebari, D.; Saeed, J. A comprehensive review of dimensionality reduction techniques for feature selection and feature extraction. J. Appl. Sci. Technol. Trends 2020, 1, 56–70. [Google Scholar] [CrossRef]
  17. Islam, M.M.; Chuenpagdee, R. Towards a classification of vulnerability of small-scale fisheries. Environ. Sci. Policy 2022, 134, 1–12. [Google Scholar] [CrossRef]
  18. Khaire, U.M.; Dhanalakshmi, R. Stability of feature selection algorithm: A review. J. King Saud Univ.-Comput. Inf. Sci. 2022, 34, 1060–1073. [Google Scholar] [CrossRef]
  19. Yang, Y.; Pedersen, J.O. A comparative study on feature selection in text categorization. In Proceedings of the ICML, Nashville, TN, USA, 8–12 July 1997; Volume 97, p. 35. [Google Scholar]
  20. Zhang, C.; Mousavi, A.A.; Masri, S.F.; Gholipour, G.; Yan, K.; Li, X. Vibration feature extraction using signal processing techniques for structural health monitoring: A review. Mech. Syst. Signal Process. 2022, 177, 109175. [Google Scholar] [CrossRef]
  21. Lewis, D.D. Feature selection and feature extraction for text categorization. In Proceedings of the Speech and Natural Language: Proceedings of a Workshop Held at Harriman, New York, NY, USA, 23–26 February 1992. [Google Scholar]
  22. Rahman, M.A.; Hossain, M.F.; Hossain, M.; Ahmmed, R. Employing PCA and t-statistical approach for feature extraction and classification of emotion from multichannel EEG signal. Egypt. Inform. J. 2020, 21, 23–35. [Google Scholar] [CrossRef]
  23. Alqahtani, H.; Kumar, G. A deep learning-based intrusion detection system for in-vehicle networks. Comput. Electr. Eng. 2022, 104, 108447. [Google Scholar] [CrossRef]
  24. Qaiser, S.; Ali, R. Text mining: Use of TF-IDF to examine the relevance of words to documents. Int. J. Comput. Appl. 2018, 181, 25–29. [Google Scholar] [CrossRef]
  25. Domeniconi, C.; Peng, J.; Gunopulos, D. Adaptive metric nearest neighbor classification. In Proceedings of the Proceedings IEEE Conference on Computer Vision and Pattern Recognition. CVPR 2000 (Cat. No. PR00662), Hilton Head, SC, USA, 15 June 2000; IEEE: Piscataway, NJ, USA, 2000; Volume 1, pp. 517–522. [Google Scholar]
  26. Chen, Z.; Zhang, Y.; Chen, Z. A categorization framework for common computer vulnerabilities and exposures. Comput. J. 2010, 53, 551–580. [Google Scholar] [CrossRef]
  27. Song, H.M.; Woo, J.; Kim, H.K. In-vehicle network intrusion detection using deep convolutional neural network. Veh. Commun. 2020, 21, 100198. [Google Scholar] [CrossRef]
  28. Zhang, S. Cost-sensitive KNN classification. Neurocomputing 2020, 391, 234–242. [Google Scholar] [CrossRef]
  29. Yang, L.; Moubayed, A.; Shami, A. MTH-IDS: A multitiered hybrid intrusion detection system for internet of vehicles. IEEE Internet Things J. 2021, 9, 616–632. [Google Scholar] [CrossRef]
  30. Ding, H.; Chen, L.; Dong, L.; Fu, Z.; Cui, X. Imbalanced data classification: A KNN and generative adversarial networks-based hybrid approach for intrusion detection. Future Gener. Comput. Syst. 2022, 131, 240–254. [Google Scholar] [CrossRef]
  31. Zeng, X.; Tu, X.; Liu, Y.; Fu, X.; Su, Y. Toward better drug discovery with knowledge graph. Curr. Opin. Struct. Biol. 2022, 72, 114–126. [Google Scholar] [CrossRef]
  32. Ji, S.; Pan, S.; Cambria, E.; Marttinen, P.; Philip, S.Y. A survey on knowledge graphs: Representation, acquisition, and applications. IEEE Trans. Neural Netw. Learn. Syst. 2021, 33, 494–514. [Google Scholar] [CrossRef]
  33. Dai, Z.; Li, D.; Zhou, Z.; Zhou, S.; Liu, W.; Liu, J.; Wang, X.; Ren, X. A strategy for high performance of energy storage and transparency in KNN-based ferroelectric ceramics. Chem. Eng. J. 2022, 427, 131959. [Google Scholar] [CrossRef]
  34. Patel, S.P.; Upadhyay, S.H. Euclidean distance based feature ranking and subset selection for bearing fault diagnosis. Expert Syst. Appl. 2020, 154, 113400. [Google Scholar] [CrossRef]
  35. Cheng, W.; Zhu, X.; Chen, X.; Li, M.; Lu, J.; Li, P. Manhattan distance-based adaptive 3D transform-domain collaborative filtering for laser speckle imaging of blood flow. IEEE Trans. Med. Imaging 2019, 38, 1726–1735. [Google Scholar] [CrossRef]
  36. Liu, D.; Chen, X.; Peng, D. Some cosine similarity measures and distance measures between q-rung orthopair fuzzy sets. Int. J. Intell. Syst. 2019, 34, 1572–1587. [Google Scholar] [CrossRef]
  37. Chen, T.Y. New Chebyshev distance measures for Pythagorean fuzzy sets with applications to multiple criteria decision analysis using an extended ELECTRE approach. Expert Syst. Appl. 2020, 147, 113164. [Google Scholar] [CrossRef]
  38. Astorino, A.; Fuduli, A. The proximal trajectory algorithm in SVM cross validation. IEEE Trans. Neural Netw. Learn. Syst. 2015, 27, 966–977. [Google Scholar] [CrossRef]
  39. Wang, Z.; Na, J.; Zheng, B. An improved knn classifier for epilepsy diagnosis. IEEE Access 2020, 8, 100022–100030. [Google Scholar] [CrossRef]
  40. Almutairi, S.; Barnawi, A. Securing DNN for smart vehicles: An overview of adversarial attacks, defenses, and frameworks. J. Eng. Appl. Sci. 2023, 70, 16. [Google Scholar] [CrossRef]
  41. Huang, G.; Li, Y.; Wang, Q.; Ren, J.; Cheng, Y.; Zhao, X. Automatic classification method for software vulnerability based on deep neural network. IEEE Access 2019, 7, 28291–28298. [Google Scholar] [CrossRef]
Figure 1. Knowledge graph construction process.
Electronics 12 04749 g001
Figure 2. Vulnerability classification process.
Electronics 12 04749 g002
Figure 3. Design idea of vulnerability classification algorithm based on knowledge graph.
Electronics 12 04749 g003
Figure 4. Flowchart of IoV vulnerability classification algorithm based on knowledge graph.
Electronics 12 04749 g004
Figure 5. Fragment of feature knowledge graph.
Electronics 12 04749 g005
Figure 6. Flowchart of vulnerability classification algorithm based on feature knowledge graph.
Electronics 12 04749 g006
Figure 7. Distribution of the number of vulnerabilities in each category.
Electronics 12 04749 g007
Figure 8. Comparison of precision rate between the original algorithm and the improved algorithm.
Electronics 12 04749 g008
Figure 9. Comparison of recall rate between the original algorithm and the improved algorithm.
Electronics 12 04749 g009
Figure 10. Comparison of F1 score between the original algorithm and the improved algorithm.
Electronics 12 04749 g010
Table 1. A vulnerability description and its dimensionality reduction results.
DescriptionDimensionality Reduction Results
An authenticated, remote attacker can gain access to a dereferenced pointer contained in a request. The accesses can subsequently lead to local overwriting of memory in the CmpTraceMgr, whereby the attacker can neither gain the values read internally nor control the values to be written. If invalid memory is accessed, this results in a crash.[‘attacker’, ‘control’, ‘access’, ‘request’, ‘authenticated’]
Table 2. Vector representation of some vulnerability description texts.
CVEWord SetWord Vector
CVE-2014-10374‘Fitbit’:0 ‘activity’:0 ‘-’:0 ‘tracker’:0 ‘is’:0 ‘USA’:1 ‘Fitbit’:0 ‘company’:1 ‘of’:0 ‘One’:0 ‘Smart’:1 ‘Sports’:0 ‘Watch’:1 …[000010100101 …1100101…1011111…]
Table 3. Experiment configuration.
System ConfigurationConfiguration Information
Operating systemWindows 11
Version22H2
Memory16 GB
Central Processing UnitR7 5800H
Solid-State Disk512 GB
Table 4. IoV vulnerability data.
lnameCVECWEltypeCVSSldetail
IBM Sterling File Gateway 2.2.0.0 throughCVE-2020-4654CWE-287improper authenticationlowIBM Sterling File Gateway 2.2.0.0 through 6.1.1.0 could allow an authenticated user to obtain sensitive…
Access Control Vulnerability in Citrix Systems Gateway Plug-inCVE-2020-8199CWE-269improper privilege managementlowCitrix Systems Gateway Plug-in is a plug-in developed by Citrix Systems, a US-based company…
Table 5. Macro-averaged precision, recall, and F1 score across different classification algorithms.
ModelPrecisionRecallF1 Score
SVM211515
KNN343231
DNN security242121
TFI-DNN292726
KG-KNN363633
Table 6. Weighted average precision, recall, and F1 score across different classification algorithms.
ModelPrecisionRecallF1 Score
SVM524139
KNN605556
DNN575253
TFI-DNN595656
KG-KNN615657
Disclaimer/Publisher’s Note: The statements, opinions and data contained in all publications are solely those of the individual author(s) and contributor(s) and not of MDPI and/or the editor(s). MDPI and/or the editor(s) disclaim responsibility for any injury to people or property resulting from any ideas, methods, instructions or products referred to in the content.

