1. Introduction
The human activity recognition (HAR) system has shown tremendous improvement over the past several years in terms of its ability to facilitate communication between humans and machines. The HAR architecture introduces numerous innovations that significantly enhance the ways in which humans and machines communicate with one another. Because of state-of-the-art research and the expansion of a wide variety of input devices to capture data, the process of recognition is becoming less complicated and more useful. Input devices make possible the visualization or detection of human poses in situations ranging from simple to complicated. Radio frequency identification (RFID)-based devices are a good example of this type of technology. These devices are able to accurately identify fine-grained movements despite the presence of complex backgrounds [
1]. In order to come up with new ways of making computers more interactive with minimal physical contact, researchers have proposed RFID-based wireless sensing systems [
2]. The development of a system that is capable of identifying human poses in a three-dimensional environment through radio frequency technology is one example of this type of progress.
Human pose estimation provides a graphical depiction of a person in a given position. Estimating a person’s pose amounts to generating a set of coordinates that may be connected in various ways to give a full picture of where they are. A skeletal coordinate, or “joint,” is any one particular place on the skeleton. A proper connection is a combination of two components of the body that should function together. Unfortunately, not all possible permutations of parts can produce usable pairs.
Advancements in RF sensing systems have generated growing interest in the research and technology application of 3D human pose estimation. RF sensors, as compared with ordinary vision sensors, are unaffected by either light or darkness and have the distinct ability to protect user privacy. Because of their compact design, RFID tags are also considered suitable for deployment as wearable sensors as well as contactless sensing devices. RFID systems are much cheaper than radar-based systems such as the FMCW radar [
3].
However, because of the diversity and complexity of wireless channels, it is usually hard to generalize a trained RF sensing system to new environments. RF signals propagate through the air, and the receiver end needs precise signal strength of the deployed location. The received signal strength (RSS) is dependent on many different factors, the most important of which are the placement of the antennas, the surrounding obstacles, the layout of the room walls, and the movement of the object being observed [
3]. The focus of the current RFID-based pose detection systems [
4,
5] is on tracking the movement of a single body part at a time. These systems obtain their phase data from tags that are attached to various parts of the body. If multiple body parts move simultaneously, it can cause inter-tag collisions and an RFID mutual coupling effect, both of which significantly impair the accuracy of the system. For that reason, utilizing RFID tags to track the entire body remains a challenging task. Whenever the surrounding environment varies, identical human subjects performing the same activity can yield RF properties that are significantly different from one another. Even if the same person does the same activity, environmental variations may create differing radio frequency (RF) qualities. Developing 3D human posture estimation algorithms that are environment-aware is a challenge [
6].
Many methods have been proposed over the years to improve human–computer interaction (HCI) by researchers. Real-time human pose estimation is useful in a variety of domains, particularly healthcare. A primary motivation in the medical field is to minimize the transmission of environmental contamination by eliminating device contact and monitoring patients’ indoor daily activities. Depending on the information obtained from various sensors, these procedures vary. Both fixed and moveable sensors have been widely used for human activity recognition. Both stationary (those permanently affixed to the ground) and mobile (those easily moved from one location to another) sensors are employed to collect information about the study’s issue. External sensors can take the form of anything from a camcorder to a mic to a motion sensor to an imaging system to a trigger to an RFID tags chip. Wearable sensors can measure motion and orientation using devices such as gyroscopes, accelerometers, and motion detectors.
Recent research on RFID-based estimation of human pose has revealed the following limitations:
When the receiver and transmitter are not in close proximity, the observed phase value may not accurately reflect the relationship between path length and received phase [
4].
Recent RFID-based strategies only assess upper-body movement patterns, so it can be difficult to track the entire body at once with them to achieve the required accuracy [
5].
Learning models may not achieve optimal results when applied to a novel RF environment due to the fact that each training variable is based on a relatively small number of datasets. It can be difficult to reconstruct poses from a small dataset when a similar participant is asked to perform the same task in multiple locations, resulting in vastly different RF data [
6].
Before the system can better adapt to different environments, it must overcome the substantial challenge of generalizing the learning model [
7].
In order to evaluate the validity of the proposed system, real-time scenarios are considered and compared to existing RFID-Pose systems. According to the findings of the experiments, the system is capable of accurately tracking three-dimensional human poses for a variety of subjects and shows great subject adaptation.
This study makes several significant contributions, which are briefly summarized below:
This study presents an environment-adaptive 3D human pose prediction model using transceiver-based RFID tagging on the human body to overcome the problem of only being able to collect a single-phase sample from a single tag.
A 3D human pose estimation framework is proposed based on the artificial neural network (ANN) as a knowledge-level technique to estimate the learning error.
A prototype with commercial RFID tags attached to the entire human body has been developed to generate a dataset with ground-truth values for training and evaluating the model.
An analysis of the variability of RFID data is conducted using the fast Fourier transform (FFT) that has been measured and identifies the primary difficulties associated with generalization issues.
Case study results indicate that the proposed RFID system can predict 3D human postures with ease and is also highly adaptable. In addition, these results are compared to other published work in the same field to demonstrate their superiority and validate the concept.
In the next sections of this study,
Section 2 analyses the published research on the proposed system’s development as well as the challenges that it needs to overcome. In
Section 3, a mathematical model is used to briefly explain the proposed framework for recognizing human poses. The discussion of the testbed setting and the findings can be found in
Section 4. In
Section 5, the conclusion and future directions are discussed.
2. Literature Review
Pose estimation has numerous potential applications in diverse fields such as medicine, robotics, computer graphics, and video games. Existing literature on pose recognition can be roughly divided into two categories for convenience: both device-based and device-free pose recognition are possible [
2].
Device-based recognition widely uses vision sensors such as cameras [
4] and Kinect [
5,
6] to capture body poses in order to interpret the pose. Among both camera and Kinect technologies, Kinect is covering a large area of research as it provides more options to look at the human poses for improved accuracy and efficiency. On the other hand, device-free human pose received an increased use of the signals generated by commercial hardware devices in order to complete the recognition task. These systems are categorized as: radar-based [
8] and received signal strength indicator (RSSI) [
9]. In the study, [
10] a neural network model was adapted for use in an RFID-based wireless sensor network in an effort to reduce the likelihood of collisions occurring within the network. The ANN adds on layers of feature combinations; the research improves with these added layers. The obtained results demonstrated that the ANN model was the most suitable in terms of prediction reliability. CSI-based [
11,
12], and a combination of both channel state information (CSI) and RSSI based techniques are used [
13]. Other useful techniques for device-free human pose estimation are explored in surveys [
2,
14]. Research in the field is important because it offers fine-grained signal information at the subcarrier level, which has wide applications in computer vision and human representation for semantic parsing [
15].
Recent research has combined Kinect-based data with wireless signal-based data to better recognize human poses [
16,
17]. Yule Ren et al. [
3] presented a 3D human pose tracking system that uses the 2D angle of arrival (AoA) of signals reflected off the human body to estimate a 3D skeleton pose made up of a set of joints. There is only one sensor that can provide 2D AoA to identify moving limbs, so the participant was asked to face the sensor during evaluation. If multiple sensors are deployed at right angles, the user can change orientations. While walking, the system may not work well. The study [
1] addressed an RFID-based 3D human pose tracking approach that integrates few-shot fine-tuning and meta-learning. Larger datasets sampled in new situations are needed to achieve satisfactory fine-tuning performance, which increases training data gathering effort and cost.
In [
18], the authors combined computer vision and RFID technology in multi-person scenarios to design a more advanced exercise monitoring system. This allowed them to track more information about the participants’ workouts. This design was implemented in a smart exercise equipment application by the study using commercially available Kinect cameras and RFID devices. Using RFID phase data, the authors of [
19] presented a real-time 3D pose prediction, subject-adaptive, and tracking system. This system would leverage a unique cycle kinematic network to approximate human postures in real-time. The system was built with commercially available RFID readers and tags, and it was evaluated with an RFID-based comparative methodology.
In the paper [
20], the author presented a vision-aided, real-time 3D pose evaluation and tracking system. This system utilized a deep kinematic network to approximate human poses in real-time from RFID phase data. This network was trained with the support of computer vision data as labels gathered by Kinect 2.0. Due to the necessity of the original subject skeleton in the training phase, the proposed methodology is compromised when the subject is tested with an untrained subject or in a distinct standing position/environment. In another study [
21], a kinematic network is suggested as a way to train models without having to pair RFID and Kinect data. The subject-adaptive system that came out of it was made by learning how to turn sensors data into a skeletal system for each subject. When tested with a known subject, the efficiency of the model is a little lower than with the classical RFID pose tracking method. Because RFID-based pose estimation relies on RFID tags attached to the human body, it can be classified as a device-based method. The study [
22] presents a 3D human pose estimation framework based on a relatively new deep learning model that can encode prior knowledge of the human skeleton into the pose construction procedure to improve the estimated joints’ match with the human body’s skeletal structure. The system consists of nine diffused antennas and requires the subjects to conduct activities at a fixed point. Therefore, the proposed system is restricted to specific applications and is not suitable for daily use.
According to the available literature, the proposed posture system is the first of its kind to use transceiver-based sensors to estimate three-dimensional human poses covering the whole human body. The proposed system uses RFID and computer vision (CV) to accurately estimate human 3D position across several modalities. The comprehensive review can be found in
Table 1, and it draws attention to the potential related research that is concentrated on a variety of factors that affect human pose estimation.
3. Materials and Methods
This article evaluates a real-world scenario in which a human subject was observed by RFID-based transceivers and a Kinect device in order to construct and analyse the subject’s 3D skeleton. The data collected using RFID readers can be used to generate the 3D skeleton of the subject, and the data acquired using the Kinect sensor can be used as ground data for supervised learning. The feed-forward back-propagation neural network is proposed for estimating the human poses. The proposed system consists of three primary components: data collection, data processing, and pose estimation, as shown in
Figure 1.
3.1. Data Collection
During this phase, data is collected from each of the RFID sensors and then processed in order to construct a three-dimensional skeleton of the subject. The RFID transceivers and the Kinect 2.0 sensors work together to collect the necessary information for testing and training. The data collected from the RFID tags is preprocessed before feature extraction and pose generation. Furthermore, the kinematic information will be used as labelled data for the purpose of conducting supervised training. The RGB camera and the infrared sensors present in the Kinect device conduct an analysis on the three-dimensional position of each human joint, and the findings of this analysis are then saved in a database. For the purpose of the study, passive RFID tags were attached to each of the eight joints of the human body. In order to collect the phase data from all of the linked RFID tags, a total of eight transceivers are utilized as part of the data collection process.
RF sensors were used at a rate of 0–1000 Hz, and each sensor was set to a certain angle on a joint of a human body part between different points of interest. Researchers have collected the samples at frequencies ranging from 5 Hz up to 512 Hz with, essentially, the same test setups [
7]. This study proposes a specific frequency range in order to obtain fine-grained human pose movements. For the valid case study, data from an office and laboratory setting were collected to make the proposed system more adaptive to varied environments.
The antenna transmits the RF signal, which is received by the RFID tag and then reflected back to the receiving antenna; this process is described as:
where r is the receive vector, H is the channel matrix, γ denotes the backscattering signal at the tag and n is the noise vector.
Figure 2 shows the RFID forward and backward links. The forward link is the transmitter-to-tag transmission channel. A reverse link propagates from the tag to the reader’s receiver. Denote the channel gains of the forward and backward links as h
f and h
b, respectively. Then, the whole channel gain can be written as:
The relationship between h
f and h
b depends on the transmitter and reader locations. In a monostatic system, transceiver antennas are close together [
22]. As forward and backward links are highly correlated, the mutual recognition rule of radio channels suggested in Equation (3) is given by the following:
Let us now look at the channel model of an RFID system with numerous tags and multiple readers. Suppose that N
T tags are attached to the object’s body and the reader is equipped with N
rd antennas. So, the ith tag is equipped with N
tag,i antennas. The channel from the reader to the ith tag and back to the reader again within a time factor can be described using Equation (2), and matrix H
i(t) can be calculated by Equation (4).
where h
if is the forward channel matrix from the reader to the ith tag, and h
ib is the backward channel matrix from the ith tag to the reader. Based on Equation (1), the received signal of the reader at time t
k can be written as
where,
To group all the received signals R of the reader and the transmitted signals S of the tags at different time instants (t
1,… t
K) in Equation (1):
where R = [r(
t1),
r(
t2), ⋯
r(
tK)], supposing that the channel does not change within the considered time frame, i.e., H(t
1) = H(t
2) = ⋯ = H(t
K) = H, S = [(t
1), (t
2),⋯ (t
K)], and n = [n(t
1), n(t
2),⋯n(t
K)].
3.2. RFID Data Preprocessing
In order to perform the data preparation, the devices first collect RFID signals, then extract the channel information from those signals, and finally preprocess the data. In particular, the study should begin by de-noising RFID signals in order to remove any noise that may be present. Because the conditions of the channel change, the information regarding the channel requires interpretation on a short-term basis. Where a known signal is transmitted and the channel matrix
is estimated, let the training sequence be denoted P
1,…., P
N, where P
i is transmitted over the channel, which can be written as
To de-noise the acquired signal, this study considered the multipath effect of the RFID signal between a pair of transceivers, which at time
t and frequency
f can be expressed as
where
is the difference between two waves caused by the carrier frequency difference in receiving and transmitting equipment,
αi(
t) is the reduction of the amplitude of a signal, and τ
i(
t) is time of flight for the
ith path.
Hs(
f,
t) represents the static reflection signals.
is the collection of dynamic path components which refer to the signals reflected from moving objects. To remove the noise, the study refers to the method proposed in [
11], applying Butterworth filtering between the RFID of multiple antennas:
3.3. Activity Segmentation
Activity segmentation mainly detects the start and end of an activity and removes the no-activity packets from a sample that corresponds to the whole activity. Since human activity durations are not always the same, this study proposes the adaptive moving average (AMA) filter in order to improve the reliability and accuracy of the real-time pose estimation. The moving average filter allows signals within a selected range of frequencies and time to be processed while preventing unwanted parts of a signal from getting through. The AMA filter averages subsets of the full data set to filter data points. AMA defined for a subset of original signal s(n) is shown in Equation (11).
The adaptive moving average technique works similarly to the sliding window technique in that the entire data set is divided into different segments or windows and the values of each window are compared to the values of the other windows.
Steps to perform the AMA filter are as follows:
Define sliding window size, shown in Equations (12) and (13).
Calculate the difference in average ∆A, as shown in Equation (14).
Calculate the time difference in ∆t, as shown in Equation (15).
Define boundary points array bp[].
To perform the filter, the first step is to set the size of the window, calculated in Equation (12).
where
f is the sampling frequency.
The next step is to define the start and end points of a human activity within a signal. First, calculate the difference in averages ∆A between the first half and second half of a sliding window.
where th1 is the threshold point.
Then, calculate the time difference ∆t between the two windows from Equation (12), as shown in Equation (14) and Equation (15), respectively.
Here, the threshold point is set to 0.5; i = 1,…n, n is the length of ΔA signal; j = 1,…, m, m is the length of the bp[] array
If the sliding window satisfies both Equations (14) and (15) at the same time, the center point of the window is considered the boundary point stored in the array bp[] to determine the boundary points.
3.4. Channel Feature Selection
The data presented in this article are collected using eight different off-the-shelf transceivers. Let us name the antennas Nt that are used for transmitting the signal at the transmitter’s end (Tx), and the antennas Nr that are used for receiving the signal at the receiver’s end (Rx). As a result of RFID’s use of eight different inputs, the antenna array, which is formed by Tx and Rx components, will generate eight separate data transmission lines.
This study created a feature set containing all the predefined features (M1, M2, M3, …. Mn) extracted from each of the eight received signals about a particular human pose. Predefined features are the values that represent the peaks generated by human activity. For that matter, the amplitude of 0.5 dB is set as the point of threshold. Peaks in the data that are regarded to be the depiction of human pose activities are those that are at or above the threshold point.
The use of amplitude and phase difference as recognition features can better show how body movements affect wireless signals. This is because the amplitude can change, but the phase difference can stay stable for a certain amount of time and can better describe how the frequency of different data streams changes over time. This matrix-based feature set (Fs) contains the number of extracted features, as expressed by Equation (16).
where each entity represents the peak value corresponding to a matrix element 1 and 0. Matrix value 1 indicates the peak value above the threshold point and 0 indicates the peak values below the threshold point.
3.5. Skeleton Construction
This component creates a 3D model of the subject’s skeleton using RFID data. Kinematic visual data is used to classify supervised training. The network is trained using a loss function that computes the difference between the estimated posture and labelled vision data, as shown in Equation (17).
where
represents the estimated position,
represents the ground-truth position gathered in the 3D space for joint
n at time
T, and
is the Euclidian distance between these two 3D vectors.
3.6. Classification Phase
Our proposed FFBPN method for training a model, in which the iterations go both ways (feed-forward and back-propagation) to improve the model’s performance. Feed forward involves computing input weights in a forward step, and secondly, it adjusts weight and calculates error in a backward step. The data used for training is adjusted to stay between zero and one. The model was trained using 70% of the data set, with the remaining 30% being used for testing and validating the model.
The FFBPN supervised learning begins with an input data matrix Fs denoted by
X. Each column in
X represents a single observation. Each column of
X indicates one predictor or variable. Equation (18) guides model training until the desired predetermined criterion is reached.
where
Xk represents the updated value of the variable,
xj stands for the previous value, and
wkj is the weight link value associated with the neuron/variable. In Equation (19), logsig used as the activation function connecting the input to the hidden layer.
The positive linear transfer function (POSLIN) used between the hidden layer and the output layer is calculated in Equation (20).
Replace missing entries in X with NaN values. The supervised learning methods are capable of handling NaN values, either by ignoring them or by disregarding any row containing a NaN value. The steps for the feed-forward back-propagation network are shown in Algorithm 1.
| Algorithm 1: Feed-forward back-propagation network (FFBPN) learning for classification |
1: Input: Ds, a dataset containing the training data along with the
corresponding targeted values and the learning rate Lr |
2: Output: A trained neural network
3: Initialize all weights and biases in network;
4: While terminating condition is not satisfied {
5: for each training tuple X in Ds {
6: // forward input propagation
7: for each input layer unit j {
8: // output of an input unit I its actual input value
9: Oj = Ij;
10: for each hidden or output layer unit j {
11: // compute the net input of unit j with respect to the previous
Layer, i
12: Ij = ∑ wij Oi + αj;
13: // compute the output of each unit j
14: Oj = ;
15: // back propagate the errors:
16: for each unit j in the output layer
17: // compute the error
18: Ej = Oj (1 − Oj) (Tj − Oj);
19: for each unit j in the hidden layers, from last to first layer
20: // compute error with respect to the next higher layer, k
21: Ej = Oj (1 − Oj) ∑ Ek wjk
22: for each weight wij in network {
23: // weight increment
24: ∆ wij = (l) Ej Oi
25: // weight update
26: wij = wij + ∆ wij
27: for each bias αj in network {
28: // bias increment
29: ∆ αj = (l) Ej
30: // bias update
31: αj = αj + ∆ αj
32: }
33: } |
4. Testbed Environment and Results
Referring to
Figure 1, a workable laboratory testbed was developed that consists of eight RF smart sensor modules (XYC-WB-DC transceivers) shown in
Figure 3. RF sensors were used at a rate of 1000 Hz, and each sensor was set to a certain angle on a joint of a human body part between different points of interest. Microsoft Kinect 2.0 is used to obtain visual ground truth data for supervised learning and to compare the RF sensors’ results. The data was recorded at 30 frames-per-second.
For the valid case study, data from an office and laboratory setting were collected to make the proposed system more adaptive to varied environments as shown in
Figure 4. There are two indoor environments, office and lab settings, where the distance between the transceivers and the human subjects is between 1 and 2.5 m.
As shown in
Figure 5a, the points are made up of the head, right shoulder, left shoulder, torso, left hand, right hand, right foot, and left foot. As can be seen in
Figure 5b, a total of eight RFID tags were attached to the subject’s head, right shoulder, left shoulder, torso, left hand, right hand, right foot, and left foot joints. Even if antennas are used to scan an individual’s entire body, all that is necessary for monitoring the majority of human actions is a skeleton with eight joints. RFID tags ALN-9634 that make use of the ultra frequency (UF) are utilized in research by making use of the particular targeted spots of the human body shown in
Figure 5b. Using RFID tags and transceivers, the experiments are carried out in a laboratory environment that can be precisely controlled. In order to achieve the highest possible level of efficiency, RFID transceivers incorporate all of the necessary components onto a single circuit board. This enables RFID tag reconfiguration. RFID signals are sensitive to their environment, making it difficult to duplicate and appraise past findings [
16]. This research combines RFID signals from four tasks into a dataset (stand, walk, bend, and sit) for the development of a case study. The selected individual performs each task fifty times at a variety of time intervals.
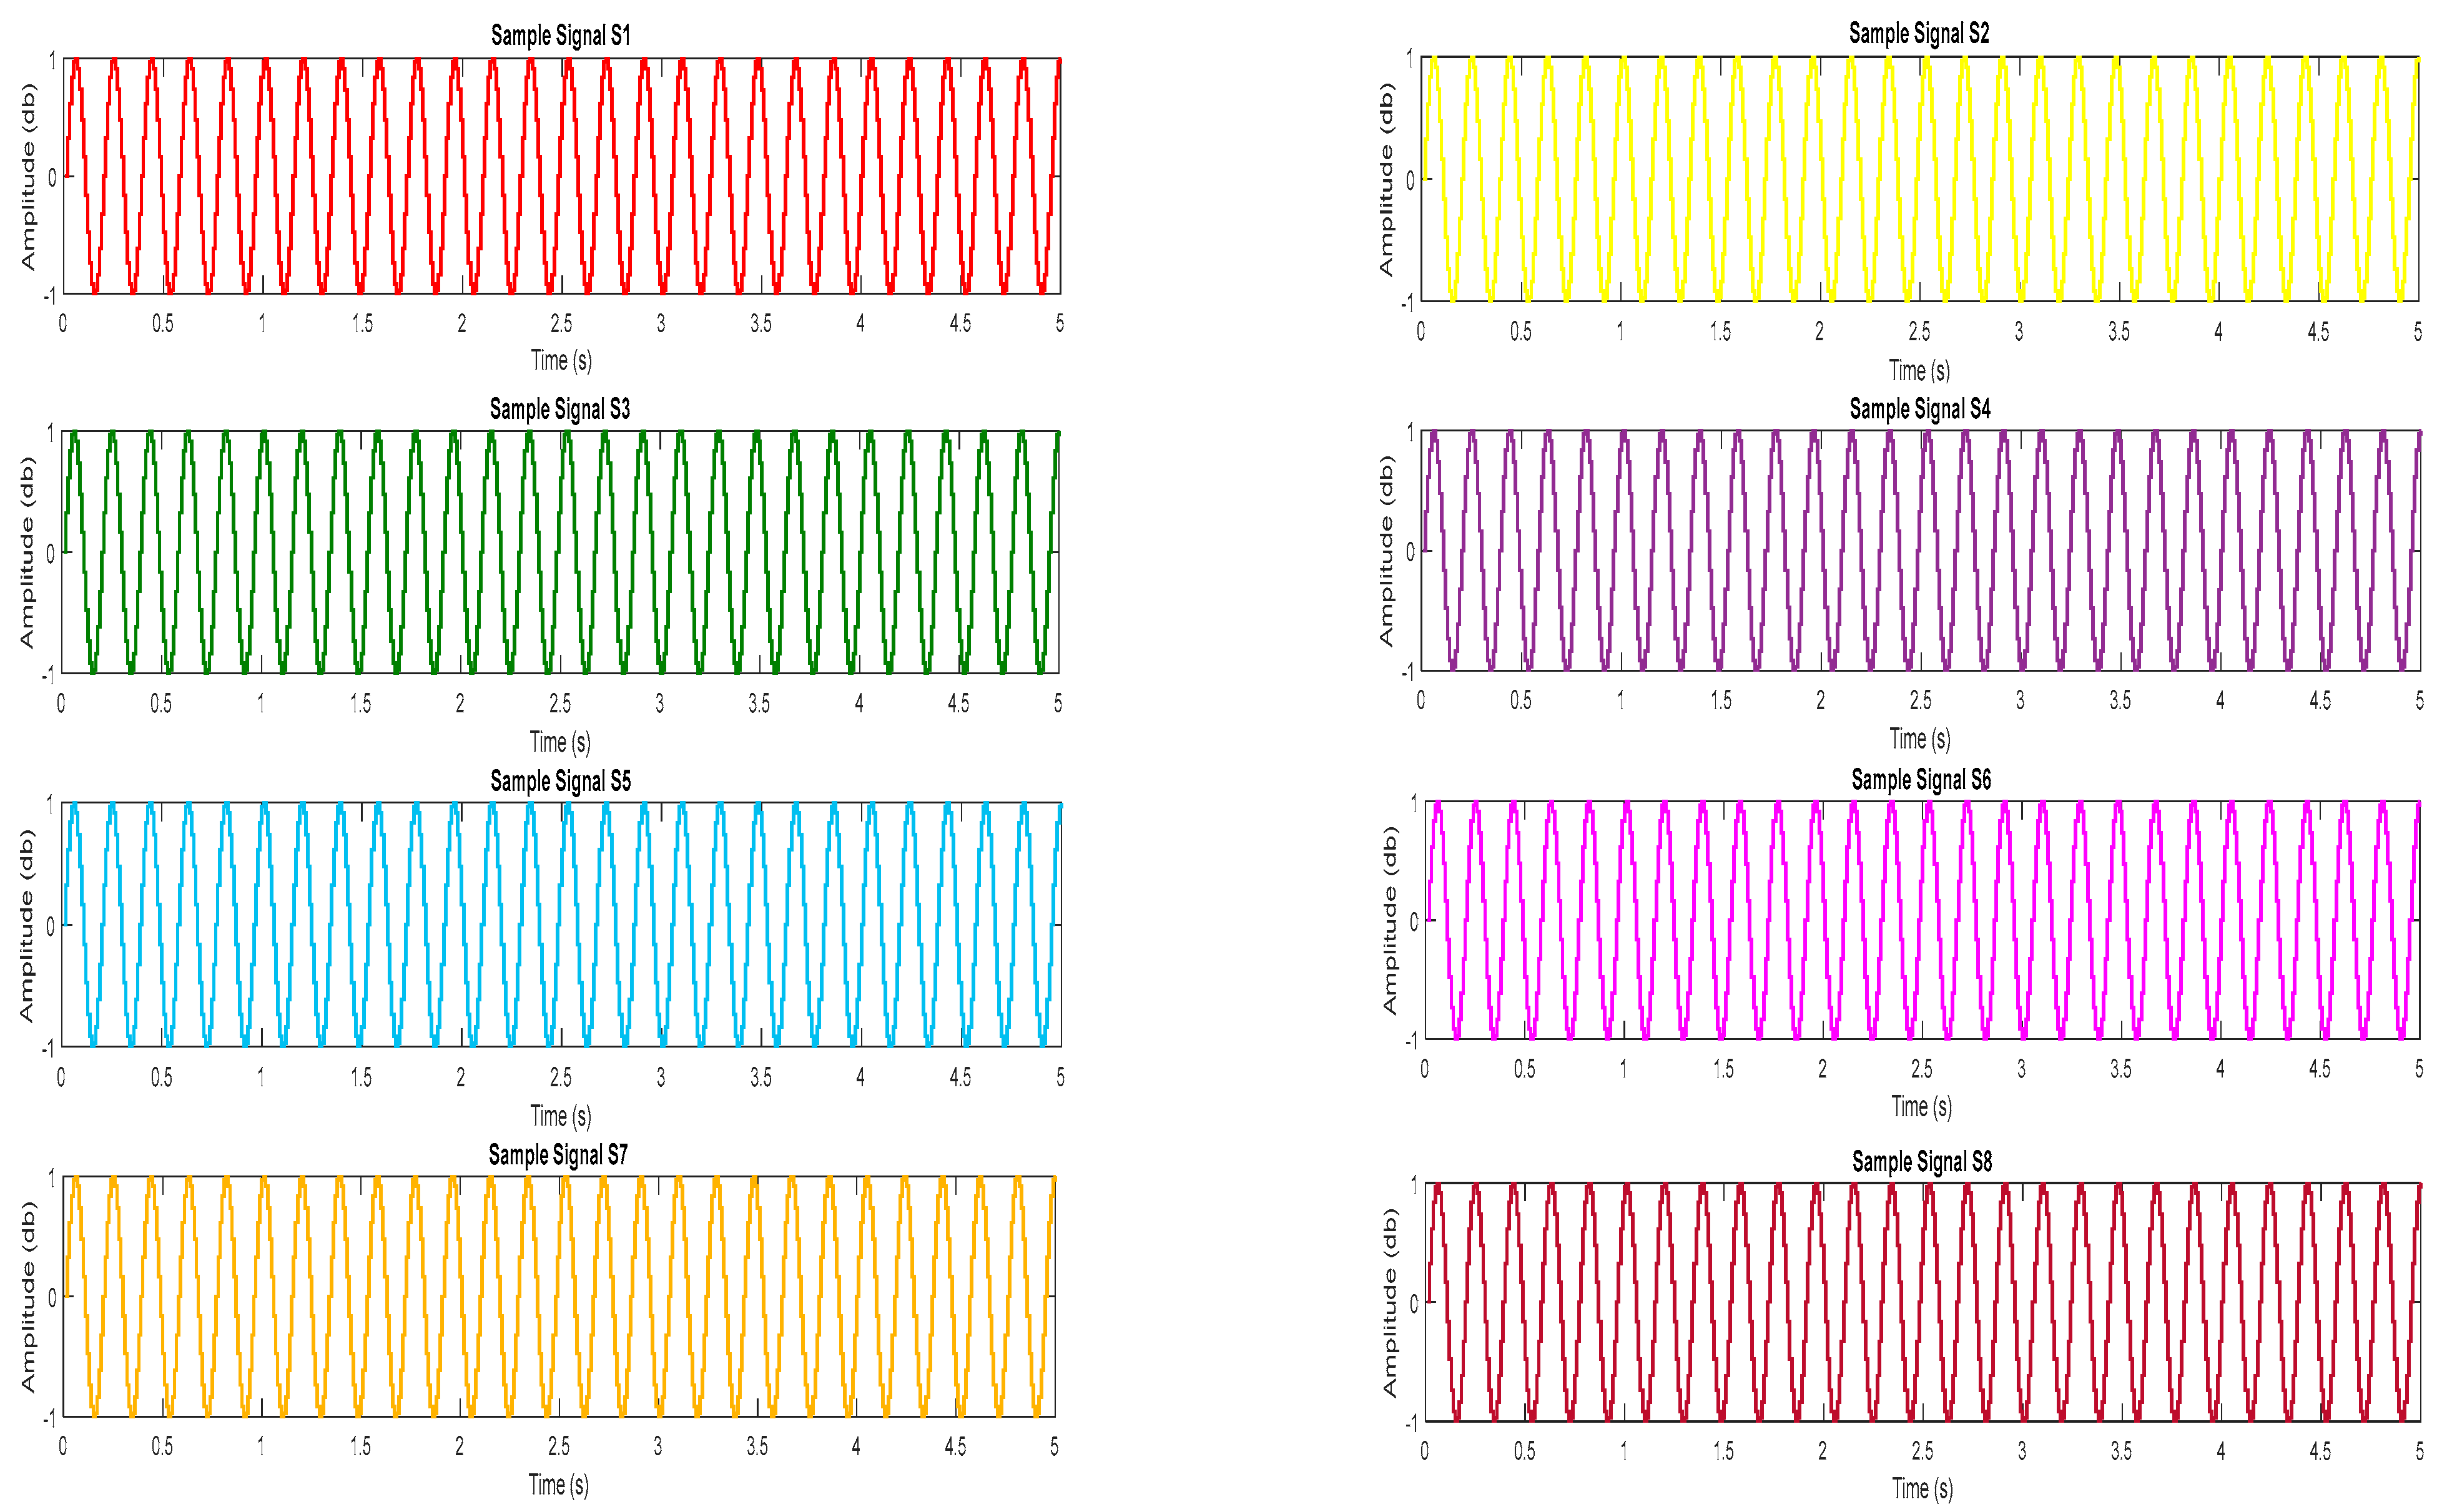
In order to begin the process of data collection, eight RFID transceivers are used to send signals toward respective configured body-connected tags and reflected back to the transceivers. Eight transceivers are used to produce time-domain signals corresponding to a particular human action. Eight signals generated from each transceiver for the walking pose are shown in
Figure 6. However, the same number of signals with their corresponding amplitude and frequency are generated for all other human poses discussed in this research.
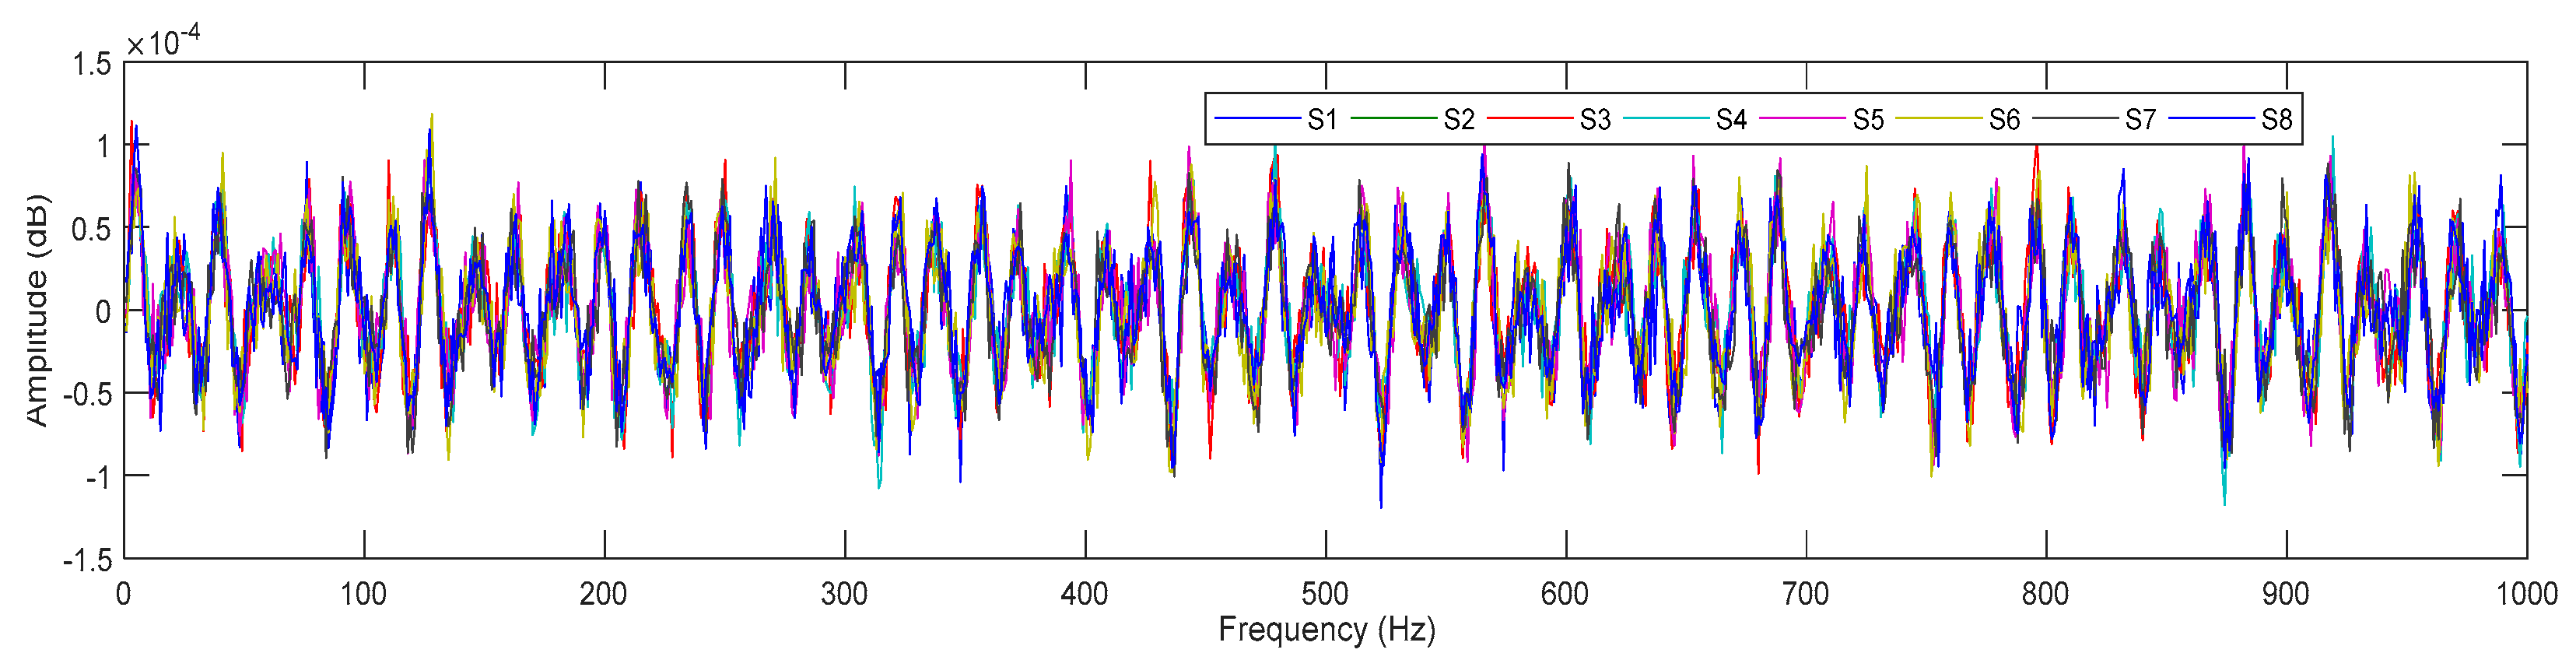
In order to preprocess these signals efficiently, they are first merged together to form a single signal converted to the frequency domain. Signals are merged together using the Matlab function shown in
Figure 7.
Figure 7 shows that once the reflected signals from each tag are received at the transceiver, all acquired signals are merged using a Matlab-Merge block script into a signal frequency domain signal.
Here, we assume that there is noise also manifested into the merged signal, and that the original signal may have lost its properties and the system may be confused in further processing. The noise that is created by electrical devices is quite variable, since it is caused by a variety of distinct processes.
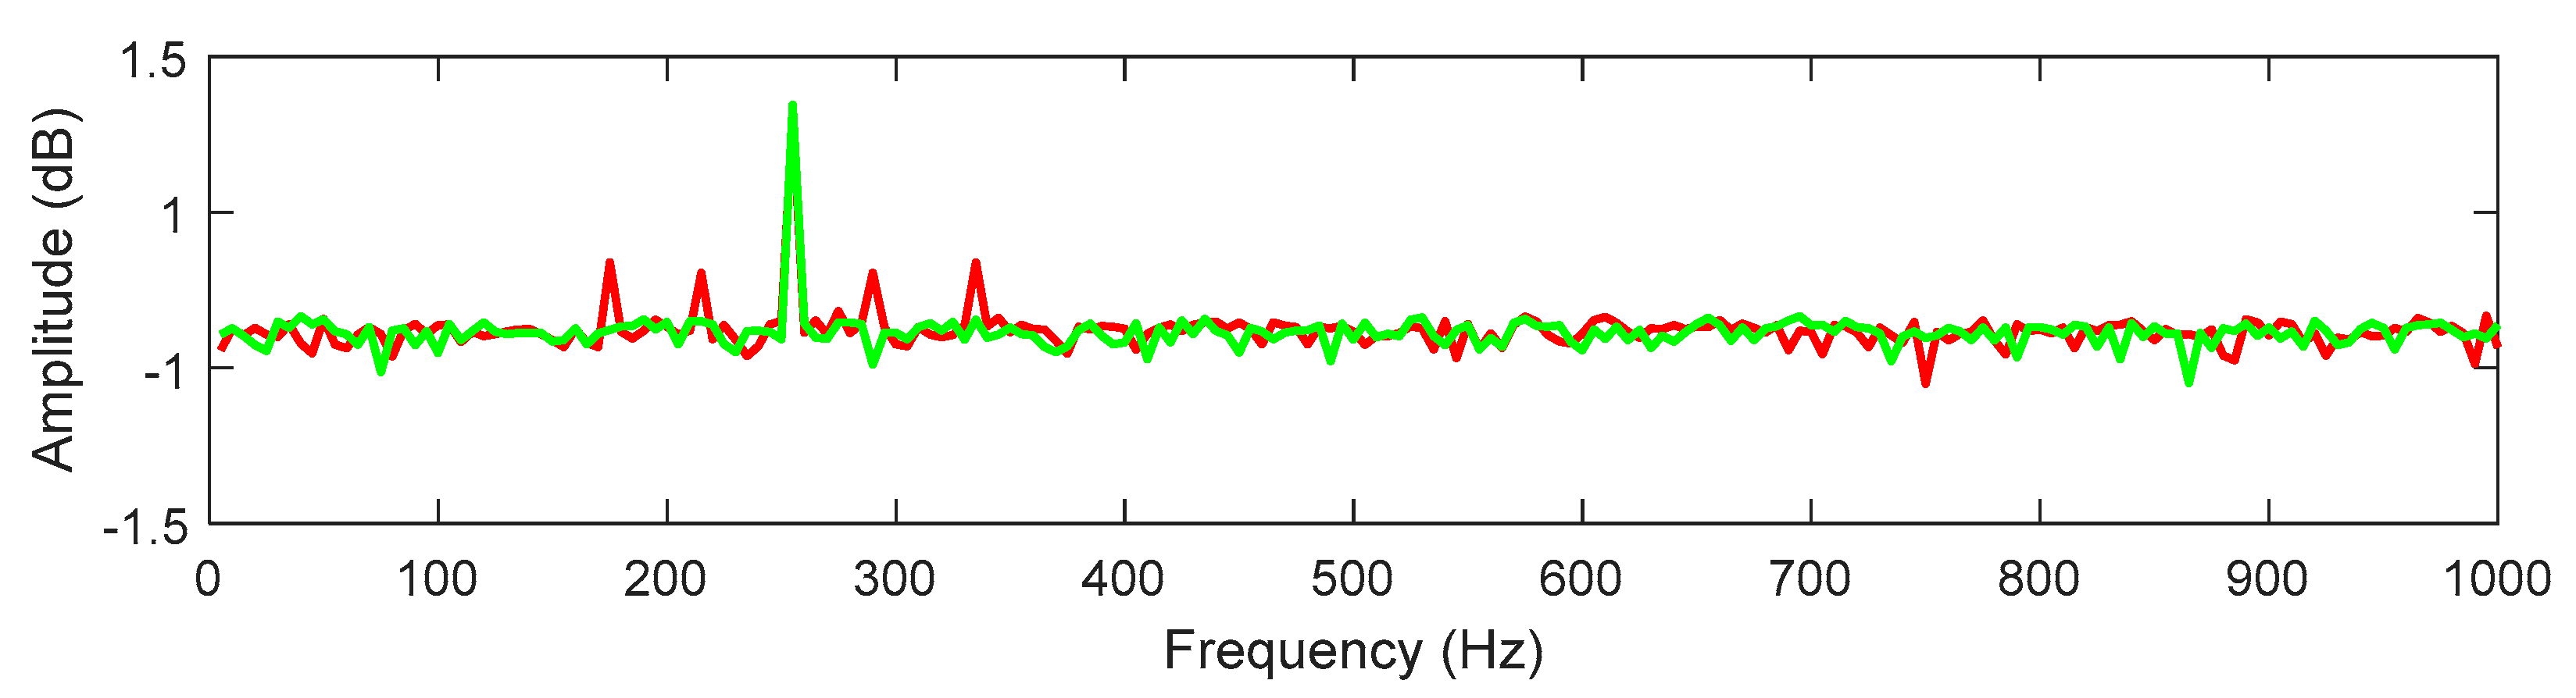
Figure 5b shows passive tags attached to eight human joints. When interrogating RFID tags, the reader collects phase data using a low-level protocol. To retain the individual identification of all tags, we need to apply an efficient filter to extract the noise from the original signal. Some noises are higher pitched than human poses. To remove out-of-band noise, this study used the Butterworth filter that provides a frequency range in the band-pass filter that will not distort the poses’ gesture signals. After that, we use the FFT to illustrate the separation of the noisy signal from the original signal, and then we identify the relevant sideband peaks from the original signal in order to identify and extract the relevant features. In
Figure 8, there are two colors for the signals: red for the signal itself and green for the noise around it.
The multipath effect of RFID signals between two transceivers was treated as noise in this investigation. It is a form of signal reception in which radio signals travel over two or more pathways to reach the antenna. Butterworth filtering was presented as a solution to this problem. The multipath effect was minimized by removing the phase offset data from the merged input signal.
Figure 9 shows a filtered image.
The complete activity can be represented by tracing the beginning and ending points of a sample. Our study presents an adaptive moving average (AMA) filter to increase real-time pose estimation, since human activity durations fluctuate. A moving average filter processes signals within a predetermined frequency and time range while excluding unwanted elements of the signal. There is now a clear separation between the segmented signal and other data, as illustrated in
Figure 10.
Analyzing the peaks that remain after the segmentation procedure is complete allows for the extraction of characteristics unique to each human activity, as demonstrated in
Figure 10. The amplitude of 0.5 dB has been chosen as the point of threshold. Peaks in the data that are regarded to be the depiction of human pose activities are those that are at or above the threshold point. The illustration of the item in its stationary condition is thought to be its peaks when they are lower than the threshold point. A unique signal pattern and a set of peaks are produced as a result of each activity carried out by the object. Both the number of peaks and the amplitude are determined by the kind of physical activity that is being carried out.
As shown in the following
Figure 11a, the walking activity of the item produced at least seven peaks of varying amplitudes over the predetermined threshold. Walking engages more muscle joints than standing, and hence generates more peaks than standing. As illustrated in
Figure 11b, the standing position produces four peaks, and the low amplitude peaks are disregarded because they do not correspond to any human stance.
Figure 11c depicts the relative characteristics of the object’s bending activity as measured by the created peak. The activity of bending caused four peaks to appear that were higher than the predetermined threshold point. As illustrated in
Figure 11d, the sitting posture created the fewest number of peaks since it required the least amount of physical movement compared to the other poses studied.
After estimating the pose using RFID signals, they evaluate its precision. The Kinect has the potential to perform 3D bone analysis with significantly greater precision. For the construction of the skeleton, a 320-by-240-pixel image with centimeter-precise depth data is taken and employed. This instrument is totally automated and requires no operator interaction, calibration, or correction. In experiments, a single Kinect camera was positioned around 3 m away from the participant, the minimal distance required to observe the entire human body. Pose data was recorded at 30 Hz.
Figure 11 depicts how vision-based data is generated as the ground truth for supervised training.
The kinematic models generated four distinct human activity poses and skeletons, which are depicted in
Figure 12a–d. The number of joints formed and their positions change throughout all of the activities. The measurements of human bodies are used in the creation of joints, particularly for the purpose of comparative study. The skeleton that was developed for a body configuration representing walking is depicted in
Figure 12a. The skeleton that was obtained for the standing body stance can be seen in
Figure 12b. The skeleton that was obtained while the object was in the bending stance is shown in
Figure 12c. In addition,
Figure 12d illustrates the skeleton that was derived for the seated posture. There is no mechanism for calibrating the Kinect, so the limb lengths are not consistent from frame-to-frame.
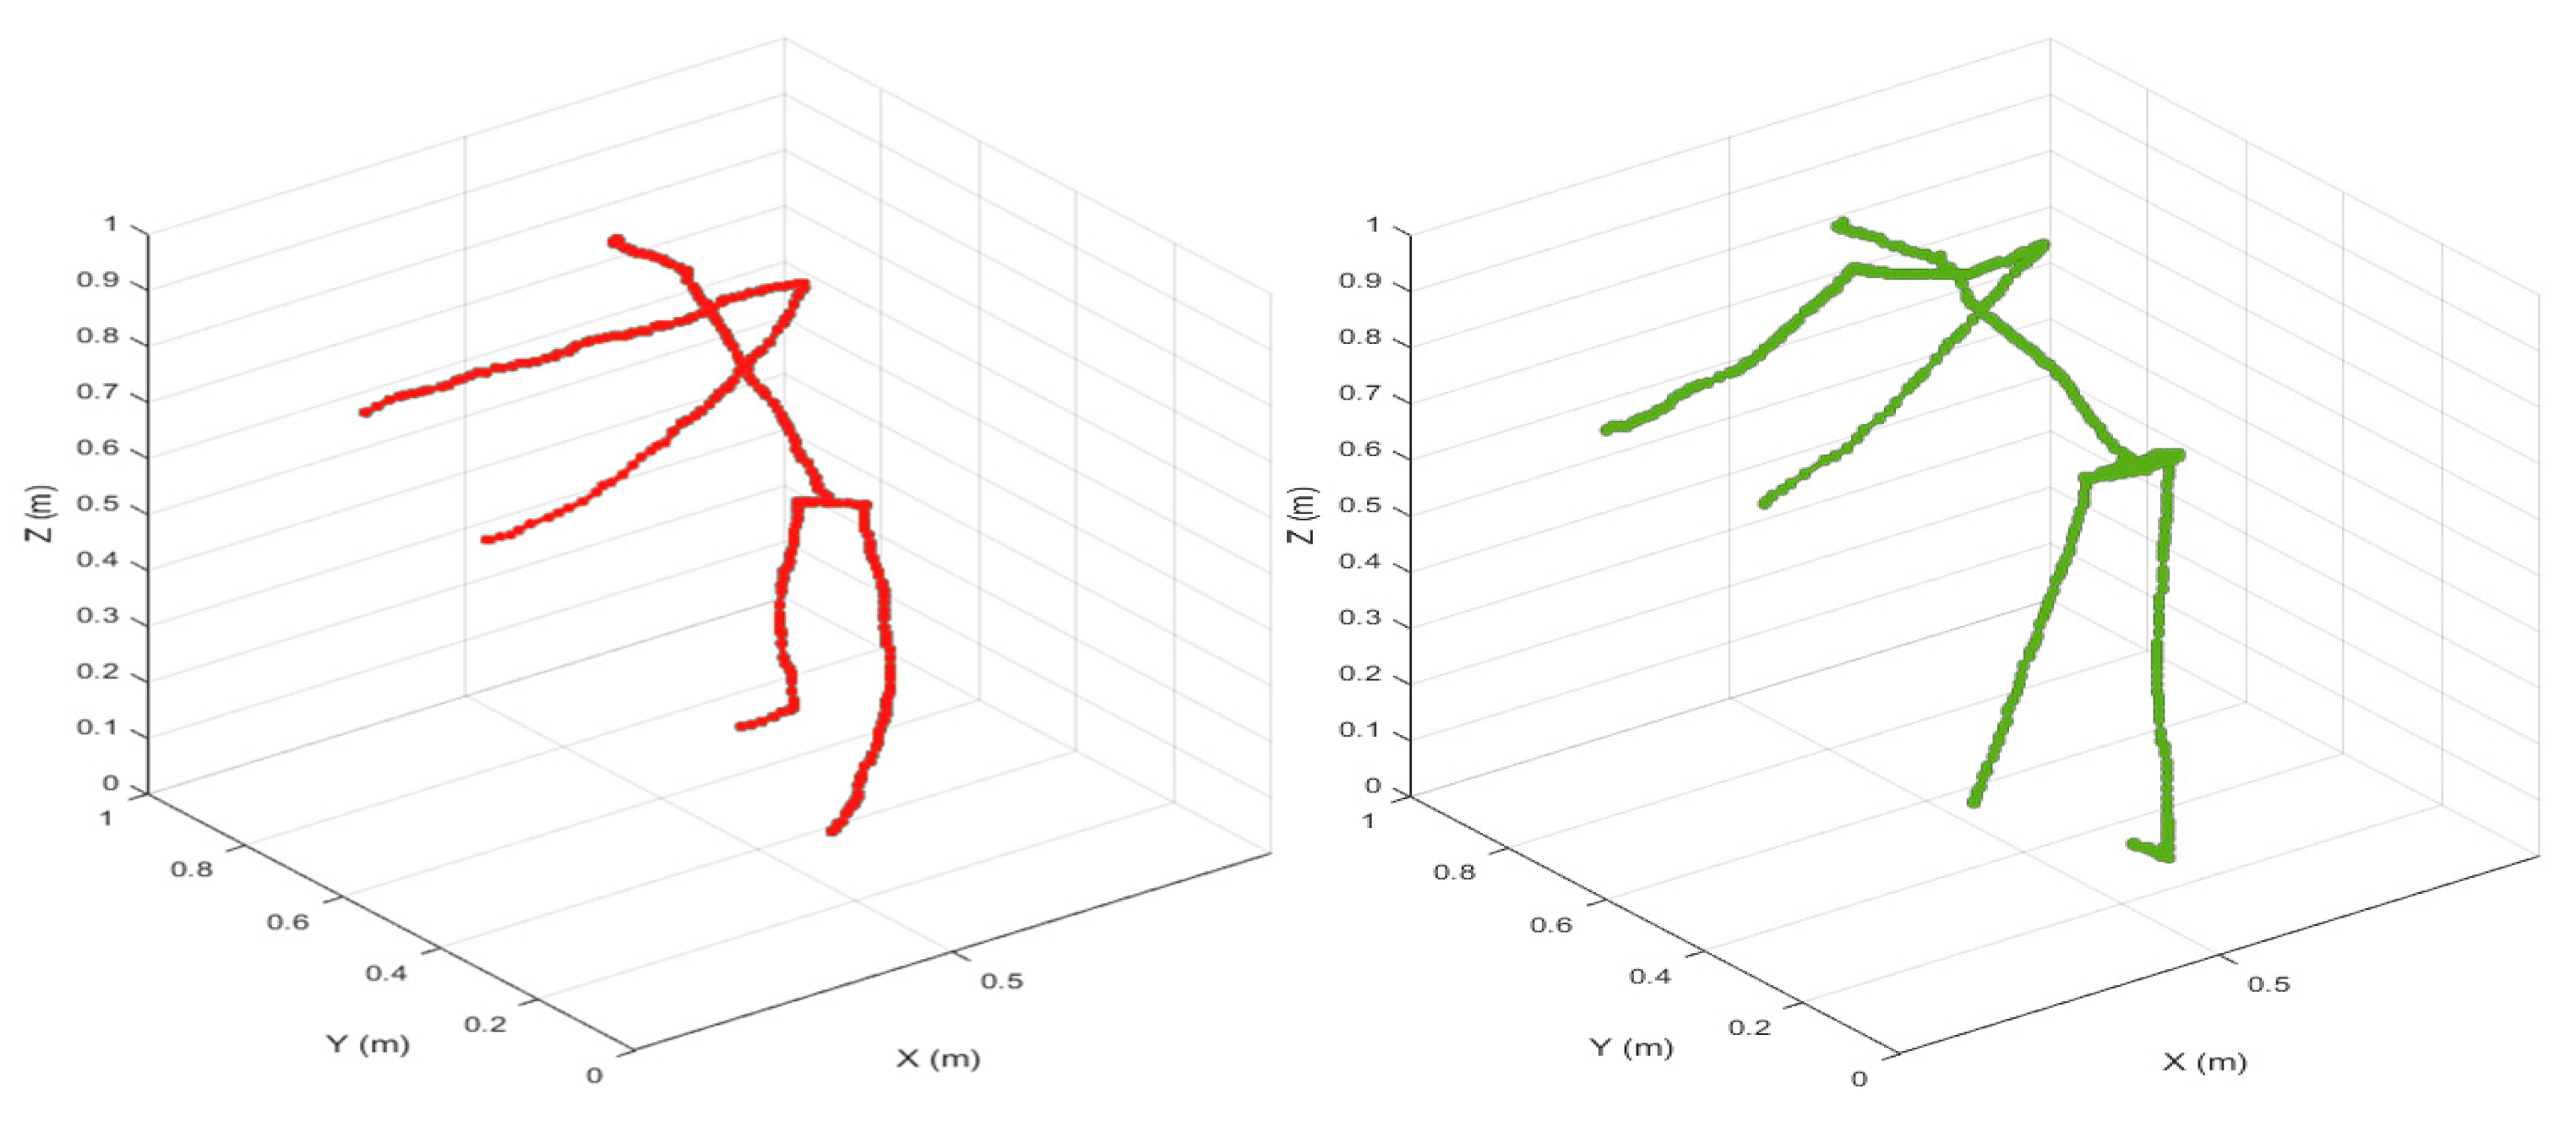
When tested on a specific subject, the advantages of using RFID and vision-based technologies rather than traditional ways to assess human posture become readily apparent. A comparison of the two approaches is shown in
Figure 13,
Figure 14,
Figure 15 and
Figure 16, which depicts the situation in which an untrained individual is executing four predetermined pose activities (that is, walking, standing, bending, and sitting, respectively).
In
Figure 13,
Figure 14,
Figure 15 and
Figure 16, the skeleton in red represents an entity that was generated in 3D format using RFID data, and the skeleton in green represents data from a Kinect sensor to determine the error estimation differences between the two types of data. Both of these images illustrate that the skeletons that were reconstructed using RFID and vision-based approaches were extremely comparable to the corresponding ground-truth data. The training data includes validation on four activities that correspond to the following different human poses: walking, standing, bending, and sitting. As seen in
Figure 17, the green circles are the reconstructed RFID data, whereas the red dots are the supervised training data.
Illustration of the estimation inaccuracy for different body positions, including walking, standing, bending, and sitting, are shown in
Figure 18. The performance was judged based on the nature of this inaccuracy. The precision of the pose estimate depends on the motion being tracked, as indicated in the figure. The biggest inaccuracy occurred when tracking walking action (3.46 cm), while the lowest error was encountered when analyzing sitting position (3.00 cm). The fact that the model has various issues with the joints in its torso is the key factor that contributes to these defects in the model. However, RFID-based Pose is still accurate for all activities, and the biggest error throughout all tests is relatively smaller than the biggest error that the emerging RFID pose approximation technique can produce. This demonstrates that RFID-Pose is an advancement above the technique that was used previously, i.e., 4.55 cm [
20]. The estimation demonstrates that the new RFID-based Pose system can more accurately forecast joint angles and reconstitute the whole body’s pose in motion by using RFID phase data. This is reflected in the fact that the device is capable of carrying out the task in question without any problems. The RFID-Pose system had fewer estimation errors than the old method for most motions during validation. This was the situation with every single one of the moves, with the exception of one.
Referring to Equation (16), we calculated the features corresponding to each human pose. The features are mean (m), variance (v), standard deviation (sd), and average deviation (ad) calculation based on peak values as shown in
Table 2. The features data are than fed into our neural network as an input, as shown in
Figure 19.
To validate our model, a number of the hidden layer neurons are selected for the desired result at the output layer. For human pose estimation, the defined output vector classes are written as follows:
[1; 0; 0; 0]: Human Natural Activity;
[0; 1; 0; 0]: Human Pose Activity;
[0; 0; 1; 0]: Unknown Human Pose;
[0; 0; 0; 1]: No Activity.
A multi-layer feed-forward neural network (FFNN) method is used in this paper for the estimation of human poses. The proposed architecture of ANN for a single hand gesture is presented in
Figure 20. Whereas,
Table 3 shows the brief explanation and ANN layer setup information.
In this research, three distinct ANN architectures ([4 × 10 × 3], [4 × 20 × 3], and [4 × 30 × 3]) were tested as training tools with the aim of selecting the most suitable hidden layer neuronsas shown in
Figure 21. In order to attain the desired result at an acceptable error rate, the hidden layer weights were adjusted until the end result was reached at a reasonable epoch number, as shown in
Table 4.
Table 4 demonstrates that, when compared to alternative ANN architectures, the one chosen [4 × 20 × 3] has higher mean squared error (MSE) efficiency at a suitable number of epochs and error rate.
After the selection of suitable architecture, we can calculate the accuracy using the confusion matrix (CM). Adjusting the hidden layer in the ANN architecture allows the features’ input values to be incorporated into the CM’s construction.
Figure 22 depicts the confusion matrices for walking, sitting, standing, and bending activities.
Each corner cell in the preceding figure depicts a pattern case of an activity that was successfully tested through the proposed ANN architecture used to determine the estimation of human poses. The confusion grid in the confusion matrices graph stores the features-processed training data between the target and output classes, with each of the three phases (preparation, testing, and training) of human pose estimation and individual performance measurement of the ANN architecture comprising its own confusion matrix. From
Figure 22, we can see that the walking activity achieved a maximum accuracy rate of 97.8% with only a 2.2% error rate, demonstrating the processing time efficiency of the ANN architecture. Whereas, standing activity achieved a maximum accuracy rate of 97.2% with only a 2.8% error rate, bending activity achieved a maximum accuracy rate of 96.3% with only a 3.7% error rate, and sitting activity achieved a maximum accuracy rate of 96.3% with only a 3.7% error rate.
Figure 23 shows the overall confusion matrix across all activities. To illustrate the thoroughness of the testing procedure for data validity, four target and vertical output classes were defined to cover the variety of attainable values for the sampled features. Groups of data that have been correctly classified after going through the CM grid’s training process are represented by green cells. Each horizontal grey corner cell represents a set of training data that has been successfully tested for its ability to be classified into one of several predefined classes. The red cell displays the data sets that have been incorrectly classified or may not have been adequately validated during the testing phase.
As a final measure, the blue cell displays the sum of all test cases from activities that were correctly classified. Confusion matrices diagrams make it clear that all classes were tested on at least 1200 test instances, with error rates of less than 1% across all trained datasets, as indicated by the percentages displayed in the green cells. Overall, the blue cell achieved a maximum accuracy rate of 96.7% with only a 3.3% error rate, demonstrating the processing time efficiency of the ANN architecture.
Comparison with Baseline Scheme
Finally, a cutting-edge baseline method, namely a meta-learning-based RFID pose tracking system [
20], was used to conduct a comparative study. Our research uses the laboratory-collected training and testing dataset.
Figure 24 shows the estimation error for each of the different poses. The graph verifies that the performance of both systems is comparable. However, the Meta-learning Pose, when applied to the three unknown poses (i.e., standing, sitting, and bending), generates relatively larger errors. These findings show that the proposed estimation method identifies more accurate initial estimation variables for the new data domains than Meta-Pose.
Figure 24 demonstrates, in addition, that RFID-based pose estimation was able to obtain a greater level of precision while tracking the whole human body than the conventional methods. This is because, when testing different people, the RFID-Pose system works better when cross-skeleton training is used. However, sometimes, traditional joint estimation methods compromise pose recognition accuracy when used to identify skeleton foot position.
The mean estimation error in each untrained data domain is shown in
Table 5. The table shows that Meta-Pose has an average error of 4.28 cm across all of the new data domains, while the proposed RFID-based method has an average error of 3.19 cm. In addition, we find that the Meta-Pose estimation error for untrained data domains is still larger.
The estimation error for each tagged joint is shown in
Figure 25. The joints were numbered from 1 to 8 in the following order: head, right shoulder, left shoulder, torso, left hand, right hand, right foot, and left foot joints. The left and right foot estimation errors were over 3.9 cm for both approaches. This significantly higher set of errors can be attributed, in large part, to the kinematic technique as well as the positioning of the sensors. When computing the location of a joint based on the position of its parent joint, the mistakes from the previous joints will accrue. Because of this, the estimation error of the torso will affect the accuracy of both feet.


 ,
, 


