
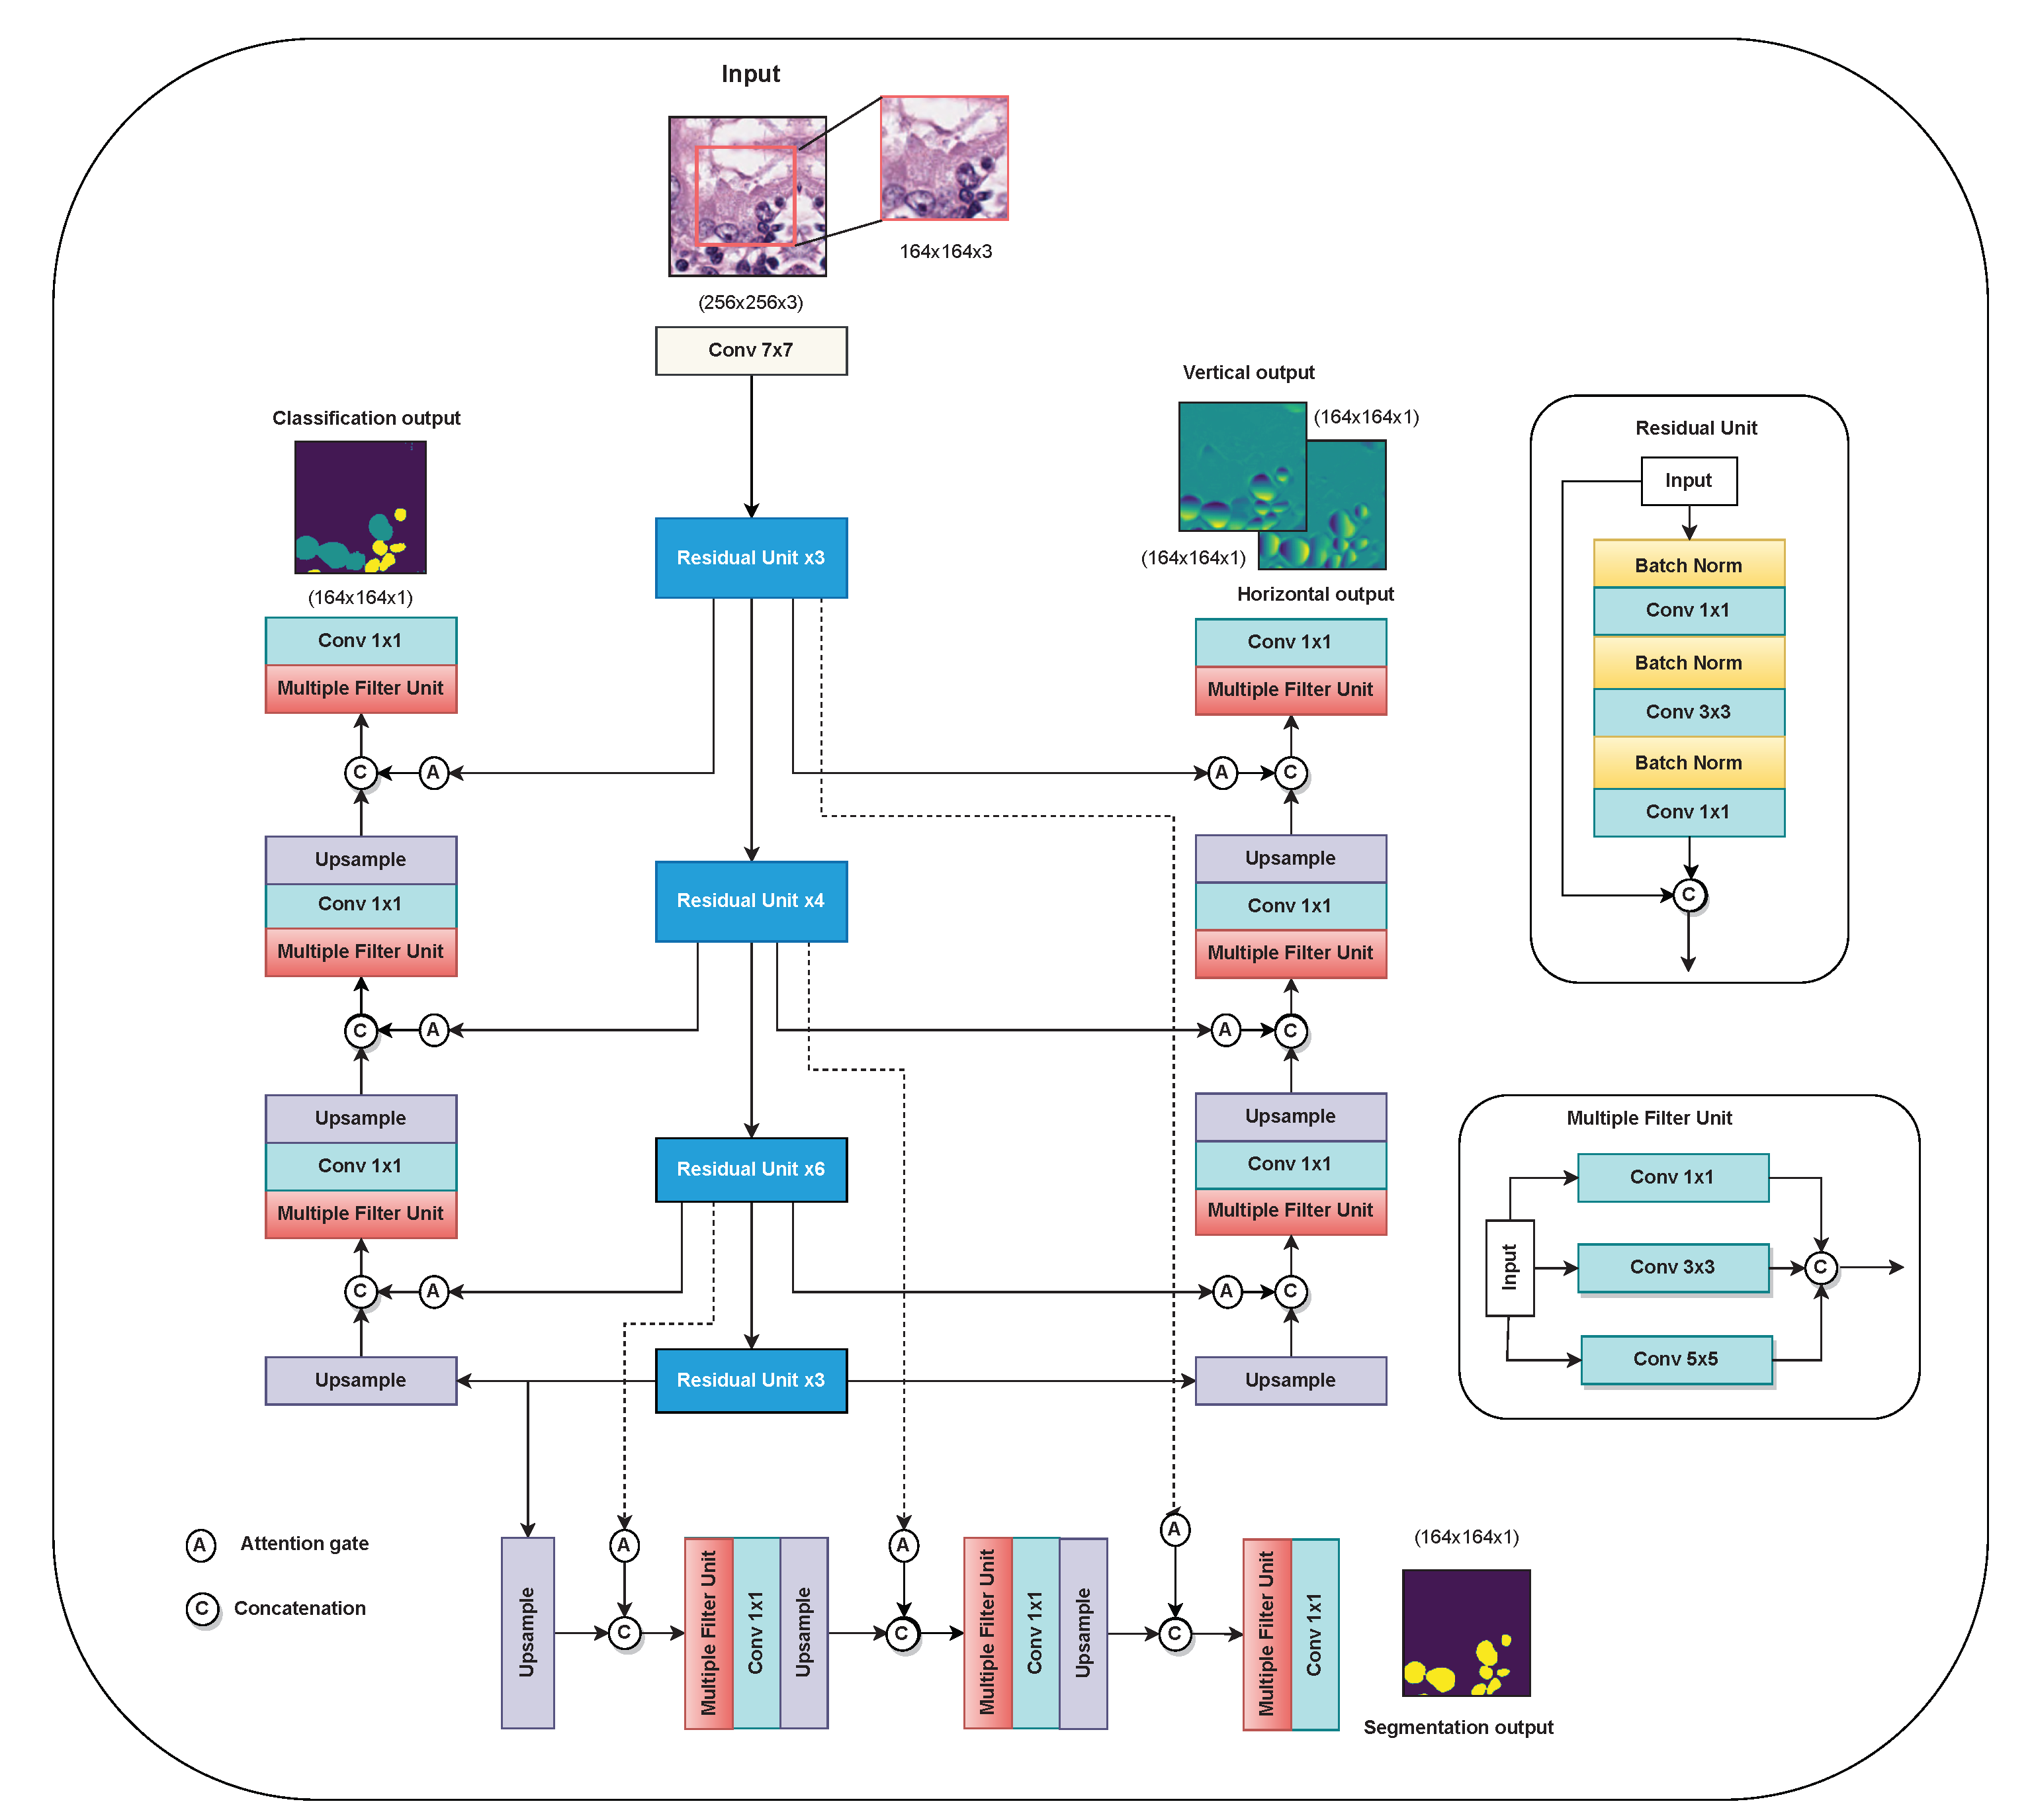
Mulvernet: Nucleus Segmentation and Classification of Pathology Images Using the HoVer-Net and Multiple Filter Units
Abstract
:1. Introduction
2. Materials and Methods
2.1. Multiple Filter Unit
2.2. Attention Gate
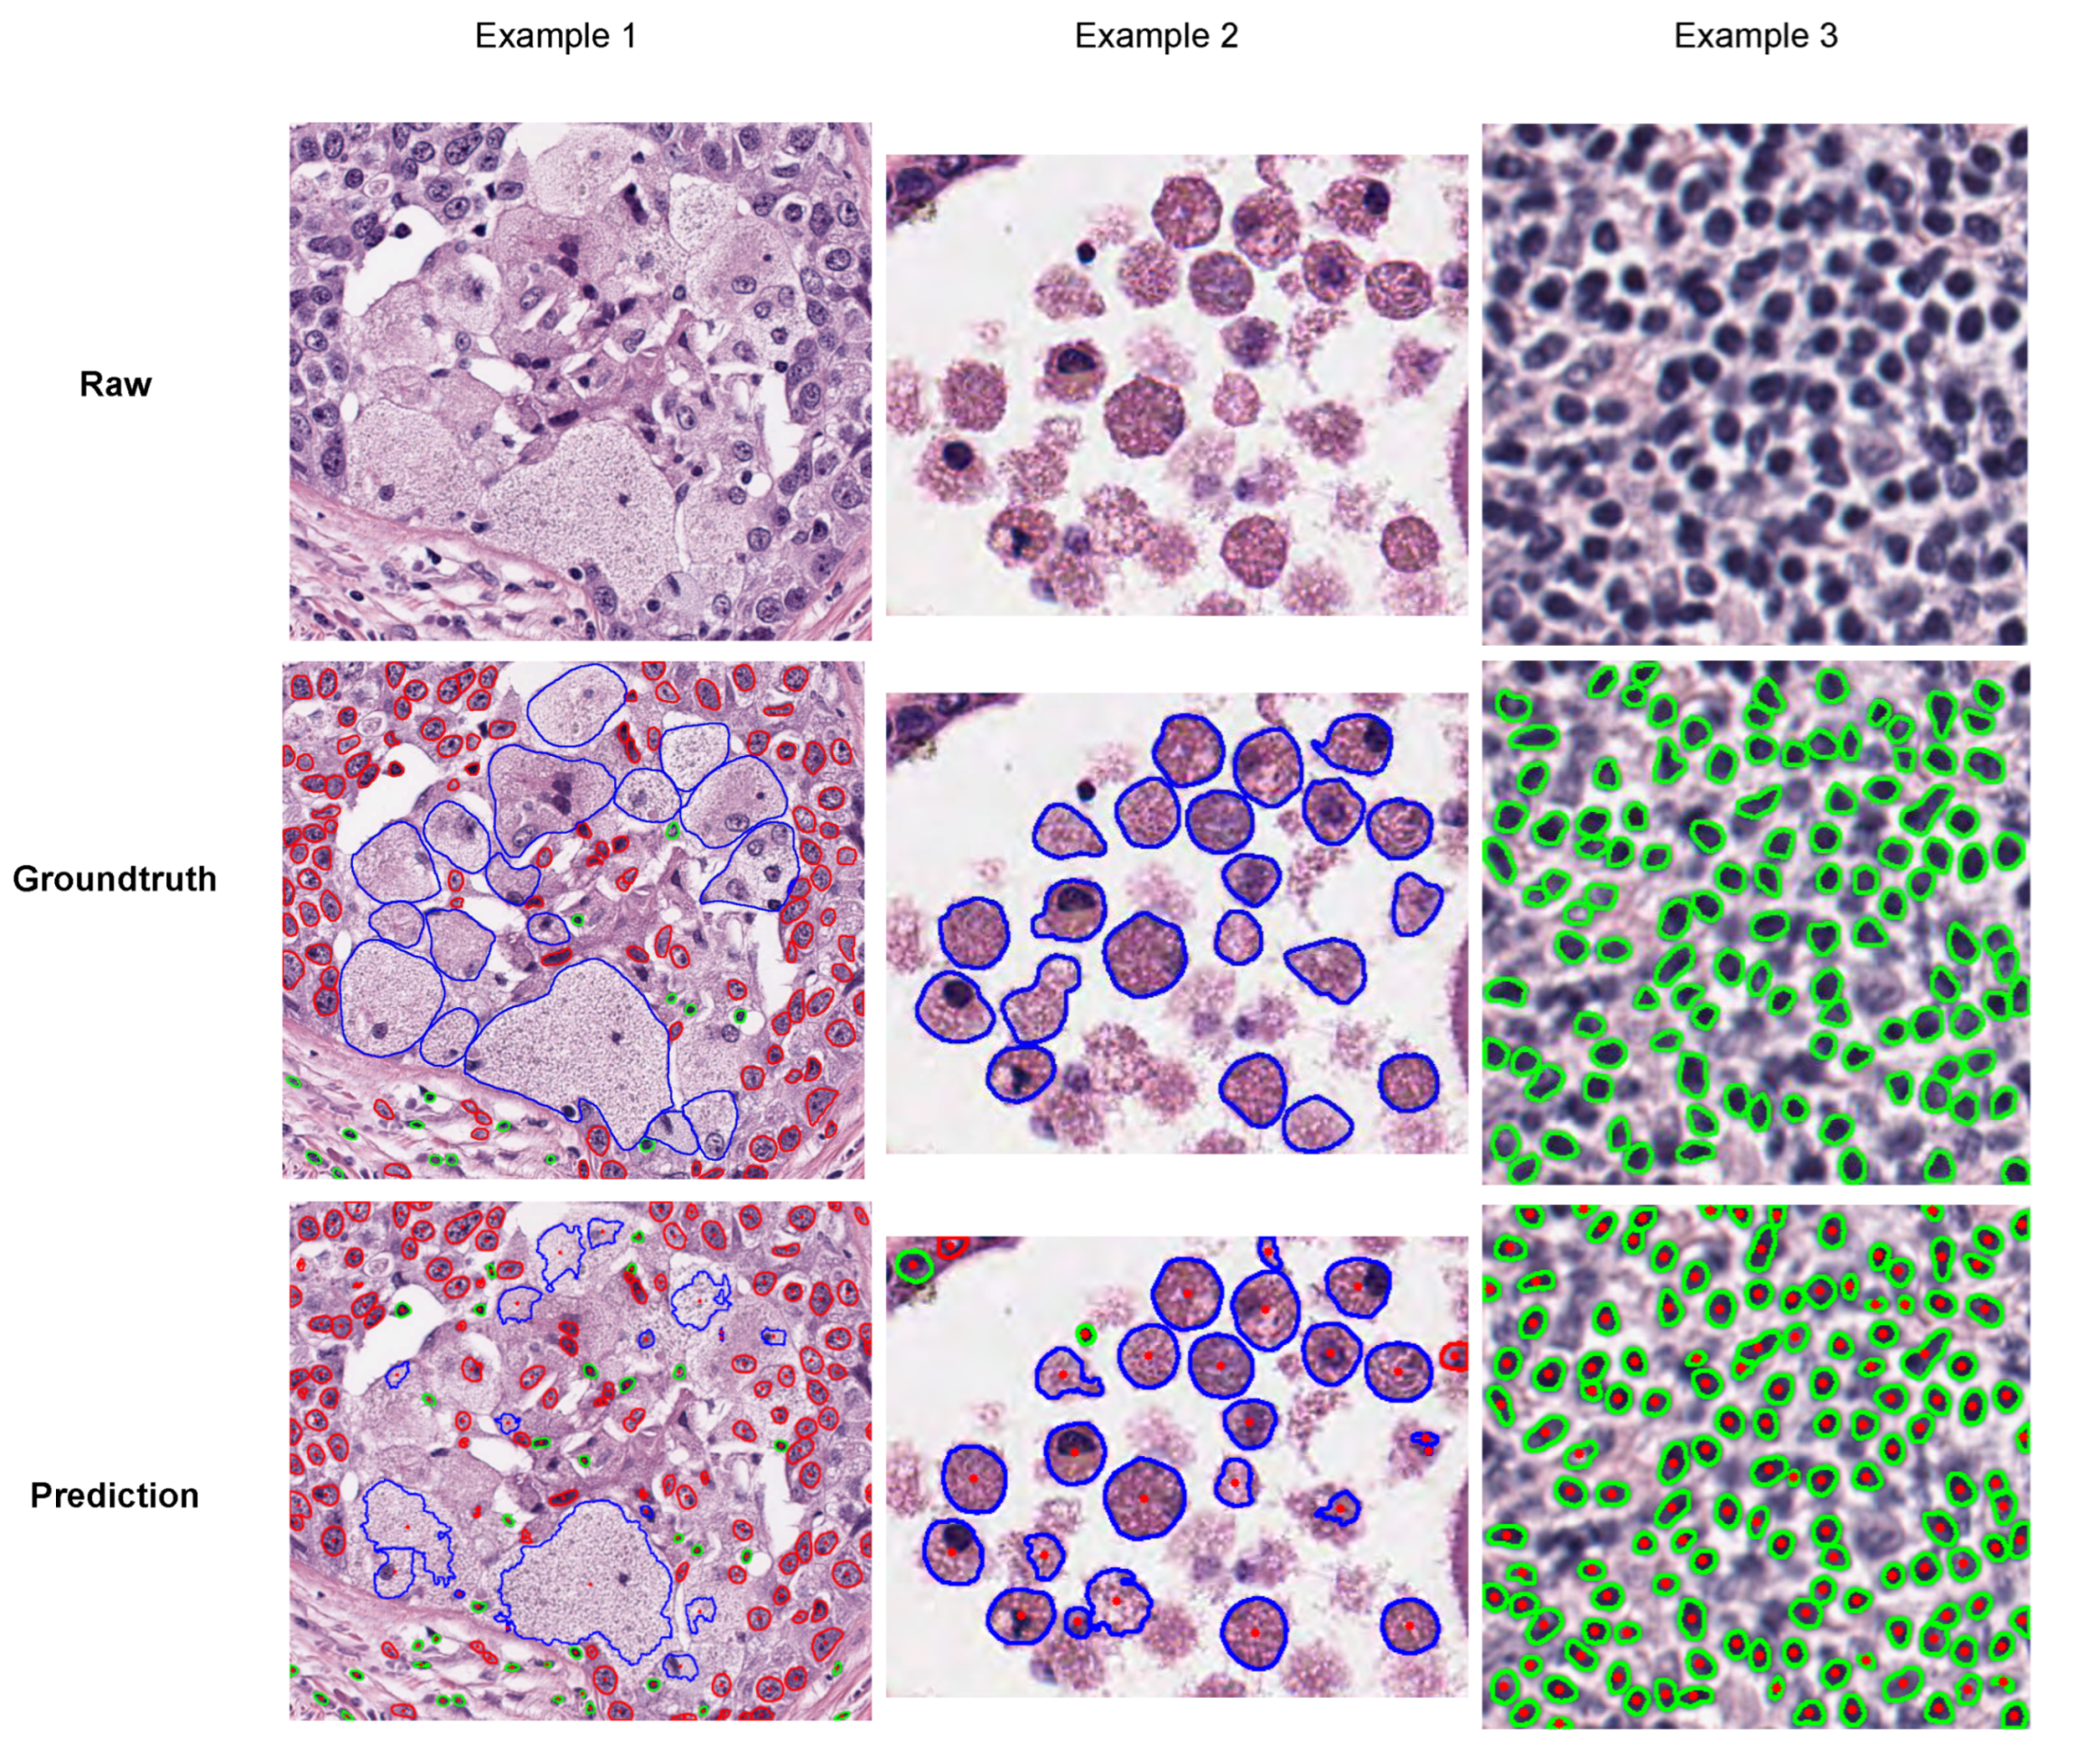
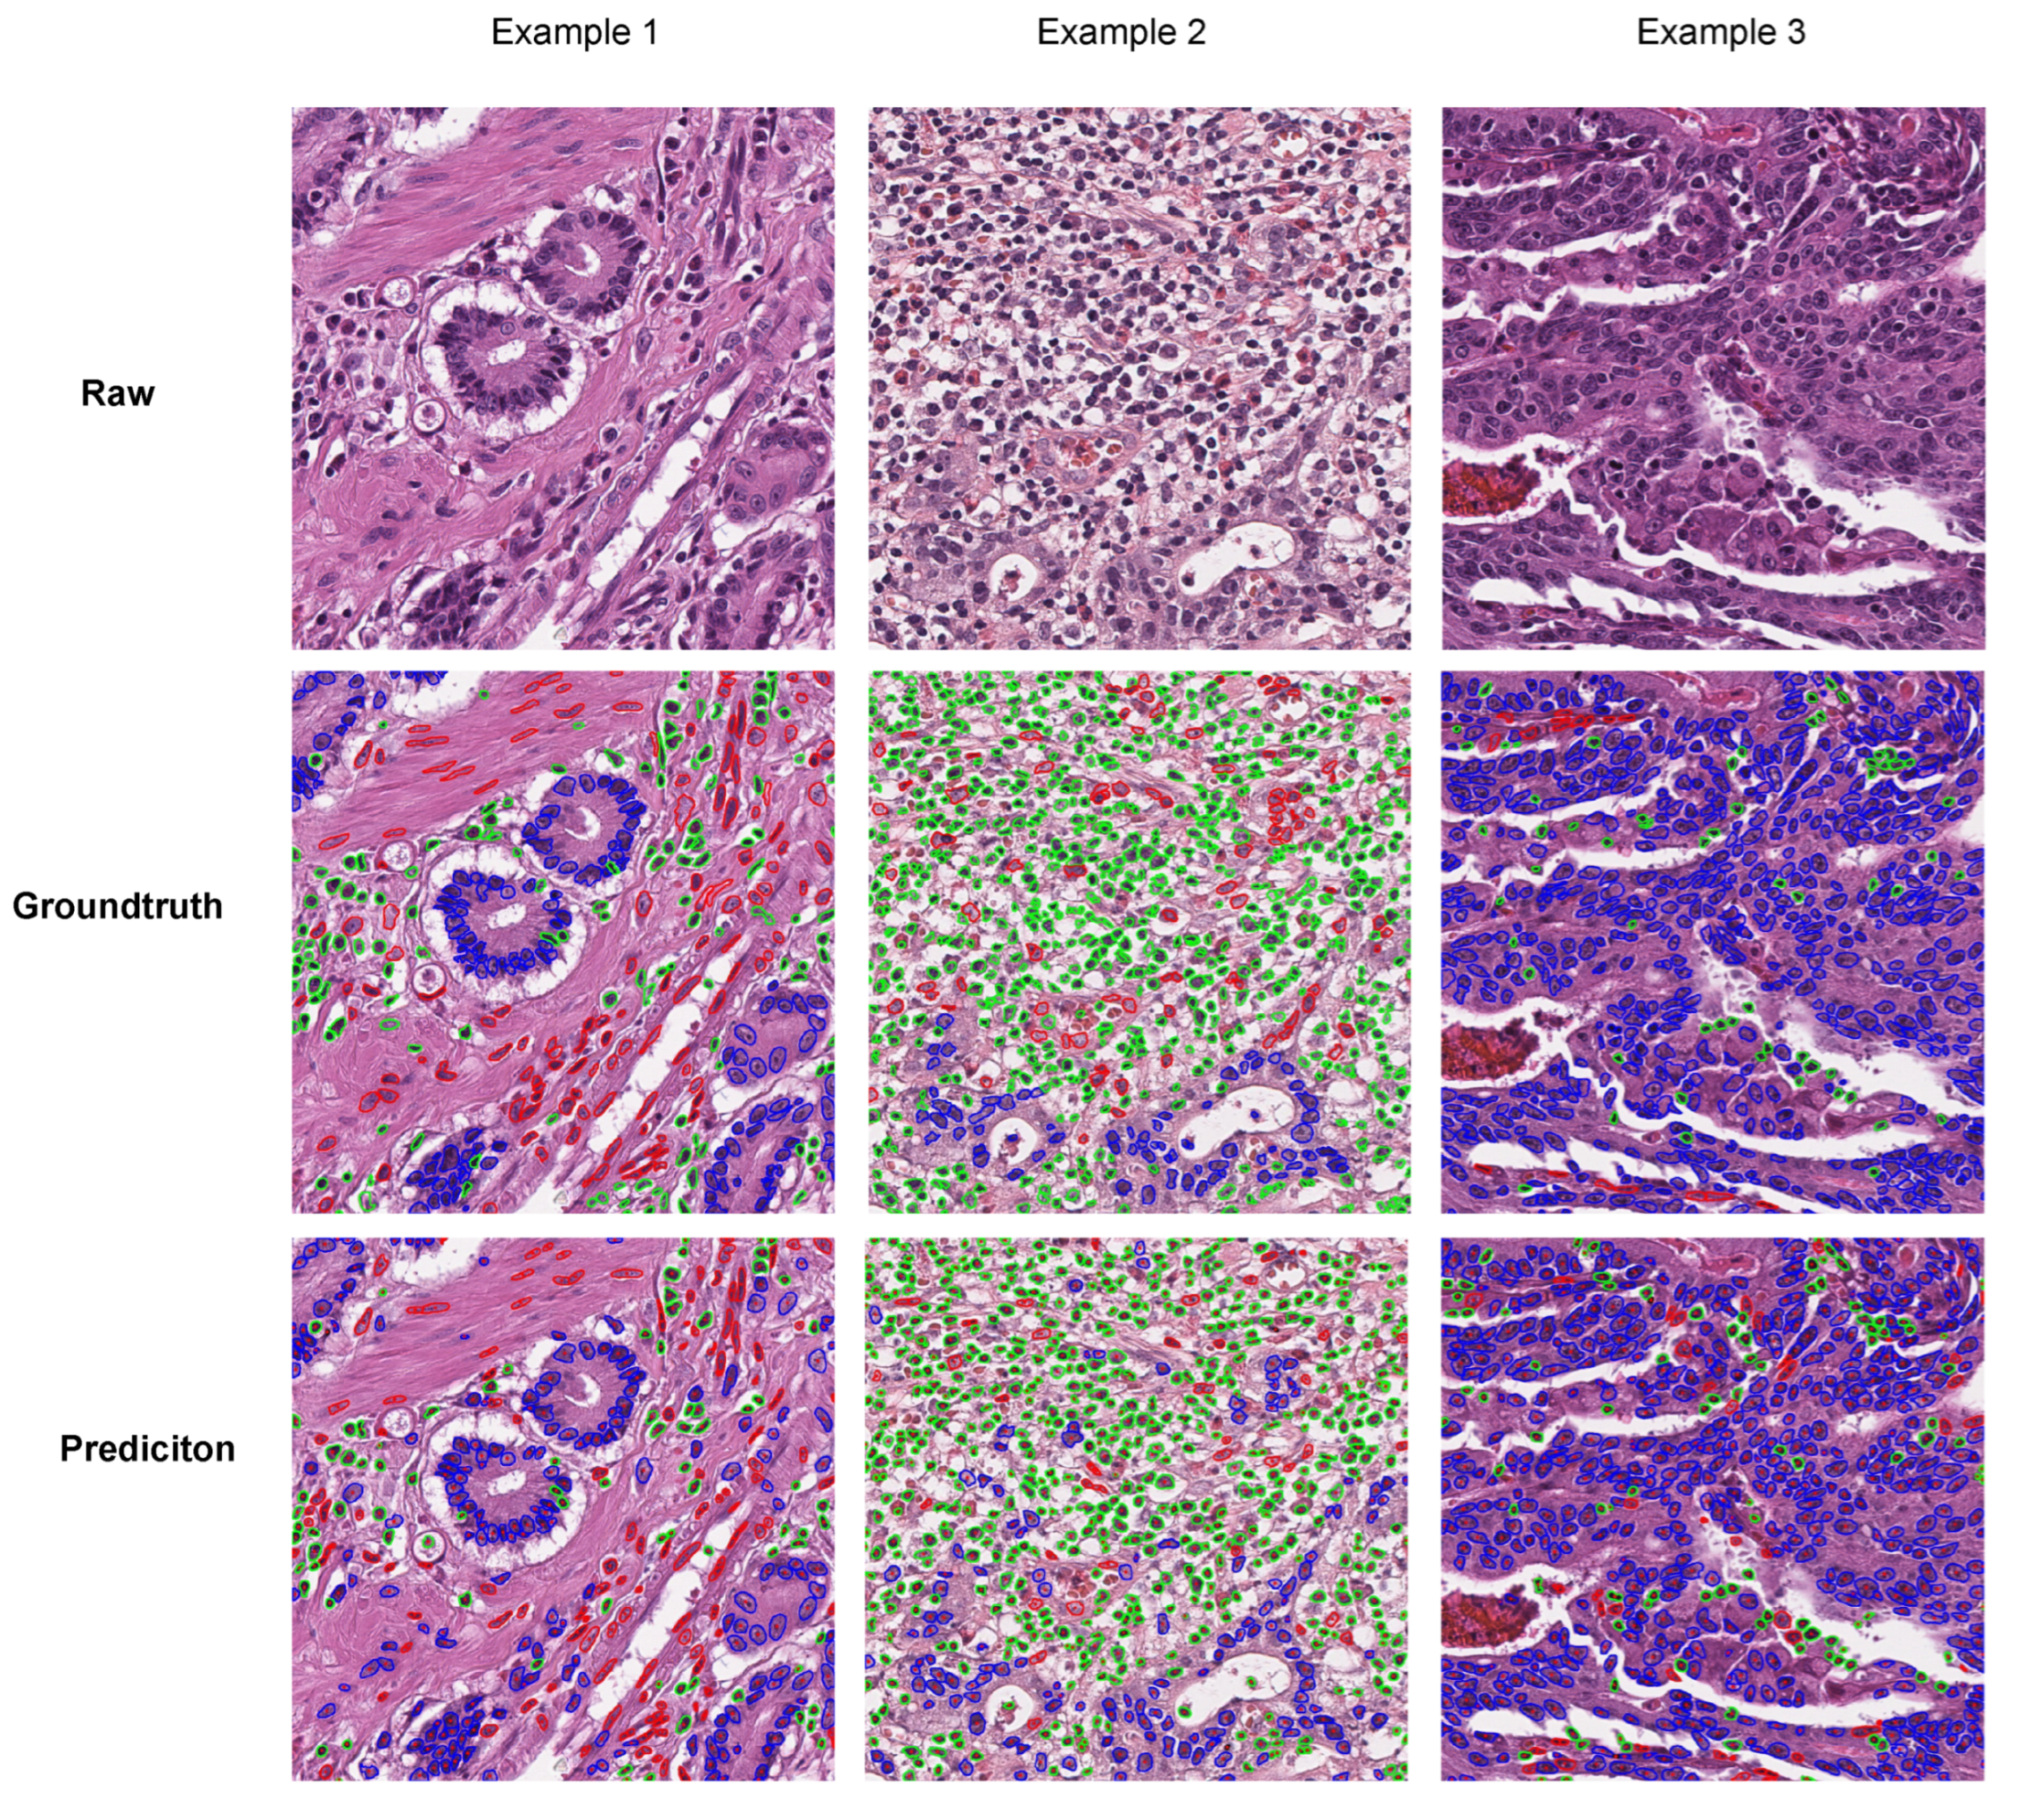
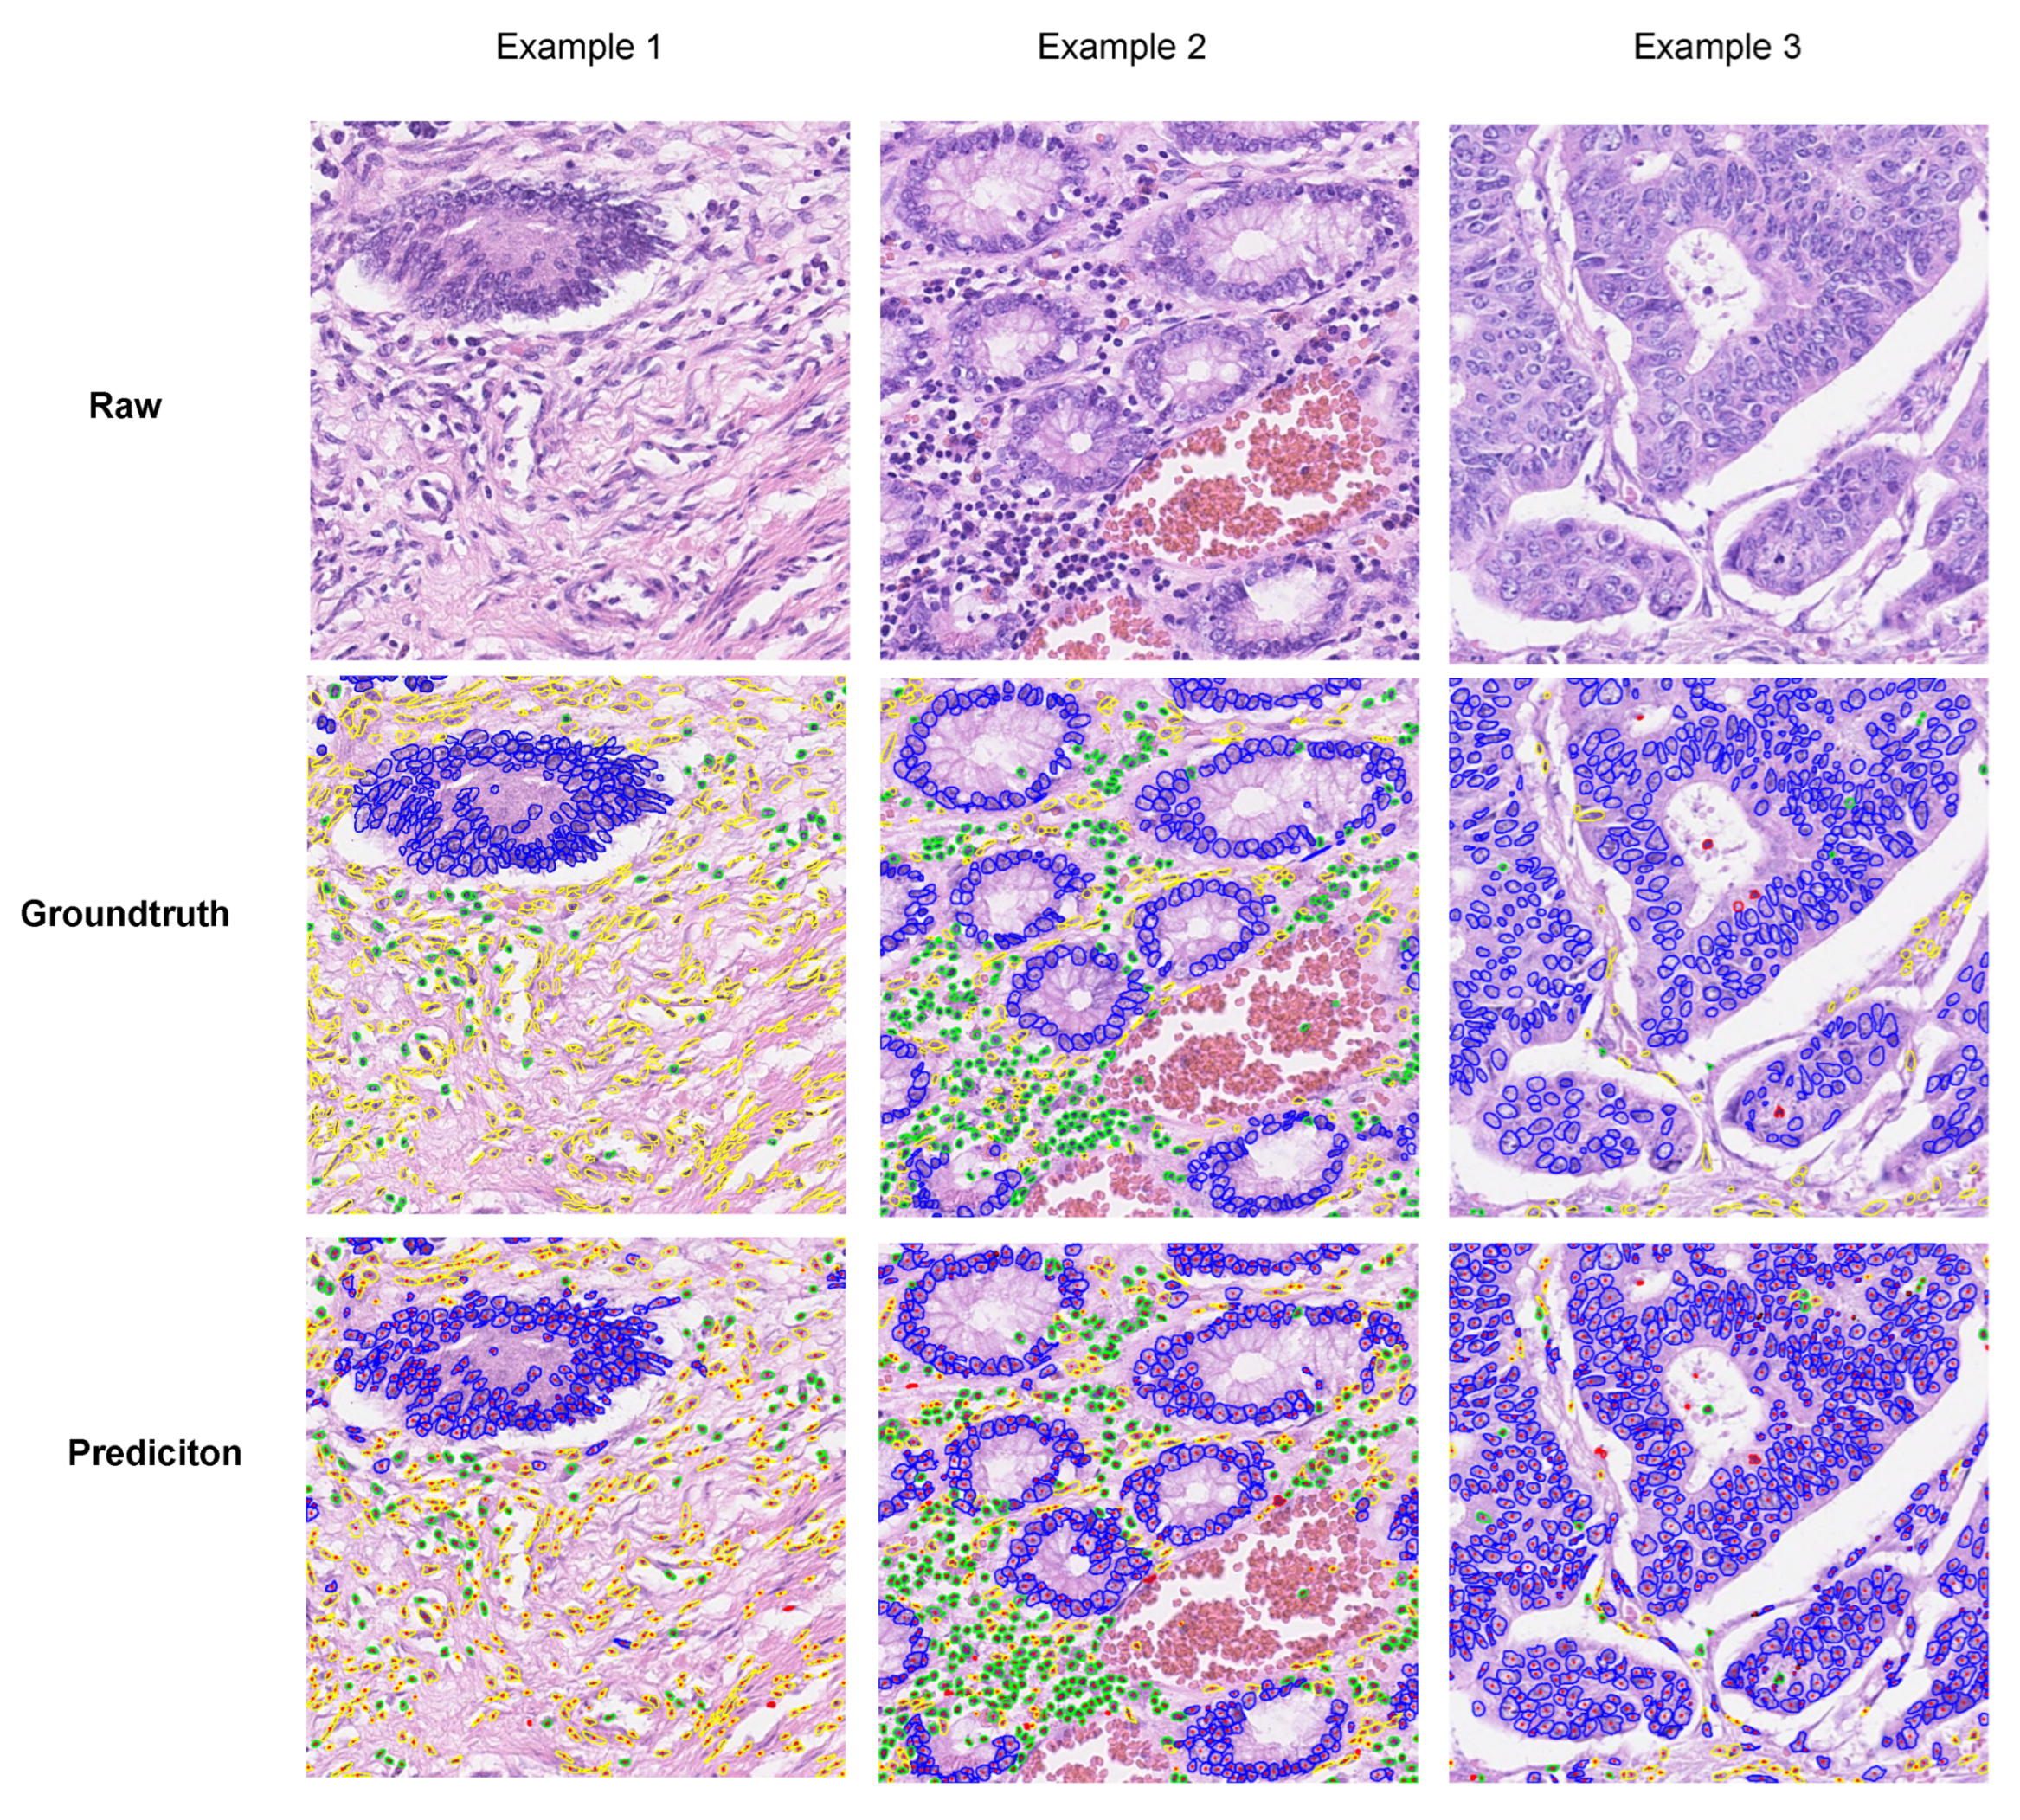
3. Results
3.1. Datasets
3.2. Evaluation Metrics
3.3. Comparative Experiments
3.4. Ablation Experiments
3.5. Implementation
4. Discussion
5. Conclusions
Author Contributions
Funding
Data Availability Statement
Conflicts of Interest
References
- Lu, C.; Romo-Bucheli, D.; Wang, X.; Janowczyk, A.; Ganesan, S.; Gilmore, H.; Rimm, D.; Madabhushi, A. Nuclear shape and orientation features from H&E images predict survival in early-stage estrogen receptor-positive breast cancers. Lab. Investig. 2018, 98, 1438–1448. [Google Scholar] [PubMed] [Green Version]
- Alsubaie, N.; Sirinukunwattana, K.; Raza, S.E.A.; Snead, D.; Rajpoot, N. A bottom-up approach for tumour differentiation in whole slide images of lung adenocarcinoma. In Proceedings of the SPIE Medical Imaging—Medical Imaging 2018: Digital Pathology, Houston, TX, USA, 10–15 February 2018; SPIE: Bellingham, WA, USA, 2018; Volume 10581, pp. 104–113. [Google Scholar]
- Sirinukunwattana, K.; Snead, D.; Epstein, D.; Aftab, Z.; Mujeeb, I.; Tsang, Y.W.; Cree, I.; Rajpoot, N. Novel digital signatures of tissue phenotypes for predicting distant metastasis in colorectal cancer. Sci. Rep. 2018, 8, 13692. [Google Scholar] [CrossRef] [PubMed] [Green Version]
- Javed, S.; Mahmood, A.; Fraz, M.M.; Koohbanani, N.A.; Benes, K.; Tsang, Y.W.; Hewitt, K.; Epstein, D.; Snead, D.; Rajpoot, N. Cellular community detection for tissue phenotyping in colorectal cancer histology images. Med. Image Anal. 2020, 63, 101696. [Google Scholar] [CrossRef] [PubMed]
- Veta, M.; Van Diest, P.J.; Kornegoor, R.; Huisman, A.; Viergever, M.A.; Pluim, J.P. Automatic nuclei segmentation in H&E stained breast cancer histopathology images. PLoS ONE 2013, 8, e70221. [Google Scholar]
- Chang, C.S.; Ding, J.J.; Wu, Y.F.; Lin, S.J. Cell segmentation algorithm using double thresholding with morphology-based techniques. In Proceedings of the 2018 IEEE International Conference on Consumer Electronics-Taiwan (ICCE-TW), Taichung, Taiwan, 19–21 May 2018; pp. 1–5. [Google Scholar]
- Litjens, G.; Kooi, T.; Bejnordi, B.E.; Setio, A.A.A.; Ciompi, F.; Ghafoorian, M.; van der Laak, J.A.W.M.; van Ginneken, B.; Sánchez, C.I. A survey on deep learning in medical image analysis. Med. Image Anal. 2017, 42, 60–88. [Google Scholar] [CrossRef] [Green Version]
- Shen, D.; Wu, G.; Suk, H.I. Deep learning in medical image analysis. Annu. Rev. Biomed. Eng. 2017, 19, 221. [Google Scholar] [CrossRef] [Green Version]
- Naylor, P.; Laé, M.; Reyal, F.; Walter, T. Segmentation of nuclei in histopathology images by deep regression of the distance map. IEEE Trans. Med. Imaging 2018, 38, 448–459. [Google Scholar] [CrossRef]
- Liu, X.; Guo, Z.; Li, B.; Cao, J. Nuclei segmentation by using convolutional network with distance map and contour information. In Proceedings of the Eleventh Asian Conference on Machine Learning, Nagoya, Japan, 17–19 November 2019; PMLR: London, UK, 2019; pp. 972–986. [Google Scholar]
- Graham, S.; Epstein, D.; Rajpoot, N. Dense steerable filter cnns for exploiting rotational symmetry in histology images. IEEE Trans. Med. Imaging 2020, 39, 4124–4136. [Google Scholar] [CrossRef]
- Wienert, S.; Heim, D.; Saeger, K.; Stenzinger, A.; Beil, M.; Hufnagl, P.; Dietel, M.; Denkert, C.; Klauschen, F. Detection and segmentation of cell nuclei in virtual microscopy images: A minimum-model approach. Sci. Rep. 2012, 2, 503. [Google Scholar] [CrossRef] [Green Version]
- Nguyen, K.; Jain, A.K.; Sabata, B. Prostate cancer detection: Fusion of cytological and textural features. J. Pathol. Inform. 2011, 2, 3. [Google Scholar] [CrossRef]
- Wang, P.; Hu, X.; Li, Y.; Liu, Q.; Zhu, X. Automatic cell nuclei segmentation and classification of breast cancer histopathology images. Signal Process. 2016, 122, 1–13. [Google Scholar] [CrossRef]
- Sirinukunwattana, K.; Raza, S.E.A.; Tsang, Y.W.; Snead, D.R.; Cree, I.A.; Rajpoot, N.M. Locality sensitive deep learning for detection and classification of nuclei in routine colon cancer histology images. IEEE Trans. Med. Imaging 2016, 35, 1196–1206. [Google Scholar] [CrossRef] [PubMed] [Green Version]
- Basha, S.S.; Ghosh, S.; Babu, K.K.; Dubey, S.R.; Pulabaigari, V.; Mukherjee, S. Rccnet: An efficient convolutional neural network for histological routine colon cancer nuclei classification. In Proceedings of the 2018 15th International Conference on Control, Automation, Robotics and Vision (ICARCV), Singapore, 18–21 November 2018; pp. 1222–1227. [Google Scholar]
- Graham, S.; Vu, Q.D.; Raza, S.E.A.; Azam, A.; Tsang, Y.W.; Kwak, J.T.; Rajpoot, N. Hover-net: Simultaneous segmentation and classification of nuclei in multi-tissue histology images. Med. Image Anal. 2019, 58, 101563. [Google Scholar] [CrossRef] [Green Version]
- Vo, V.T.T.; Yang, H.J.; Lee, G.S.; Kang, S.R.; Kim, S.H. Effects of Multiple Filters on Liver Tumor Segmentation From CT Images. Front. Oncol. 2021, 11, 697178. [Google Scholar] [CrossRef] [PubMed]
- He, K.; Zhang, X.; Ren, S.; Sun, J. Identity mappings in deep residual networks. In Proceedings of the 14th European Conference–Computer Vision—ECCV 2016, Amsterdam, The Netherlands, 11–14 October 2016; Springer: Cham, Switzerland, 2016; pp. 630–645. [Google Scholar]
- Verma, R.; Kumar, N.; Patil, A.; Kurian, N.C.; Rane, S.; Graham, S.; Vu, G.D.; Zwager, M.; Raza, S.E.A.; Rajpoot, N.; et al. MoNuSAC2020: A multi-organ nuclei segmentation and classification challenge. IEEE Trans. Med. Imaging 2021, 40, 3413–3423. [Google Scholar] [CrossRef]
- Doan, T.N.; Song, B.; Vuong, T.T.; Kim, K.; Kwak, J.T. SONNET: A self-guided ordinal regression neural network for segmentation and classification of nuclei in large-scale multi-tissue histology images. IEEE J. Biomed. Health Inform. 2022, 26, 3218–3228. [Google Scholar] [CrossRef]
- Kumar, N.; Verma, R.; Sharma, S.; Bhargava, S.; Vahadane, A.; Sethi, A. A dataset and a technique for generalized nuclear segmentation for computational pathology. IEEE Trans. Med. Imaging 2017, 36, 1550–1560. [Google Scholar] [CrossRef] [PubMed]
- Kirillov, A.; He, K.; Girshick, R.; Rother, C.; Dollár, P. Panoptic segmentation. In Proceedings of the 2019 IEEE/CVF Conference on Computer Vision and Pattern Recognition (CVPR), Long Beach, CA, USA, 15–20 June 2019; pp. 9404–9413. [Google Scholar]
- Lal, S.; Das, D.; Alabhya, K.; Kanfade, A.; Kumar, A.; Kini, J. NucleiSegNet: Robust deep learning architecture for the nuclei segmentation of liver cancer histopathology images. Comput. Biol. Med. 2021, 128, 104075. [Google Scholar] [CrossRef]
- Zhao, B.; Chen, X.; Li, Z.; Yu, Z.; Yao, S.; Yan, L.; Wang, Y.; Liu, Z.; Liang, C.; Han, C. Triple U-net: Hematoxylin-aware nuclei segmentation with progressive dense feature aggregation. Med. Image Anal. 2020, 65, 101786. [Google Scholar] [CrossRef] [PubMed]
- He, K.; Gkioxari, G.; Dollár, P.; Girshick, R. Mask R-CNN. In Proceedings of the 2017 IEEE International Conference on Computer Vision (ICCV), Venice, Italy, 22–29 October 2017; pp. 2961–2969. [Google Scholar]
- Zhang, Z.; Sabuncu, M. Generalized cross entropy loss for training deep neural networks with noisy labels. In Proceedings of the 32nd International Conference on Neural Information Processing Systems, Montreal, QC, Canada, 3–8 December 2018; Volume 31. [Google Scholar]
- Li, X.; Sun, X.; Meng, Y.; Liang, J.; Wu, F.; Li, J. Dice loss for data-imbalanced NLP tasks. arXiv 2019, arXiv:1911.02855. [Google Scholar]
- Kingma, D.P.; Ba, J. Adam: A method for stochastic optimization. arXiv 2014, arXiv:1412.6980. [Google Scholar]
- Paszke, A.; Gross, S.; Chintala, S.; Chanan, G.; Yang, E.; DeVito, Z.; Lin, Z.; Desmaison, A.; Antiga, L.; Lerer, A. Automatic Differentiation in Pytorch. 2017. Available online: https://openreview.net/forum?id=BJJsrmfCZ (accessed on 15 December 2022).


| Datasets | Method | Fd | F-Epithelial | F-Lymphocyte | F-Macrophages | F-Neutrophil |
|---|---|---|---|---|---|---|
| MoNuSAC | NucleiSegNet [24] | 0.338 | 0.341 | 0.445 | 0.091 | 0.228 |
| Triple U-net [25] | 0.638 | 0.556 | 0.649 | 0.237 | 0.324 | |
| Mask-RCNN [26] | 0.839 | 0.801 | 0.804 | 0.451 | 0.472 | |
| HoVer-Net [17] | 0.825 | 0.754 | 0.803 | 0.382 | 0.387 | |
| Proposed method | 0.841 | 0.764 | 0.829 | 0.371 | 0.435 | |
| Fd | F-Epithelial | F-Lymphocyte | F-Miscellaneous | |||
| GlySAC | NucleiSegNet [24] | 0.712 | 0.369 | 0.429 | 0.115 | - |
| Triple U-net [25] | 0.728 | 0.401 | 0.463 | 0.106 | - | |
| Mask-RCNN [26] | 0.818 | 0.513 | 0.535 | 0.279 | - | |
| HoVer-Net [17] | 0.861 | 0.555 | 0.517 | 0.352 | - | |
| Proposed method | 0.864 | 0.575 | 0.568 | 0.310 | - | |
| Fd | F-Epithelial | F-Inflammatory | F-Miscellaneous | F-Spindle | ||
| CoNSeP | NucleiSegNet [24] | 0.418 | 0.310 | 0.216 | 0.098 | 0.288 |
| Triple U-net [25] | 0.632 | 0.358 | 0.561 | 0.102 | 0.438 | |
| Mask-RCNN [26] | 0.731 | 0.608 | 0.598 | 0.099 | 0.516 | |
| HoVer-Net [17] | 0.719 | 0.599 | 0.508 | 0.200 | 0.479 | |
| Proposed method | 0.736 | 0.813 | 0.340 | 0.248 | 0.517 | |
| Datasets | NucleiSegNet [24] | Triple U-Net [25] | Mask-RCNN [26] | HoVer-Net [17] | Proposed Method |
|---|---|---|---|---|---|
| MoNuSAC | 0.537 | 0.512 | 0.767 | 0.753 | 0.766 |
| GlySAC | 0.651 | 0.677 | 0.781 | 0.823 | 0.835 |
| CoNSeP | 0.744 | 0.512 | 0.767 | 0.828 | 0.833 |
| Datasets | Combinations | Fd | ACC | F-Epithelial | F-Lymphocyte | F-Macrophages | F-Neutrophil |
|---|---|---|---|---|---|---|---|
| MoNuSAC | and | 0.838 | 0.944 | 0.741 | 0.809 | 0.353 | 0.330 |
| and | 0.833 | 0.953 | 0.754 | 0.813 | 0.340 | 0.517 | |
| and and | 0.841 | 0.959 | 0.764 | 0.829 | 0.370 | 0.435 | |
| Fd | ACC | F-Miscellaneous | F-Epithelial | F-Lymphocyte | |||
| GlySAC | and | 0.861 | 0.709 | 0.297 | 0.552 | 0.549 | |
| and | 0.863 | 0.713 | 0.285 | 0.564 | 0.556 | ||
| and and | 0.864 | 0.725 | 0.310 | 0.575 | 0.568 | ||
| Fd | ACC | F-Miscellaneous | F-Inflammatory | F-Epithelial | F-Spindle | ||
| CoNSeP | and | 0.733 | 0.768 | 0.204 | 0.459 | 0.571 | 0.430 |
| and | 0.731 | 0.781 | 0.228 | 0.459 | 0.581 | 0.454 | |
| and and | 0.736 | 0.784 | 0.248 | 0.340 | 0.813 | 0.517 | |
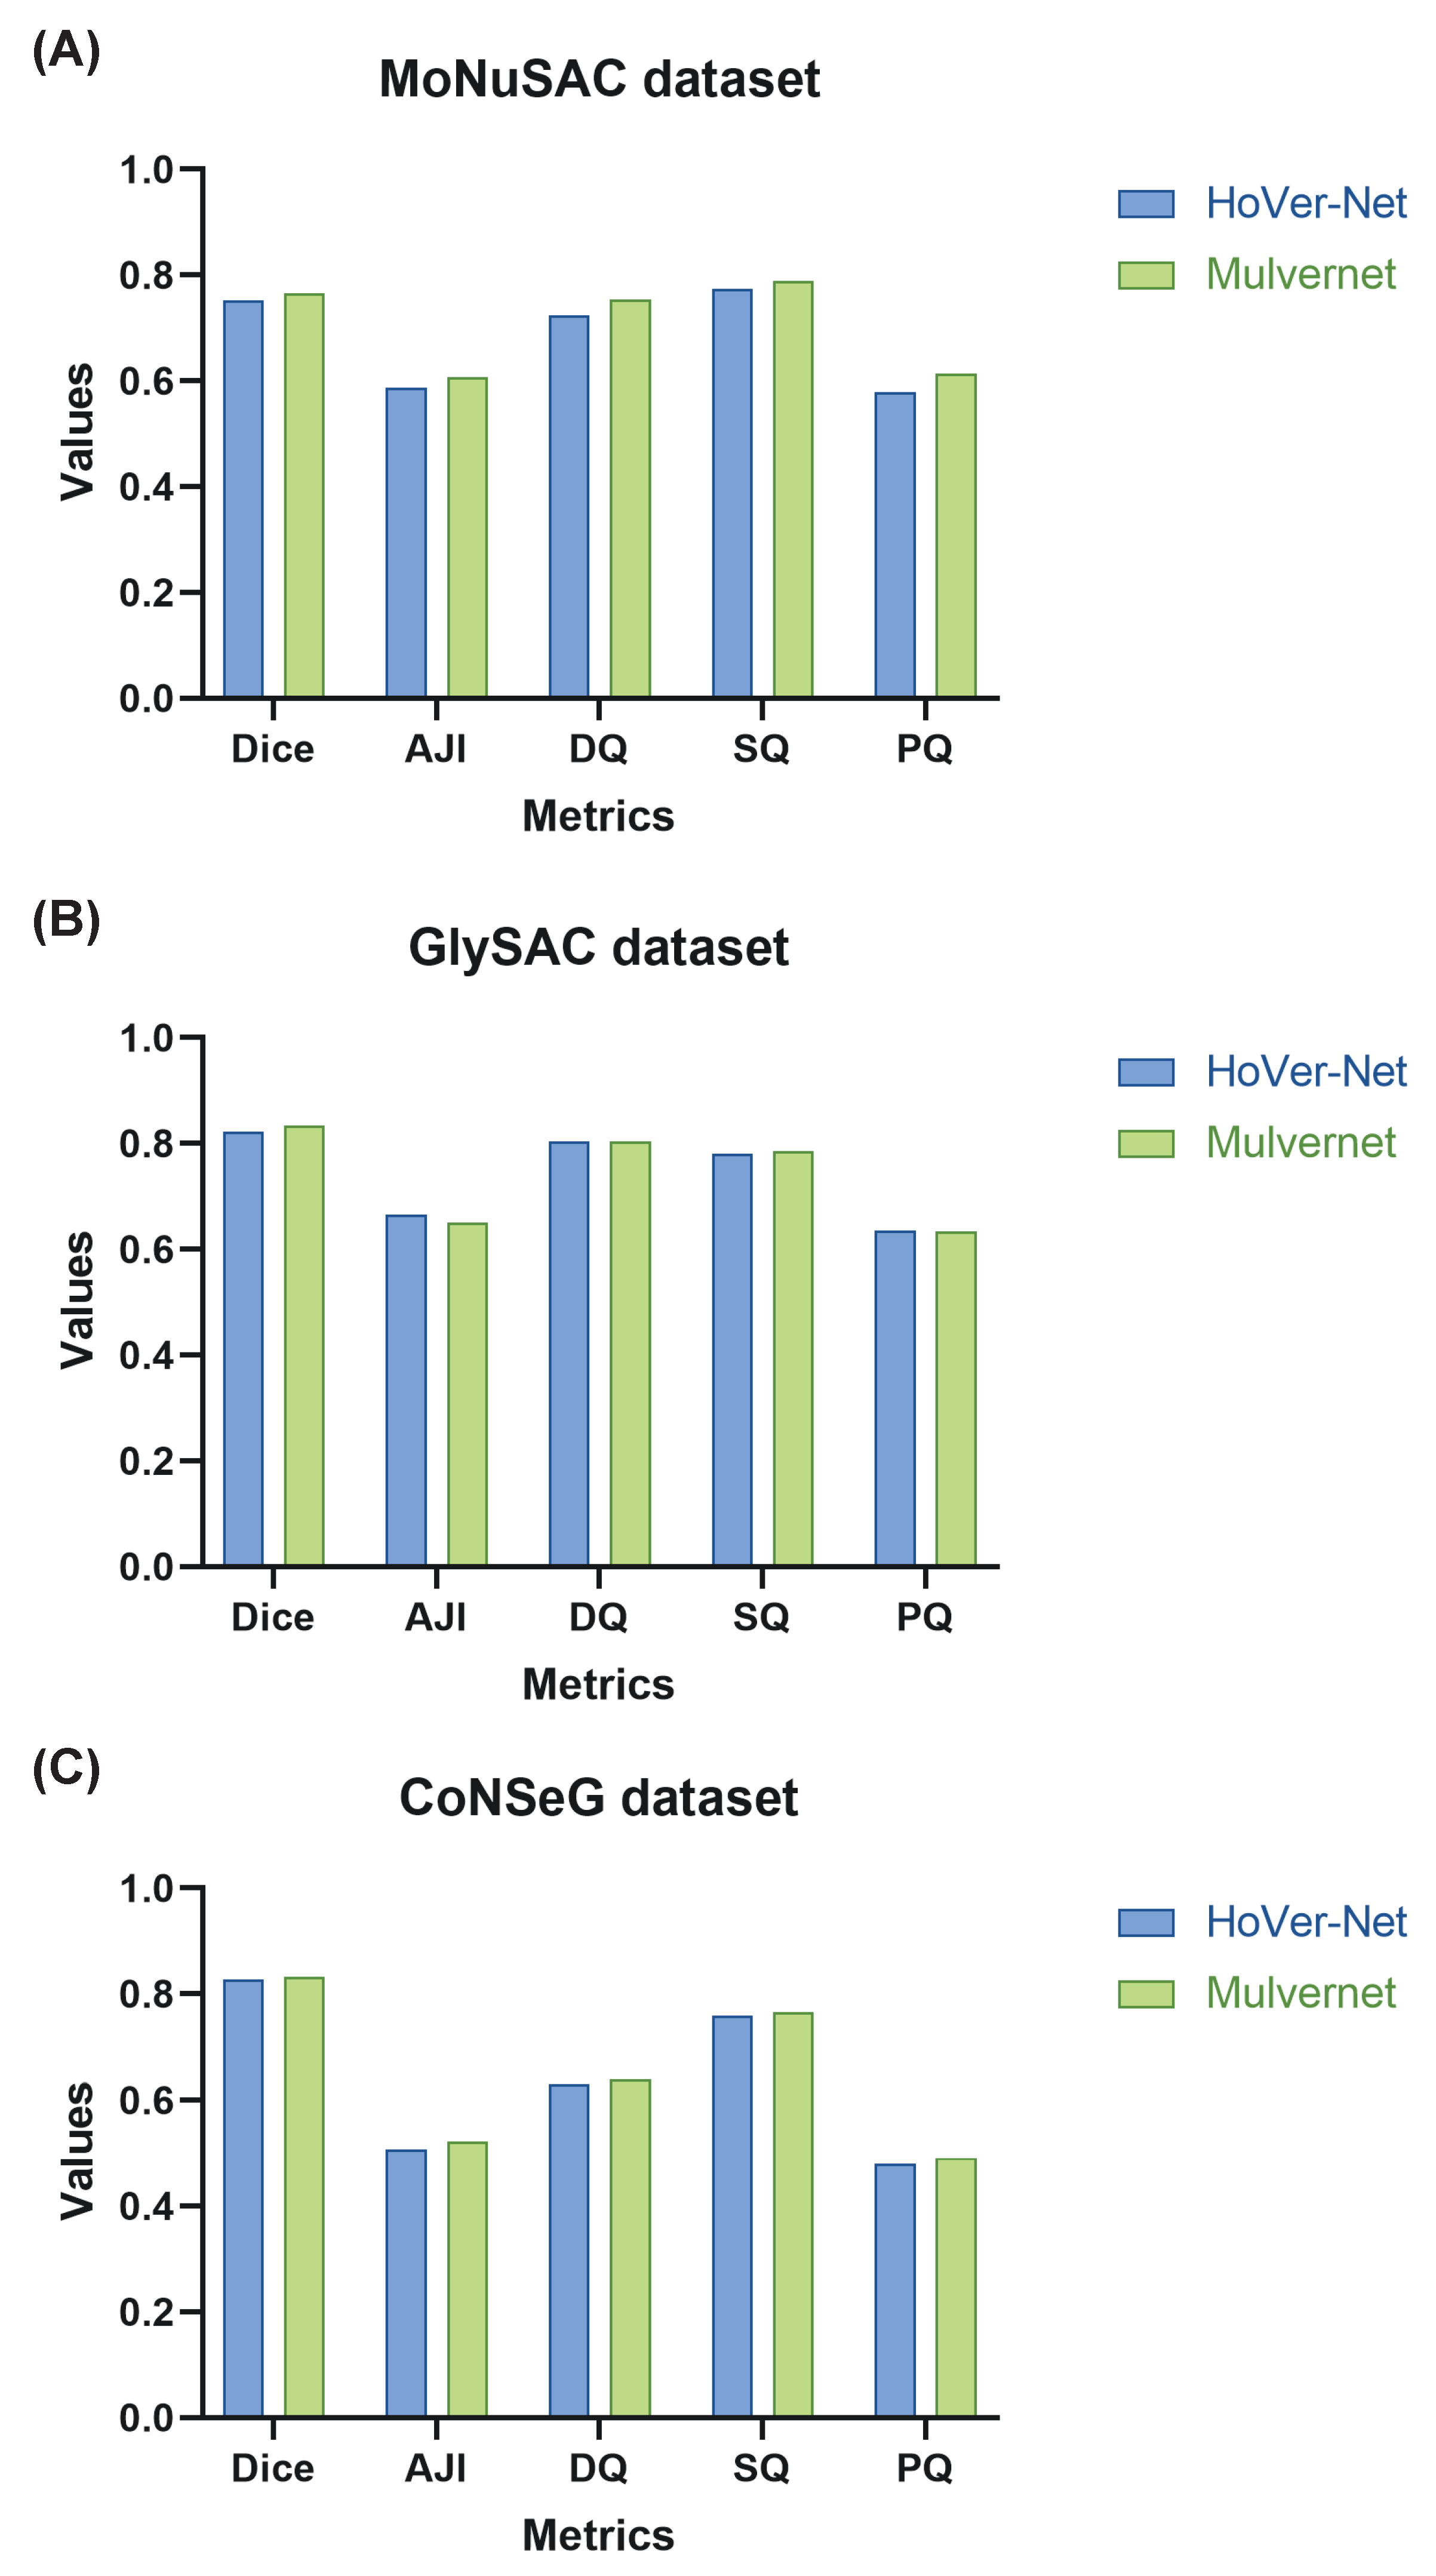
| Datasets | Filter Sizes | Dice | AJI | DQ | SQ | PQ | AJI+ |
|---|---|---|---|---|---|---|---|
| MoNuSAC | and | 0.745 | 0.589 | 0.717 | 0.779 | 0.579 | 0.593 |
| and | 0.763 | 0.608 | 0.742 | 0.784 | 0.601 | 0.613 | |
| and and | 0.766 | 0.608 | 0.737 | 0.789 | 0.601 | 0.613 | |
| GlySAC | and | 0.835 | 0.647 | 0.799 | 0.786 | 0.629 | 0.661 |
| and | 0.835 | 0.651 | 0.800 | 0.787 | 0.632 | 0.665 | |
| and and | 0.835 | 0.650 | 0.804 | 0.786 | 0.634 | 0.666 | |
| CoNSeP | and | 0.826 | 0.507 | 0.623 | 0.751 | 0.469 | 0.541 |
| and | 0.825 | 0.486 | 0.610 | 0.746 | 0.456 | 0.514 | |
| and and | 0.833 | 0.515 | 0.635 | 0.757 | 0.482 | 0.542 |
Disclaimer/Publisher’s Note: The statements, opinions and data contained in all publications are solely those of the individual author(s) and contributor(s) and not of MDPI and/or the editor(s). MDPI and/or the editor(s) disclaim responsibility for any injury to people or property resulting from any ideas, methods, instructions or products referred to in the content. |
© 2023 by the authors. Licensee MDPI, Basel, Switzerland. This article is an open access article distributed under the terms and conditions of the Creative Commons Attribution (CC BY) license (https://creativecommons.org/licenses/by/4.0/).
Share and Cite
Vo, V.T.-T.; Kim, S.-H. Mulvernet: Nucleus Segmentation and Classification of Pathology Images Using the HoVer-Net and Multiple Filter Units. Electronics 2023, 12, 355. https://doi.org/10.3390/electronics12020355
Vo VT-T, Kim S-H. Mulvernet: Nucleus Segmentation and Classification of Pathology Images Using the HoVer-Net and Multiple Filter Units. Electronics. 2023; 12(2):355. https://doi.org/10.3390/electronics12020355
Chicago/Turabian StyleVo, Vi Thi-Tuong, and Soo-Hyung Kim. 2023. "Mulvernet: Nucleus Segmentation and Classification of Pathology Images Using the HoVer-Net and Multiple Filter Units" Electronics 12, no. 2: 355. https://doi.org/10.3390/electronics12020355