Article

E-Health Self-Help Diagnosis from Feces Images in Real Scenes

1
School of Software, Nanchang Hangkong University, Nanchang 330063, China
2
Department of Computer Engineering, Sejong University, Seoul 05006, Republic of Korea
*
Authors to whom correspondence should be addressed.
Electronics 2023, 12(2), 344; https://doi.org/10.3390/electronics12020344
Submission received: 12 December 2022 / Revised: 3 January 2023 / Accepted: 5 January 2023 / Published: 9 January 2023
(This article belongs to the Special Issue Digital Security and Privacy Protection: Trends and Applications)

Abstract

:
Deep learning models and computer vision are commonly integrated for e-health self-help diagnosis. The abnormal colors and traits of feces can reveal the risks of cancer and digestive diseases. As such, this paper develops a self-help diagnostic system to conveniently analyze users’ health conditions from feces images at home, which can reduce dependence on professional skills and examinations equipment. Unfortunately, real scenes at home suffer from several severe challenges, including the lack of labeled data, complex backgrounds, varying illumination, etc. A semi-supervised learning strategy is employed to solve the scarcity of labeled data and reduce the burden of manual labeling. The unlabeled data are classified by an initial model that is pretrained on a small number of training data. Then, the labels with high confidence are allocated to the unlabeled samples in order to extend the training data accordingly. With regard to the small feces areas in certain samples, an adaptive upsampling method is proposed to enlarge the suitable local area according to the proportion of the foreground. Synthesized feces images in real scenes are tested to confirm the effectiveness and efficiency of the proposed method. In terms of accuracy, our proposed model can achieve 100% and 99.2% on color and trait recognition in medical scenes, respectively, and 99.1% and 100% on color and trait recognition in real scenes, respectively. The related datasets and codes will be released on Github.

1. Introduction

Deep learning models and computer vision are commonly integrated for e-health self-help diagnosis [1]. As a routine physical examination, abnormal colors and traits of feces typically can help with predicting and evaluating the potential and possible risks of digestive diseases [2] as well as other diseases such as the assessment and prediction of COVID-19 [3], chronic diarrhea [4], and colorectal cancer [5]. Therefore, accurate, quantitative, automatic, fast and efficient medically assisted examination and diagnosis can definitely help patients to seek medical treatment in a timely manner and reduce the risk of disease deterioration and infection.
Computer-assisted methods for feces diagnosis have three remarkable advantages. First, the examiners do not have to touch feces samples, meaning that the risks of infection and workload are reduced. Second, they can provide reliable results, efficient classification, quantitative analysis, and rapid feedback. Third, computers can work continuously with high intensity.
Feces examination includes macroscopic examination and microscopic examination. While microscopic examination is accurate, it is time-consuming and expensive due to the requirement for professional inspectors and sophisticated instruments. In contrast, macroscopic examination, as a preliminary diagnosis manner in clinical practice, has the advantages of rapid examination and fewer requirements. Therefore, efficient and reliable automatic macroscopic inspection is indispensable [6].
However, there is currently a lack of e-health self-help diagnosis based on feces medical images. Therefore, this paper develops an accurate, quantitative, automatic, fast, and efficient e-health self-help diagnosis system for feces macroscopic images based on computer vision and pattern recognition. Two attributes of feces, namely, color and trait, are recognized and analyzed by a Convolution Neural Network (CNN) [7,8,9].
Considering the requirements of different application scenarios and different tasks, this paper defines three task types, as shown in 
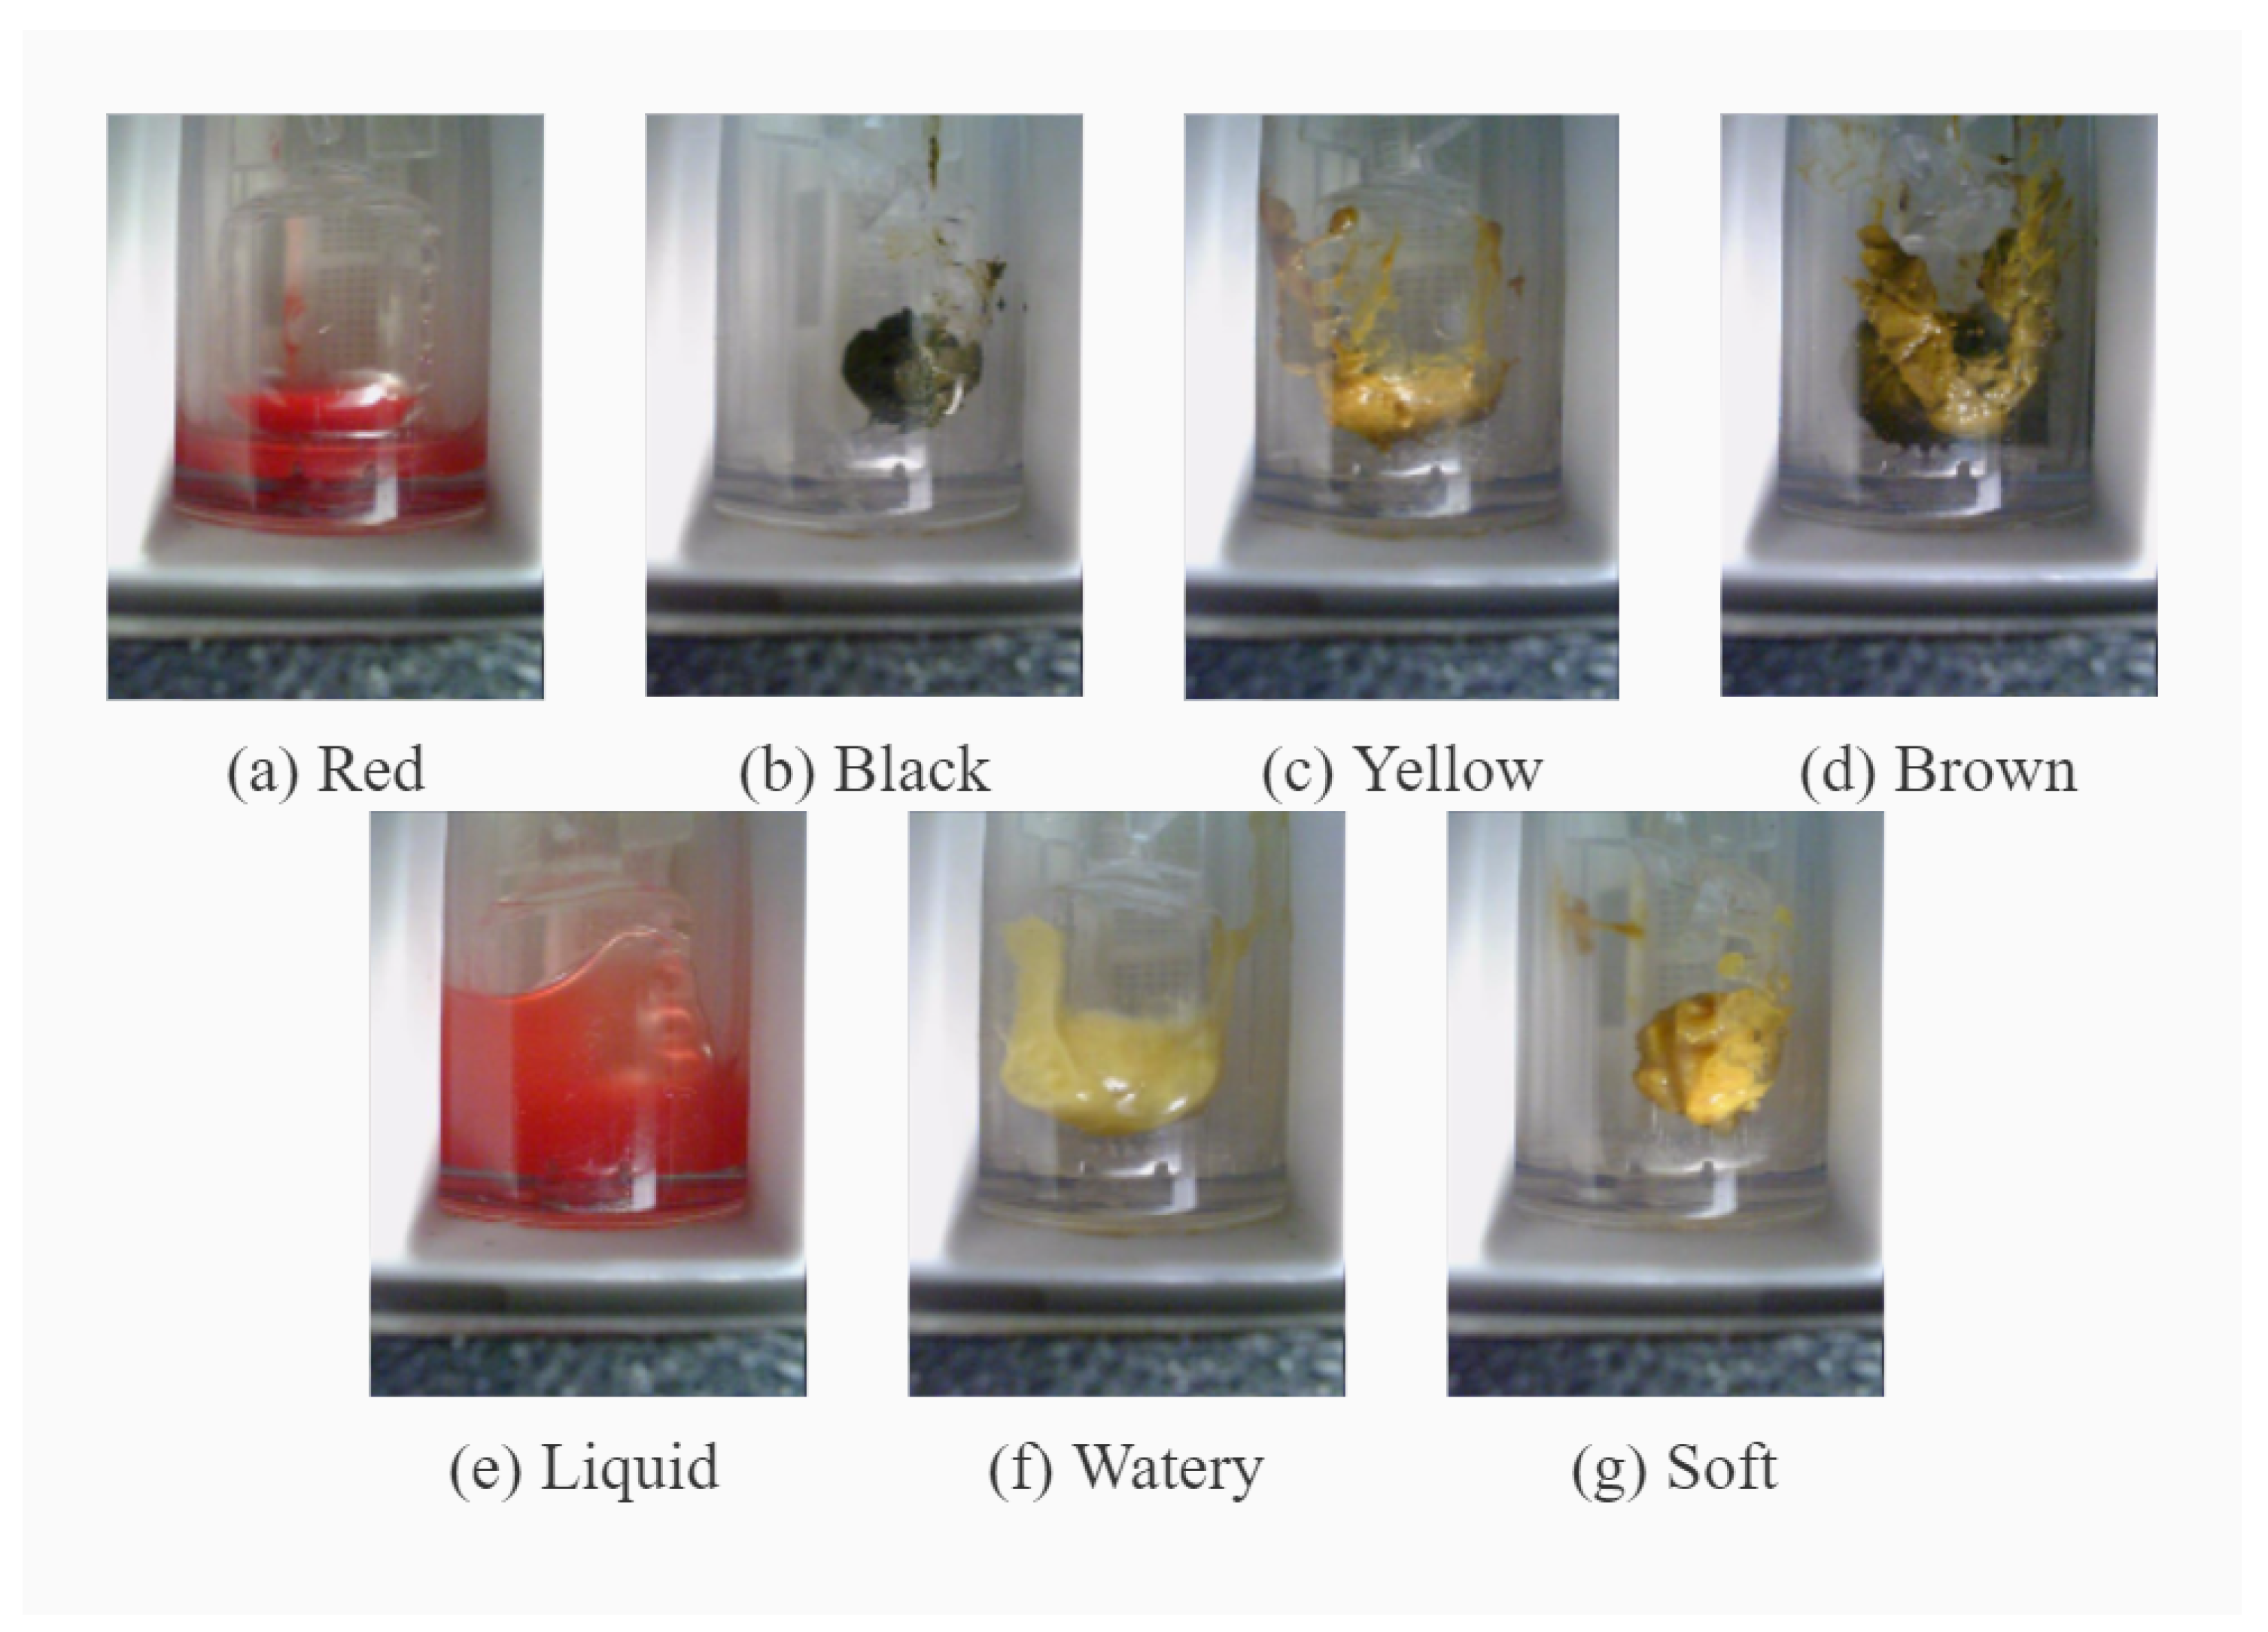
Table 1. There are two different classification criteria for the color classification task. Yellow and brown can be considered as healthy feces colors, and as such are merged into one color category.
In clinical assessment, red and black are regarded as abnormal feces colors. The classification task with four color categories is designed for carrying out pathological analysis in cases where more detailed analysis is a requirement. However, the classification task with three color categories is sufficient for ordinary self-help users, who pay more attention to whether their feces color is healthy or abnormal. For trait classification, liquid and watery samples are regarded as abnormal samples. Samples with different colors and traits are shown in Figure 1.
In medical scenes, feces samples are collected with special instruments, and the acquisition conditions, including the background and illumination, are fixed. However, in real scenes users capture macroscopic images of the feces by themselves, meaning that the acquisition conditions are not strictly controllable and that the related challenges may degrade the accuracy of diagnosis.
The traditional methods for feces diagnosis are unable to meet the growing demand for rapid automatic diagnosis and for effective epidemic prevention and control. Due to the lack of samples, it is difficult to directly use the existing classification models for feces diagnosis. Therefore, the main contributions and novelty of this paper are summarized as follows. 1. Semi-supervised training is employed, which is suitable and efficient for a small number of samples. 2. As the feces area is too small in certain samples, an adaptive upsampling method is proposed to enlarge the effective area of feces. 3. A real-scene dataset is synthesized to alleviate problems related to the small amount of data, then a diagnosis framework is proposed for real scenes.
The rest of this paper is organized as follows. Section 2 reviews related works. Section 3 specifies the methodology. Section 4 describes our experiments and discusses the results. Finally, our conclusions and the possibilities for future work are provided in Section 5.

2. Literature Review

Medical images [10,11] are commonly used in computer-aided diagnosis (CAD), i.e., the integrated application of digital image processing, pattern recognition, and medical professional knowledge. Combined with computer analysis, CAD can improve the automation and accuracy of e-health diagnosis.

2.1. Medical Image Diagnosis

Computer technologies are widely used in medical diagnosis, and have achieved remarkable performance [12]. Feces examination is a very important clinical examination; however, its development has been slow due to a lack of samples and other severe challenges.
Nkamgang et al. [13] proposed an expert system using feces images to check for intestinal parasites. A Fuzzy Neuron classifier was trained to diagnose the feces images taken by microscope. Deep learning has been widely used in medical diagnosis on account of its powerful learning ability. Yang et al. [14] proposed StoolNet to analyze colors in macroscopic feces images in order to judge patients’ intestinal health. Choy et al. [15] were able to improve the accuracy of StoolNet for fecal traits. Inspired by StoolNet, Leng et al. [16] developed a lightweight classification network to identify feces traits, achieving satisfactory performance.
However, the feces images in the above methods were all collected with special professional medical instruments under strictly controllable conditions, such as fixed background and illumination. Self-help diagnosis requires that images collected with a self-help handheld device be recognized, and needs to overcome the interference caused by complex backgrounds and various illuminations. To the best of our knowledge, there are no public feces image datasets consisting of images collected in real scenes, which greatly inhibits the development of self-help feces diagnosis. Thus, it is necessary to synthetise real-scene data in order to train a self-help feces diagnosis model.

2.2. Data Augmentation and Semi-Supervised Learning

Augmentation and synthesis can enlarge the training dataset; however, the model depends heavily on the labeled data. Semi-supervised learning is a feasible way to solve this problem. The existing semi-supervised methods, namely, direct and indirect, rely on the assumption of low density separation and smoothing [17]. Low density separation assumes that there are great differences among different categories. In the feature space, the samples of the same category are close and lead to high density, while the region with low density is more likely to be a decision boundary. The state-of-the-art semi-supervised methods can be briefly divided into maximizing decision boundary and self-training.
Maximizing decision boundary attempts to maximize the distance between a given datapoint and the decision boundary. When all samples are far from the decision boundary, the decision boundary should be within the low-density region [18]. In soft boundary-based support vector machine (SVM), the misclassified samples and the samples near the boundary are mapped to high dimension and separated; alternatively, the misclassified samples are used to accumulate loss. Then, these distances are reduced by optimizing the model parameters in order to maximize the decision boundary [19]. Bie and Cristianini [20] proposed the convex relaxation problem of the objective function, which can be solved by semi-definite programming. This approach was later extended to multi-classification tasks by Xu et al. [21]. To reduce computational complexity, Li and Zhou [22] proposed S4VMs.
Self-training, known as pseudo-labeling, refers to the generation of new labels using a pre-trained model, which are the new labels from training on a small number of samples. Sohn et al. [23] proposed a semi-supervised learning framework for object detection. A pre-trained model was used to generate pseudo-labels for unlabeled data. Sohn et al. [24] proposed FixMatch to classify the same image with weak and strong augmentation. Xie et al. [25] found that noisy students could improve the generalization ability of the trained model. However, the network requires improvements to its structure in order to adapt larger datasets.
Smoothing hypothesis requires that the prediction model should be robust to local perturbations in its input. The potential representation of the network can be guided by inputting the disturbances from unlabeled data into the network and by the reconstruction of losses [26,27,28]. Bachman et al. [29] improved the robustness by applying an additional loss term to the difference between the activation of the disturbed network and the activation of the original network. Laine and Aila [30] disturbed the network through dropout, and the unsupervised term in the loss function was initially set to zero, which is expected to improve robustness.
The theory basis of self-training comes from the clustering hypothesis [31]. On the one hand, the high-confidence samples labeled with pseudo-labels are usually more likely to be correctly classified. On the other hand, high-confidence samples are usually in the high-density area in the feature space, while the samples with interference are usually in the low-density area. If the model is affected by severe interference, the decision boundary moves to the high density area, degrading the classification accuracy. Therefore, the pseudo-labeled samples have an advantage over the fully-labeled samples in that it is not as easy for the parameter updating of the model to be misled if the samples with high confidences are correctly classified.

3. Proposed Method

A CAD self-help feces diagnosis approach is proposed in this paper, which consists of three main works, including self-supervised learning (SSL), adaptive up-sampling (AUS), and synthesis of feces image in real scenes. These three main contributions are specified in this section. A three-layer lightweight CNN is utilized as the benchmark structure [18].

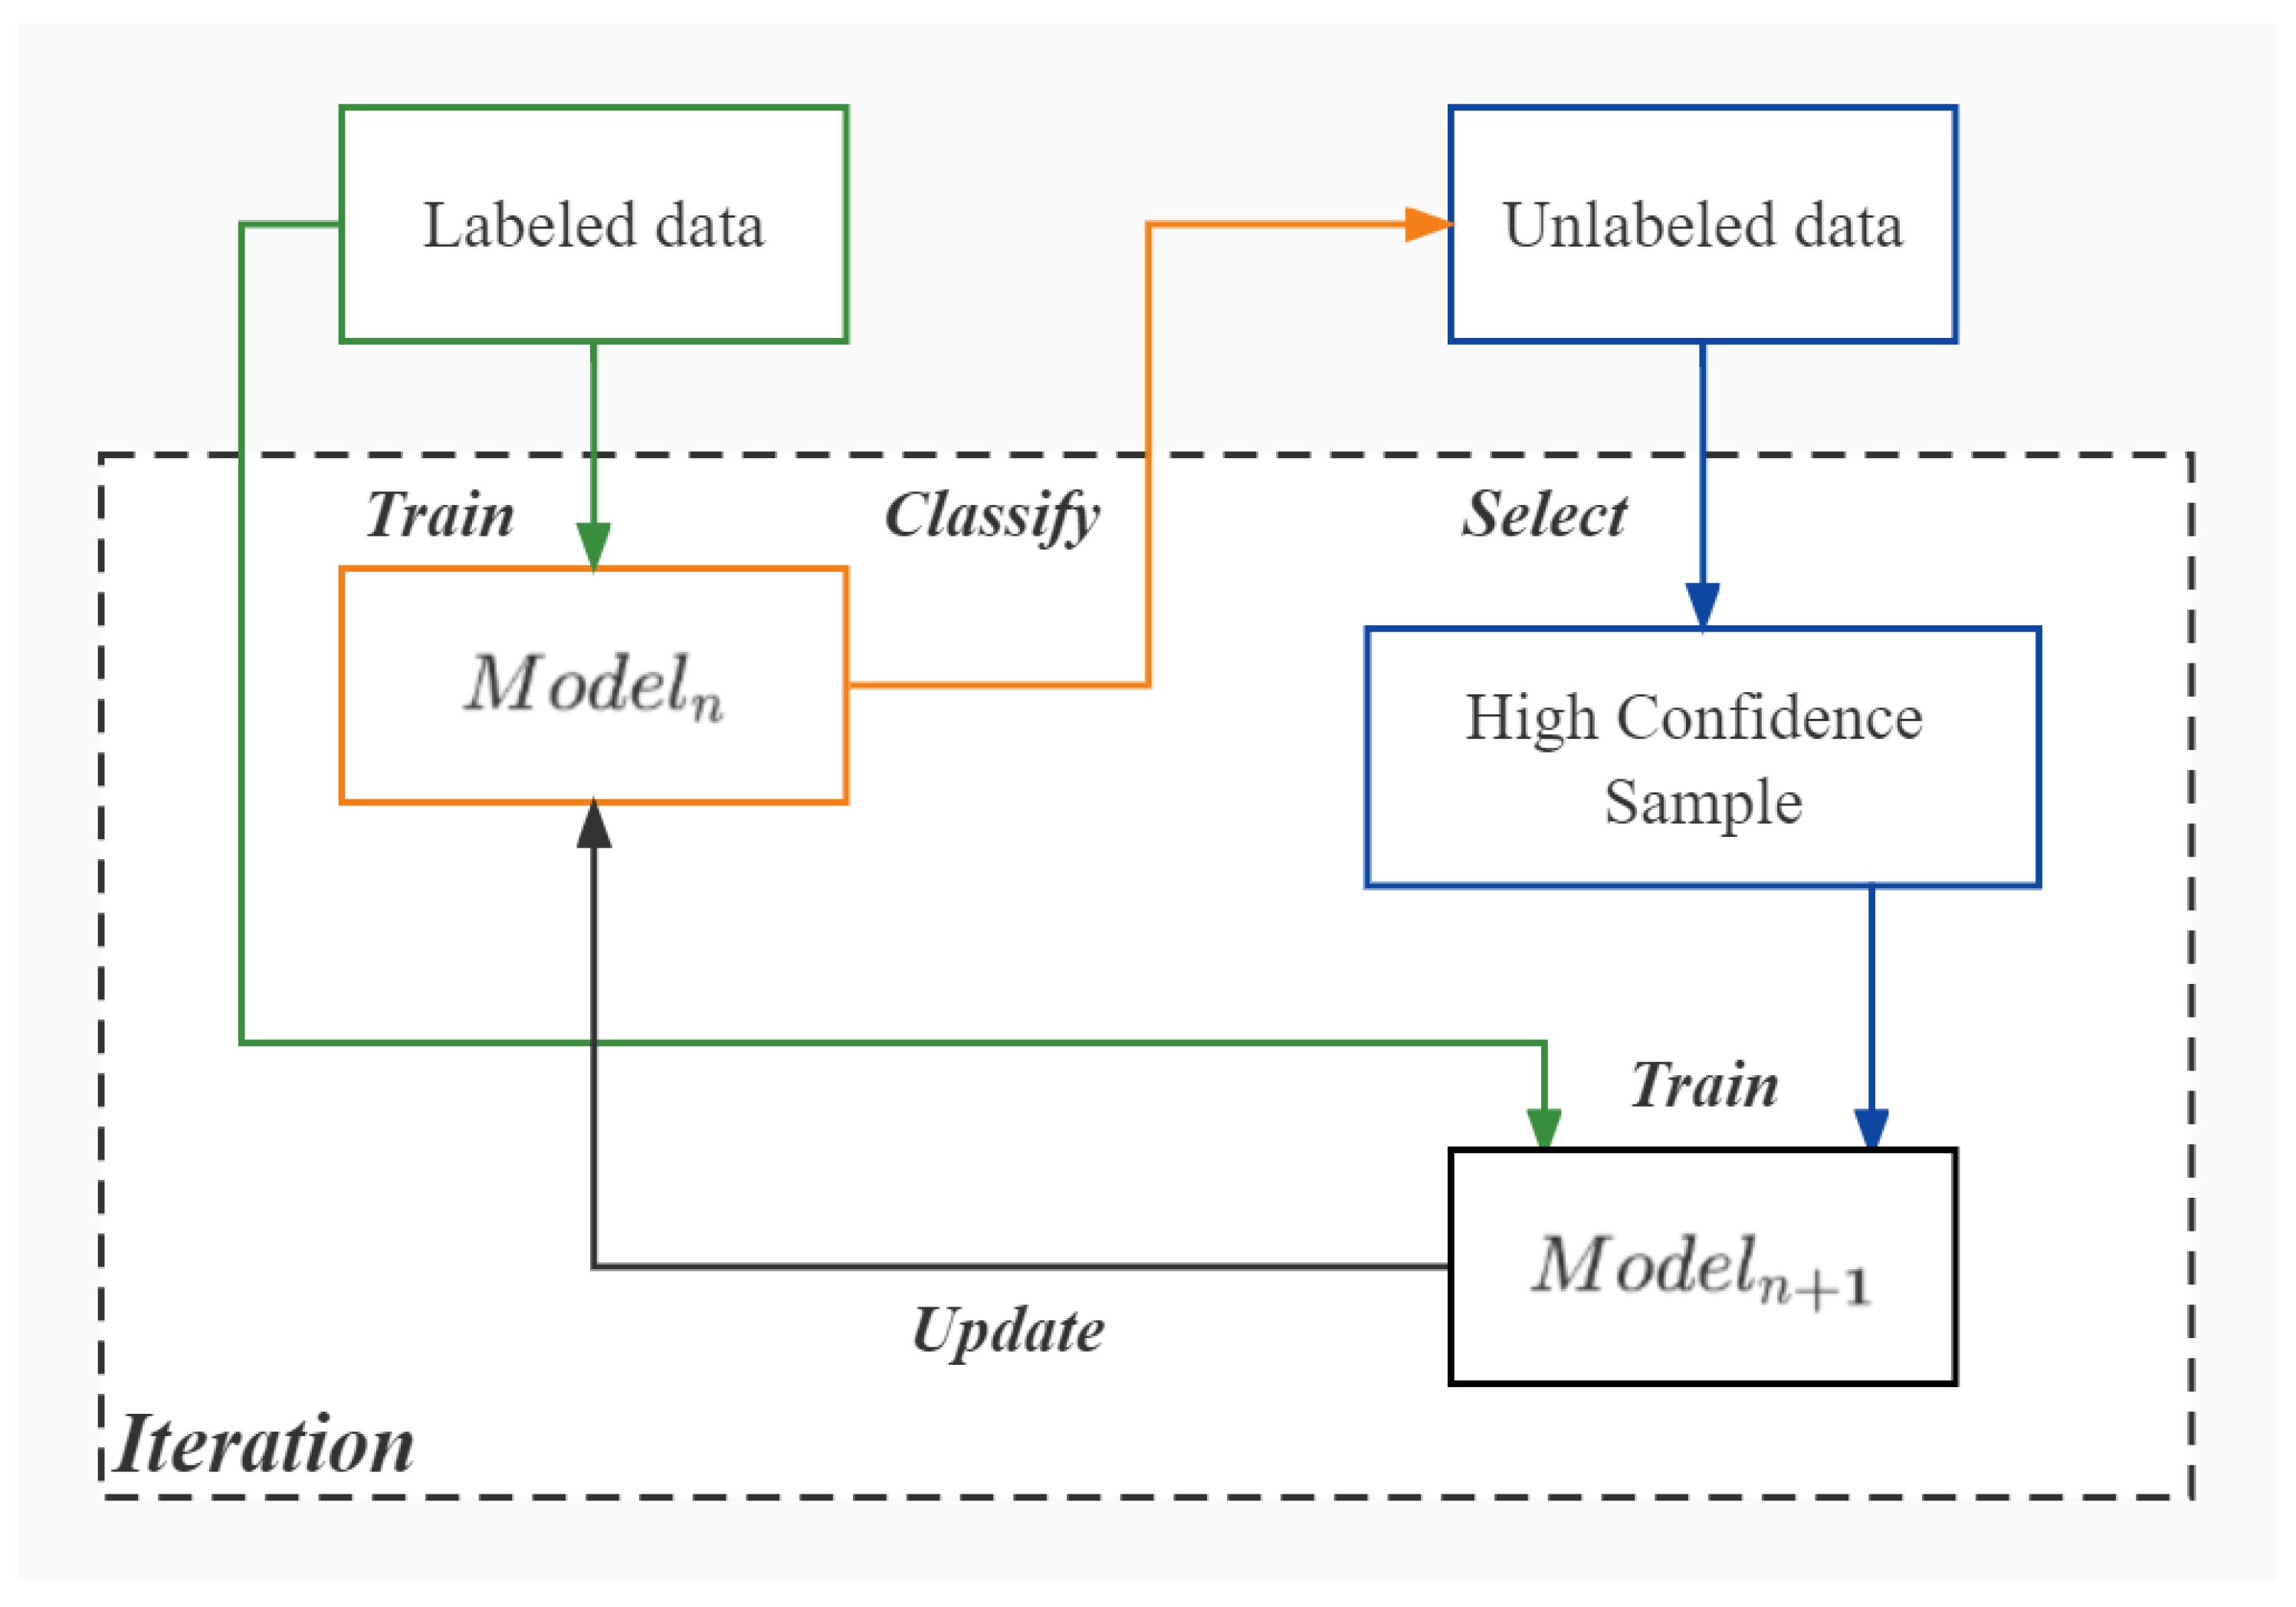
3.1. Semi-Supervised Learning (SSL)

It is hard to collect enough labeled data; therefore, SSL is leveraged, as shown in Figure 2. High-confidence samples refer to those samples with high logical regression values. There are two relevant parameters, namely, the degree of deviation from expectation Δ d and standard deviation σ :
σ = σ 2 = x μ 2 N
where σ is the standard deviation of logits without the corresponding max value and N is the number of samples, which is the average logits of the samples:
Δ d = arg max X μ
where X = x 1 , x 2 , , x n , which is a set, and X φ refers to the probability that x is classified to the ‘- th ’ class where φ - th is the number of classes.
If Δ d > σ , then the classification result of this sample can be adopted as a pseudo-label because the model can clearly distinguish this sample; otherwise, the classification result is discarded because the model is not confident about the category to which the sample belongs.

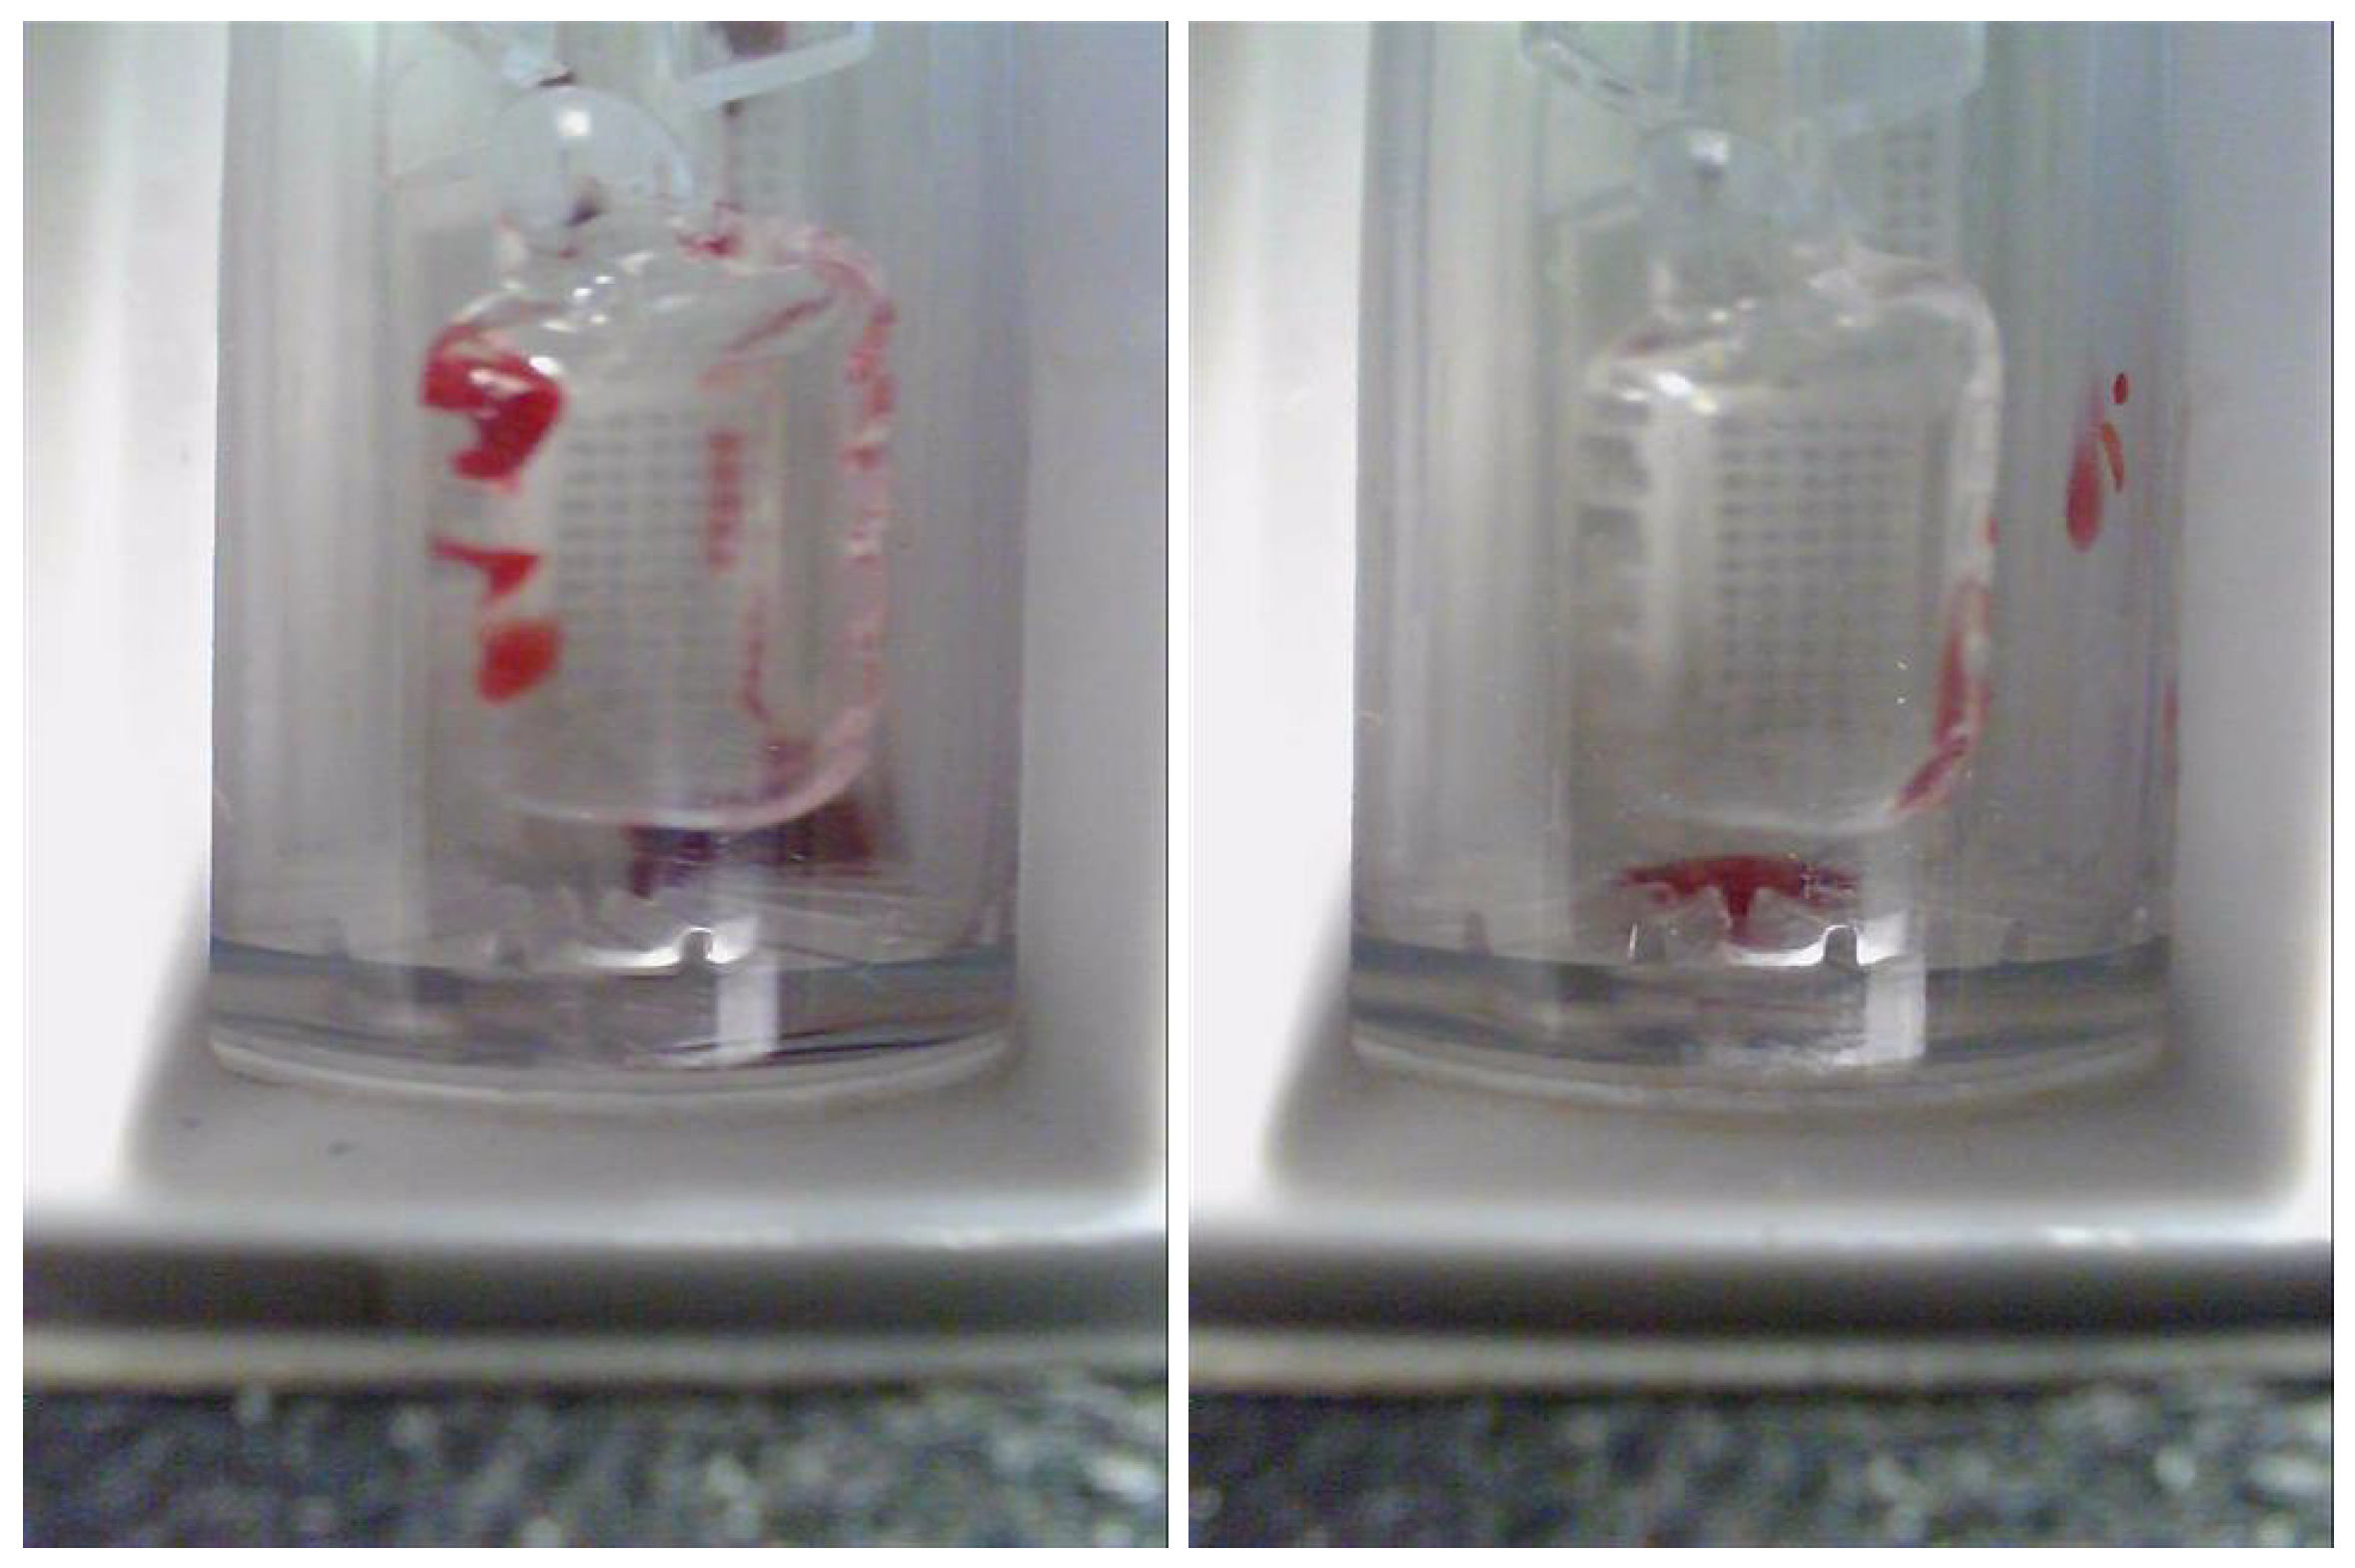
3.2. Adaptive Up-Sampling (AUS)

In the image collection of feces samples, the sizes of the region of interest (ROI), i.e., the feces region, are different. Sometimes the ROI is too small, as shown in Figure 3, which leads to insufficient information and degraded accuracy.
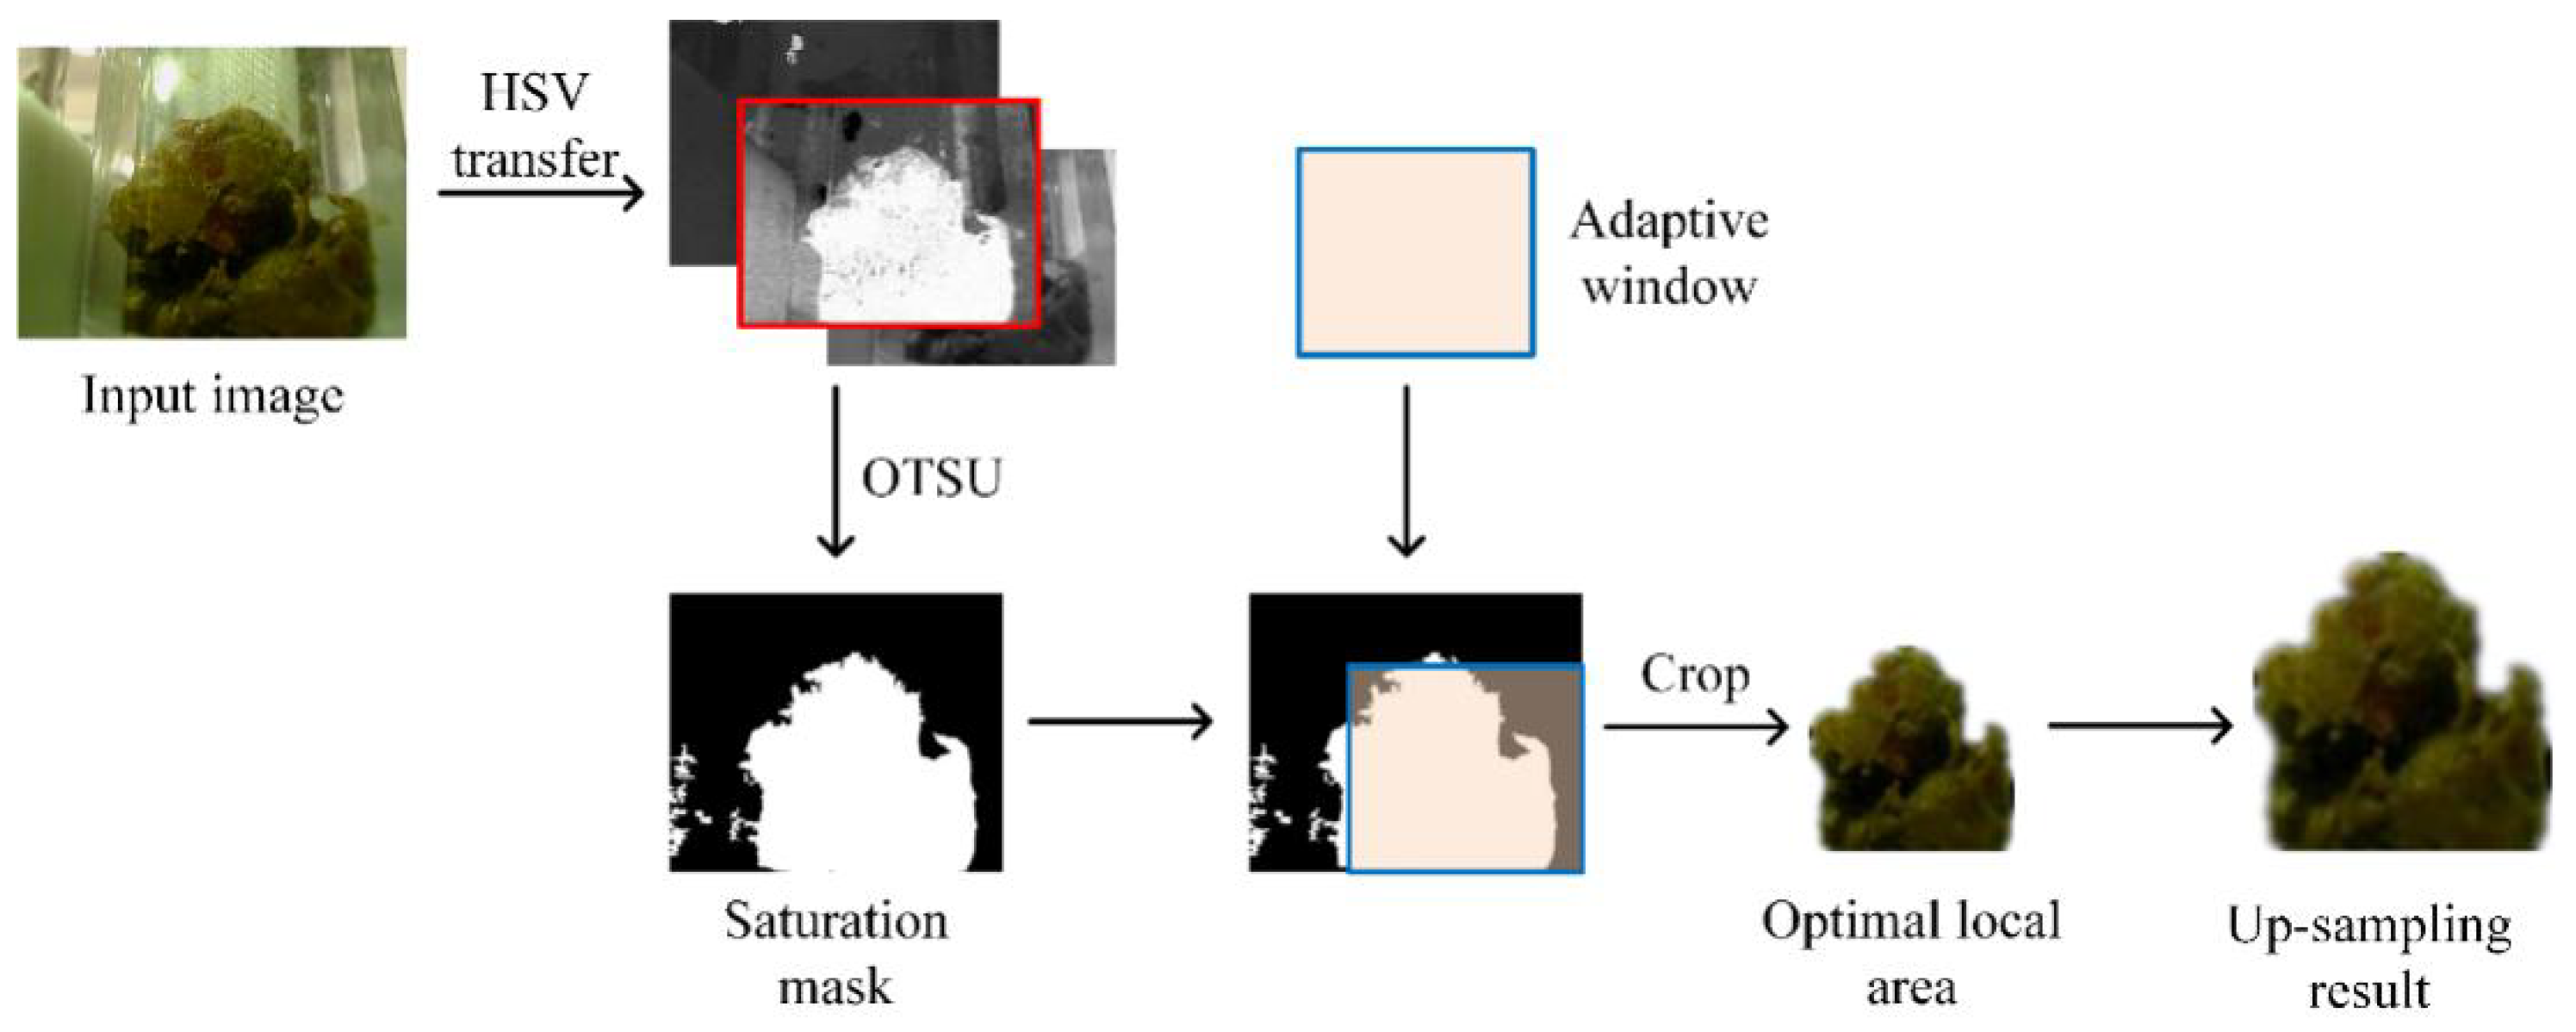
AUS is proposed to adaptively enlarge small ROIs. The three steps are to localize the small ROI, appropriately scale it according to the result of image segmentation, and zoom in the small ROI. The procedure of AUS is shown in Figure 4.
Step 1: OTSU segmentation is conducted on the saturation channel to segment the ROI [14]. In each image, the number of foreground pixels is denoted by S , while in a sliding window the proportion of foreground pixels is denoted by P .
Step 2: The percentage of foreground pixels is calculated in all size-adaptive windows, where the sizes are w × w w = s , and the maximum proportion among them is selected.
Step 3: T is used as a threshold to adaptively crop the sample. If P max T , the corresponding sliding windows are upsampled. If P max < T , then replace P max with P and repeat Step 2 until P max T is satisfied.
AUS ensures that all the images have large ROI. To determine the optimal ratio, the accuracies of samples with different foreground ratios are compared in Table 2. The color and trait networks reach their best results on the training data at foreground ratios of 70–80% and 60–70%, respectively.Therefore, in this paper the threshold for the experiments to determine colors and traits was set as 70–80%.
It can be seen that a very small ROI carries insufficient information, while too large an ROI does not lead to the best effect. For color classification, the color in the ROI may be disturbed by multiple colors. For trait classification, boundary information and texture information are both important, and too large an ROI may contain useless boundary information.

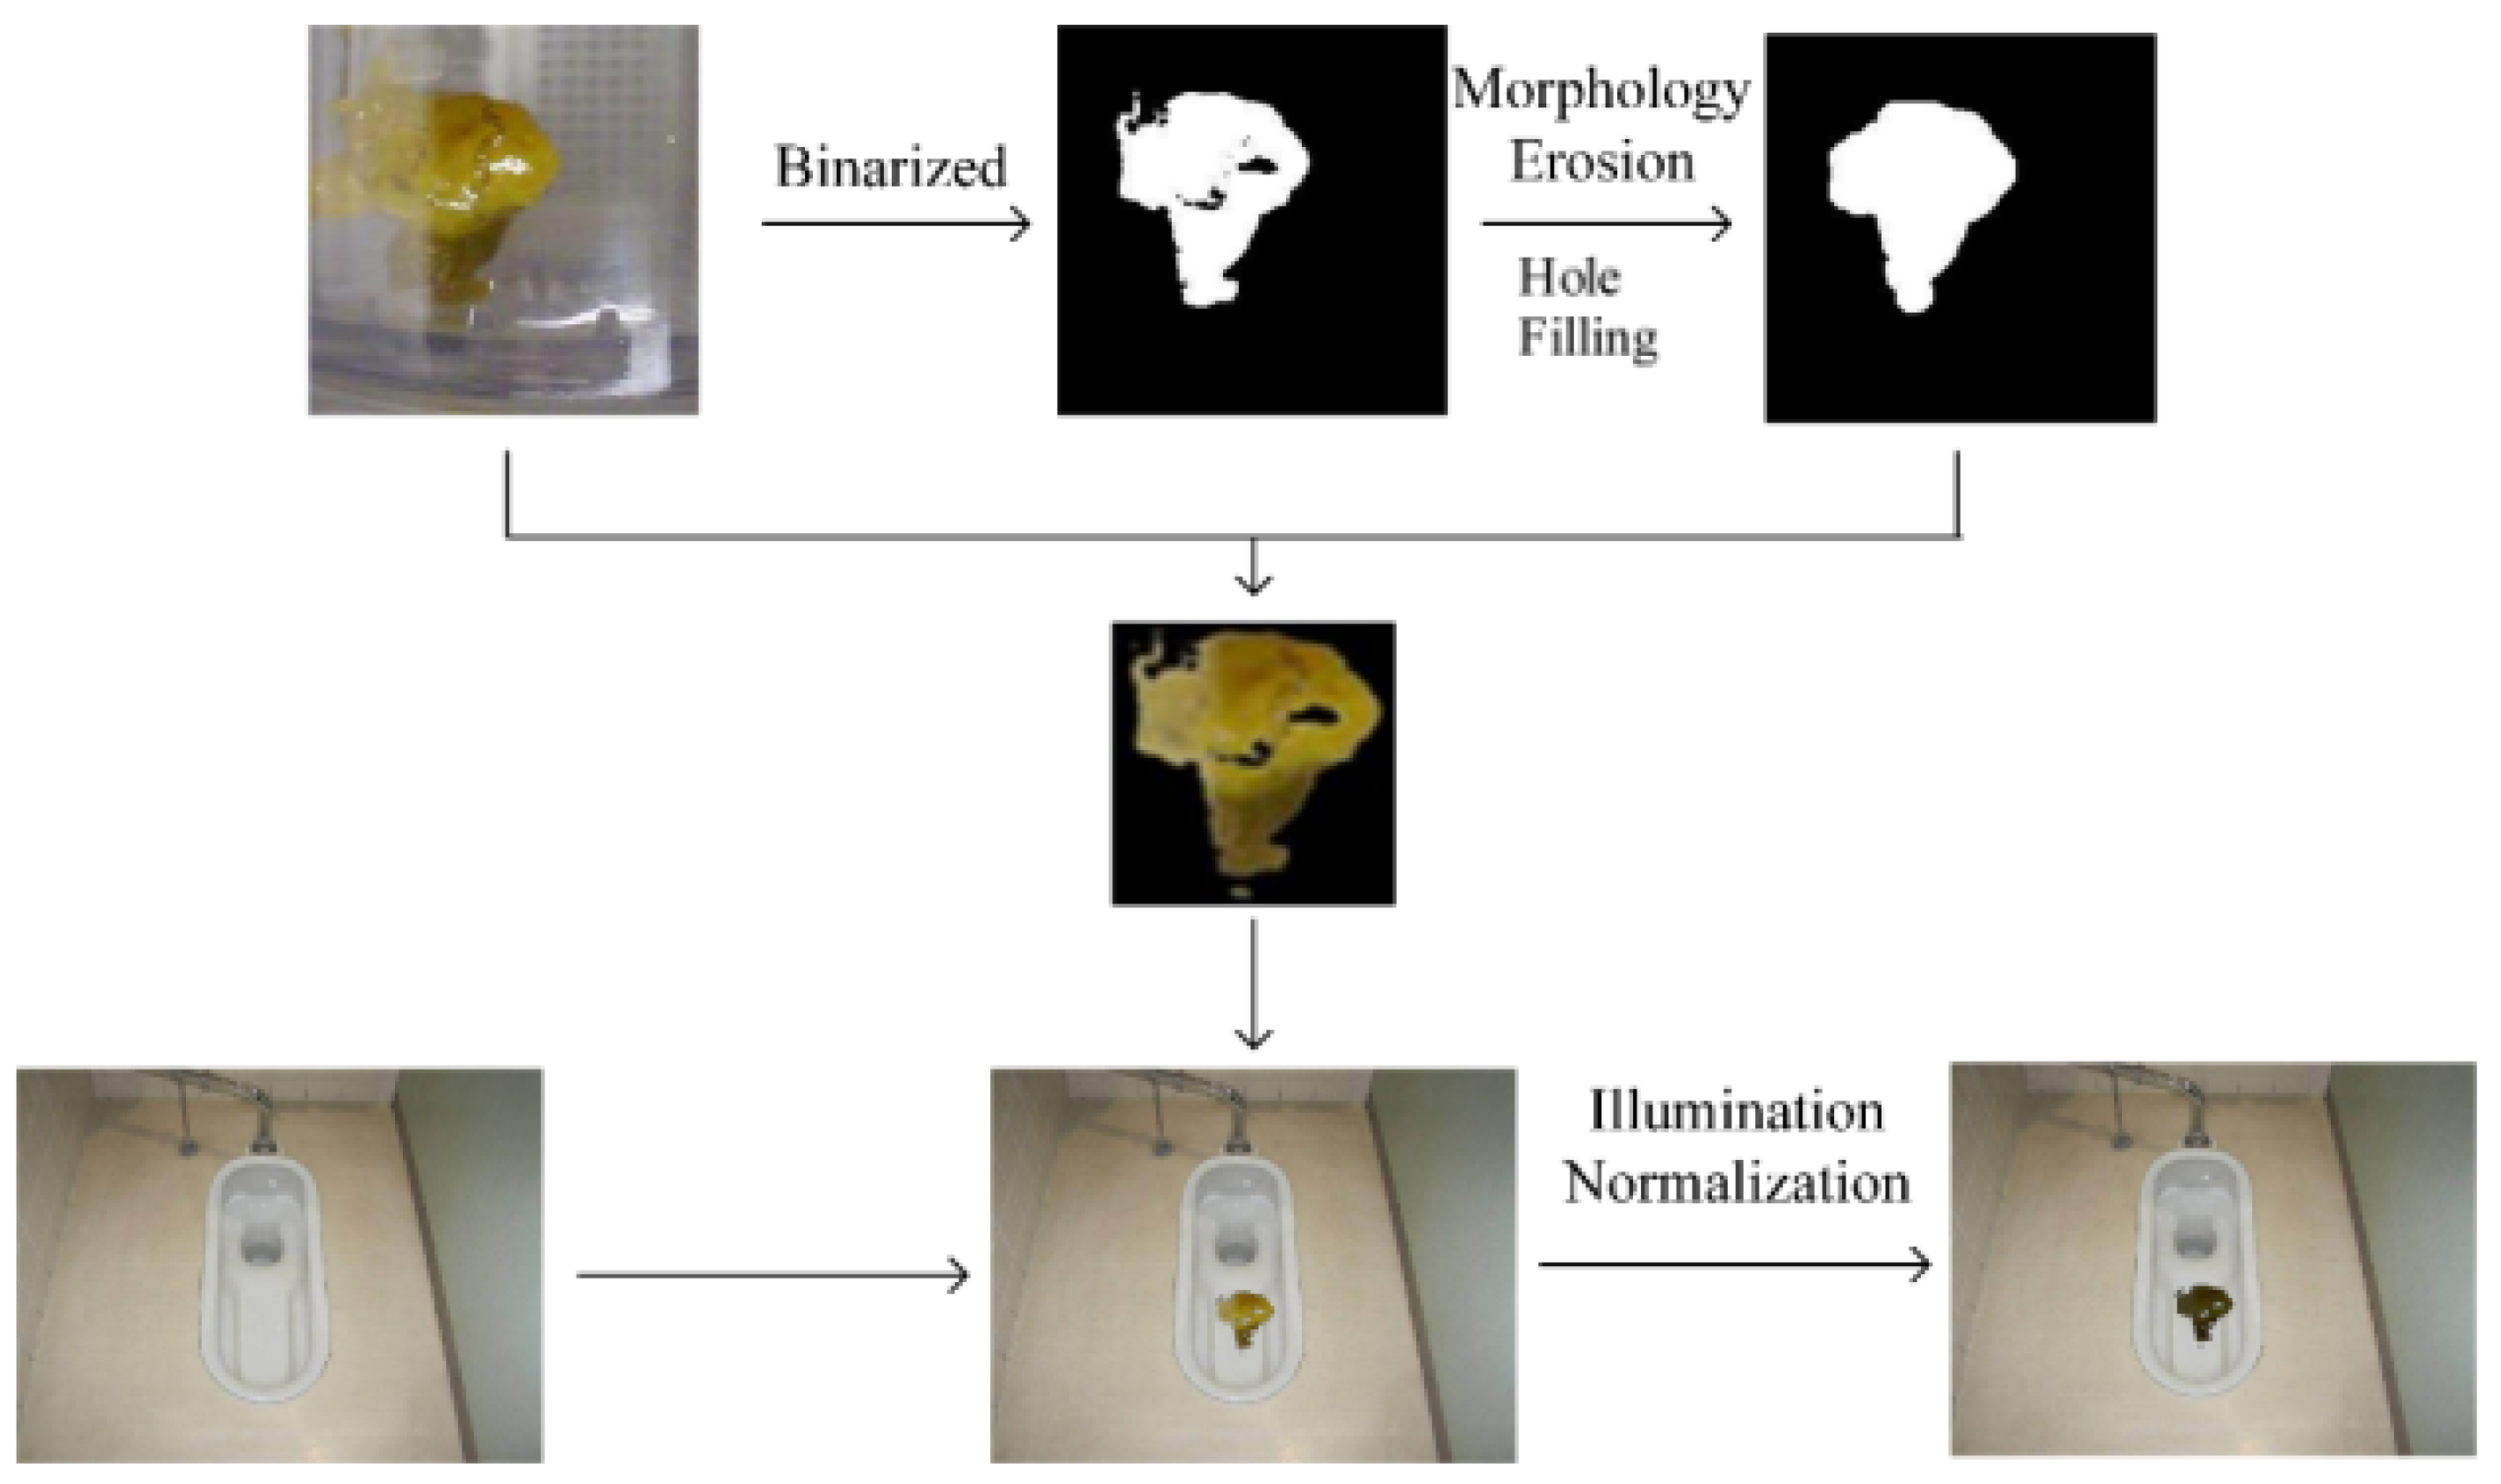
3.3. Synthesized Dataset

A real-scene dataset was synthesized to confirm that the proposed method is effective for use in daily life. Compared with the medical scenes, the backgrounds, illuminations, and morphology are much more complex in a real scene, which can pose severe challenges.
Splicing synthesis was used to generate the synthesized real-scene feces images. This approach preserves the color and texture features of the ROI. The synthesized dataset can be rotated at different angles in order to further expand it. The synthesized real-scene feces images should meet the following requirements: 1. diversity, such as different backgrounds, illuminations, etc; 2. the feces regions should be large enough; and 3. naturalness, that is, the synthesized images should be similar to those collected from real scenes.
The synthesis procedure is shown in Figure 5. The binary mask labels the locations of the feces pixels (foreground pixels) that are stitched with a real-scene toilet image. The synthesized real-scene feces images have good naturalness. Because OTSU commonly produces a larger feces region, which leads to dark boundaries in the synthesized images, morphological corrosion is used to suppress the dark boundaries.

4. Experiments

The proposed method is tested in two predefined application scenarios and three tasks. For disease diagnosis, better classifiers can obtain more pathological information from the fine-grained classification results. Therefore, the accurate classification of feces colors and traits is significantly important to academic studies. On the other hand, common users look forward to self-diagnosis and expect a high recall rate of abnormal samples, which can help to avoid missing out on timely treatment.

4.1. Medical Scenes

4.1.1. Four Color Categories

The overall accuracy refers to the accuracy on the dataset containing all the categories. In the following text, “accuracy” refers to overall accuracy. The results for four color categories on medical scenes are shown in Table 3. The single-task network is pre-trained for only one task, that is, either color or trait classification. The multi task network is pre-trained for the two tasks of color and trait classification simultaneously. AUS improves the accuracy of both the single-task and multi-task methods. The accuracy is improved by 3.9 % (from 91.1 % to 95 % ) on the multi-task AUS+SSL. SSL does not provide the same influence on every model; however, it saves the labeling of 10 % of the training data.
Overall, the single-task methods outperform the multi-task methods. Additionally, the best accuracy and best yellow recall are achieved with the combination of a single-task network and AUS, which outperforms StoolNet, the state-of-the-art recognition method for feces color.

4.1.2. Three Color Categories

The results for three color categories in medical scenes are shown in Table 4. AUS improves the accuracy of most groups for single-task methods, while the results for SSL are nearly the same even with AUS.
Unlike the previous experiments with four color categories, here the multi-task methods are better than the single-task methods. The accuracy of the combination of multi task+AUS even achieves 100 % .

4.1.3. Three Trait Categories

The results for three trait categories in medical scenes are shown in Table 5. All the proposed methods in this paper yield better accuracy than the start-of-the-art classification method for feces traits. Benefiting from the complementarity between the classification of colors and traits, the multi-task methods achieve better performance here than the single task methods. Meanwhile, AUS and SSL are both able to effectively improve performance.

4.2. Real Scenes

The experiments using real scenes were conducted similarly to those using medical scenes. The main difference between them is that the experiments are tested in different scenarios, i.e., on different samples. As the main purpose of this paper is developing a self-help feces examination approach, it is necessary to test our method on real scenes. All of the models were trained and tested on the synthesized real-scene dataset.

4.2.1. Four Color Categories

Here, we compare the overall recall and the recall for each category. Overall recall is the recall for the dataset containing all the categories. In the following text, “recall” refers to overall recall. The results are shown in Table 6. It can be seen that AUS effectively improves the accuracy and recalls of abnormal samples, while the combination of AUS+SSL greatly improves the performance.
Meanwhile, the single task and multi-task approaches have similar overall accuracies. The main reason for this is that the classification performance of the multi-task methods is not good at distinguishing “yellow” and “brown”. However, considering this is a self-help diagnosis method, it is unimportant to distinguish the differences between these two healthy feces colors. Compared with single-task methods, the multi-task methods yield higher recall values for abnormal colors, which is more important for users than fine-grained classification of the two healthy feces colors.

4.2.2. Three Color Categories

As discussed above, it is necessary to diagnose abnormal colors in real scenes. The results for three color categories are shown in Table 7. It can be seen that the multi-task methods yield better performance than the single-task methods on each index, which reveals that there is a potential relationship between the color and trait information. In addition, this explains that why multi-task methods do not yield better performance with four color categories. The main reason is that the traits corresponding to yellow and brown are similar, which are both healthy feces colors; the multi-task methods are confused by the diagnosis of the two colors in combination and by their related traits.

4.2.3. Three Trait Categories

The results for three trait categories are shown in Table 8. As discussed above, the multi-task methods have improved performance, as they can learn potentially complementary information from the color and trait classification tasks.

5. Conclusions and Future Work

Self-help diagnosis systems represent an urgent e-health direction for epidemic prevention and control. Feces medical image diagnosis can help to minimize both the difficulties of disease diagnosis and the risk of infection. Meanwhile, the whole procedure is conducted completely on the user’s device, overcoming the problem of data leakage and protecting user privacy. Two frameworks are proposed in this paper, for clinical examination at the hospital and for self-help examination at home. SSL and AUS are proposed to alleviate the problems of data scarcity and tiny sample regions, respectively. In addition, a multi-task structure is proposed to achieve diagnosis based simultaneous assessment of color and trait. A real-scene dataset is synthesized to assess the performance of the proposed methods. Our experiments confirm that the proposed self-help method can achieve satisfactory performance on both clinical scenes and real scenes. In our future work, we intend to combine macrocosmic and microcosmic images to develop a more accurate feces diagnosis system.

Author Contributions

Each author discussed the details of the manuscript. F.L. designed and wrote the manuscript. F.L. implemented the proposed technique and provided the experimental results. J.W. reviewed and revised the article. L.L., C.K. drafted and revised the manuscript. All authors have read and agreed to the published version of the manuscript.

Funding

This research was supported by the National Natural Science Foundation of China (61866028), Technology Innovation Guidance Program Project (Special Project of Technology Cooperation, Science and Technology Department of Jiangxi Province) (20212BDH81003), and Innovation Foundation for Postgraduate Students of Nanchang Hangkong University (YC2022-235).

Data Availability Statement

The datasets used in this paper are publicly available and their links are provided in the reference section.

Acknowledgments

We thank the anonymous reviewers for their valuable suggestions that improved the quality of this article.

Conflicts of Interest

The authors declare no conflict of interest.

References

  1. Hwang, H.; Lee, K.; Lee, E.C. A real-time remote respiration measurement method with improved robustness based on a CNN model. Appl. Sci. 2022, 12, 11603. [Google Scholar] [CrossRef]
  2. Black, C.J.; Ford, A.C. Global burden of irritable bowel syndrome: Trends, predictions and risk factors. Nat. Rev. Gastroenterol. Hepatol. 2020, 17, 473–486. [Google Scholar] [CrossRef] [PubMed]
  3. Amyar, A.; Modzelewski, R.; Li, H.; Ruan, S. Multi-task deep learning based CT imaging analysis for COVID-19 pneumonia: Classification and segmentation. Comput. Biol. Med. 2020, 126, 104037. [Google Scholar] [CrossRef] [PubMed]
  4. Schiller, L.R.; Pardi, D.S.; Sellin, J.H. Chronic diarrhea: Diagnosis and management. Clin. Gastroenterol. Hepatol. 2017, 15, 182–193.e3. [Google Scholar] [CrossRef] [PubMed] [Green Version]
  5. Simon, K. Colorectal cancer development and advances in screening. Clin. Interv. Aging 2016, 11, 967. [Google Scholar]
  6. Kinross, J.M.; Mason, S.E.; Mylonas, G.; Darzi, A. Next-generation robotics in gastrointestinal surgery. Nat. Rev. Gastroenterol. Hepatol. 2020, 17, 430–440. [Google Scholar] [CrossRef]
  7. Zhang, Y.; Chu, J.; Leng, L.; Miao, J. Mask-refined R-CNN: A network for refining object details in instance segmentation. Sensors 2020, 20, 1010. [Google Scholar] [CrossRef] [Green Version]
  8. Afrasiabi, M.; Mansoorizadeh, M. DTW-CNN: Time series-based human interaction prediction in videos using CNN-extracted features. Vis. Comput. 2020, 36, 1127–1139. [Google Scholar] [CrossRef]
  9. Solatidehkordi, Z.; Zualkernan, I. Survey on recent trends in medical image classification using semi-supervised learning. Appl. Sci. 2022, 12, 12094. [Google Scholar] [CrossRef]
  10. Huang, Y.C.; Chen, C.A.; Chen, T.Y.; Chou, H.S.; Lin, W.C.; Li, T.C.; Yuan, J.J.; Lin, S.Y.; Li, C.W.; Chen, S.L.; et al. Tooth position determination by automatic cutting and marking of dental panoramic x-ray film in medical image processing. Appl. Sci. 2021, 11, 11904. [Google Scholar] [CrossRef]
  11. Yang, Z.; Xia, W.; Lu, Z.; Chen, Y.; Li, X.; Zhang, Y. Hypernetwork-based personalized federated learning for multi-Institutional CT imaging. arXiv 2022, arXiv:2206.03709. [Google Scholar]
  12. Ampavathi, A.; Saradhi, T.V. Multi disease-prediction framework using hybrid deep learning: An optimal prediction model. Comput. Methods Biomech. Biomed. Eng. 2021, 24, 1146–1168. [Google Scholar] [CrossRef] [PubMed]
  13. Nkamgang, O.T.; Tchiotsop, D.; Fotsin, H.B.; Talla, P.K.; Dorr, V.L.; Wolf, D. Automating the clinical stools exam using image processing integrated in an expert system. Inform. Med. Unlocked 2019, 15, 100165. [Google Scholar] [CrossRef]
  14. Yang, Z.; Leng, L.; Kim, B.G. StoolNet for color classification of stool medical images. Electronics 2019, 8, 1464. [Google Scholar] [CrossRef] [Green Version]
  15. Choy, Y.P.; Hu, G.; Chen, J. Detection and classification of human stool using deep convolutional neural networks. IEEE Access 2021, 9, 160485–160496. [Google Scholar] [CrossRef]
  16. Leng, L.; Yang, Z.; Kim, C.; Zhang, Y. A light-weight practical framework for feces detection and trait recognition. Sensors 2020, 20, 2644. [Google Scholar] [CrossRef]
  17. Zhou, Q.; Yu, C.; Wang, Z.; Qian, Q.; Li, H. Instant-teaching: An end-to-end semi-supervised object detection framework. In Proceedings of the IEEE/CVF Conference on Computer Vision and Pattern Recognition, Nashville, TN, USA, 20–25 June 2021; pp. 4081–4090. [Google Scholar]
  18. Schmidhuber, J. New millennium AI and the convergence of history: Update of 2012. In Singularity Hypotheses; Springer: Berlin/Heidelberg, Germany, 2012; pp. 61–82. [Google Scholar]
  19. Gupta, S.; Kim, J.; Grauman, K.; Mooney, R. Watch, listen & learn: Co-training on captioned images and videos. In Joint European Conference on Machine Learning and Knowledge Discovery in Databases; Springer: Berlin/Heidelberg, Germany, 2008; pp. 457–472. [Google Scholar]
  20. Bie, T.; Cristianini, N. Convex methods for transduction. Adv. Neural Inf. Process. Syst. 2004, 16, 73–80. [Google Scholar]
  21. Xu, C.; Tao, D.; Xu, C. A survey on multi-view learning. arXiv 2013, arXiv:1304.5634. [Google Scholar]
  22. Li, Y.F.; Zhou, Z.H. Towards making unlabeled data never hurt. IEEE Trans. Pattern Anal. Mach. Intell. 2014, 37, 175–188. [Google Scholar]
  23. Sohn, K.; Zhang, Z.; Li, C.L.; Zhang, H.; Lee, C.Y.; Pfister, T. A simple semi-supervised learning framework for object detection. arXiv 2020, arXiv:2005.04757. [Google Scholar]
  24. Sohn, K.; Berthelot, D.; Carlini, N.; Zhang, Z.; Zhang, H.; Raffel, C.A.; Cubuk, E.D.; Kurakin, A.; Li, C.L. Fixmatch: Simplifying semi-supervised learning with consistency and confidence. Adv. Neural Inf. Process. Syst. 2020, 33, 596–608. [Google Scholar]
  25. Xie, Q.; Luong, M.T.; Hovy, E.; Le, Q.V. Self-training with noisy student improves imagenet classification. In Proceedings of the IEEE/CVF Conference on Computer Vision and Pattern Recognition, Seattle, WA, USA, 14–19 June 2020; pp. 10687–10698. [Google Scholar]
  26. Rasmus, A.; Berglund, M.; Honkala, M.; Valpola, H.; Raiko, T. Semi-supervised learning with ladder networks. Adv. Neural Inf. Process. Syst. 2015, 28, 3546–3554. [Google Scholar]
  27. Prémont-Schwarz, I.; Ilin, A.; Hao, T.; Rasmus, A.; Boney, R.; Valpola, H. Recurrent ladder networks. Adv. Neural Inf. Process. Syst. 2017, 30, 6009–6019. [Google Scholar]
  28. Pezeshki, M.; Fan, L.; Brakel, P.; Courville, A.; Bengio, Y. Deconstructing the ladder network architectur. In Proceedings of the 33rd International Conference on Machine Learning, PMLR, New York, NY, USA, 20–22 June 2016; JMLR Workshop and Conference Proceedings. pp. 2368–2376. [Google Scholar]
  29. Bachman, P.; Alsharif, O.; Precup, D. Learning with pseudo-ensembles. Adv. Neural Inf. Process. Syst. 2014, 27, 3365–3373. [Google Scholar]
  30. Laine, S.; Aila, T. Temporal ensembling for semi-supervised learning. arXiv 2016, arXiv:1610.02242. [Google Scholar]
  31. Zhou, X.; Belkin, M. Semi-supervised learning. In Academic Press Library in Signal Processing; Elsevier: Amsterdam, The Netherlands, 2014; Volume 1, pp. 1239–1269. [Google Scholar]
Figure 1. Categories of feces images: (ad) for color classification and (eg) for trait classification.
Electronics 12 00344 g001
Figure 2. Procedure of semi-supervised learning.
Electronics 12 00344 g002
Figure 3. Small-ROI samples.
Electronics 12 00344 g003
Figure 4. Adaptive upsampling of ROI.
Electronics 12 00344 g004
Figure 5. Process for synthesizing real-scene feces images.
Electronics 12 00344 g005
Table 1. Examination tasks.
Categories
ScenariosUnhealthyHealthy
Task (4 Colors)RedBlackYellowBrown
Task (3 Colors)RedBlackOther
Task (3 Traits)LiquidWaterySoft
Table 2. Results on medical scenes with three color categories.
Foreground RatioAccuracy (Color)Accuracy (Trait)
90%0.8330.925
80–90%0.8600.866
70–80%0.8900.880
60–70%0.8500.956
≤60%0.8030.838
Table 3. Results for four color categories in medical scenes.
Model AccuracyRecall
Black Red Yellow Brown
StoolNet [14] 97.0 % 97.6 % 96.8 % 96.8 % 96.8 %
Single task- 94.8 % 94.4 % 95.2 % 94.4 % 95.2 %
AUS 98.0 % 96.8 % 97.6 % 99.2 % 98.4 %
SSL 96.0 % 94.4 % 93.7 % 97.6 % 98.4 %
AUS+SSL 97.0 % 95.2 % 96.0 % 97.6 % 99.2 %
Multi-task- 92.1 % 92.9 % 94.4 % 90.5 % 90.5 %
AUS 95.0 % 93.7 % 93.7 % 96.0 % 96.8 %
SSL 91.1 % 92.9 % 92.1 % 90.5 % 88.8 %
AUS+SSL 95.0 % 94.4 % 96.0 % 94.4 % 95.2 %
Table 4. Results for three color categories in medical scenes.
Model AccuracyRecall
BlackRedOthers
StoolNet [14] 98.0 % 94.3 % 92.6 % 93.8 %
Single task- 95.8 % 94.9 % 96.6 % 96.0 %
AUS 97.5 % 96.0 % 98.3 % 98.3 %
SSL 97.0 % 95.5 % 97.2 % 98.3 %
AUS+SSL 97.0 % 97.7 % 98.9 % 94.3 %
Multi-task- 97.0 % 97.2 % 98.3 % 95.5 %
AUS 100.0 % 100.0 % 100.0 % 100.0 %
SSL 98.9 % 98.9 % 98.9 % 98.9 %
AUS+SSL 99.1 % 99.4 % 98.9 % 98.9 %
Table 5. Results for three trait categories in medical scenes.
Model AccuracyRecall
LiquidSoftWatery
Feces trait [15] 95.1 % 93.8 % 94.3 % 97.2 %
Single task- 97.0 % 98.9 % 97.2 % 94.9 %
AUS 97.5 % 97.2 % 97.7 % 97.7 %
SSL 97.0 % 98.9 % 96.6 % 95.5 %
AUS+SSL 97.5 % 98.9 % 97.2 % 96.6 %
Multi-task- 98.1 % 99.4 % 98.3 % 96.6 %
AUS 99.1 % 100.0 % 98.3 % 98.9 %
SSL 98.3 % 98.3 % 98.3 % 98.3 %
AUS+SSL 99.2 % 100 % 98.9 % 98.9 %
Table 6. Results for four color categories in real scenes.
Model AccuracyRecall
Black Red Yellow Brown
StoolNet [14] 92.1 % 93.7 % 92.9 % 90.5 % 91.3 %
Single task- 94.1 % 92.9 % 93.7 % 95.2 % 94.4 %
AUS 95.0 % 93.7 % 95.2 % 95.2 % 95.2 %
SSL 94.0 % 92.9 % 94.4 % 95.2 % 95.2 %
AUS+SSL 96.0 % 96.0 % 94.4 % 99.2 % 94.4 %
Multi-task- 93.9 % 95.2 % 93.7 % 94.4 % 92.9 %
AUS 96.0 % 99.2 % 95.2 % 95.2 % 94.4 %
SSL 94.0 % 95.2 % 93.7 % 94.4 % 92.9 %
AUS+SSL 96.0 % 97.6 % 96.8 % 95.2 % 94.4 %
Table 7. Results for three color categories in real scenes.
Model AccuracyRecall
BlackRedOthers
StoolNet [14] 95.0 % 94.3 % 94.9 % 96.6 %
Single task- 95.6 % 94.9 % 94.9 % 97.2 %
AUS 95.8 % 95.5 % 95.5 % 97.2 %
SSL 95.0 % 94.9 % 94.9 % 94.9 %
AUS+SSL 95.0 % 94.9 % 94.9 % 94.9 %
Multi-task- 98.3 % 97.2 % 98.9 % 99.4 %
AUS 99.1 % 99.4 % 99.4 % 98.3 %
SSL 97.9 % 97.7 % 98.3 % 97.2 %
AUS+SSL 98.0 % 98.3 % 98.9 % 96.6 %
Table 8. Results for three trait categories in real scenes.
Model AccuracyRecall
LiquidSoftWatery
Feces trait [15] 95.0 % 100.0 % 99.4 % 97.7 %
Single task- 95.1 % 95.5 % 94.3 % 96.0 %
AUS 97.5 % 95.5 % 94.3 % 96.0 %
SSL 95.8 % 97.2 % 97.7 % 97.7 %
AUS+SSL 97.5 % 97.2 % 95.5 % 94.9 %
Multi-task- 99.2 % 96.6 % 97.2 % 98.9 %
AUS 100.0 % 100.0 % 100.0 % 100.0 %
SSL 98.9 % 99.4 % 98.9 % 98.3 %
AUS+SSL 99.0 % 99.4 % 98.9 % 98.3 %
Disclaimer/Publisher’s Note: The statements, opinions and data contained in all publications are solely those of the individual author(s) and contributor(s) and not of MDPI and/or the editor(s). MDPI and/or the editor(s) disclaim responsibility for any injury to people or property resulting from any ideas, methods, instructions or products referred to in the content.

