
EdgeSVDNet: 5G-Enabled Detection and Classification of Vision-Threatening Diabetic Retinopathy in Retinal Fundus Images


Abstract
:1. Introduction
2. Literature Review
3. Materials and Methods
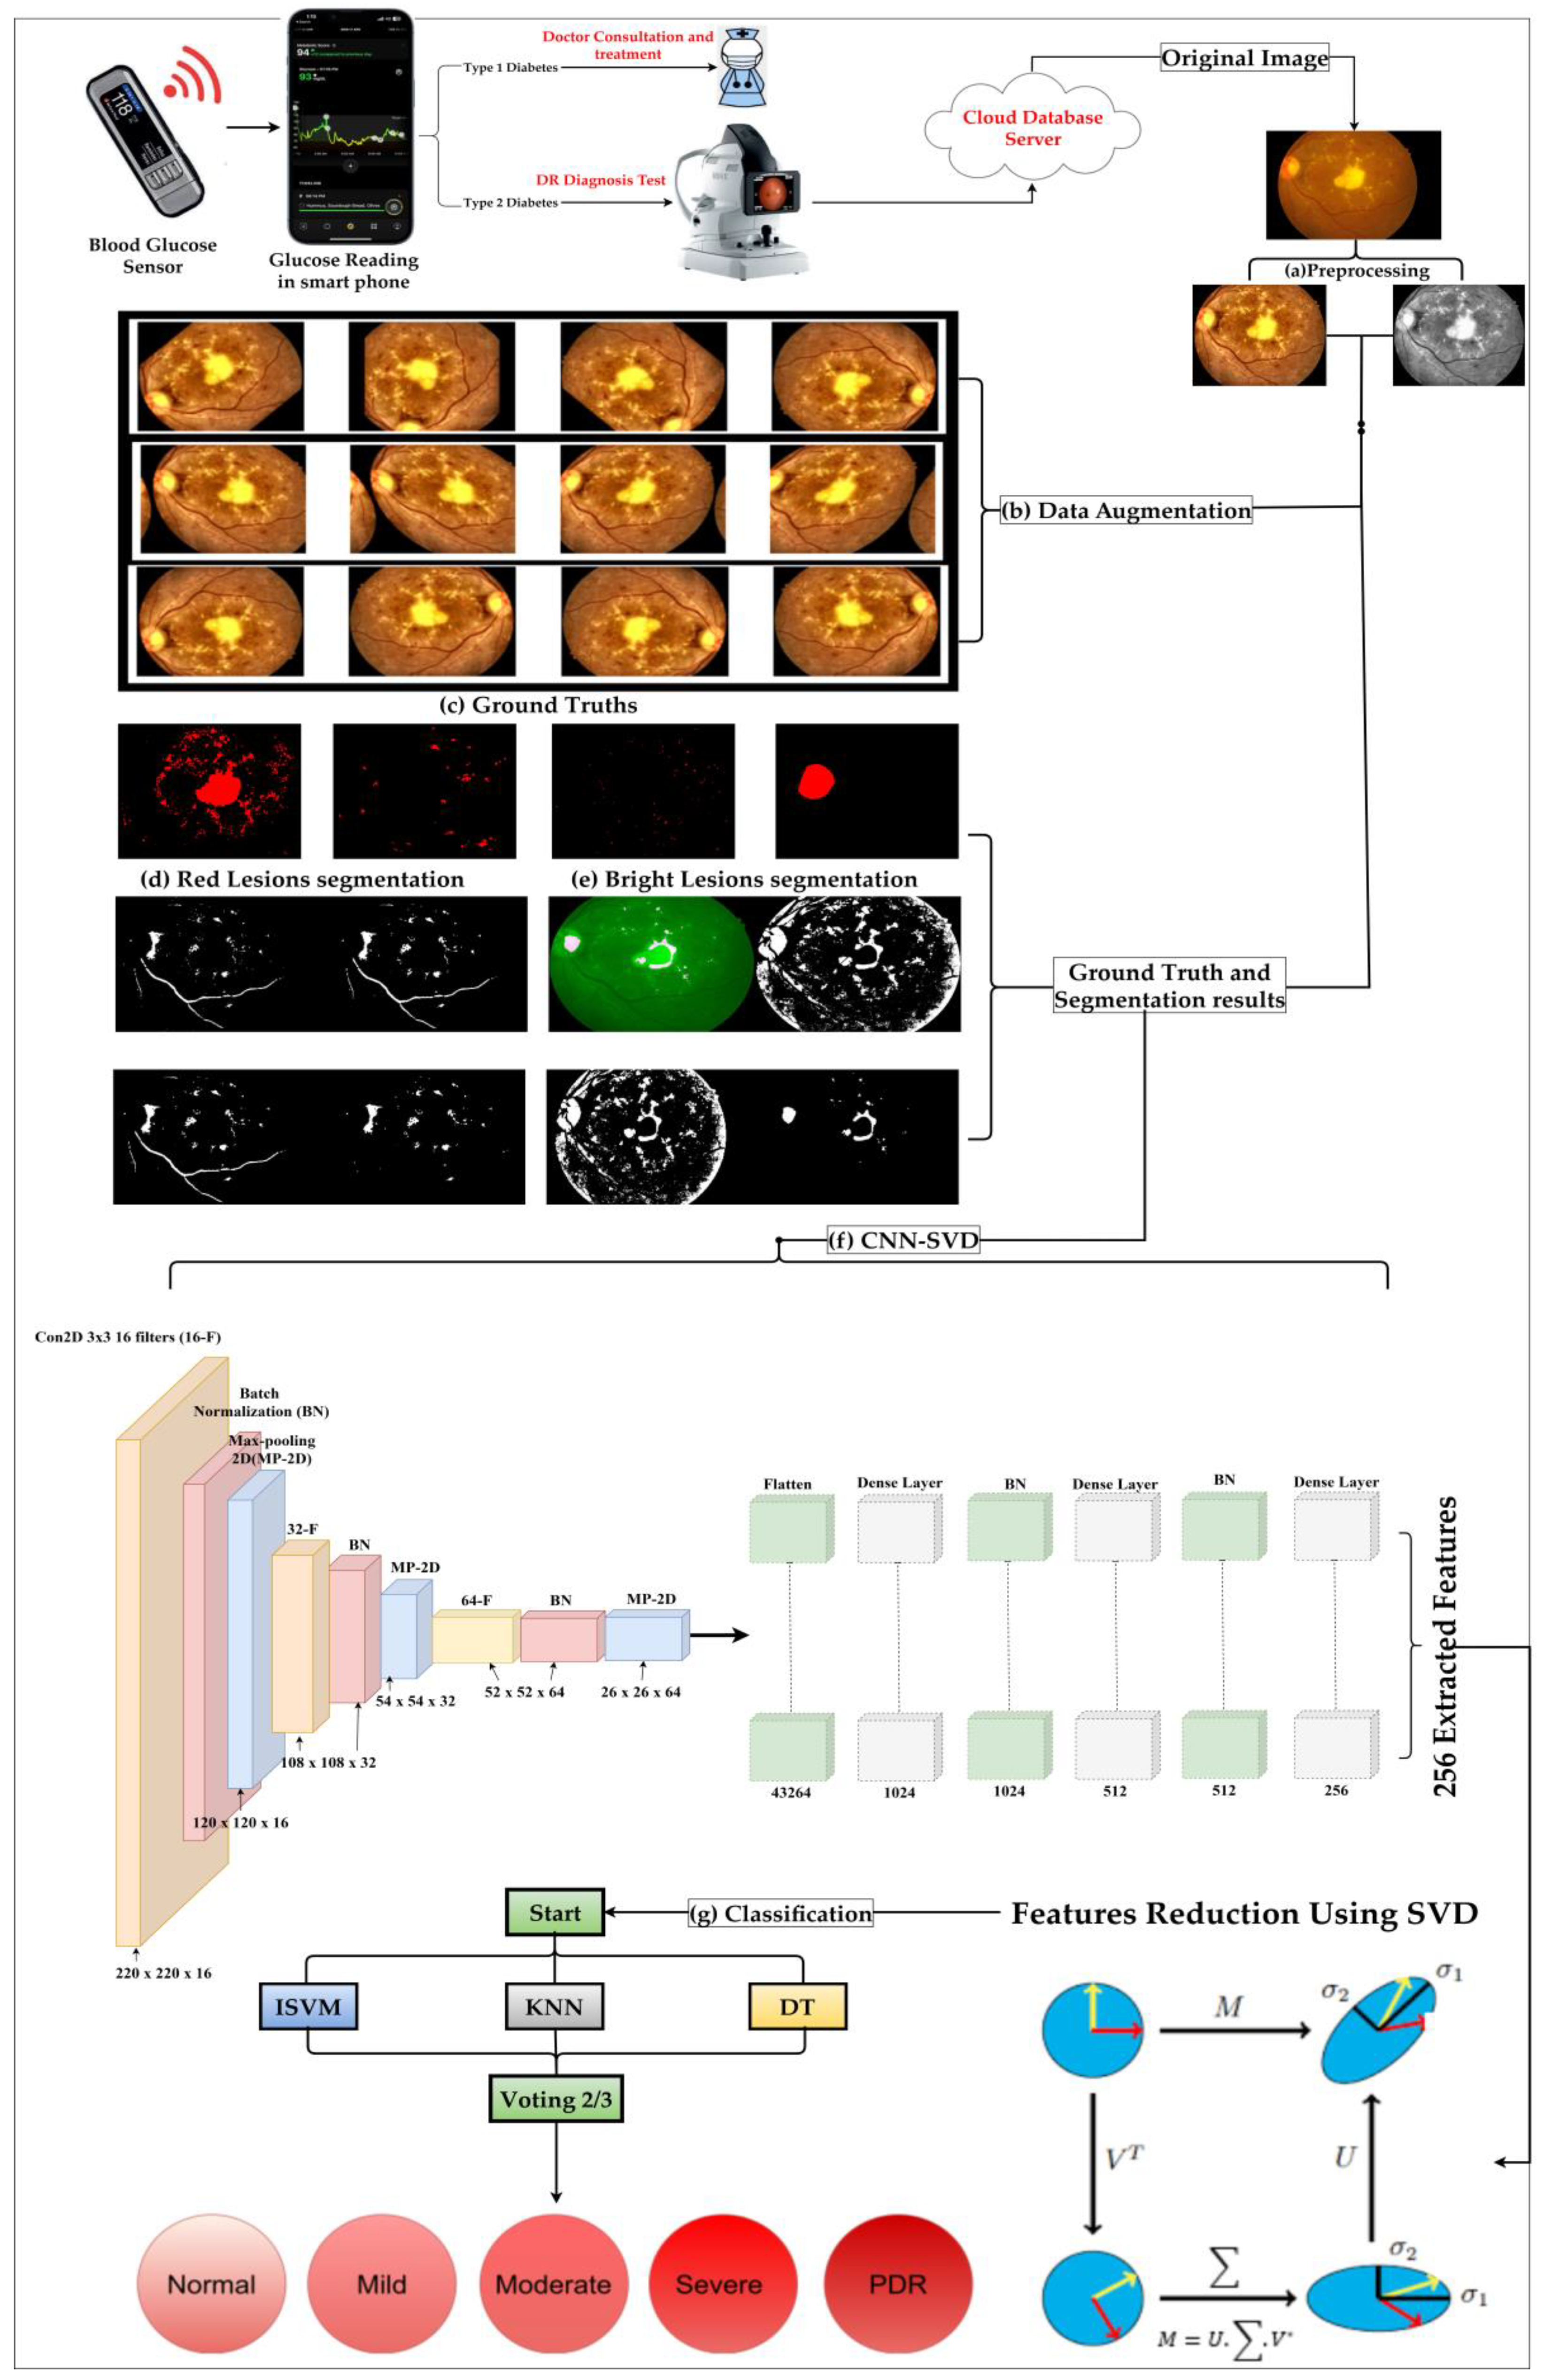
3.1. Pre-Processing and Data Augmentation
3.1.1. Pre-processing Techniques
- FI Scaling: We transform retinal images to RGB through the inverse YCbCr transformation. This step is not just a color space conversion; it also ensures that all images conform to a standardized size, facilitating uniformity for the ensuing steps and ensuring no data are lost in the subsequent stages.
- Histogram Equalization and Contrast Stretching: The intensity distribution within images often varies, which could mask vital details. By employing histogram equalization, we redistribute these intensities, ensuring a balanced representation of the image’s features. Moreover, with contrast limited adaptive histogram equalization (CLAHE), we ensure that this redistribution does not lead to excessive noise, as it limits extreme enhancements, providing a more natural and clearer image. Data augmentation becomes crucial for the AI model to generalize well on unseen data and avoid overfitting. By creating new, varied images from the existing dataset, we ensure the model trains on a more comprehensive set of data [47].
3.1.2. Data Augmentation Techniques
- Rotation: Rotating the images between 0 and 360 degrees ensures the model is not biased towards any specific orientation. In real-world scenarios, images could come in varied angles and this step trains the model to recognize features irrespective of orientation.
- Shearing: We mimic potential distortions by introducing shearing at angles ranging from 10 to 20 degrees. This ensures that minor changes in perspective or angle do not hinder the model’s recognition capabilities.
- Flip: In medical imaging, mirror image variations are common due to different imaging angles. Flipping images horizontally and vertically introduces the model to these possibilities, making it robust against such variations.
- Zoom: Zooming in and out within a range of (1/1.3, 1.3) simulates different focus levels. It trains the model to identify features even when they are not at the optimal focus, ensuring consistent performance across varied image quality.
- Crop: Cropping images to 85% and 95% of their original size exposes the model to images where certain features might be partially off-frame or images taken with different resolutions.
- Translation: Translating or shifting images between −25 and 25 pixels in all directions imitates potential misalignments during imaging. The model learns to recognize features even when they are slightly displaced.
3.2. Feature Extraction and Reduction by CNN-SVD from FIs
3.3. In-Depth Exploration of the Proposed Classification Technique
3.3.1. Improved Support Vector Machine with Radial Basis Function
3.3.2. K-Nearest Neighbor (KNN)
3.3.3. Decision Tree (DT)
3.4. Comprehensive Performance and Complexity Evaluation of the Proposed Methodology
3.4.1. Performance Evaluation Metrics
3.4.2. Evaluation of Theoretical Computational Complexity
- Pre-processing and Data Augmentation: These foundational steps predominantly exhibit a complexity of O(n), with n symbolizing image pixel count.
- Feature Extraction via CNN-SVD: With the convolutional neural network (CNN) relying on its architectural depth (L layers) and breadth (F filters), its complexity can be estimated as O(L × F × n2). The singular value decomposition (SVD), on the other hand, has a complexity represented by O(r × m × n).
- Working Mechanism of Novel ISVM-RBF: The intricacies of SVM-RBF revolve around its support vectors (S) and the dimensionality (D) of the feature space, leading to a complexity for O(S × D).
- K-Nearest Neighbor (KNN): The simplicity of KNN does not shield it from computational demands, especially with a complexity driven by the number of training samples (N) and dimensionality (D), approximated as O(N × D).
- Decision Tree (DT): For this structured algorithm, its complexity is determined by the feature count (F), computed as O(F).
4. Results
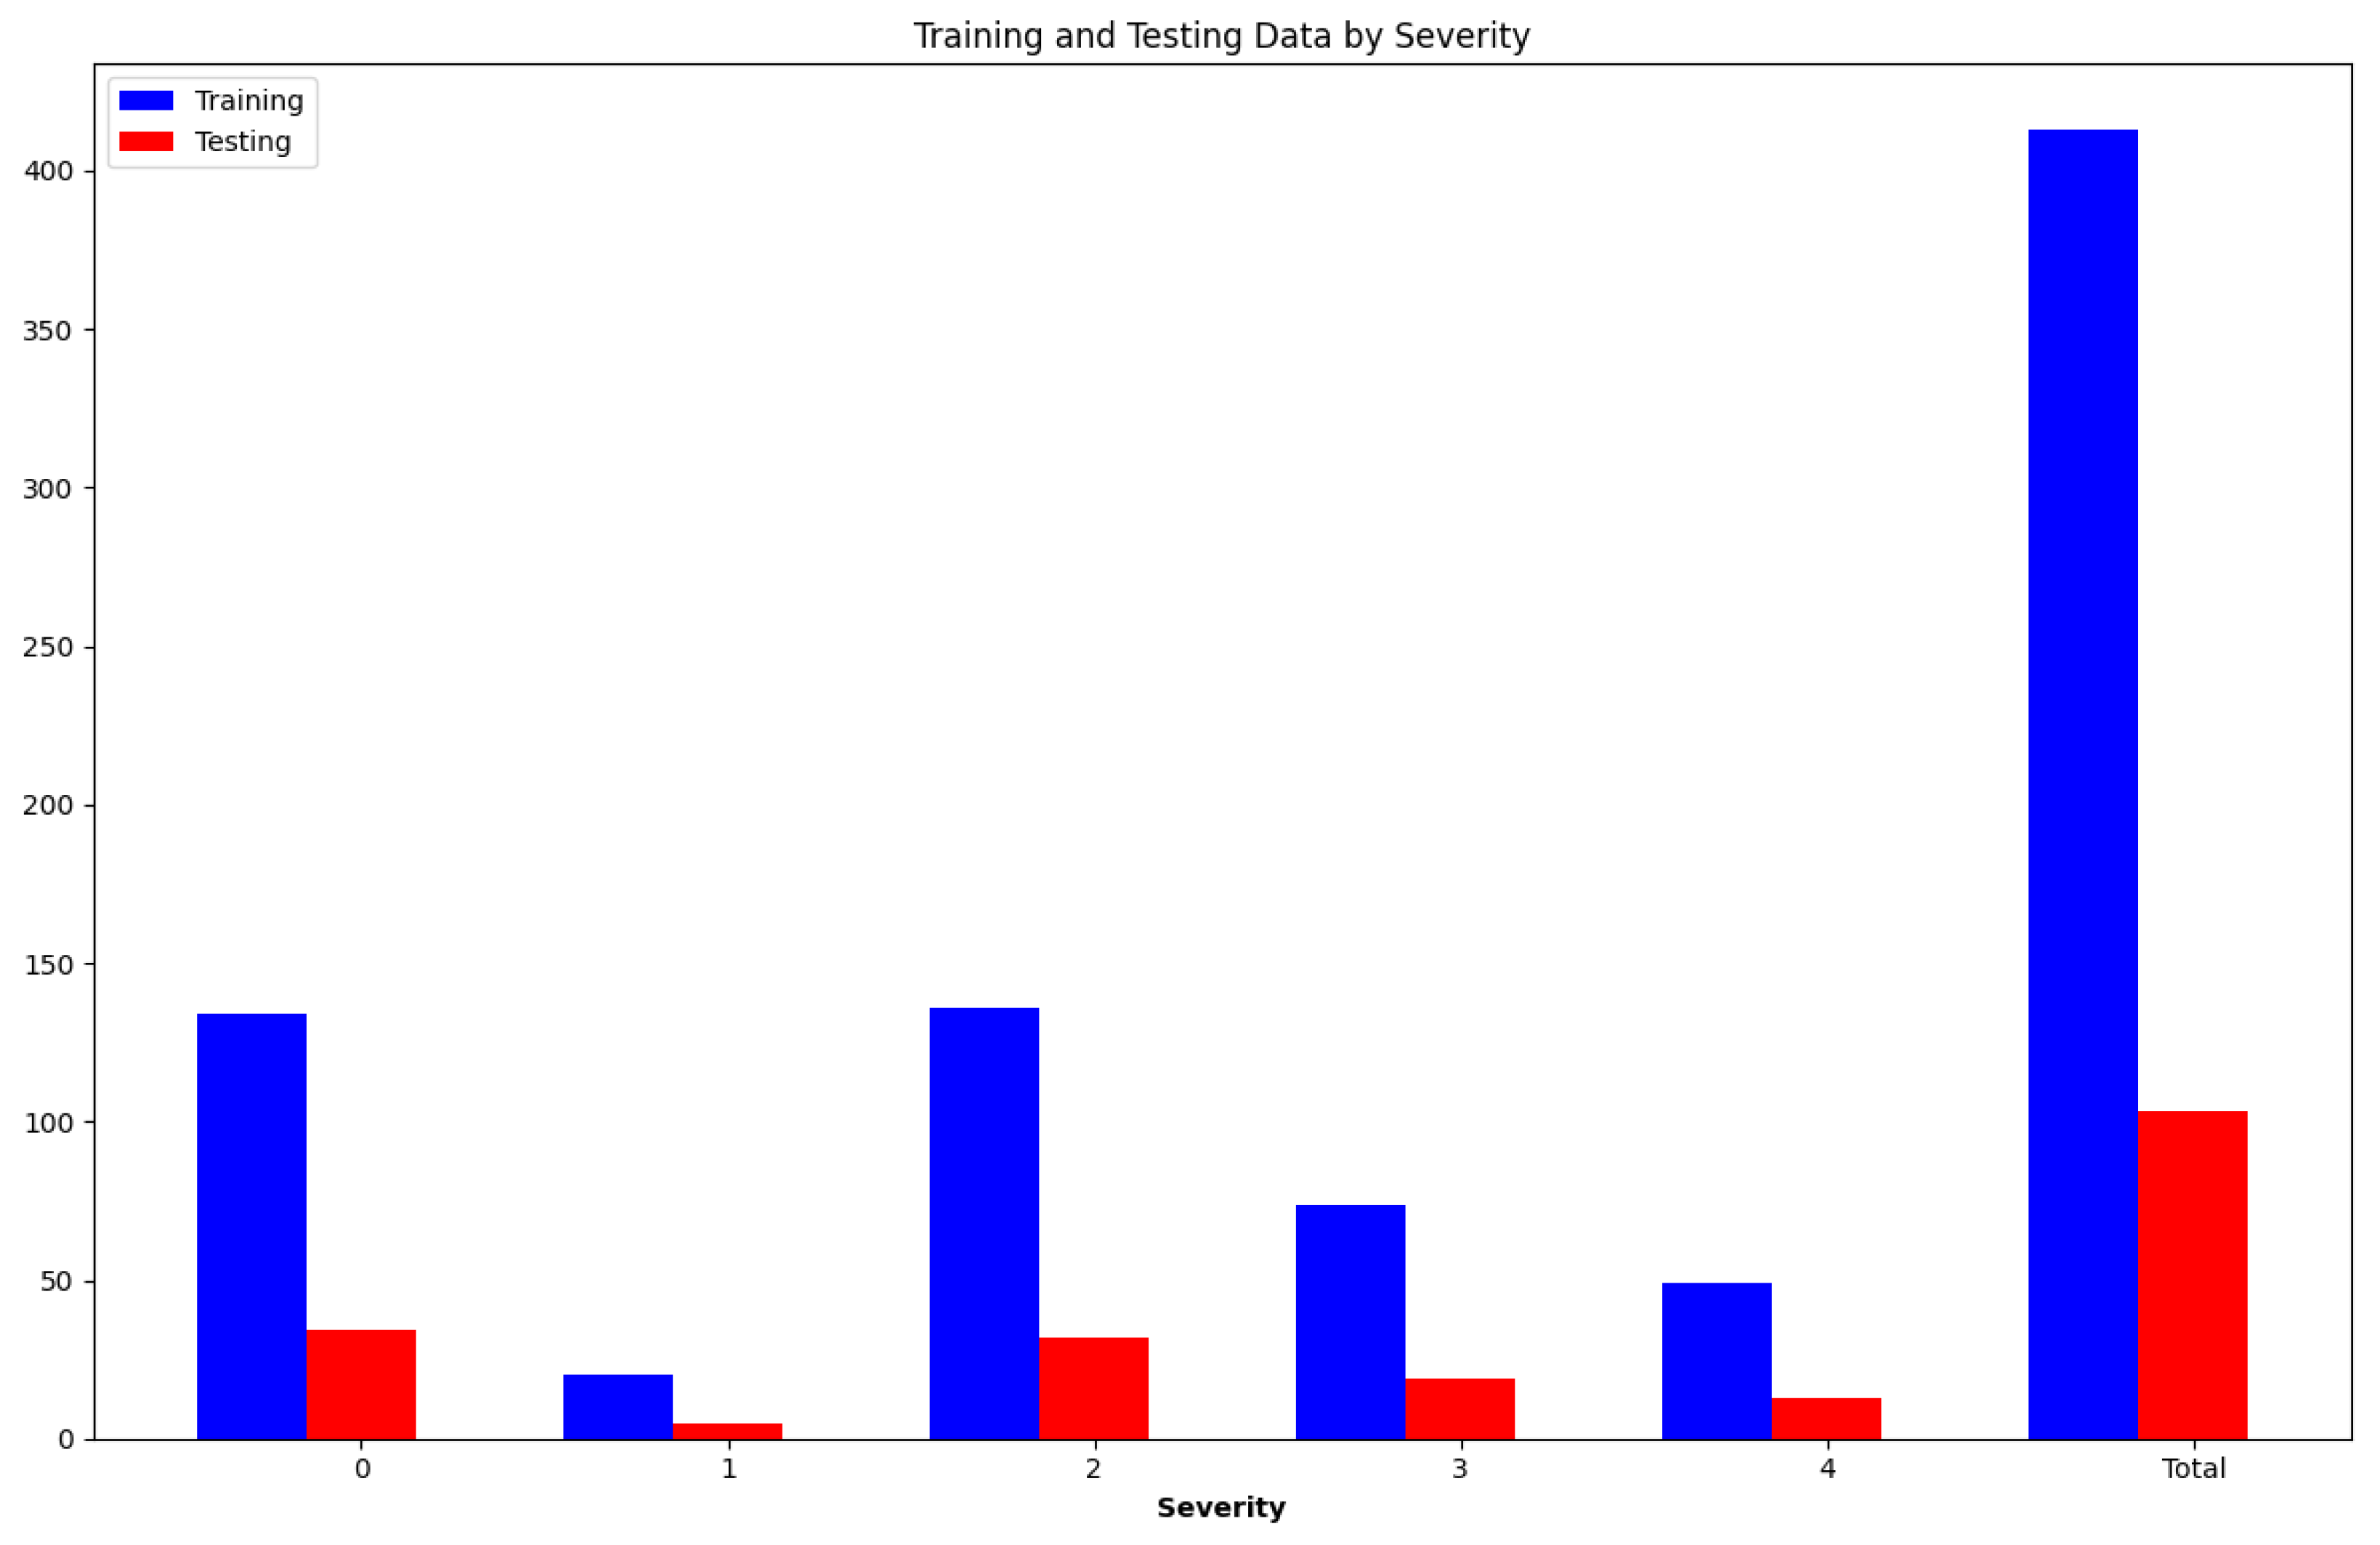
4.1. IDRiD Dataset
4.2. Experimental Setup
4.3. Image Processing Results
4.4. Time Complexity Analysis
4.5. Comparison with State-of-the-Art Studies

| Author | Year | Dataset | Method | Acc (%) | Sen (%) | Spc (%) |
|---|---|---|---|---|---|---|
| [51] | 2019 | IDRiD | GNN | 78.3 | - | - |
| [52] | 2019 | IDRiD | CNN + Handcrafed Features | 90.70 | - | - |
| [53] | 2019 | IDRiD | R-CNN | - | 83.00 | 94.00 |
| [54] | 2020 | IDRiD | CANeT | 92.60 | - | - |
| [55] | 2020 | IDRiD | 90.29 | 88.75 | 96.89 | |
| MESSIDOR | CNN | 90.89 | 88.75 | 96.30 | ||
| [56] | 2020 | IDRiD | RSNET | 86.33 | - | - |
| IDRiD | ||||||
| [57] | 2020 | Kaggle | CNN | 81.00 | - | - |
| [58] | 2021 | IDRiD | Fine KNN | 94.00 | - | - |
| MESSIDOR | 98.10 | - | - | |||
| [59] | 2022 | IDRiD | TL | 71.00 | - | 71.00 |
| [60] | 2022 | IDRiD | DCNN | 73.00 | - | - |
| [61] | 2022 | IDRiD | ELM | 99.04 | - | - |
| [62] | 2023 | IDRiD | GNN | 96.00 | - | - |
| [63] | 2023 | IDRiD | DLM | 96.65 | 89.00 | 99.00 |
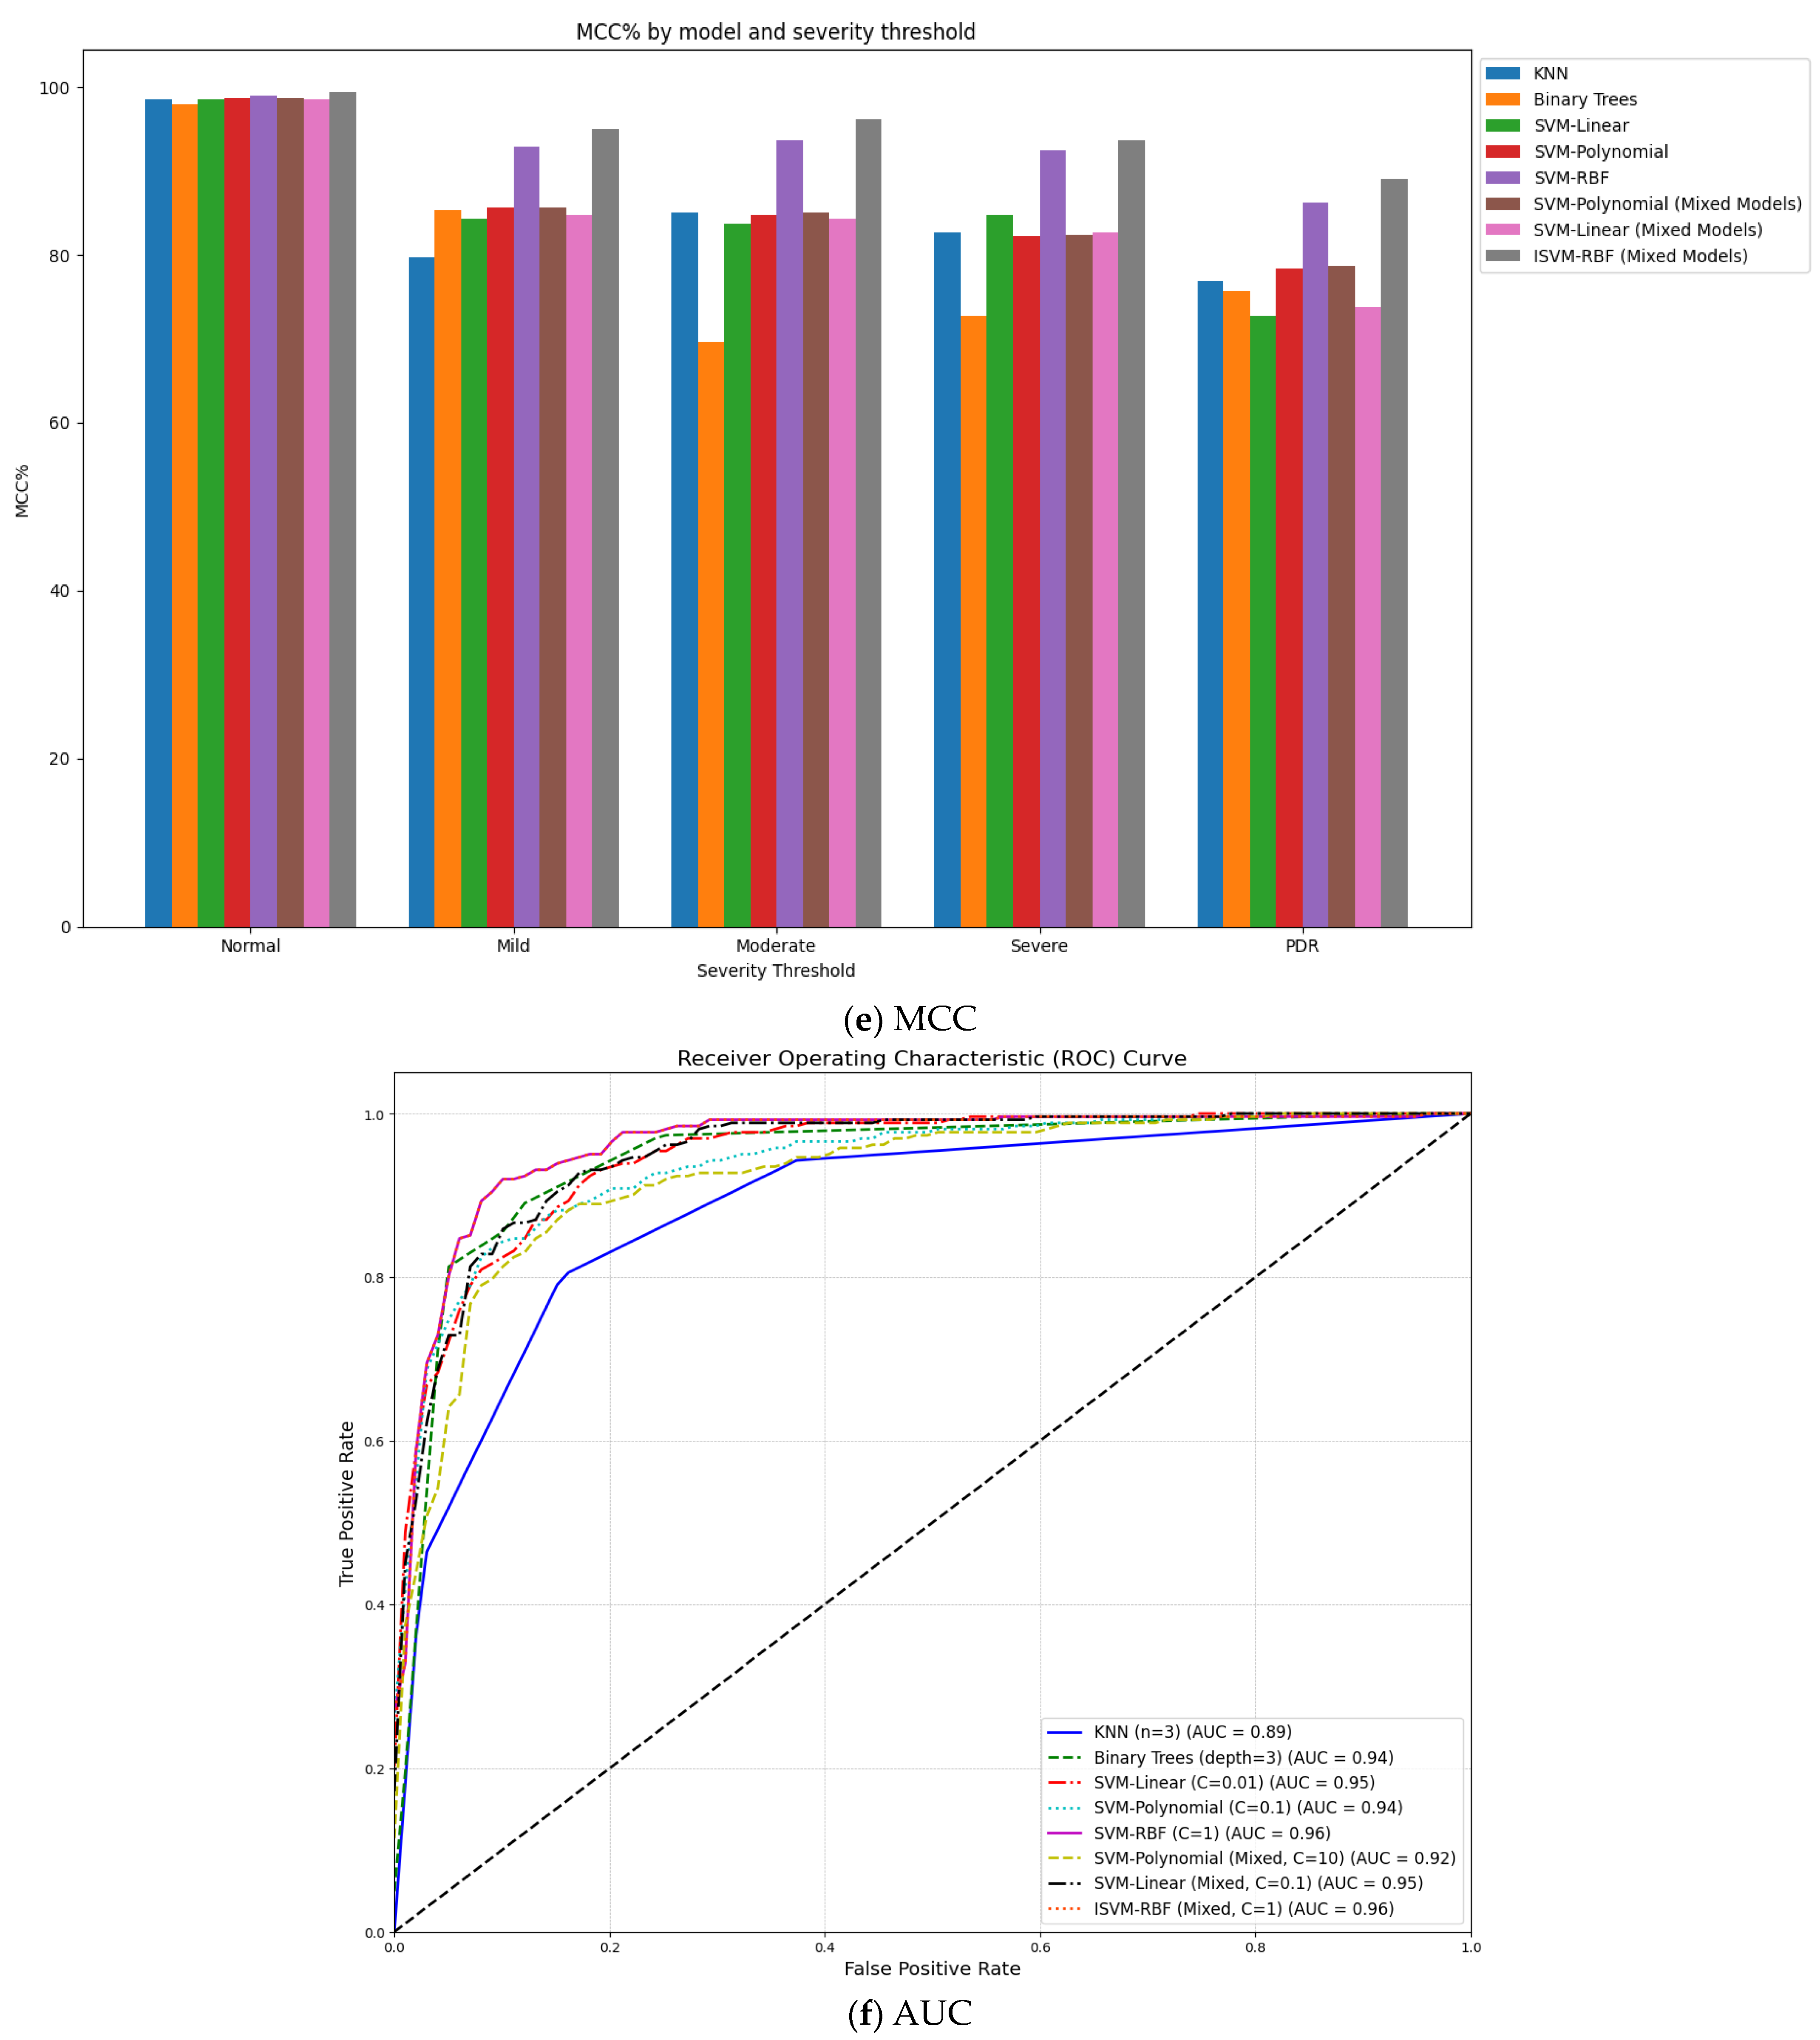
| Proposed work | 2023 | IDRiD | ISVM-RBF Mixture model | 99.89 | 89.20 | 100.00 |
5. Discussion
6. Conclusions
Author Contributions
Funding
Data Availability Statement
Conflicts of Interest
References
- Dao, N.N. Internet of Wearable Things: Advancements and Benefits from 6G Technologies. Futur. Gener. Comput. Syst. 2023, 138, 172–184. [Google Scholar] [CrossRef]
- Zhang, G.; Navimipour, N.J. A Comprehensive and Systematic Review of the IoT-Based Medical Management Systems: Applications, Techniques, Trends and Open Issues. Sustain. Cities Soc. 2022, 82, 103914. [Google Scholar] [CrossRef]
- Bilal, A.; Sun, G.; Mazhar, S.; Imran, A.; Latif, J. A Transfer Learning and U-Net-Based Automatic Detection of Diabetic Retinopathy from Fundus Images. Comput. Methods Biomech. Biomed. Eng. Imaging Vis. 2022, 10, 663–674. [Google Scholar] [CrossRef]
- Grassmann, F.; Mengelkamp, J.; Brandl, C.; Harsch, S.; Zimmermann, M.E.; Linkohr, B.; Peters, A.; Heid, I.M.; Palm, C.; Weber, B.H.F. A Deep Learning Algorithm for Prediction of Age-Related Eye Disease Study Severity Scale for Age-Related Macular Degeneration from Color Fundus Photography. Ophthalmology 2018, 125, 1410–1420. [Google Scholar] [CrossRef] [PubMed]
- Bilal, A.; Sun, G.; Mazhar, S. Survey on Recent Developments in Automatic Detection of Diabetic Retinopathy. J. Fr. Ophtalmol. 2021, 44, 420–440. [Google Scholar] [CrossRef]
- Alahmari, F.; Naim, A.; Alqahtani, H. E-Learning Modeling Technique and Convolution Neural Networks in Online Education. In IoT-Enabled Convolutional Neural Networks: Techniques and Applications; Taylor & Francis: Oxford, UK, 2023. [Google Scholar]
- Krichen, M. Convolutional Neural Networks: A Survey. Computers 2023, 12, 151. [Google Scholar] [CrossRef]
- Sahoo, K.S.; Tiwary, M.; Luhach, A.K.; Nayyar, A.; Choo, K.K.R.; Bilal, M. Demand-Supply-Based Economic Model for Resource Provisioning in Industrial IoT Traffic. IEEE Internet Things J. 2022, 9, 10529–10538. [Google Scholar] [CrossRef]
- Singh, M.; Sahoo, K.S.; Nayyar, A. Sustainable IoT Solution for Freshwater Aquaculture Management. IEEE Sens. J. 2022, 22, 16563–16572. [Google Scholar] [CrossRef]
- Bilal, A.; Sun, G.; Li, Y.; Mazhar, S.; Khan, A.Q. Diabetic Retinopathy Detection and Classification Using Mixed Models for a Disease Grading Database. IEEE Access 2021, 9, 23544–23553. [Google Scholar] [CrossRef]
- Kukkar, A.; Gupta, D.; Beram, S.M.; Soni, M.; Singh, N.K.; Sharma, A.; Neware, R.; Shabaz, M.; Rizwan, A. Optimizing Deep Learning Model Parameters Using Socially Implemented IoMT Systems for Diabetic Retinopathy Classification Problem. IEEE Trans. Comput. Soc. Syst. 2022, 10, 1654–1665. [Google Scholar] [CrossRef]
- Karimi, D.; Warfield, S.K.; Gholipour, A. Transfer Learning in Medical Image Segmentation: New Insights from Analysis of the Dynamics of Model Parameters and Learned Representations. Artif. Intell. Med. 2021, 116, 102078. [Google Scholar] [CrossRef] [PubMed]
- Bilal, A.; Zhu, L.; Deng, A.; Lu, H.; Wu, N. AI-Based Automatic Detection and Classification of Diabetic Retinopathy Using U-Net and Deep Learning. Symmetry 2022, 14, 1427. [Google Scholar] [CrossRef]
- Bilal, A.; Sun, G.; Mazhar, S.; Imran, A. Improved Grey Wolf Optimization-Based Feature Selection and Classification Using CNN for Diabetic Retinopathy Detection. In Evolutionary Computing and Mobile Sustainable Networks: Proceedings of ICECMSN 2021; Springer: Singapore, 2022; Volume 116, pp. 1–14. [Google Scholar] [CrossRef]
- Bilal, A.; Sun, G.; Mazhar, S. Diabetic Retinopathy Detection Using Weighted Filters and Classification Using CNN. In Proceedings of the 2021 International Conference on Intelligent Technologies (CONIT), Hubli, India, 25–27 June 2021. [Google Scholar] [CrossRef]
- Hollon, T.C.; Pandian, B.; Adapa, A.R.; Urias, E.; Save, A.V.; Khalsa, S.S.S.; Eichberg, D.G.; D’Amico, R.S.; Farooq, Z.U.; Lewis, S.; et al. Near Real-Time Intraoperative Brain Tumor Diagnosis Using Stimulated Raman Histology and Deep Neural Networks. Nat. Med. 2020, 26, 52–58. [Google Scholar] [CrossRef] [PubMed]
- Neely, D.C.; Bray, K.J.; Huisingh, C.E.; Clark, M.E.; McGwin, G.; Owsley, C. Prevalence of Undiagnosed Age-Related Macular Degeneration in Primary Eye Care. JAMA Ophthalmol. 2017, 135, 570–575. [Google Scholar] [CrossRef]
- Balyen, L.; Peto, T. Promising Artificial Intelligence–Machine Learning–Deep Learning Algorithms in Ophthalmology. Asia-Pac. J. Ophthalmol. 2019, 8, 264–272. [Google Scholar]
- Topol, E.J. High-Performance Medicine: The Convergence of Human and Artificial Intelligence. Nat. Med. 2019, 25, 44–56. [Google Scholar] [CrossRef]
- Alam, T.M.; Shaukat, K.; Khan, W.A.; Hameed, I.A.; Almuqren, L.A.; Raza, M.A.; Aslam, M.; Luo, S. An Efficient Deep Learning-Based Skin Cancer Classifier for an Imbalanced Dataset. Diagnostics 2022, 12, 2115. [Google Scholar] [CrossRef]
- Duc, N.T.; Ryu, S.; Qureshi, M.N.I.; Choi, M.; Lee, K.H.; Lee, B. 3D-Deep Learning Based Automatic Diagnosis of Alzheimer’s Disease with Joint MMSE Prediction Using Resting-State FMRI. Neuroinformatics 2020, 18, 71–86. [Google Scholar] [CrossRef]
- Madan, P.; Singh, V.; Singh, D.P.; Diwakar, M.; Pant, B.; Kishor, A. A Hybrid Deep Learning Approach for ECG-Based Arrhythmia Classification. Bioengineering 2022, 9, 152. [Google Scholar] [CrossRef]
- Bilal, A.; Sun, G.; Mazhar, S.; Junjie, Z. Neuro-Optimized Numerical Treatment of HIV Infection Model. Int. J. Biomath. 2021, 14, 2150033. [Google Scholar] [CrossRef]
- Shi, Z.; Miao, C.; Schoepf, U.J.; Savage, R.H.; Dargis, D.M.; Pan, C.; Chai, X.; Li, X.L.; Xia, S.; Zhang, X.; et al. A Clinically Applicable Deep-Learning Model for Detecting Intracranial Aneurysm in Computed Tomography Angiography Images. Nat. Commun. 2020, 11, 6090. [Google Scholar] [CrossRef] [PubMed]
- Bilal, A.; Shafiq, M.; Fang, F.; Waqar, M.; Ullah, I.; Ghadi, Y.Y.; Long, H.; Zeng, R. IGWO-IVNet3: DL-Based Automatic Diagnosis of Lung Nodules Using an Improved Gray Wolf Optimization and InceptionNet-V3. Sensors 2022, 22, 9603. [Google Scholar] [CrossRef] [PubMed]
- Wetstein, S.C.; de Jong, V.M.T.; Stathonikos, N.; Opdam, M.; Dackus, G.M.H.E.; Pluim, J.P.W.; van Diest, P.J.; Veta, M. Deep Learning-Based Breast Cancer Grading and Survival Analysis on Whole-Slide Histopathology Images. Sci. Rep. 2022, 12, 15102. [Google Scholar] [CrossRef] [PubMed]
- Kermany, D.S.; Goldbaum, M.; Cai, W.; Valentim, C.C.S.; Liang, H.; Baxter, S.L.; McKeown, A.; Yang, G.; Wu, X.; Yan, F.; et al. Identifying Medical Diagnoses and Treatable Diseases by Image-Based Deep Learning. Cell 2018, 172, 1122–1131.e9. [Google Scholar] [CrossRef] [PubMed]
- Sundar, S.; Sumathy, S. An Effective Deep Learning Model for Grading Abnormalities in Retinal Fundus Images Using Variational Auto-Encoders. Int. J. Imaging Syst. Technol. 2023, 33, 92–107. [Google Scholar] [CrossRef]
- Latif, J.; Tu, S.; Xiao, C.; Ur Rehman, S.; Imran, A.; Latif, Y. ODGNet: A Deep Learning Model for Automated Optic Disc Localization and Glaucoma Classifcation Using Fundus Images. SN Appl. Sci. 2022, 4, 98. [Google Scholar] [CrossRef]
- Chen, W.; Yang, B.; Li, J.; Wang, J. An Approach to Detecting Diabetic Retinopathy Based on Integrated Shallow Convolutional Neural Networks. IEEE Access 2020, 8, 178552–178562. [Google Scholar] [CrossRef]
- Pan, X.; Jin, K.; Cao, J.; Liu, Z.; Wu, J.; You, K.; Lu, Y.; Xu, Y.; Su, Z.; Jiang, J.; et al. Multi-Label Classification of Retinal Lesions in Diabetic Retinopathy for Automatic Analysis of Fundus Fluorescein Angiography Based on Deep Learning. Graefe’s Arch. Clin. Exp. Ophthalmol. 2020, 258, 779–785. [Google Scholar] [CrossRef]
- Tymchenko, B.; Marchenko, P.; Spodarets, D. Deep Learning Approach to Diabetic Retinopathy Detection. In Proceedings of the ICPRAM 2020—9th International Conference on Pattern Recognition Applications and Methods, Valletta, Malta, 22–24 February 2020. [Google Scholar]
- Qummar, S.; Khan, F.G.; Shah, S.; Khan, A.; Shamshirband, S.; Rehman, Z.U.; Khan, I.A.; Jadoon, W. A Deep Learning Ensemble Approach for Diabetic Retinopathy Detection. IEEE Access 2019, 7, 150530–150539. [Google Scholar] [CrossRef]
- Pao, S.I.; Lin, H.Z.; Chien, K.H.; Tai, M.C.; Chen, J.T.; Lin, G.M. Detection of Diabetic Retinopathy Using Bichannel Convolutional Neural Network. J. Ophthalmol. 2020, 2020, 9139713. [Google Scholar] [CrossRef]
- de la Torre, J.; Valls, A.; Puig, D. A Deep Learning Interpretable Classifier for Diabetic Retinopathy Disease Grading. Neurocomputing 2020, 396, 465–476. [Google Scholar] [CrossRef]
- Gadekallu, T.R.; Khare, N.; Bhattacharya, S.; Singh, S.; Maddikunta, P.K.R.; Ra, I.H.; Alazab, M. Early Detection of Diabetic Retinopathy Using Pca-Firefly Based Deep Learning Model. Electronics 2020, 9, 274. [Google Scholar] [CrossRef]
- Zeng, X.; Chen, H.; Luo, Y.; Ye, W. Automated Diabetic Retinopathy Detection Based on Binocular Siamese-like Convolutional Neural Network. IEEE Access 2019, 7, 30744–30753. [Google Scholar] [CrossRef]
- Mateen, M.; Wen, J.; Nasrullah, N.; Sun, S.; Hayat, S. Exudate Detection for Diabetic Retinopathy Using Pretrained Convolutional Neural Networks. Complexity 2020, 2020, 5801870. [Google Scholar] [CrossRef]
- Zhang, W.; Zhong, J.; Yang, S.; Gao, Z.; Hu, J.; Chen, Y.; Yi, Z. Automated Identification and Grading System of Diabetic Retinopathy Using Deep Neural Networks. Knowl.-Based Syst. 2019, 175, 12–25. [Google Scholar] [CrossRef]
- Samanta, A.; Saha, A.; Satapathy, S.C.; Fernandes, S.L.; Zhang, Y.D. Automated Detection of Diabetic Retinopathy Using Convolutional Neural Networks on a Small Dataset. Pattern Recognit. Lett. 2020, 135, 293–298. [Google Scholar] [CrossRef]
- Bibi, I.; Mir, J.; Raja, G. Automated Detection of Diabetic Retinopathy in Fundus Images Using Fused Features. Phys. Eng. Sci. Med. 2020, 43, 1253–1264. [Google Scholar] [CrossRef]
- Math, L.; Fatima, R. Adaptive Machine Learning Classification for Diabetic Retinopathy. Multimed. Tools Appl. 2021, 80, 5173–5186. [Google Scholar] [CrossRef]
- Rekhi, R.S.; Issac, A.; Dutta, M.K. Automated Detection and Grading of Diabetic Macular Edema from Digital Colour Fundus Images. In Proceedings of the 2017 4th IEEE Uttar Pradesh Section International Conference on Electrical, Computer and Electronics, UPCON 2017, Mathura, India, 26–28 October 2017. [Google Scholar]
- Marin, D.; Gegundez-Arias, M.E.; Ponte, B.; Alvarez, F.; Garrido, J.; Ortega, C.; Vasallo, M.J.; Bravo, J.M. An Exudate Detection Method for Diagnosis Risk of Diabetic Macular Edema in Retinal Images Using Feature-Based and Supervised Classification. Med. Biol. Eng. Comput. 2018, 56, 1379–1390. [Google Scholar] [CrossRef]
- Kunwar, A.; Magotra, S.; Sarathi, M.P. Detection of High-Risk Macular Edema Using Texture Features and Classification Using SVM Classifier. In Proceedings of the 2015 International Conference on Advances in Computing, Communications and Informatics, ICACCI 2015, Kochi, India, 10–13 August 2015. [Google Scholar]
- Perdomo, O.; Otalora, S.; Rodríguez, F.; Arevalo, J.; González, F.A. A Novel Machine Learning Model Based on Exudate Localization to Detect Diabetic Macular Edema. In Proceedings of the Ophthalmic Medical Image Analysis Thind International Workshop, OMIA 2016, Athens, Greece, 21 October 2016; Volume 3. [Google Scholar]
- Tufail, A.B.; Ullah, K.; Khan, R.A.; Shakir, M.; Khan, M.A.; Ullah, I.; Ma, Y.K.; Ali, M. On Improved 3D-CNN-Based Binary and Multiclass Classification of Alzheimer’s Disease Using Neuroimaging Modalities and Data Augmentation Methods. J. Healthc. Eng. 2022, 2022, 1302170. [Google Scholar] [CrossRef]
- Qadri, S.F.; Shen, L.; Ahmad, M.; Qadri, S.; Zareen, S.S.; Khan, S. OP-ConvNet: A Patch Classification-Based Framework for CT Vertebrae Segmentation. IEEE Access 2021, 9, 158227–158240. [Google Scholar] [CrossRef]
- Qadri, S.F.; Shen, L.; Ahmad, M.; Qadri, S.; Zareen, S.S.; Akbar, M.A. SVseg: Stacked Sparse Autoencoder-Based Patch Classification Modeling for Vertebrae Segmentation. Mathematics 2022, 10, 796. [Google Scholar] [CrossRef]
- Porwal, P.; Pachade, S.; Kamble, R.; Kokare, M.; Deshmukh, G.; Sahasrabuddhe, V.; Meriaudeau, F. Indian Diabetic Retinopathy Image Dataset (IDRiD): A Database for Diabetic Retinopathy Screening Research. Data 2018, 3, 25. [Google Scholar] [CrossRef]
- Sakaguchi, A.; Wu, R.; Kamata, S. Fundus Image Classification for Diabetic Retinopathy Using Disease Severity Grading. In Proceedings of the ACM International Conference Proceeding Series, Tokyo, Japan, 28–30 March 2019. [Google Scholar]
- Harangi, B.; Toth, J.; Baran, A.; Hajdu, A. Automatic Screening of Fundus Images Using a Combination of Convolutional Neural Network and Hand-Crafted Features. In Proceedings of the Annual International Conference of the IEEE Engineering in Medicine and Biology Society, EMBS, Berlin, Germany, 23–27 July 2019. [Google Scholar]
- Kind, A.; Azzopardi, G. An Explainable AI-Based Computer Aided Detection System for Diabetic Retinopathy Using Retinal Fundus Images. In Lecture Notes in Computer Science, Proceedings of the CAIP 2019: Computer Analysis of Images and Patterns, Salerno, Italy, 3–5 September 2019; Springer: Cham, Switzerland, 2019; Volume 11678. [Google Scholar]
- Li, X.; Hu, X.; Yu, L.; Zhu, L.; Fu, C.W.; Heng, P.A. CANet: Cross-Disease Attention Network for Joint Diabetic Retinopathy and Diabetic Macular Edema Grading. IEEE Trans. Med. Imaging 2020, 39, 1483–1493. [Google Scholar] [CrossRef] [PubMed]
- Elswah, D.K.; Elnakib, A.A.; El-Din Moustafa, H. Automated Diabetic Retinopathy Grading Using Resnet. In Proceedings of the National Radio Science Conference, NRSC, Cairo, Egypt, 8–10 September 2020. [Google Scholar]
- Saranya, P.; Prabakaran, S. Automatic Detection of Non-Proliferative Diabetic Retinopathy in Retinal Fundus Images Using Convolution Neural Network. J. Ambient. Intell. Humaniz. Comput. 2020, 1–10. [Google Scholar] [CrossRef]
- Alcalá-Rmz, V.; Maeda-Gutiérrez, V.; Zanella-Calzada, L.A.; Valladares-Salgado, A.; Celaya-Padilla, J.M.; Galván-Tejada, C.E. Convolutional Neural Network for Classification of Diabetic Retinopathy Grade. In Advances in Soft Computing, Proceedings of the 19th Mexican International Conference on Artificial Intelligence, MICAI 2020, Mexico City, Mexico, 12–17 October 2020; Springer International Publishing: Berlin/Heidelberg, Germany, 2020; Volume 12468, p. 12468. [Google Scholar]
- Bhardwaj, C.; Jain, S.; Sood, M. Hierarchical Severity Grade Classification of Non-Proliferative Diabetic Retinopathy. J. Ambient. Intell. Humaniz. Comput. 2021, 12, 2649–2670. [Google Scholar] [CrossRef]
- Shaukat, N.; Amin, J.; Sharif, M.; Azam, F.; Kadry, S.; Krishnamoorthy, S. Three-Dimensional Semantic Segmentation of Diabetic Retinopathy Lesions and Grading Using Transfer Learning. J. Pers. Med. 2022, 12, 1454. [Google Scholar] [CrossRef]
- Jiwani, N.; Gupta, K.; Afreen, N. A Convolutional Neural Network Approach for Diabetic Retinopathy Classification. In Proceedings of the 2022 IEEE 11th International Conference on Communication Systems and Network Technologies, CSNT 2022, Indore, India, 23–24 April 2022. [Google Scholar]
- Albadr, M.A.A.; Ayob, M.; Tiun, S.; AL-Dhief, F.T.; Hasan, M.K. Gray Wolf Optimization-Extreme Learning Machine Approach for Diabetic Retinopathy Detection. Front. Public. Health 2022, 10, 925901. [Google Scholar] [CrossRef]
- Chandran, J.J.G.; Jabez, J.; Srinivasulu, S. Auto-Metric Graph Neural Network Optimized with Capuchin Search Optimization Algorithm for Coinciding Diabetic Retinopathy and Diabetic Macular Edema Grading. Biomed. Signal Process. Control 2023, 80, 104386. [Google Scholar]
- Saranya, P.; Pranati, R.; Patro, S.S. Detection and Classification of Red Lesions from Retinal Images for Diabetic Retinopathy Detection Using Deep Learning Models. Multimed. Tools Appl. 2023, 1–21. [Google Scholar] [CrossRef]


| Reference | Proposed Methodology | Results | Limitations |
|---|---|---|---|
| [30] | Multi-scale shallow CNNs for retinal image classification | Enhanced model surpassed existing models | Not invariant to input data |
| [31] | Utilization of ResNet50 and VGG16 | Efficient DR lesion detection; computationally robust | Inaccurate identification of microaneurysms due to fluorescein |
| [32] | A DL-centric system with 3 CNN ensemble for DR stage detection | Improved and consistent results | Limited feature considerations affected the accuracy |
| [33] | Implementation of Dense121, Dense169, Resnet50, Inception V3, and Xception CNNs | Lesion identification based on mole severity | High computational cost |
| [34] | Entropy image from the fundus photo’s green component with UM pre-processing | Higher accuracy and Sensitivity | UM led to missing image edges |
| [35] | DR class prediction through deep learning, with pixel score assignment for final classification | DR class prediction through deep learning, with pixel score assignment for final classification | Potential improvements via relevant action inclusion for algorithm assessment |
| [36] | Early DR detection with PCA and firefly algorithm for dimensionality reduction | Superior approach showcased | Spatial information was lost due to feature reduction |
| [37] | The weight-sharing layer idea from Inception V3 creates a Siamese-like CNN architecture. | Promising DR detection with a kappa value of 0.829 | It might not work well with matched fundus photo datasets |
| [38] | Pre-trained CNN-based framework for exudate detection using ROI localization and transfer learning from various architectures | Technique surpassed existing methods | High training time for the developed model |
| [39] | Introduction of DeepDR framework and labeled DR image dataset | Specificity and sensitivity values of 97.7% and 97.5% respectively | Requires testing on larger and more complicated datasets |
| [40] | CNN-based DR detection on a small dataset with CLAHE enhancement | Better kappa score achieved | Prediction accuracy affected by uneven Gray Level |
| [41] | Two-stage preprocessing-centered model with various feature descriptors and SVM-based classification | The model was more generalized | Performance declined with noisier images |
| [42] | Adaptive ML classification with segment-level DR estimation using pre-trained CNN | Superior performance observed | High maintenance cost for the model |
| [43] | Incorporation of morphological, geometrical, and orientational properties with SVM classification | Achieved 92.11% accuracy for DR grading and classification | Achieved 92.11% accuracy for DR grading and classification |
| [44] | Future work could incorporate high-performance technologies. | Predicted DR risks with 0.90 sensitivity | Need to improve detection performance further |
| [45] | Utilization of texture characteristics with SVM classification. | Achieved 86% accuracy for high-risk DR detection | Conducted using a limited dataset |
| [46] | Two-stage CNNs approach | Identified areas of interest in the retinal picture and predicted the DR class. | Computationally demanding method |
| Matric Name | Mathematical Representation |
|---|---|
| Sensitivity | |
| Specificity | |
| Accuracy | |
| F1-Score | |
| MCC |
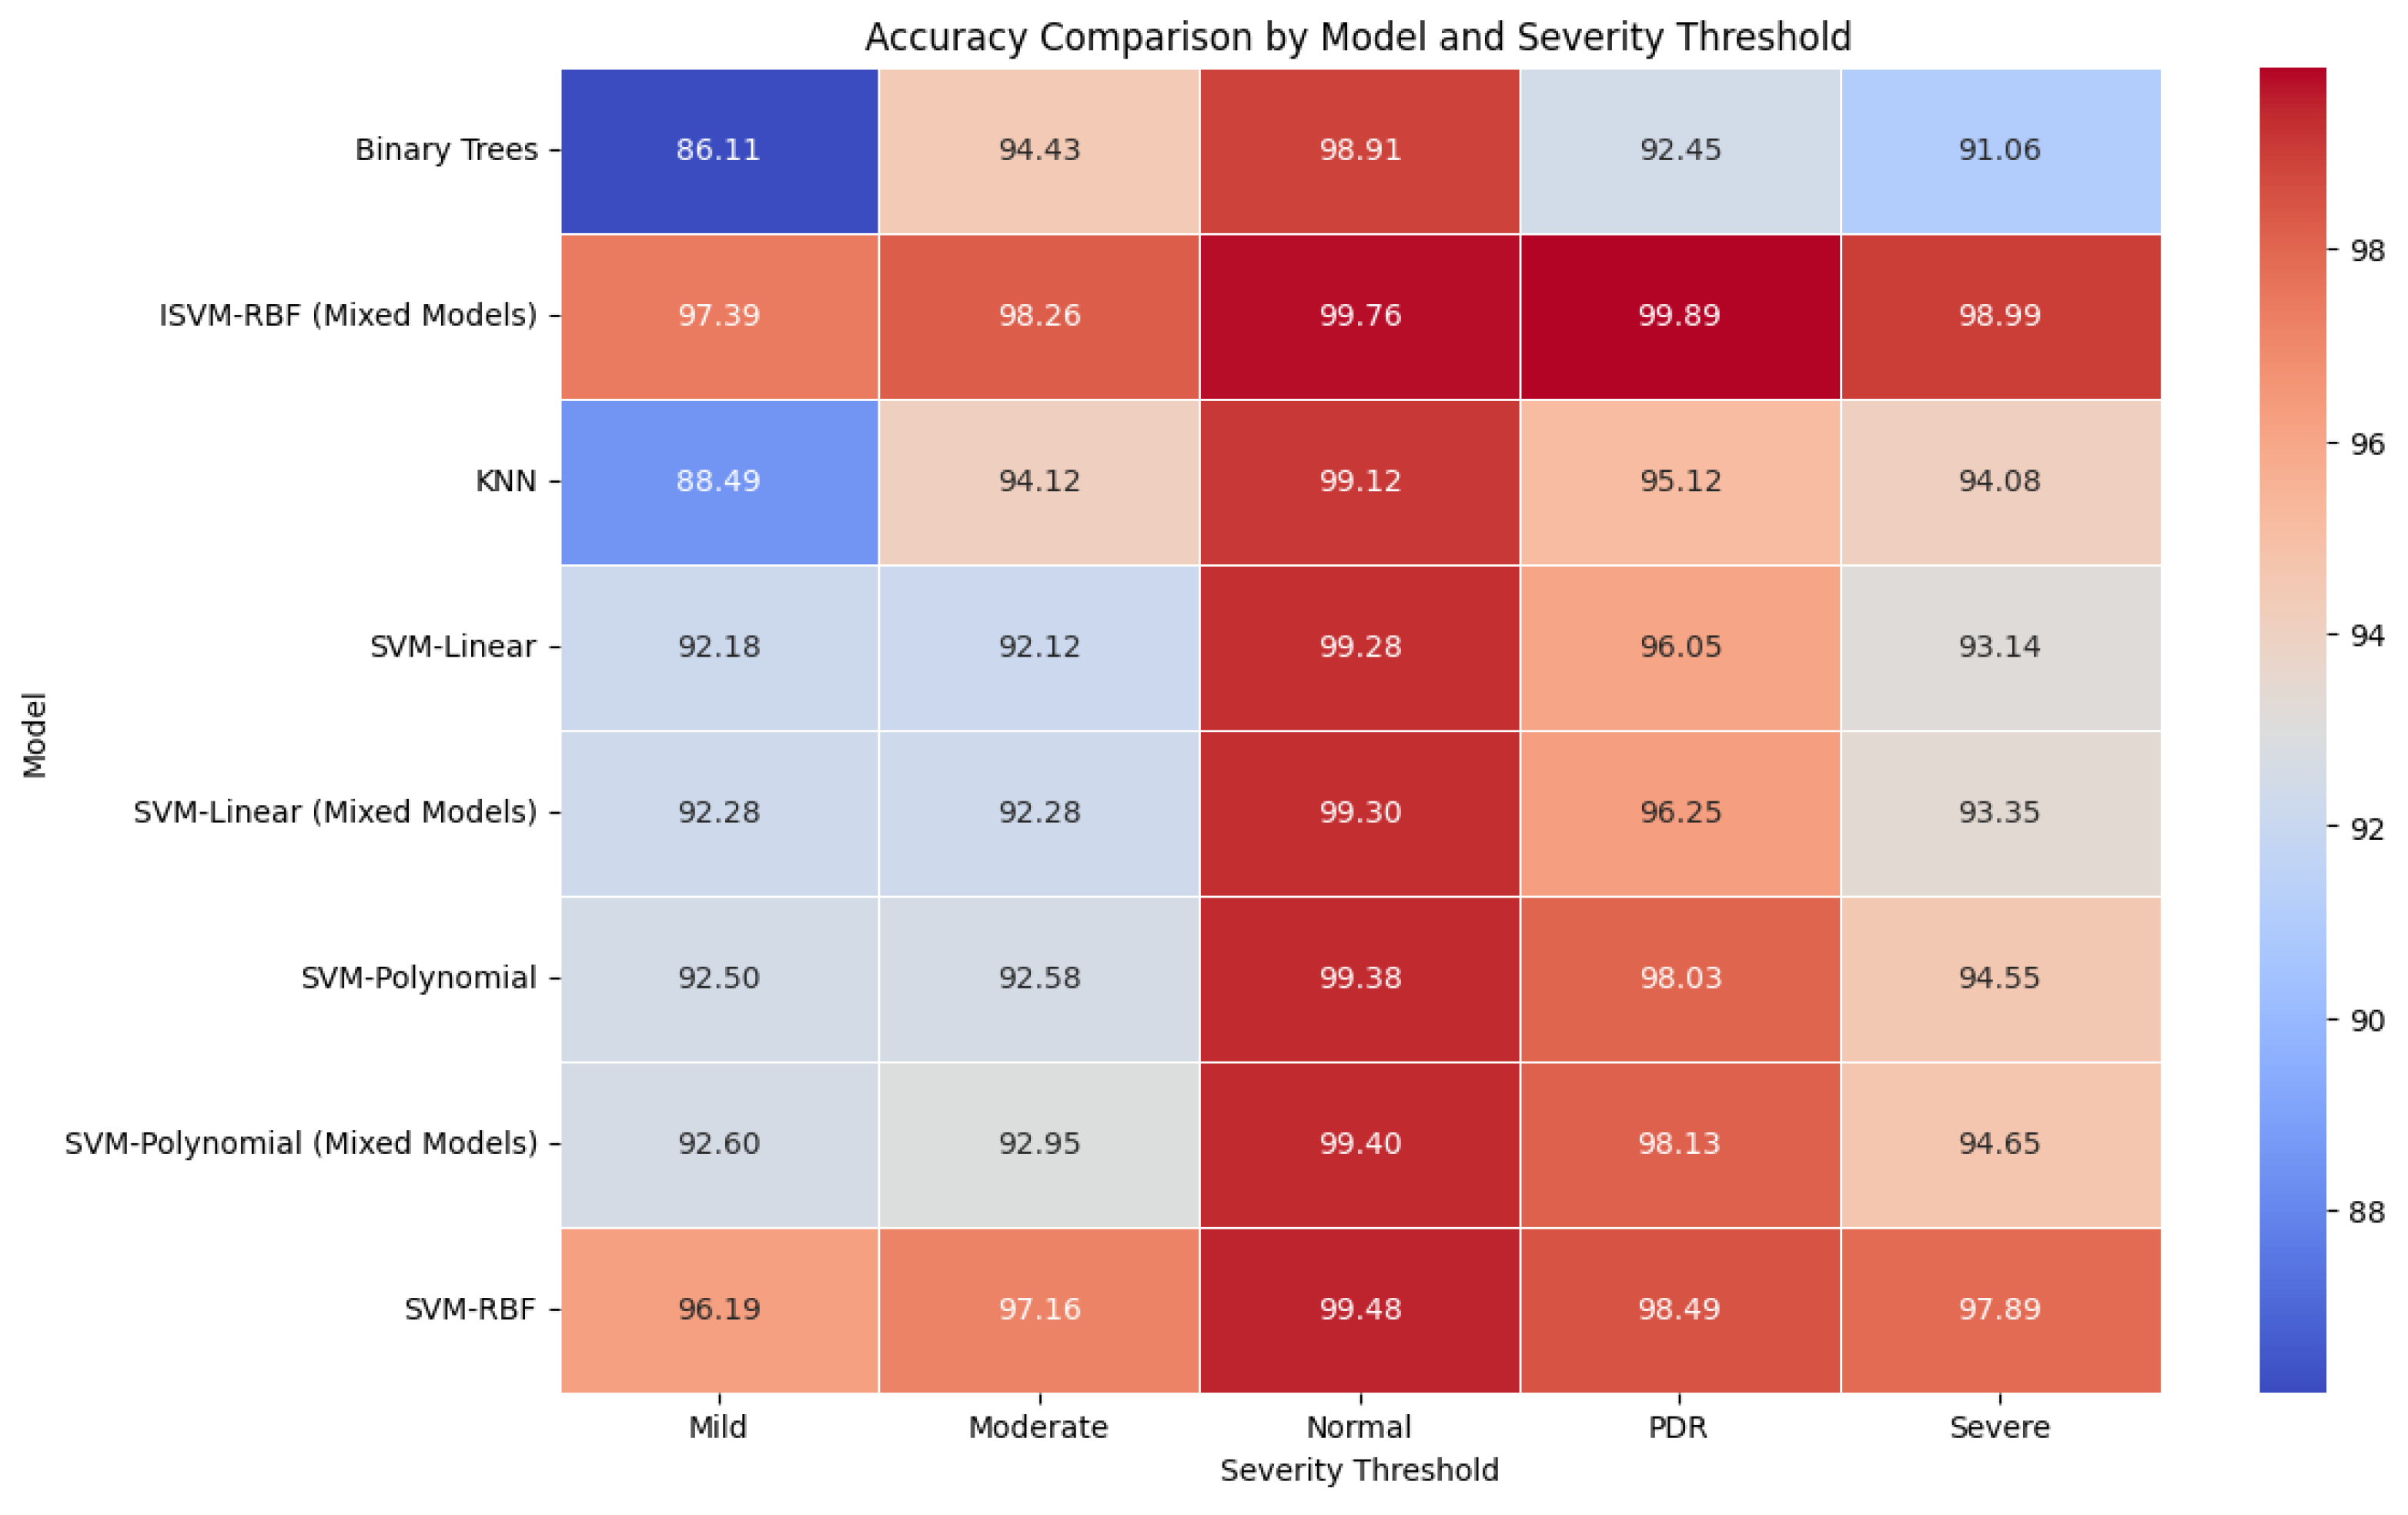
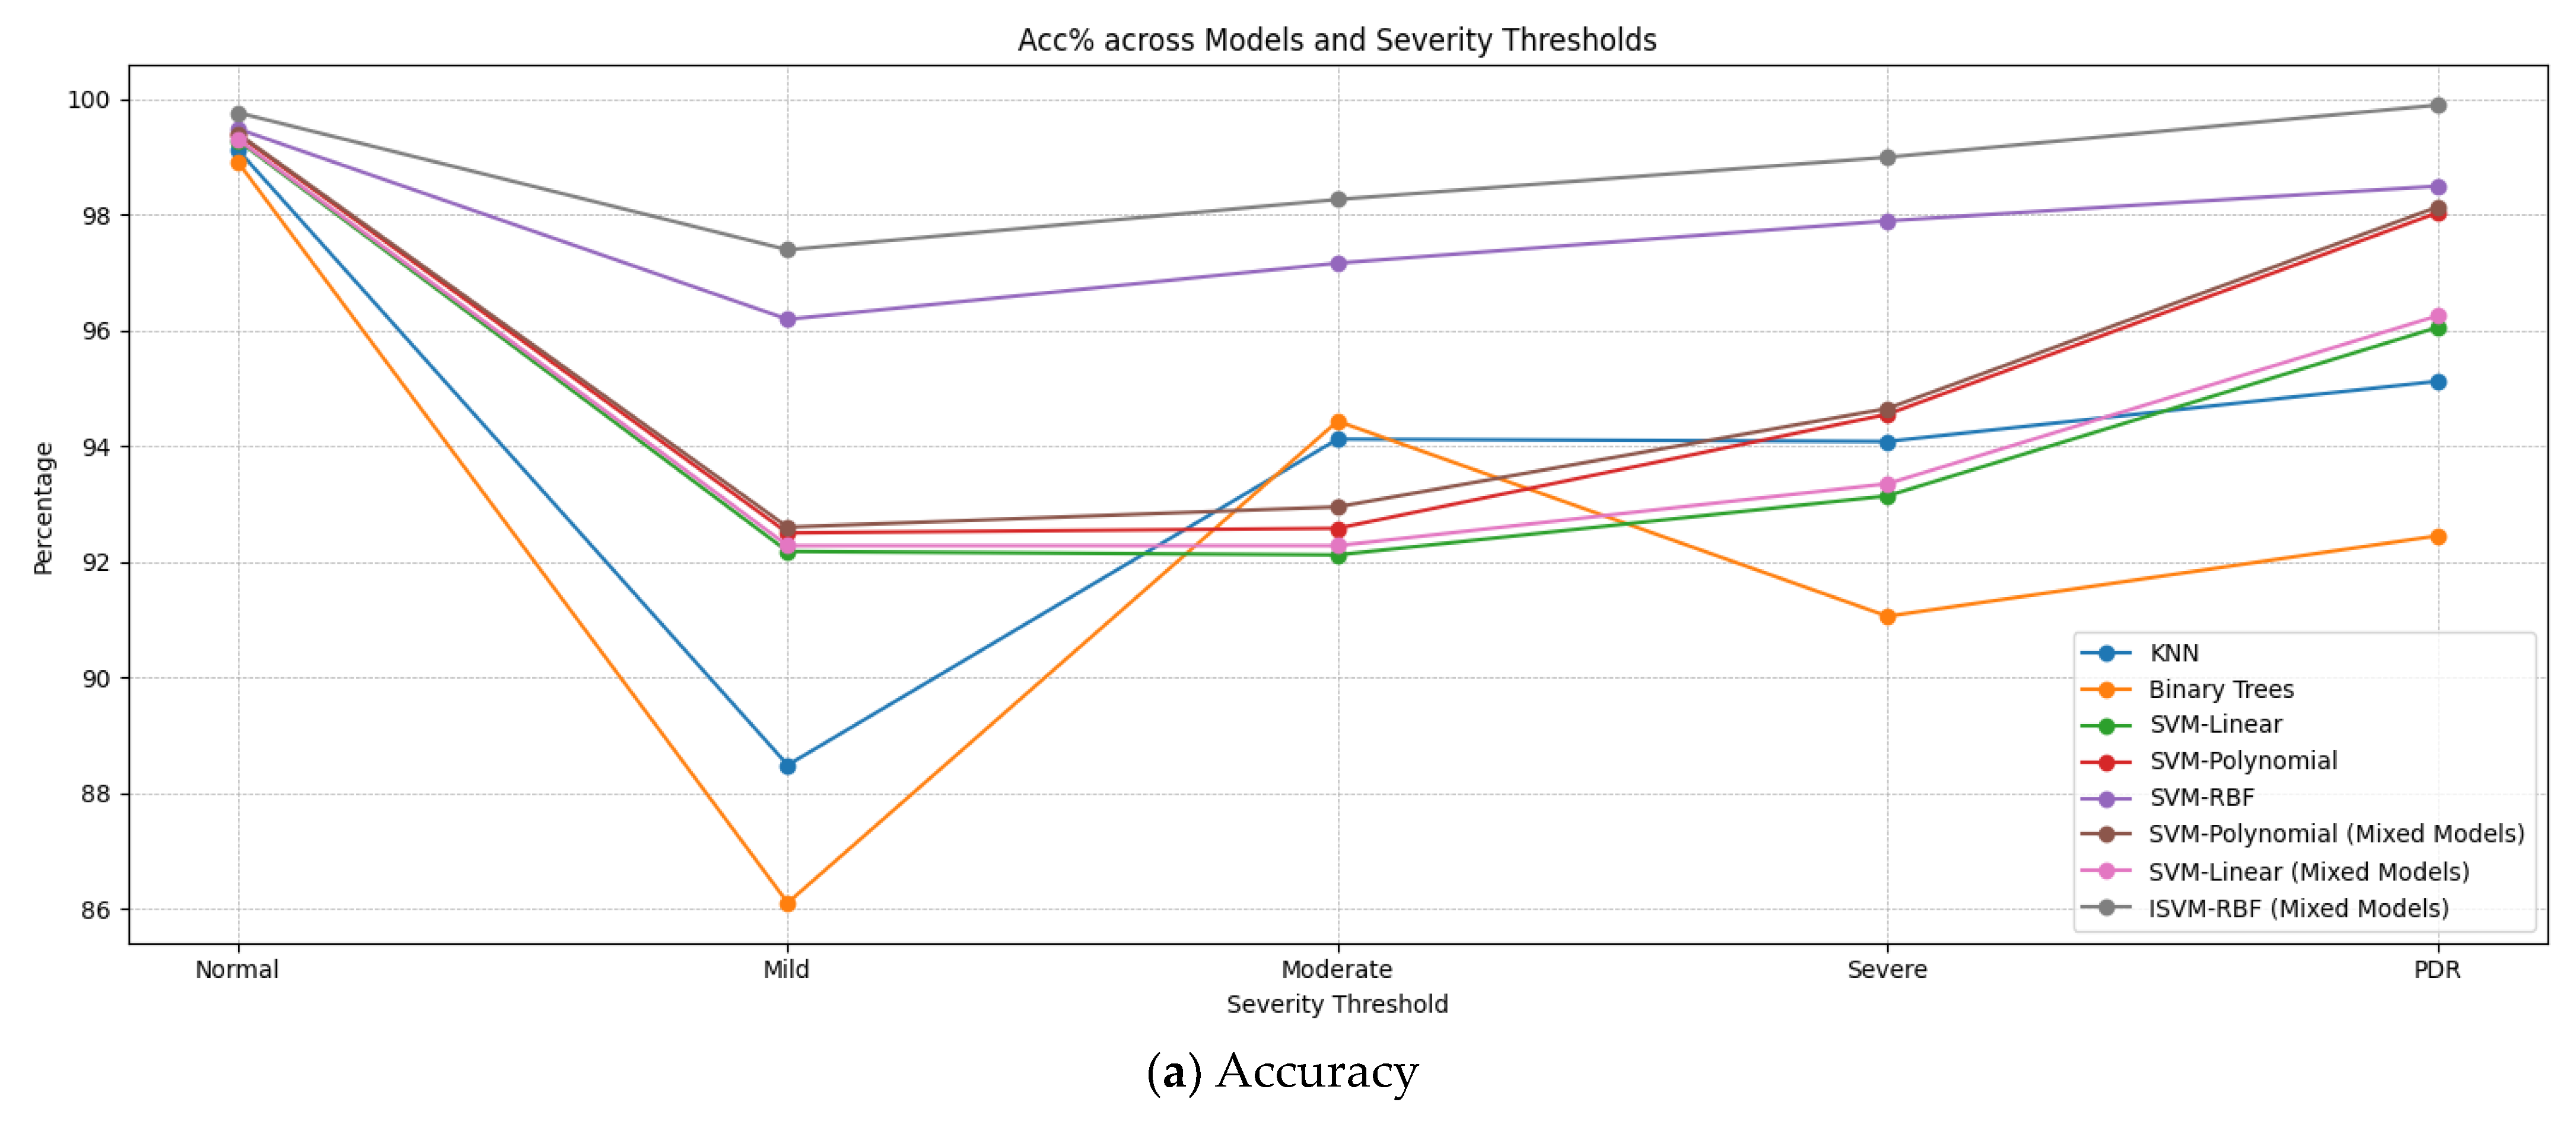
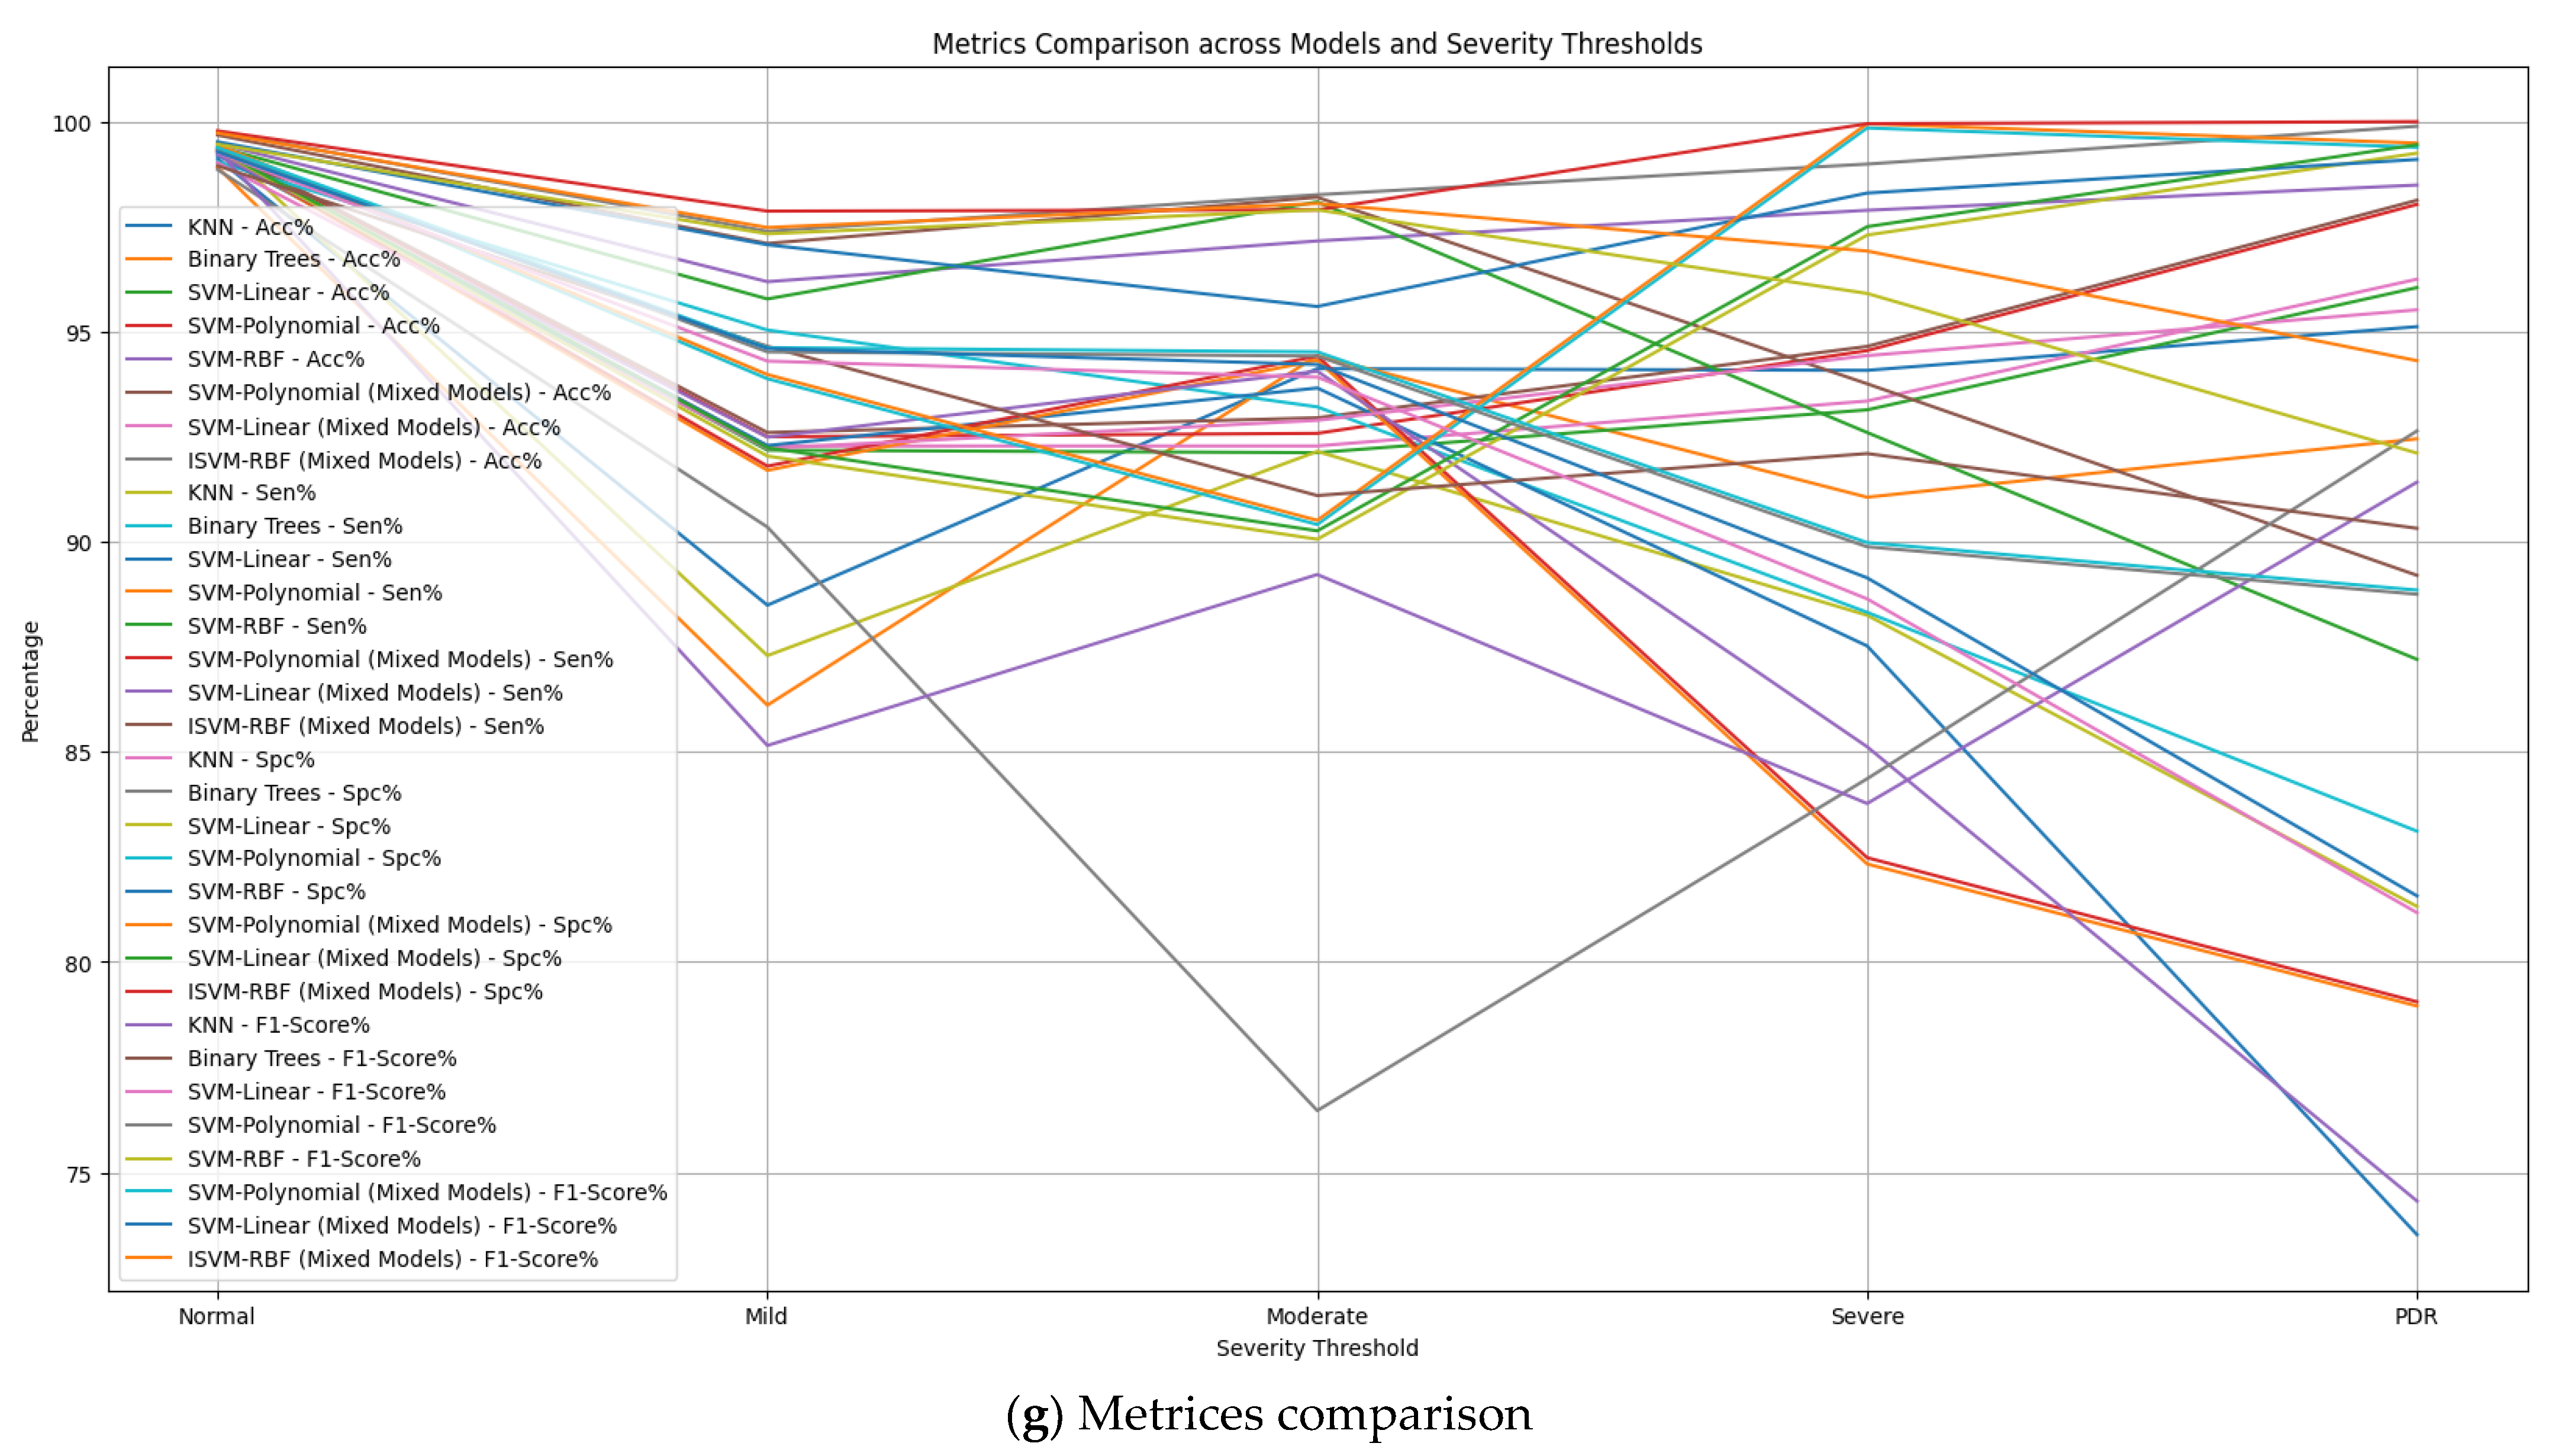
| Model | Severity Threshold | Acc% | Sen% | Spc% | F1-Score% | MCC % |
|---|---|---|---|---|---|---|
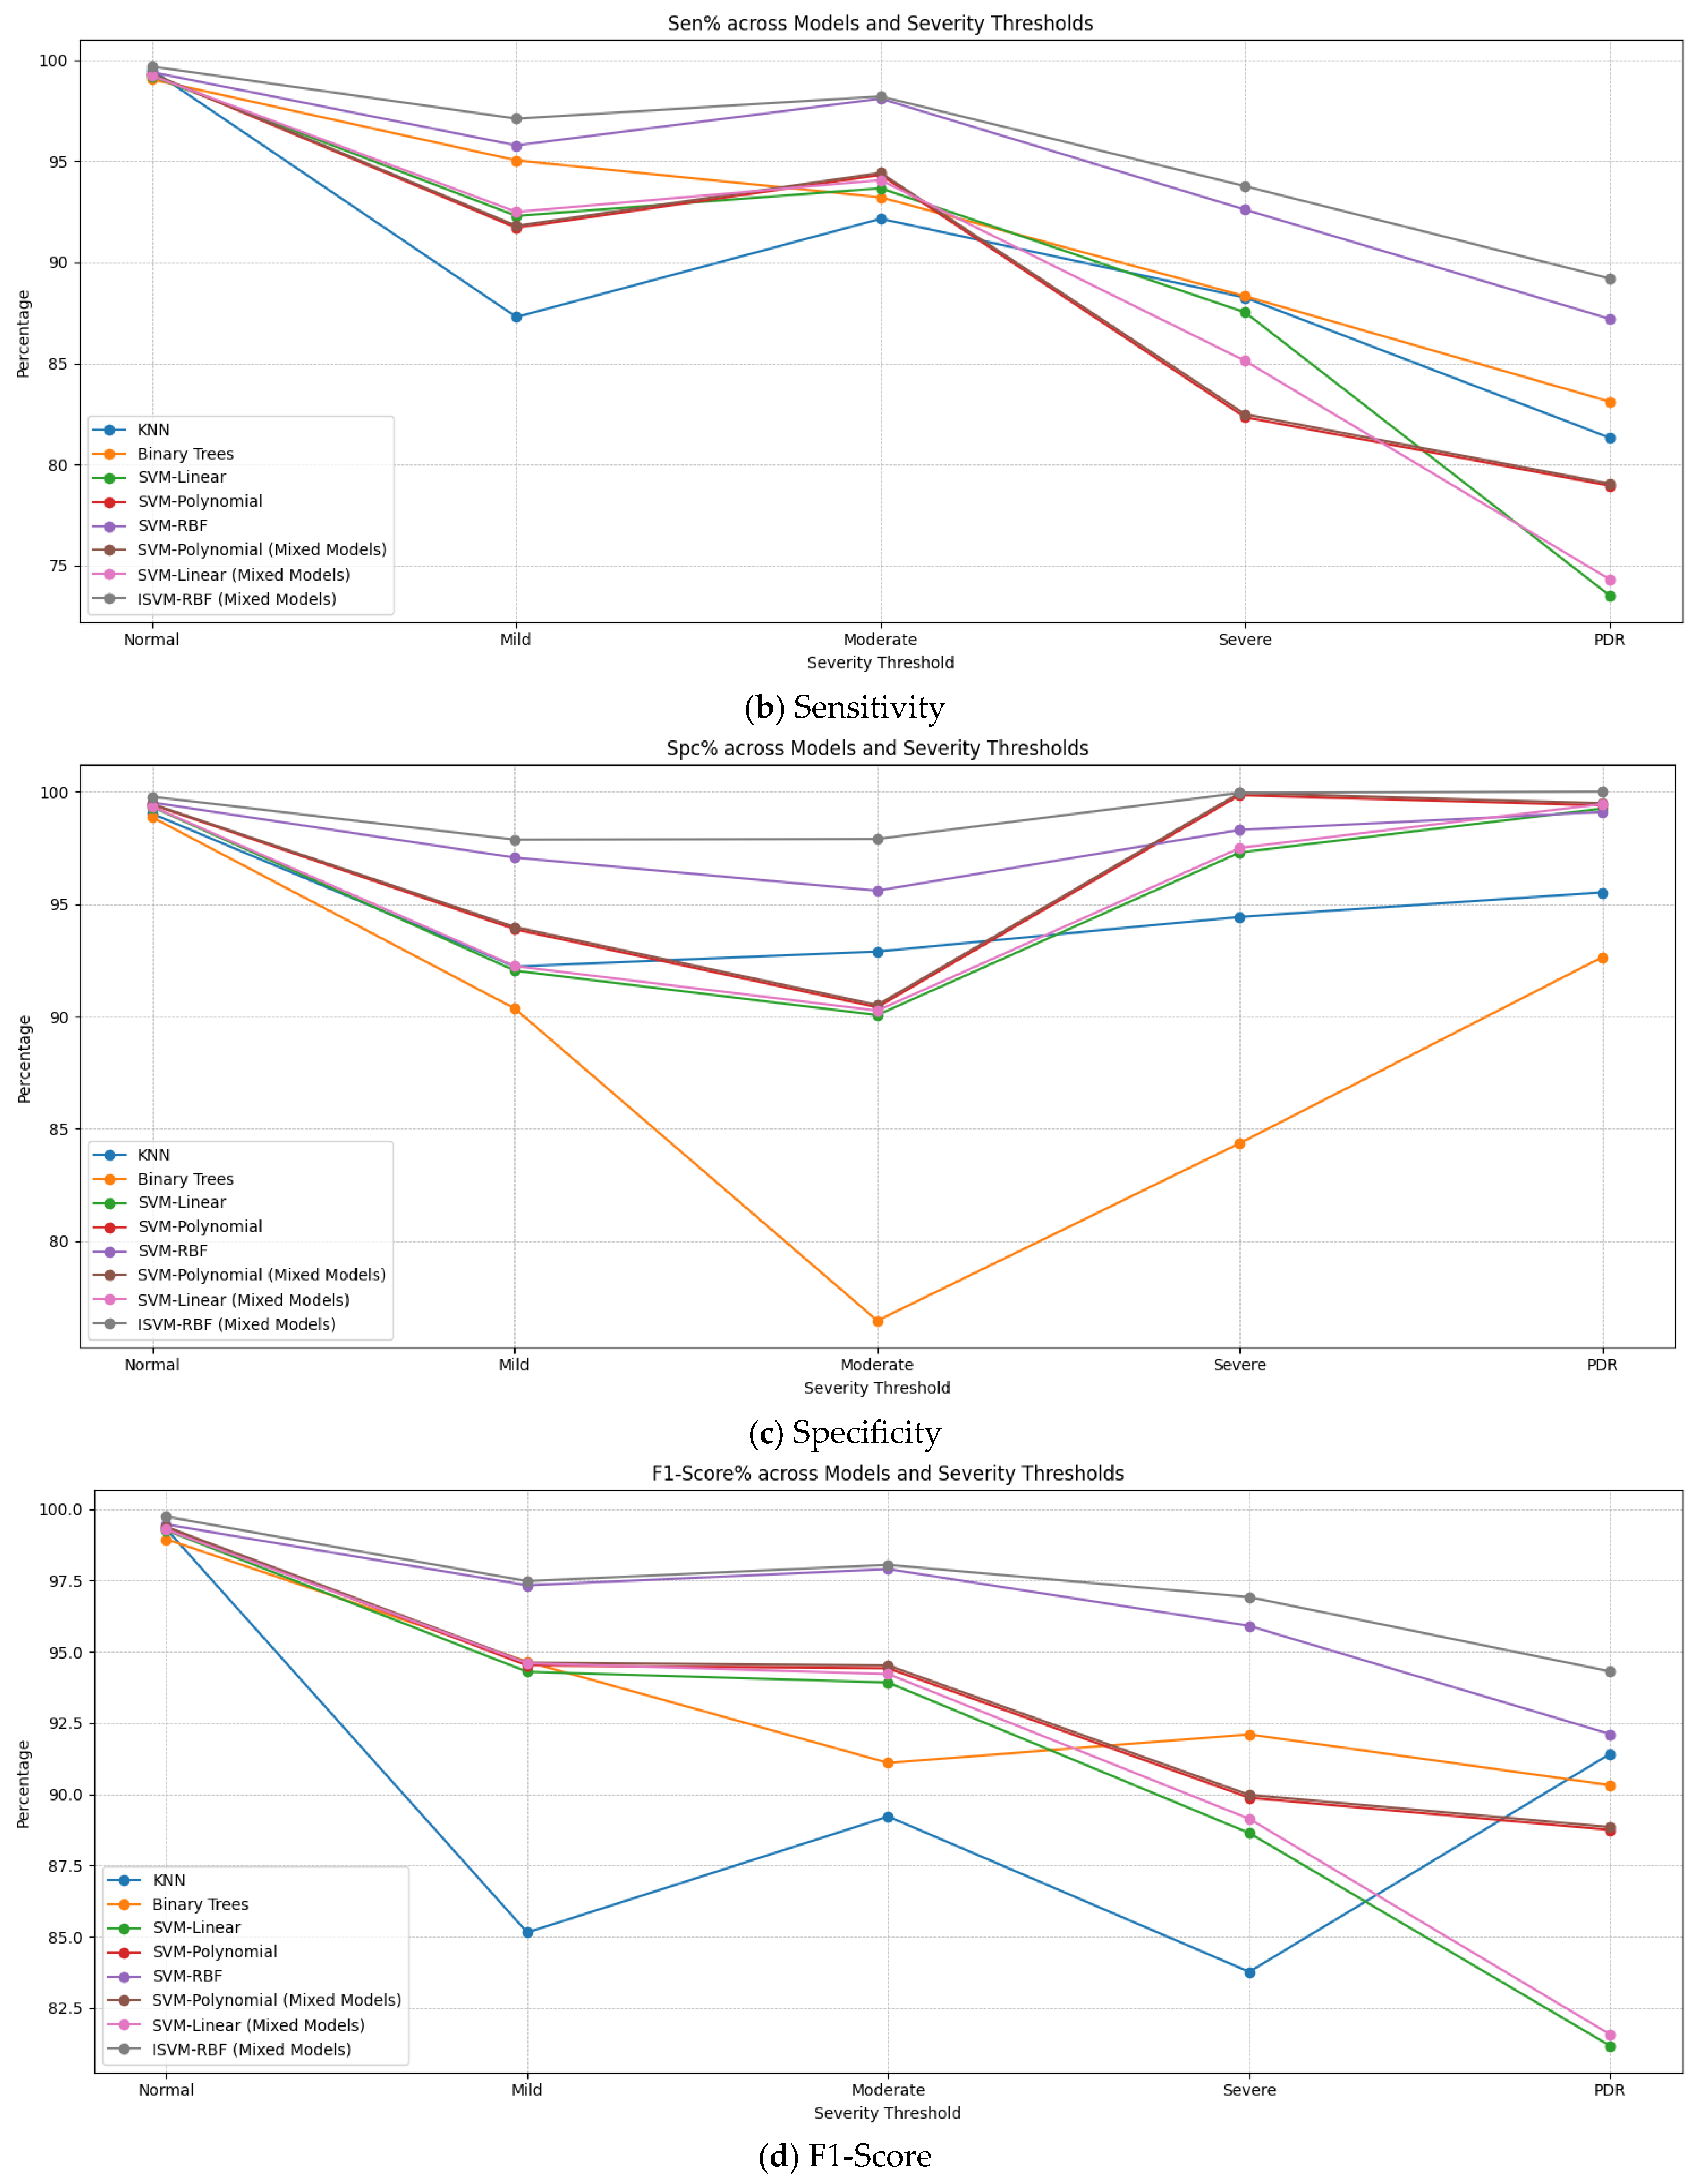
| KNN | Normal | 99.12 | 99.5 | 99.02 | 99.31 | 98.52 |
| Mild | 88.49 | 87.29 | 92.22 | 85.15 | 79.71 | |
| Moderate | 94.12 | 92.15 | 92.89 | 89.22 | 85.04 | |
| Severe | 94.08 | 88.25 | 94.43 | 83.77 | 82.68 | |
| PDR | 95.12 | 81.32 | 95.52 | 91.42 | 76.84 | |
| Binary Trees | Normal | 98.91 | 99.04 | 98.86 | 98.95 | 97.90 |
| Mild | 86.11 | 95.04 | 90.35 | 94.65 | 85.39 | |
| Moderate | 94.43 | 93.21 | 76.46 | 91.10 | 69.67 | |
| Severe | 91.06 | 88.32 | 84.36 | 92.10 | 72.68 | |
| PDR | 92.45 | 83.11 | 92.64 | 90.32 | 75.75 | |
| SVM-Linear | Normal | 99.28 | 99.20 | 99.32 | 99.26 | 98.52 |
| Mild | 92.18 | 92.29 | 92.04 | 94.30 | 84.33 | |
| Moderate | 92.12 | 93.66 | 90.06 | 93.92 | 83.72 | |
| Severe | 93.14 | 87.52 | 97.30 | 88.64 | 84.82 | |
| PDR | 96.05 | 73.52 | 99.25 | 81.17 | 72.77 | |
| SVM-Polynomial | Normal | 99.38 | 99.30 | 99.42 | 99.36 | 98.72 |
| Mild | 92.50 | 91.70 | 93.88 | 94.52 | 85.58 | |
| Moderate | 92.58 | 94.32 | 90.41 | 94.42 | 84.73 | |
| Severe | 94.55 | 82.33 | 99.85 | 89.88 | 82.18 | |
| PDR | 98.03 | 78.95 | 99.39 | 88.75 | 78.34 | |
| SVM-RBF | Normal | 99.48 | 99.40 | 99.52 | 99.46 | 98.92 |
| Mild | 96.19 | 95.78 | 97.07 | 97.33 | 92.95 | |
| Moderate | 97.16 | 98.09 | 95.60 | 97.90 | 93.69 | |
| Severe | 97.89 | 92.60 | 9830 | 95.91 | 92.49 | |
| PDR | 98.49 | 87.20 | 99.10 | 92.11 | 86.30 | |
| SVM-Polynomial (Mixed Models) | Normal | 99.40 | 99.32 | 99.45 | 99.38 | 98.72 |
| Mild | 92.60 | 91.80 | 93.98 | 94.62 | 85.58 | |
| Moderate | 92.95 | 94.42 | 90.51 | 94.52 | 85.03 | |
| Severe | 94.65 | 82.48 | 99.95 | 89.98 | 82.43 | |
| PDR | 98.13 | 79.05 | 99.49 | 88.85 | 82.43 | |
| SVM-Linear (Mixed Models) | Normal | 99.30 | 99.22 | 99.34 | 99.28 | 78.64 |
| Mild | 92.28 | 92.49 | 92.24 | 94.60 | 98.56 | |
| Moderate | 92.28 | 94.06 | 90.26 | 94.22 | 84.78 | |
| Severe | 93.35 | 85.12 | 97.50 | 89.14 | 84.34 | |
| PDR | 96.25 | 74.32 | 99.45 | 81.57 | 82.65 | |
| ISVM-RBF (Mixed Models) | Normal | 99.76 | 99.68 | 99.78 | 99.73 | 99.44 |
| Mild | 97.39 | 97.10 | 97.87 | 97.48 | 94.96 | |
| Moderate | 98.26 | 98.20 | 97.90 | 98.05 | 96.10 | |
| Severe | 98.99 | 93.76 | 99.95 | 96.92 | 93.71 | |
| PDR | 99.89 | 89.20 | 100.0 | 94.31 | 89.09 |
Disclaimer/Publisher’s Note: The statements, opinions and data contained in all publications are solely those of the individual author(s) and contributor(s) and not of MDPI and/or the editor(s). MDPI and/or the editor(s) disclaim responsibility for any injury to people or property resulting from any ideas, methods, instructions or products referred to in the content. |
© 2023 by the authors. Licensee MDPI, Basel, Switzerland. This article is an open access article distributed under the terms and conditions of the Creative Commons Attribution (CC BY) license (https://creativecommons.org/licenses/by/4.0/).
Share and Cite
Bilal, A.; Liu, X.; Baig, T.I.; Long, H.; Shafiq, M. EdgeSVDNet: 5G-Enabled Detection and Classification of Vision-Threatening Diabetic Retinopathy in Retinal Fundus Images. Electronics 2023, 12, 4094. https://doi.org/10.3390/electronics12194094
Bilal A, Liu X, Baig TI, Long H, Shafiq M. EdgeSVDNet: 5G-Enabled Detection and Classification of Vision-Threatening Diabetic Retinopathy in Retinal Fundus Images. Electronics. 2023; 12(19):4094. https://doi.org/10.3390/electronics12194094
Chicago/Turabian StyleBilal, Anas, Xiaowen Liu, Talha Imtiaz Baig, Haixia Long, and Muhammad Shafiq. 2023. "EdgeSVDNet: 5G-Enabled Detection and Classification of Vision-Threatening Diabetic Retinopathy in Retinal Fundus Images" Electronics 12, no. 19: 4094. https://doi.org/10.3390/electronics12194094