1. Introduction
With the advent of social networks, social recommendation systems have gained widespread application in information filtering and personalized services. By utilizing social relations as supplementary information, these systems predict user preferences and interests more accurately [
1,
2]. For instance, an effective movie recommendation system can efficiently suggest movies that align with a user’s interests from an extensive collection, thereby saving time and enhancing satisfaction. Nevertheless, the critical challenges in this domain revolve around fully leveraging user–item interaction data and social relations, while also addressing issues like data sparsity and bias.
Specifically, within social networks, users with direct links typically exhibit similar behaviors [
3]. Based on this theory, social recommendation algorithms have started considering incorporating social relations as ancillary information into recommendation systems. Early research primarily focused on methods based on Matrix Factorization (MF), such as collaborative decomposition and regularization techniques. However, addressing the challenge of insufficient interaction data between users or items in social recommendations is crucial to improve the accuracy of identifying and predicting user preferences. To counter this issue, Ma et al. [
4] devised an MF-based model on social regularization. In this model, the correlation between social relations is introduced into the regularization term of the objective function. While their method did not completely resolve the issue, it effectively leveraged social network information to alleviate the problem of data sparsity in collaborative filtering, highlighting the importance of integrating social relations in the recommendation process. Furthermore, the interactions between users and items in social recommendation systems (e.g., ratings) have nonlinearity and complexity. MF-based methods often find it challenging to handle these nonlinear relations and high-dimensional features, thus limiting the model’s expressive capability and recommendation performance. In contrast to MF-based methods, Graph Neural Networks (GNNs) have shown great strength in handling unstructured data. They have been applied in various fields, such as bioinformatics, computer vision, and social network analysis [
5], offering a research direction with enormous potential. In the field of social recommendation, some recommendation methods based on GNNs have been developed. These methods represent user–item interaction and observed social relations as two graphs. Then, they apply GNNs to learn effective node representations, aiming to capture users’ social influence and interaction patterns.
The current recommendation methods based on GNNs mainly learn from the original interaction graph and most GNNs are subject to inductive bias, which can cause false positives in the final result. However, the processing of statistical information about the graph has not been adequately considered, which ignores the impact of rating bias on user preferences, and this shortcoming may lead to a misinterpretation of the user’s true preferences. In our study, user rating bias consists of the tendency of users to rate items differently based on their personal preferences and rating behavior. On the other hand, low standards in rating behavior refer to relatively generous users, giving high ratings to a variety of items and potentially overstating the perceived quality of those items. In contrast, high average ratings reflect the tendency of some users to consistently give items very positive ratings, resulting in higher average ratings for the items they interact with. For example, some users may show leniency in their ratings and often give higher ratings, while others may be more critical and tend to offer lower ratings. Such differences in user behavior can lead to discrepancies between perceived and actual item preferences, affecting the accuracy of recommendations. In a previous study, Y. Koren et al. [
6] also considered such factors and designed a complex collaborative filtering model by introducing user and item bias terms in an attempt to model user rating bias. However, this approach has some limitations, such as the propagation of latent bias and lack of explicitness in fully utilizing statistical information for modeling and understanding. Rating bias has been recognized as a critical factor affecting the accuracy of recommender systems, and the concept has been extensively studied in the literature [
7]. Despite the extensive work in this area, integrating rating bias into recommendation models, especially GNN-based models, remains a relatively unexplored field. Additionally, existing methods often overly rely on the patterns and trends in the original data for learning, making capturing and correcting biases challenging. For example, GDSRec [
8] is a recommendation model that employs GNN to improve social recommendations by considering rating bias and social relations. However, it focuses mainly on static correction factors and may not fully address the dynamic nature of rating bias, thus creating limitations in capturing various aspects of user preferences. Besides direct user–item interaction, many potential higher-order relations (e.g., user similarity and item similarity) can enrich graph information and benefit the recommendation task, but have not been fully exploited. Although some research shows that Graph Neural Collaborative Filtering effectively uses these latent higher-order relations to obtain more accurate and personalized recommendation results [
9], many existing social recommendation methods have not effectively implemented this. In conclusion, while current social recommendation methods have progressed in handling sparse data and capturing users’ social influence and interaction patterns, there is still room for improvement in processing statistical information about the graph, correcting rating biases, and fully utilizing higher-order relations.
Addressing the aforementioned issues, this paper proposes an enhanced social recommendation method based on a GNN integrated with rating bias offsets, which utilizes GNNs not only to model user–item interactions, but also to include rating bias offsets as an inherent part of the learning process. To elaborate, within the recommendation models, we engage bias data that are formed based on statistical information, employing the user/item rating bias offset as an auxiliary vector for learning the latent characteristics of users and items. Including a bias vector facilitates the model’s in-depth exploration of the relations between users and items, effectively considering the real preferences of users and the difference in personalization of the items, thereby accurately portraying their characteristics to enhance system performance. To realize this aim, we have designed a decentralized interaction graph that embodies the statistical bias information of users (items). Embedding the decentralized graph into our proposed model and explicitly extracting biased information creates a rich representation that enhances model learning, considering associations among users, among items, and between users and items more comprehensively. Moreover, to handle high-order semantic relations, we utilize a multi-layer GNN architecture to learn high-order node embedding representations to deeply excavate nodes’ interactive features, thereby accurately portraying the nodes’ characteristics and behaviors within the social recommendation system. Our primary contributions can be summarized as follows:
We adopt a relative perspective, utilizing the original data’s statistical information to adjust ratings to be zero-centered, thereby mitigating the impact of overall rating trends. Then, the original heterogeneous infographics are processed into decentralized graphs and biased information is explicitly extracted from the decentralized graphs. Next, we regard rating bias as an additional vector and incorporate it into the model proposed in this paper, thereby modeling the latent representations of users/items.
We define multiple meta-paths by combining rich node relations, and by fusing the Graph Attention Network (GAT) of meta-paths, high-order information is explicitly encoded into the embedded learning to explore user relations and item relations with high-order correlations.
We propose SR-BS, an enhanced social recommendation model that combines GNNs with rating bias. This model learns the higher-order representations of users and items on decentralized graphs, leveraging rating bias offsets.
We conducted extensive experiments on four publicly available datasets to verify the efficacy of the proposed method. The experimental outcomes demonstrate an improvement over the state-of-the-art methods in the Mean Absolute Error (MAE) of Ciao (2.61%), Epinions (1.46%), Douban (0.52%), and FilmTrust (0.55%), indicating that our SR-BS model can generate superior recommendation results.
The remainder of this paper is organized as follows:
Section 2 elaborates on the background of social recommendations and related work.
Section 3 elaborates on some preliminary content and the proposed framework. Subsequently, in
Section 4, we report and analyze the experimental results. Lastly,
Section 5 concludes the paper.
2. Related Work
There are two main evolutions of social recommendation. In this section, we briefly describe the classical social recommendation method and GNN-based social recommendation method.
Early research on social recommendation algorithms focused on MF, leveraging it as a fundamental model due to its flexibility in incorporating prior knowledge. MF-based recommendation models integrated social information to capture more expressive user preference vectors and to achieve noteworthy success in various scenarios [
10]. We can broadly classify recommendation models based on MF into two categories: co-factorization-based methods and social regularization-based methods. The co-factorization method is popular due to its efficiency and scalability. This method analyzes the historical rating records of users to identify users with analogous preferences to the target user. Then, overlapping rating information is used to predict target user preferences, thus achieving recommendations [
11]. Such methods have many applications and spawned many social network-based recommendation algorithms [
11,
12,
13]. In [
12], SoRec is an MF-based co-factorization method. This method cleverly incorporates social information into traditional recommendation algorithms by analyzing the impact of users’ social information and rating records on users’ interests. TrustMF [
13] proposes an innovative hybrid recommendation model that integrates the roles of the trustor and the trusted. The model is achieved by employing matrix factorization on the trusted network among users within social interactions to drive rating predictions. TrustSVD [
11] proposes that the influence of ratings and trust information on user interest is not limited to the explicit level, but also exists at the implicit level. The model significantly boosts the accuracy of the recommender system by modeling explicit and implicit influences in an integrated way. In addition, to further augment the expressive power of learned user representations, the researchers also introduced an MF-based social regularization strategy, which used regularization constraints to model the social relation among users. SoReg [
4] is a typical regularization model that uses the social matrix to impose regularization constraints on user feature vectors. SoDimRec [
14], on the other hand, takes another perspective by considering the heterogeneity and weak dependency of social relations as a regularization condition. SocialMF [
15] shows that a user’s potential interests are influenced, to some extent, by the interests of their social neighbors by incorporating a social network-based trust propagation mechanism into a recommendation algorithm to capture the user’s embedded representation.
Despite those mentioned above, traditional social recommendation algorithms effectively capture linear information and exhibit learning limitations concerning user–item interactions and the complexity of the social domain. In this background, researchers introduced a Deep Neural Network (DNN)-based social recommendation method [
16]. The technique utilizes the powerful modeling capabilities of DNN to jointly depict the user–item interactions and the user’s social network to mine nonlinear features from the interaction network, thus giving more robust representation and generalization capabilities to collaborative filtering recommendation techniques. The study of NeurMF [
17] combines the traditional MF and Multilayer Perceptron (MLP) techniques to extract low-dimensional and high-dimensional features efficiently, thus achieving superior recommendation results. On the other hand, DeepSoR [
18], a DNN-based social recommendation model, has the core advantage of learning embedded representations from social relations and further incorporating these representations into probabilistic matrix factorization for accurate prediction.
Nonetheless, these methods still lack explicitness in encoding informative interactions, especially for implicit collaborative signals, which they may fail to capture adequately. In the NSCR model [
19], the strategy adopted users in social networks as bridges for information propagation, further propagating user representations generated by attribute-aware deep collaborative filtering models. To summarize, existing research has explored the potential value of interaction data and social relations to some extent. However, there is still a great deal of work to be conducted in excavating and utilizing high-quality and credible relations within social networks.
In the domain of social recommendations, interactions between users and their social neighbors, as well as between users and items, can be intuitively constructed as user–user and user–item graphs. GNNs [
20], the generalized neural network based on graph structure, effectively extracts feature information from adjacent nodes and captures the network’s topology. Recently, GNNs have gained widespread attention in the study of recommendation systems and achieved significant progress and breakthroughs in numerous applications [
21,
22,
23]. In [
21], a GNN-based social recommendation algorithm called GraphRec is proposed, which captures interaction information in the user–item interaction graph and extracts social information in the social graph through a joint modeling strategy, focusing on modeling the influence of first-order neighbors. Recent studies have also made breakthroughs in exploring higher-order influences.
Specifically, the DiffNet [
22] model employs a multi-layer graph convolutional neural network based on trust propagation, effectively capturing user preference diffusion in social networks. Furthermore, the DiffNet++ [
23] model, an enhancement of DiffNet, introduces a multilevel attention mechanism to compute the respective influence of neighbor nodes and graph information in the aggregation process, thus capturing the characteristics of users and items more accurately. Some previous recommender systems have recognized the importance of rating biases and attempted to address this problem through various mechanisms. For example, in [
6], a sophisticated collaborative filtering model is constructed to capture these rating biases by introducing bias terms for users and items. GDSRec [
8], a novel model for social recommendation using GNNs, enhances the microscopic nature of social connections by aggregating rating bias offsets for users and items, combined with the strength of social ties based on similarity of preferences. These mechanisms typically focus on static correction factors or post-processing techniques. However, these approaches tend to ignore the dynamic nature of rating bias and may not be fully effective in capturing the intricacies of user preferences. Inspired by the potential of GNNs in processing graph-structured data, researchers are experimenting with GNNs to capture the complex connections between users and items. For instance, DANSER [
24], a model for collaborative filtering using dual graph attention neural networks, can simultaneously reveal the social homogeneity and social influence of users and items. Specifically, DANSER integrates social homogeneity information through the vector representation of neighbors and aggregates social influence using neighbors’ context-aware preferences.
DICER [
25], based on the social relations between users, collaborative similarities, and the collaborative relations between items, considers them to be deep context relations to model the interaction influence between users and items. The model created a relation-aware neural network to model the interests of users and their friends. On the other hand, the core concept of DESIGN [
26] is that social relations reflect similarities in user preferences. However, separately modeling the social and user–item graphs led to two models with different characteristics. To address this issue, DESIGN trained a model that incorporated the user–user social graph and the user–item graph and trained an auxiliary model for each graph independently. Adopting the knowledge distillation method constrained the model’s training process, promoting learning communication between the models.
Nevertheless, although GNN-based social recommendation has successfully modeled explicit social influence, these methods fail to adequately consider the data bias present in the statistical information of the graph in most cases. Meanwhile, these methods still need to be improved in learning high-order node relations in heterogeneous networks (e.g., except simple pairwise interaction relations and social relations with direct connections).
3. Proposed Framework and Problem Definition
3.1. Notation and Problem Definition
In the GNN-based social recommendation tasks, we deal with two entities: users and items. Here, we first introduce notation definitions and problem definitions. The user and item sets, and , consist of users and items, respectively. The preference matrix, denoted as , reflects users’ real-valued ratings for items. In this matrix, is the rating by the user for the item . The set of observed ratings, , which requires that the user ’s rating value for the item is not 0 or not null. The set of users that interact directly with the item is denoted by , and the set of items that interact with the user directly is denoted by . and are defined as the average ratings of the user and the item , respectively. Next, we extract the higher-order relations and for users and items, defining different meta-paths to represent inter-user and inter-item relations according to different higher-order relations, respectively. Hence, we extend a typical social recommender system by introducing higher-order relations and meta-paths.
Based on the constructed social relations graph, item similarity graph, user–item decentralized graph, and item–user decentralized graph, we can use these graphs to build similarity relations between inner-user and inner-item, as well as interactions between users and items, to predict unobserved ratings in R and recommend items to users based on these predicted ratings.
During the learning process, we recognized the potential advantage of incorporating the influence of the time factor into recommendation models, as it can lead to more accurate and personalized recommendations. In practice, users may show different interests in items at different points in time, and the time factor can also reveal some trends regarding changes in user preferences, so changes in user preferences over time can significantly affect the relevance and effectiveness of recommendations. Although our current research emphasizes addressing the issue of rating bias and trends, we cannot ignore the importance of adjusting recommendation models to changing user preferences. Therefore, we intend to explore the integration of time factors in our future research to improve the accuracy and relevance of recommendations further.
3.2. Relation Graph Construction
Most social recommender systems enhance effectiveness by leveraging explicit social relations, such as friendships between users [
27]. However, in addition to the explicit relations, the implicit user–item interaction and the graph structure’s semantic relations will play a role. It has been shown that higher-order relations can provide valuable clues to exploit the various relations between features [
28] to mine the different preferences of users for items and optimize the learning of user and item representations in the social recommendation. By considering higher-order relations, social recommender systems can better comprehend inter-entity connections, incorporating this information into recommendation algorithms for more accurate, personalized outputs.
3.2.1. Social Graph
One-hop relations among users typically suggest similar preferences. Nevertheless, such relations are frequently constrained by the local graph structure (e.g., degree), inadequately capturing the social relations between one-hop and multi-hop users. This limitation restricts our capacity to harness social information fully. Therefore, we adopt an approach to extend direct relations and construct higher-level user relations to compensate for this shortcoming. Specifically, we scrutinize user interactions (e.g., following links) to unearth deeper similarities and construct extended networks containing second-order or higher social relations. This method allows us to form a richer graph of users’ social relations. For the user
, we define the higher-order user relations
as follows:
Here,
signifies a direct following link between the user
and the user
, while
indicates the contrary.
denotes the number of users, and
is a threshold we set to measure whether the shared following between users meets the requirements for defining higher-order relations. This formula indicates that when there is a direct attention relation between user
and users
and
at the same time, and when the number of other users with the same attention between user
and user
users in total reaches or exceeds
, we consider the relation between these users
and user
users as a higher-order relation. Upon conducting experiments across multiple public datasets (refer to
Section 4), the results show that the higher-order social relations constructed based on this approach can capture more comprehensive user preferences and reveal deeper similarities among users, which is extremely useful for us to learn about user interest and behavioral analysis in greater depth.
3.2.2. Item Similarity Graph
Traditional item-based collaborative filtering methods rely heavily on inter-item similarity for user rating predictions, typically utilizing metrics like the Pearson Correlation Coefficient, which predominantly considers the proximity of ratings between items, but often overlooks the number of users who have rated the items. However, two items are more similar when they receive close ratings and have a large number of rating users. Therefore, to measure the similarity between items more accurately, we propose a new method, i.e., to calculate the similarity between items with close ratings based on the number of users who rated the items and further construct the item similarity graph. Specifically, it is known that the user
has
and
ratings for the items
and
, respectively, and we define the similarity
between the items
and
to be:
This formula means that the closer the ratings of the items
and
are, the higher their similarity
is; if the ratings are more different, the similarity is lower.
denotes an integer-valued function. Then, considering that the scale of users’ ratings also has some influence on item similarity, we further incorporate the set of users who have rated both the items
and
into the definition of item similarity, i.e.,
, where
denotes the set of users who have rated both of the items
and
. When two items gain similar ratings from a large user base, it generally suggests that these items possess feature similarity, which should amplify the inter-item similarity. To mine richer higher-order item similarity relations, we set
and select the top 20 most similar items based on the value of
from largest to smallest. For the item
, we define the higher-order item relations
as follows:
We employ a similarity measure , which composites both the item rating differences and the set of users who have rated, and define higher-order similarity relations for each item based on this measure. This integrated assessment helps to reveal more precise item similarity.
3.2.3. Decentralized Graph
The user–item interaction graph, as shown in
Figure 1, describes user and item interaction behaviors where the edges represent users’ ratings for items, such as users
and
ratings for item
being
and
, respectively. The social graph contains the following links between users, and the first and last nodes of the arrows represent the following users and the followed users, respectively. In the social graph, the user
has direct following links with the user
,
, and
, and we can represent these relations as
. When we align the user nodes in these two graphs, we form a heterogeneous infographic containing users’ social and user–item interaction information. In this graph, users have both neighbors in the social space (friends) and neighbors in the interaction space (items); items have both neighbors in the interaction space (items interacted by the same user) and neighbors in the social space (items interacted by similar users). However, directly deciphering user preferences from heterogeneous infographics may not yield accurate results. For example, a tolerant user may rate all items highly, but this does not mean he likes them all. This user-generated bias may impact our ability to discern the user’s latent interests. To understand user preferences more accurately, we need to consider the overall rating tendencies of users and items. Mitigating this bias by utilizing the graph’s statistical information further helps us distinguish users’ real preferences.
Figure 1 shows the specific handling.
In decomposing original heterogeneous infographics into two decentralized graphs, we apply the following process. As shown in
Figure 1, for user
, we subtract the individual interaction scores of each user–item pairing (e.g.,
,
,
) from the average scores of the corresponding items, and the difference obtained is used as the edge value with other item nodes, with the user node as the center of the node as the only node, to obtain the user–item decentralized graph; for item
, the interaction scores of each item and the user are obtained by subtracting the average scores of the users (e.g.,
,
) from the true scores, and the difference in the scores obtained is used as the edge value with other user nodes, with the item node as the unique center node, to obtain the item–user decentralized graph. If a user or item lacks historical interactions, we use the dataset’s average as the rating means for that user or item.
By calculating the rating difference and combining it with the overall rating trend, the rating bias of the user, and the item’s popularity, we can obtain a more realistic picture of the user’s preference for the item and the attractiveness of the item to the user. Using decentralized graphs for training recommendation models, compared to original graphs, effectively curbs noise introduced by averaging, enabling a more accurate capture of user interests and item popularity.
In our approach, we implement the interaction between users and items in the form of a graph by constructing a two-part graph. This graph structure allows us to capture higher-order information about users and items, where ‘k’ represents the number of hops in the graph (k > 1).
3.3. Predefined Meta-Paths
During training, the model might learn low-relevance connections, which may lead to distraction and thus ignore the higher-order user–item correlations. For instance, there is a direct following link between the users
and
in the heterogeneous infographics in
Figure 1. The user
rated the item
as 2, and the user
rated the item
as 3. They rated the item
similarly, so the relation among the nodes
,
, and
is much closer. In contrast, the nodes on the path linking
are not so closely related because there is no direct interaction between the user
and item
. We hypothesize that by preferring reliable links and appropriately ignoring unreliable links, we can enhance the learning ability of the final embedding representation and reduce the effect of noise. Drawing from successful network embedding models [
22], we define a variety of meta-paths by combining the relationship graphs constructed above and based on the similarity of influence effects and collaborative signals, which are designed to help identify various connections in the relationship graphs. By utilizing meta-paths, we can not only represent traditional low-order relations, but also reveal higher-order relations that are important for enhancing user and item preference learning. Moreover, this approach also helps us to dig deeper into the semantic correlations between different types of nodes. Specifically, we predefine a set of meta-paths to describe different types of interactions between users (U) and items (I) in the graph. Each meta-path is a specific sequence of nodes and edges representing a particular interaction pattern. For example, an interaction path
representing items with rating bias reflecting user preferences allows our model to recognize that users tend to interact with similar items that their friends have interacted with, thus revealing higher-order correlations between distant user–item pairs. Thus, the meta-paths we define for user nodes intuitively reflect users’ intrinsic behavior and rating similarity, while those defined for item nodes reveal the similarity and popularity of items, providing a comprehensive view of the graph structure.
Table 1 details the specific meanings of the meta-paths we have designed, which will inform our subsequent work.
3.4. Proposed Model
3.4.1. Model Framework
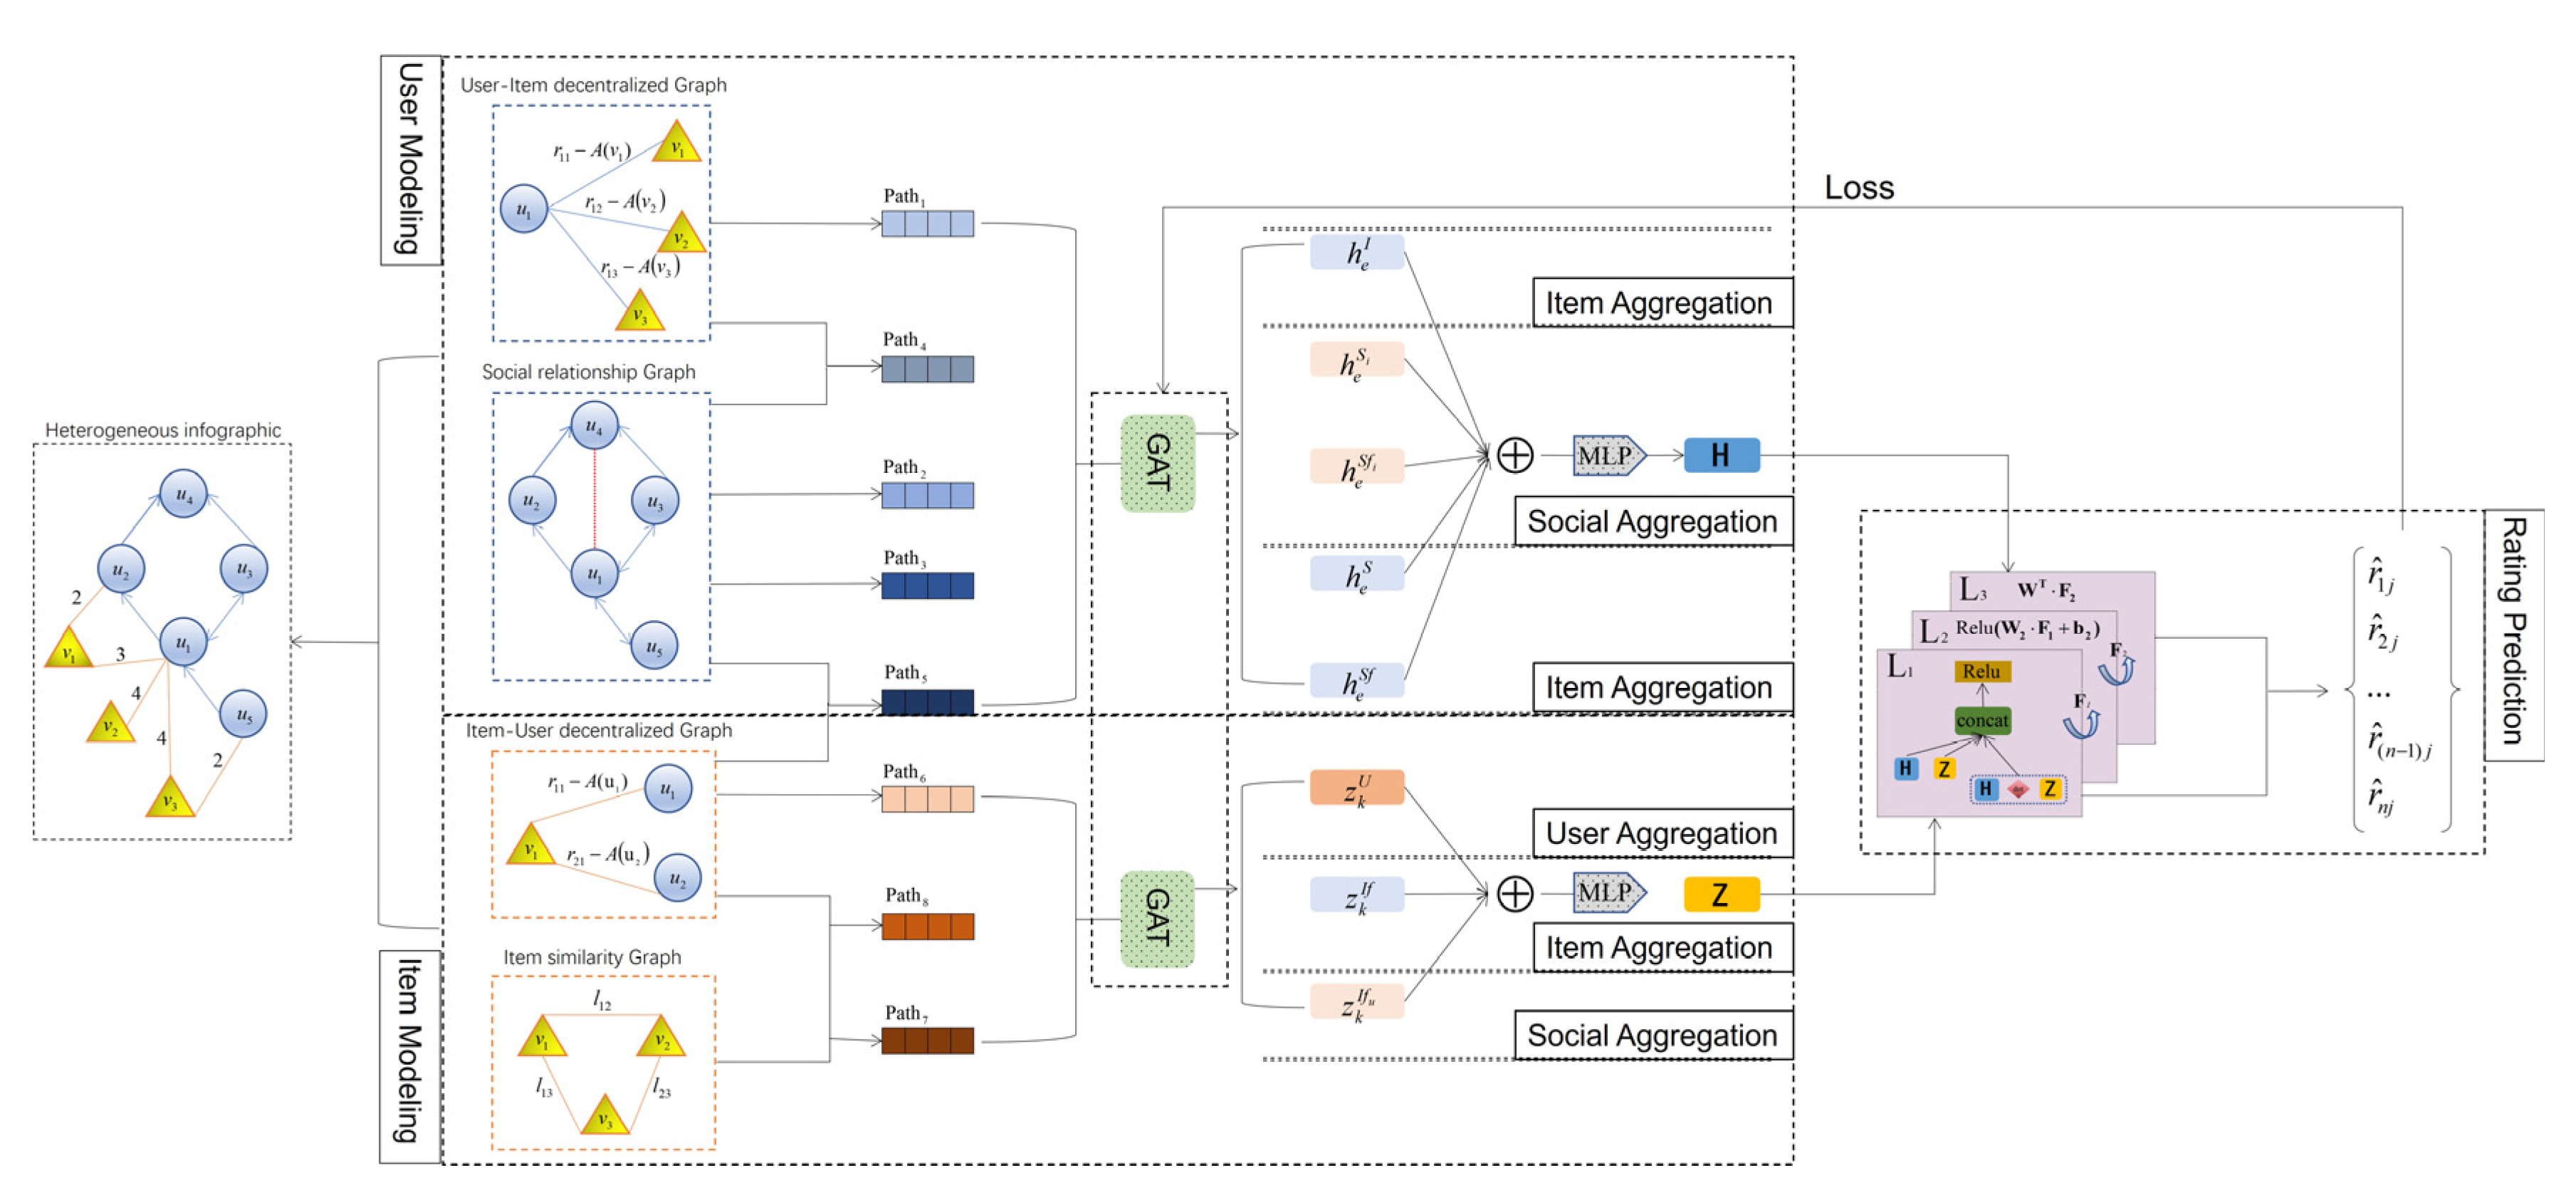
This subsection depicts the SR-BS model for social recommendation and presents its framework structure in
Figure 2. It primarily comprises three modules: user modeling, item modeling, and rating prediction. Using data from decentralized graphs, our model introduces rating bias offsets to mine higher-order user relations and higher-order item relations using constructed social graphs and item similarity graphs, and then predefines various meta-paths based on these different interactions integrating the rating bias, and learns the latent representations of the users and the items to identify user preferences and item popularity through GAT modeling. Taking
Figure 2 as an example, in learning the latent representation of user
, the information of the items that users interact with (i.e., aggregated items
,
, and
) and the information of the users for which direct and indirect relations exist (i.e., aggregated users
,
,
, and
) will be synthesized. Similarly, for the potential representation of item
, information about the users with whom the item interacts (i.e., aggregated users
and
) and information about the items with which the item interacts with a high degree of similarity (i.e., aggregated items
and
) will be combined. In the user modeling and item modeling modules, with the help of the previously defined meta-paths of users and items, we utilize GNNs to learn the intrinsic information of users and items with multivariate interactions in the implicit space. To address the shortcoming of indiscriminately applying GNNs in meta-paths with higher-order relations, which results in those nodes with too many interaction behaviors will generate noise, we incorporate Dropout during model training, which mitigates noise by randomly discarding some nodes and cooperating with GAT to achieve robust representations. The rating prediction module amalgamates the user and item modeling modules, employing the acquired representation vectors within an MLP. Through training, the model learns the parameters to predict the ratings accurately. After obtaining the set of predicted scores, we generate recommendations based on these scores. Specifically, for each user, we rank the items based on the predicted scores from highest to lowest. The top-ranked items that have not yet interacted with the user are selected as recommended items. Based on our model, this approach ensures that the recommended items are those that are most likely to be of interest to the user.
3.4.2. Graph Attention Networks Fusing Meta-Paths
Researchers frequently use GAT [
29] to encode the neighbor information of nodes in graph structures, facilitating the creation of dense, low-dimensional node embeddings. From this line of research, several GAT-based recommendation methods [
29,
30] have emerged, embedding users and items as vectors via a GAT-driven message-passing mechanism. Thus, in the SR-BS model, we utilize the GAT to aggregate semantic relations from various meta-paths, thereby capturing a wide range of features associated with each node. Specifically, we define the aggregation process as shown in Equation (4). This process involves incorporating information from local neighbors
in a given meta-path and utilizing the attention mechanism to determine the importance weight (
) of each neighbor in the representation of node
.
where
is the activation function,
and
denote the weight matrix and bias vector of the neural network, respectively,
is the embedding size,
is the interactive embedding of user
and item
, and
denotes the importance weight of each
in the learning representation. This approach allows us to better capture the features of node
under different semantic spaces. Here is the formula for this:
where
, by normalizing the attention values using the
function so that the final embedding of the node will maintain stability as the gradient descends. We parameterize
with a two-layer neural network whose inputs are the embeddings
and
and whose outputs are the attention values. This network, referred to as a GAT, is defined as
. To calculate the importance weight (
), we apply the
function, as shown in Equation (5), to normalize the attention values. This normalization ensures that the gradient descent process remains stable during training. Additionally, we parameterize
using a two-layer neural network, whose inputs are embeddings
and
, defined as the GAT, as detailed in Equation (6).
The GAT employs as a nonlinear activation function, enhancing the model’s ability to capture complex, nonlinear relations within the data. and are the weight matrix and bias vector and represents the concat operation. By considering the interaction of node with neighboring nodes on specific meta-paths, the characteristics of node in different semantic spaces are captured. It allows the model to understand the importance of each neighbor node in influencing the representation of the central node, thus encoding aspects of the node’s context and behavior. With the ability to concat multiple graph learning layers, we can integrate the information of individual meta-paths to further improve the efficiency and accuracy of learning on each meta-path.
There is a standard subgraph sampling method called node sampling for aggregating information about neighboring nodes. This approach can represent the distribution of neighboring nodes in isomorphic graphs by restricting the number of nodes sampled. This technique enhances model robustness in heterogeneous graphs by providing diverse perspectives to effectively capture users’ and items’ rating patterns [
31]. The proposed SR-BS model introduces rating bias offsets among predefined meta-paths and incorporates the meta-paths in the representation learning process. Specifically, we perform a discard mechanism to discard user and item nodes randomly. Finally, rating prediction is performed based on the learned representation.
User Modeling
When learning the latent representation
of a user
from a user–item decentralized graph, we consider the user’s interaction history and their rating bias offsets for each item in the graph. We introduce rating bias offsets in user modeling, enabling the learning of potential representations that reflect statistical differences among users, rather than relying on raw rating data. The rating bias offset
for a user
is computed as shown in Equation (7), which takes into account the absolute difference between the user’s historical rating
and their average rating
. This offset quantifies the deviation of a user’s rating from their typical behavior. We transform these rating bias offsets into vector representations to further enhance our model’s learning capability.
where ∥ denotes the absolute value function, and ⎡ ⎤ denotes the ceiling function. To transform the rating bias offsets into vector representations, we map all of the rating bias offsets of user
to an Embedding Lookup Table. This table allows us to obtain a rating difference vector, denoted as
, for the user
. The embedding process encodes the rating bias information into a dense vector space, which the model can efficiently learn from during training. These vectors serve as informative features that capture nuanced user preferences, allowing the model to better discern genuine user preferences from biased or inconsistent ratings. This enhancement ultimately leads to more accurate and reliable recommendations. Given that the computation of the rating bias
may yield small values, we used an Embedding Lookup Table to avoid the problems associated with embedding methods when dealing with this case. Next, we model the interaction between the user
and item
with rating bias offset
, referred to here as the rating difference interaction representation
, and use it for modeling subsequent potential representations of the user
. It is defined as follows:
is an MLP, and is the embedding vector of the item . By incorporating rating biases in the form of vectors into the learning process of user latent representations, we can more effectively mine the statistical data for the latent preferences of user interaction behaviors, thus improving the accuracy of the recommendations.
Utilizing multi-relational paths for learning the potential representations of users and items can optimize the accuracy of recommendations in the recommendation process. We define a series of meta-paths in
Section 3.3, comprising five user-centric paths and three item-centric paths. These meta-paths are embedded with different higher-order relations, thus helping users and items to dig deeper and learn their latent factors. Subsequently, we incorporated these meta-paths in the learning process of GAT and aggregated the different levels of adjacencies to obtain a semantically embedded representation of the meta-paths. For example, in the case of meta-path
, the model takes the user–item interaction representation
previously gained and uses it as input to Equation (4), and based on the item embedding
, generates preliminary user representations
through item aggregation. Similarly, we can obtain the preliminary user representations
,
,
, and
for the other meta-paths from the social relation and item–user decentralized graphs by item aggregation and social aggregation, respectively. The specific definitions are as follows:
We merge the five representations as inputs to the GAT and learn their relative importance through the model to obtain the final potential representation of the user . Higher-order forms of user relations can be characterized through the collocation of .
Item Modeling
The item–user decentralization graph contains the item’s interaction history with different users and the rating bias offsets obtained by the items from these users. The graph reveals varying user attitudes towards the same item, informing us of its characteristics based on these diverse responses. Here, unlike the method of calculating rating bias in user modeling, the rating bias of the user
and
is calculated as
. We then use the information in this graph to learn the potential representation
of the item
. We define the rating bias offset
for the item
as follows:
In the next operation, similar to user modeling, the model learns different users’ potential representations of the same item. We first obtain the rating difference vector
for the item
, concatenate it with the embedded representation
of the user
, and inject it into the MLP. In this way, we learn the interaction representation
of rating differences between the user
and item
with rating bias offset
. It is defined as follows:
Similarly,
, an MLP, obtains the rating difference vector
analogously to acquiring
. The goal of item modeling is to gain the potential representation
of the item
from user–item interactions and similarity relations among items. As shown in
Table 1, we use three meta-paths
,
, and
, respectively, to reflect the associative relations between different nodes, and further obtain a preliminary item representation
,
, and
for each meta-path. Next, another MLP
is employed to fuse these three representations, and the final potential representation
of the output of the item
is:
Rating Prediction
The latent representations of users and items learned by the model capture the implicit relations and interactions between users and items, and by concatenating the latent representations of users and items and their dot product results, the user’s features and the item’s features can be correlated with each other to express the correlation between users and items. This combined information is fed into the three-layer neural network, where the model can learn more complex nonlinear relations, capture deeper relations between user preferences and item features, and compute preference ratings. To derive the preference rating
, we use the following operation:
Among them, in Equation (13) represents the dot product operation, and in Equation (14) is matrix multiplication. The activation function introduces nonlinearities to the inputs during the operation, allowing the model to better adapt to complex patterns in the data. The output of each layer is then passed on to the next layer using a multi-layer neural network to improve the generalization of the model, and, finally, the result is mapped using the transposed weight matrix to compute the predicted preference ratings .
3.4.3. Graph Attention Networks Fusing Meta-Paths
In social recommendation, we employ a standard objective function to measure prediction error, ensuring recommendation accuracy and enabling performance evaluation. This function utilizes the mean square error between real and predicted ratings as its error metric. We denote the function as:
where 〈 〉 denotes the number of acquired datasets,
is the base real rating performed by user
on item
, and
is the preference rating predicted by the model. During training, we randomly initialize the learned embedding vectors, with the rating difference embedding depending on the rating level, represented by five users’ rating values [
1,
5] of the item. We optimize the model by using a node-dropping mechanism to curb overfitting and bolster generalization.
4. Experimental Evaluation
To verify the efficacy of the proposed SR-BS model, we conducted experiments across various social recommendation datasets. Our experimental design focuses on the following research questions:
RQ1: How does SR-BS perform in rating prediction relative to the current mainstream social recommendation methods?
RQ2: How does the application of rating differences under different relation types affect the performance of the SR-BS model?
RQ3: How do different hyperparameter settings affect recommendation performance?
4.1. Datasets
The experiments utilize four real-world datasets: Epinions, Ciao, FilmTrust, and Duban. These datasets contain information about users, items, ratings, and social relations. Below, we provide a specific description of the datasets.
Epinions, Ciao: Epinions and Ciao are social network-based consumer review platforms. Users rate items on a scale of 1 to 5 and form social relations by adding other users to a trust list. The datasets capture user–item ratings and user–user trust relations.
FilmTrust: FilmTrust is an online movie review platform that contains user ratings and reviews of movies and allows for a one-way trust relation to share movie reviews and opinions.
Douban: Douban is the most popular online review platform in China, where a user can rate items according to their preferences and can build social relations.
To address dataset sparsity, we excluded users with fewer than five interactions. The rating data were then randomly partitioned into 80% training, 10% validation, and 10% testing sets.
Table 2 summarizes the statistics of the four datasets.
4.2. Evaluation Metrics
To assess the rating prediction performance of the recommendation methods, we use the MAE and Root-Mean-Square Error (RMSE) as the evaluation metrics. When stability and robustness are critical, MAE is preferred because it is less sensitive to outliers. When user personalization is a priority, RMSE is preferred because it gives greater weight to the larger error due to the squared difference. These metrics are widely used in recommender systems, and they quantify the difference between the predicted results and the actual scores, thus measuring the model’s predictive accuracy. These two metrics are defined as follows:
MAE is used to compute, for each user–item pair (
,
) in the test set, the absolute difference between the predicted rating
and the true ratings
and averages these differences.
indicates the size of the test set, i.e., the number of user–item pairs.
The RMSE is similar to the MAE in that for each user–item pair, the squared difference between the predicted rating and the true rating is computed, and these differences are averaged and squared.
The smaller the value of these two indicators, the closer the model’s prediction results are to the actual scores and the higher the accuracy of the prediction. We replicate experiments to determine the average performance of the test set with the best epoch. Despite our model’s minor improvements in these metrics, the research in [
6] indicates that even subtle improvements in MAE or RMSE can significantly enhance recommendation quality.
4.3. Baseline
To validate the effectiveness of our proposed model, we conducted four sets of comparative experiments. In each group, we selected representative methods as baselines:
Traditional recommendation methods:
PMF [
32]: Utilizes an MF-based probabilistic model that only uses the user’s rating information to predict the user’s rating of an item by learning potential factors.
Matrix factorization-based social recommendation method:
RSTE [
33]: Utilizes random mapping to mitigate the impact of data noise by jointly modeling users’ social and rating information.
SocialMF [
15]: Integrates the trust propagation mechanism with MF techniques, aiming to boost recommendation accuracy by considering user trust relations.
SoReg [
4]: Constrains user relations as social regularization conditions onto the MF objective, acting as a social regularization model.
Social recommendation methods based on social relations:
LOCABAL [
34]: Advocates for recommendations based on local social influence, underlining that a user’s social neighbors may significantly influence their tastes.
SREPS [
30]: Generates recommendations by considering social relations and item characteristics.
Social recommendation algorithms based on graph neural networks:
GraphRec [
21]: Leverages two GATs to model user–item interactions and interactions between users, primarily focusing on the first-order neighbors of users and items.
ConsisRec [
29]: Enhances GNNs-based recommendation models by sampling consistent neighbors and introducing relational attention during aggregation.
GDSRec [
24]: Boosts social connection strength by aggregating rating bias vectors from dispersed neighborhoods and incorporating preference similarity to improve prediction accuracy, eliminate rating bias, and advance collaborative filtering for social recommendation.
S4Rec [
35]: Predicts results by adaptively merging the depth graph and SVD models while employing TransH to model the rating difference behavior, consequently improving the model’s generalization ability.
4.4. Parameter Settings
The social recommendation model in this paper is built using the PyTorch framework and trained and tested on an RTX3090 Ti with 24G RAM. We optimize the model’s objective function using RMSprop as the optimizer, randomly selecting a training instance and updating each model parameter in the negative gradient direction. We configure the model’s hyperparameters on the four datasets as the batch size
, the embedding size of the model is
, the dropout rate
, and the learning rate of the model training is
. In the Attention Mechanisms Module, we choose the
activation function with a slope of 0.2. Sample sizes are set to 25 for the user–item bipartite graph in DropNode and 20 for the friendly neighbor nodes in the social graph. To ensure fairness, we refer to the optimal parameter settings reported from the original baseline paper and adapt all of them to ensure optimal performance.
Section 4.7 discusses how different parameters (i.e.,
and
) and dropout mechanisms affect the model’s performance.
4.5. Performance Comparison (RQ1)
To show that our model has better stability and user personalization, we compare it with 10 existing baseline models for social recommendation and show the validation made on four datasets in
Table 3.
In the table, the underlined values represent the best performance among all baselines, and the bold values represent the best performance among all models. The results show that PMF (Probabilistic Matrix Factorization), which solely uses users’ rating information to model latent factors, performs subpar compared to models like RSTE, SocialMF, and SoReg, which utilize social information. This conclusion suggests that combining social information can effectively improve recommendation performance. Furthermore, comparing LOCABAL and SREPS models highlights the importance of fully exploring social relations and item characteristics. The GNN-based models, i.e., GraphRec and ConsisRec, effectively utilize first-order social neighborhood information, demonstrating the advantages of GNNs in effectively exploiting interacting associative relations to enhance recommender systems. In addition, GDSRec incorporates rating bias data and preference similarity to enhance its predictive power. At the same time, the S4Rec model learns by combining semantic and structural views using implicit relations and user rating behaviors and performs the best among all baselines. However, the proposed SR-BS model outperforms the diverse baseline models across all datasets. This superior performance can be attributed to the model’s ability to effectively model user and item rating difference information, as well as different interaction information, and the efficient utilization of meta-paths to integrate varying types of relations. This comprehensive approach, as revealed by the performance metrics across diverse datasets, the SR-BS model improves 2.612%, 1.457%, 0.522%, and 0.546% on MAE and 1.127%, 1.241%, 1.444%, and 0.189% on RMSE on the four datasets, respectively, compared to the sub-optimal performance. Furthermore, the recommendation performance of the SR-BS model significantly surpasses that of other baseline models, even when tested on larger datasets such as Ciao and Epinions.
4.6. Ablation Experiment (RQ2)
In this section, we perform ablation studies to validate the impact of the SR-BS model components.
4.6.1. Effect of Rating Differences
This experiment illustrates the effectiveness of our proposed model. Our model considers three types of information to enhance accuracy: (1) the introduction of rating bias offsets for users, (2) the introduction of rating bias offsets for items, and (3) the integration of rating difference information in user–item interactions to learn latent factor representations. To better understand the proposed model, we compare the performance of SR-BS and its four variants with the same hyperparameters: SR-BS|Ud removes the user’s rating bias offset; SR-BS|Id removes the item’s rating bias offset; SR-BS|UId uses raw rating data instead of statistical rating differences in user–item interactive learning; and SR-BS|Nd processes all interaction information using raw rating information during representation learning.
Figure 3 shows the experimental results, indicating that the MAE of the four datasets decreased by 0.2350%, 0.9435%, 0.8669%, and 0.3434%, respectively, when we remove the user’s rating bias offsets. This conclusion suggests that considering the user’s preference tendency enhances modeling effectiveness. The removal of item bias offset also leads to a decrease in MAE on the four datasets, which suggests that adding additional item rating difference information can help to learn a more reflective representation of the item characteristics to improve recommendation performance. On the other hand, SR-BS|UId shows a similar MAE to SR-BS, yet the latter shows a 3.83% improvement in RMSE, suggesting that learning from rating difference data reflects more effective information than learning from raw rating data. SR-BS|Nd exhibits higher MAE and RMSE on all datasets, indicating its inferior performance compared to SR-BS. This reinforces the effectiveness of our raw users and items rating data processing, the importance of considering user and item preference tendencies, and analyzing rating difference information to enhance model performance.
4.6.2. Effect of Attention Networks
In the embedding aggregation process of the model, we employ the GAT to adaptively learn the semantic contributions of different meta-paths to the representation. This experiment further validates the functionality and effectiveness of GAT in the proposed SR-BS model. Additionally, the SR-BS model employs the
function to normalize attention values. To test the effect of the attention mechanism on meta-path aggregation in the SR-BS model, we designed two different aggregation operations in our experiments. We denoted these two variants by SR-BS_mean and SR-BS_max, respectively. We have changed Equation (5) in the paper, as follows:
or
Table 4 shows the performance results of these two variants and the proposed model on four datasets with different evaluation metrics. The above experimental results demonstrate that the SR-BS_mean variant has the worst performance. This is attributed to the averaging operation’s inability to recognize the importance of meta-paths, making it potentially ineffective in handling noisy data. In comparison, SR-BS_max performs better because its maximum operation is better at capturing critical meta-paths and is more advantageous against noisy data. Both variants, SR-BS_mean and SR-BS_max, yield the same output weights when processing attention values from different inputs. Therefore, they are categorized together. However, both SR-BS_mean and SR-BS_max fall short of the best performance of SR-BS. They exhibit a decrease in MAE by 3.6322%, 4.5728%, 1.6194%, 0.9104%, and 1.4446%, 2.2209%, 0.5457%, 0.2945% on the four datasets, respectively. This discrepancy is due to SR-BS’s fine-grained level of distinguishing the importance of different meta-paths, enabling it to demonstrate superior performance. This also demonstrates the effectiveness of widely applying GAT in social recommendation modeling.
4.7. Hyper-Parameter Study (RQ3)
In this subsection, we comparatively analyze the impact of various hyperparameters on model performance, including the embedding size of the model, the learning rate , and the sample sizes of DropNode in the user–item interaction graph and the social graph. Given the space constraints, we only show the performance variations on the Epinions dataset. As mentioned before, is the threshold we set to measure whether the shared following among users reaches the level that defines a higher-order relation. We observe that a larger τ can help identify more stable higher-order relations. We ignore here due to its minimal impact on model performance.
Impact of embedding size: Embedding size plays a crucial role in model capacity and expressiveness. A small size limits model expressiveness, while a large size may result in overly sparse embedding vectors, thus reducing performance. As shown in
Figure 4A, as we gradually increase the embedding size, the expressiveness of the model is significantly improved, and the accuracy is initially improved. However, once
reaches a certain threshold (e.g., in the Epinions dataset, this threshold is 80), the performance gain is no longer significant. At the same time, the computational complexity increases dramatically, and the performance decreases with a further increase in embedding size. Hence, choosing the right embedding size to balance model capacity with computational complexity is critical.
Impact of learning rate: The learning rate, which is the step size of the model to update the parameters each time during the training process, significantly impacts the model’s performance. If the learning rate is too large or too small, it will hinder the optimization of the model.
Figure 4B shows that when we choose
, the model performs best under all evaluation metrics. When the learning rate exceeds
, the model’s performance starts to decline gradually. Therefore, choosing an appropriate learning rate is crucial to achieving the best performance.
Impact of sample size in DropNode: As demonstrated in
Figure 4C,D, we find that whether it is a user–item interaction graph or a social graph, the model performance shows a gradual improvement with the increase in the sample size, primarily due to the additional learning information this provides. However, as we increase the sample size to a specific scale, the learned representations may become biased and confusing, resulting in decreased model performance and increased computational burden. Therefore, appropriate sample size control can reduce the model complexity and ensure prediction accuracy.


