Article

Performance Analysis of Several Intelligent Algorithms for Class Integration Test Order Optimization

1
State Key Laboratory of Mathematical Engineering and Advanced Computing, Zhengzhou 450000, China
2
Software College, Zhongyuan University of Technology, Zhengzhou 450000, China
3
School of Information Engineering, Zhengzhou University, Zhengzhou 450000, China
*
Author to whom correspondence should be addressed.
Electronics 2023, 12(17), 3733; https://doi.org/10.3390/electronics12173733
Submission received: 14 August 2023 / Revised: 28 August 2023 / Accepted: 1 September 2023 / Published: 4 September 2023
(This article belongs to the Special Issue The Latest Progress in Software Development and Testing)

Abstract

:
Integration testing is an essential activity in software testing, especially in object-oriented software development. Determining the sequence of classes to be integrated, i.e., the class integration test order (CITO) problem, is of great importance but computationally challenging. Previous research has shown that meta heuristic algorithms can devise class integration test orders with lower test stubbing complexity, resulting in software testing cost reduction. This study focuses on the comparable performance evaluation of ten commonly used meta heuristic algorithms: genetic algorithm (GA), particle swarm optimization (PSO), cuckoo search algorithm (CS), firefly algorithm (FA), bat algorithm (BA), grey wolf algorithm (GWO), moth flame optimization (MFO), sine cosine algorithm (SCA), salp swarm algorithm (SSA) and Harris hawk optimization (HHO). The objective of this study is to identify the most suited algorithms, narrowing down potential avenues for future researches in the field of search-based class integration test order generation. The standard implementations of these algorithms are employed to generate integration test orders. Additionally, these test orders are evaluated and compared in terms of stubbing complexity, convergence speed, average runtime, and memory consumption. The experimental results suggest that MFO, SSA, GWO and CS are the most suited algorithms. MFO, SSA and GWO exhibit excellent optimization performance in systems where fitness values are heavily impacted by attribute coupling. Meanwhile, MFO, GWO and CS are recommended for systems where the fitness values are strongly influenced by method coupling. BA and FA emerge as the slowest algorithms, while the remaining algorithms exhibit intermediate performance. The performance analysis may be used to select and improve appropriate algorithms for the CITO problem, providing a cornerstone for future scientific research and practical applications.

1. Introduction

Software testing is an important and labor-intensive process carried out to ensure software quality, accounting for about 40–50% of the overall project cost [1]. Effective integration testing helps to verify that the interface implements the desired functions. Traditional integration testing strategies include non-incremental one-time integration methods and bottom-up or top-down incremental integration methods [2]. With the wide application of object-oriented technology and the improvement of requirement complexity, the number of classes in a system increases. Consequently, the intricate control and dependency interrelations among classes are complex and pose challenges in precise delineation. Conducting object-oriented integration testing by conventional approaches becomes impractical. How to decide the order of classes that are developed independently is called the class integration test order problem (CITO). The CITO problem is computationally difficult, making accurate solutions very difficult to obtain [3].
Generally, people are required to construct test stubs for target classes to emulate their necessary functionalities, an important factor that impacts the cost of integration testing. Although several test tools (such as JUnit) can reduce the test stub cost, the stub construction remains complex and cumbersome with the risk of introducing new defects. Theoretically, CITO is a NP complete problem, rendering the identification of globally optimal class integration test orders impractical. However, Kung et al. proved that the number of test stubs and the corresponding construction complexity are different for various CITO [4]. Reasonable class integration test orders can reduce the test stub cost [5].
In the literature, various approaches and strategies for the CITO problem have been proposed. Most of the approaches are based on graph theory, focusing on breaking class dependency cycles, and determining orders via reverse topological sorting. However, graph-based approaches have difficulties in identifying strongly connected components, especially when a system contains numerous dependency cycles. In the field of software engineering, some popular meta heuristic algorithms such as genetic algorithm, particle swarm optimization algorithm, and firefly algorithm have been used to automate the process of test data generation with the goal of covering target paths [1]. Due to the computational complexity, the CITO problem has become a subject of the search-based software engineering (SBSE) [6]. Researchers have transformed the CITO problem into an optimization problem. More recent approaches for CITO are search-based methods by using meta heuristic algorithms.
In recent years, many new algorithms have emerged because of their simplicity and robustness. A survey conducted by Hussain [7] collected 1222 publications from 1983 to 2016 and revealed around 140 meta heuristic algorithms applied in a diverse range of fields broadly in the area of science and technology, economics, and daily life. The famous No Free Lunch (NFL) theorem states that the performance of all algorithms is equal across all possible optimization problems. To identify the most appropriate algorithms for CITO problem and streamline forthcoming research in the field of search-based class integration test order generation, we conducted a comparative performance analysis.
The remainder of this paper is structured as follows. Section 2 describes the past literature on CITO problem. Section 3 describes the entire research methodology with detailed information of algorithm selection, problem representation and the optimization process. Section 4 analyzes and discusses the experimental results, including stubbing complexity, attribute complexity, method complexity, convergence performance, average runtime, and memory consumption. Section 5 summarizes the internal validity and external validity of the experiment. Section 6 presents the conclusion as well as the theoretical and practical contributions for the study.

2. Literature Review

Object-oriented software engineering is the application of object-oriented method in the field of software engineering. The object relationship graphs and class design models provide a solid working foundation for generating class integration test orders. Several papers have proposed various strategies to derive test orders.
Kung et al. [4] were the first researchers to address the CITO problem. They put forward the graph-based method to minimize the number of test stubs. If there was no cycle in an object relationship graph, reverse topology sorting was used to generate class integration test orders. If there were cycles, the cycles were destroyed by deleting associated edges with the smallest number of test stubs. Based on Kung’s work, Tai and Daniels [8] created the primary integration test order in strong inheritance and aggregation dependencies, and then constructed the secondary integration order by deleting edges with the largest weight. Traon et al. [9] measured class relationships based on the leaf edge counts and deleted loops containing nodes with the maximum weights. Briand et al. [10] used Tarjan’s algorithm to explore object relationship graph in depth. Based on recursive identification of strong connected components, they calculated the weight of each association dependency, and then deleted the edges with the largest weight to break cycles.
All the aforementioned endeavors employed graphs models to portray class dependencies, subsequently applying graph-based algorithms to break cycles. The objective of these graph-based approaches is to minimize the number of test stubs, as perceived as a major cost factor in integration testing.
Subsequent studies indicated that the test order with the fewest stubs may not be the best choice [11]. Briand et al. [12] pointed out that the solutions based on graph theory would be difficult or impossible to fully solve CITO problem especially when assuming equal development cost for each stub. Consequently, various meta heuristic algorithms, such as genetic algorithm and particle swarm optimization, were employed to solve the CITO problem, yielding promising performance and efficiency outcomes.
Briand et al. [12] first proposed the search-based method to obtain appropriate test orders. They proposed the concept of stubbing complexity based on attribute coupling and method coupling. Under the constraint of not breaking strong dependencies, they combined the inter class stubbing complexity and genetic algorithm to minimize the stubbing effort and formulate optimal class integration orders. The results on five real-world applications were encouraging and reliable.
Borner et al. [13] presented an approach to measure the test focus of a given integration test order. They selected the fault prone dependencies as the test focus, integrated the test focus in early integration steps, and then applied the simulated annealing algorithm to minimize the effort to simulate not yet integrated components of the system. They pointed out that the disadvantage of simulated annealing and genetic algorithm was the long duration for deriving test orders.
Cabral et al. [6] pointed out the existing graph-based approaches failure to consider various factors or metrics, leading to suboptimal solutions. They proposed a multi-objective optimization representation of CITO problem and implemented the Pareto ant colony algorithm to strike a balance between different metrics.
Based on Cabral’s work, Vergilio et al. [14] introduced a multi-objective optimization approach and implemented three different multi-objective optimization algorithms to generate a set of good solutions: Pareto ant colony, multi-objective tabu search and non-dominated sorting genetic algorithm. The experimental results showed that meta heuristic algorithms were suitable for addressing software engineering complex problems, like CITO.
Mariani et al. [15] proposed an offline hyper-heuristic algorithm named GEMOITO to reduce efforts in choosing, implementing, and configuring of search algorithms. Grammatical evolution was used to automatically generate a multi-objective evolutionary algorithm. These generated optional algorithms were distinguished by components and parameters values to solve CITO problem.
Czibula et al. [16] proposed an improved genetic algorithm with stochastic acceptance to optimize class integration test orders. In the proposal, the complexity of stub construction was estimated by assigning weights to various types of dependencies in object relation diagram.
Given the successful application and validation of particle swarm optimization in addressing complex optimization problems within search-based software engineering, Zhang et al. [17] reformulated the CITO problem into a one-dimensional optimization problem and introduced the standard particle swarm optimization algorithm to devise optimal test orders.
Zhang et al. [18] proposed an improved particle swarm optimization algorithm that incorporates an individual’s dream ability, thereby improving population diversity, optimization accuracy, and convergence speed. The proposed algorithm could converge slowly and avoid falling into local optimum too early.
Zhang et al. [3,19] assessed test stub cost from two aspects: data coupling and control coupling. Based on the extended object relationship diagram, they calculated testing costs and test profits to set class selection priorities. Furthermore, they proposed a strategy for combining similar classes, reducing class count and thereby greatly simplifying the optimization complexity.
Zhang et al. [20] extended the search-based class integration test order approach to the context of service-oriented architecture. They employed integration priority to denote the importance of service software and proposed an improved genetic algorithm to generate integration test sequence between service software.
Zhang et al. [21] adopted coupling-based complexity to gauge test stub cost. They proposed a hybrid algorithm of grey wolf optimizer and arithmetic optimization algorithm to provide a proper balance between exploration and exploitation, improving the convergence speed and optimization accuracy.
It is meaningful to conduct performance analysis in a certain research field, which helps follow-up researchers to quickly understand the research status, research results, and the effectiveness of corresponding solutions. Harman and Mcminn [22] conducted theoretical and practical research on test data generation, analyzed the applicability and effectiveness of local search algorithm, global search algorithm and hybrid search algorithm. Harman et al. [23] summarized the existing achievements in the field of search-based software testing and put forward the problems or challenges in this field. Khari et al. [24] analyzed and summarized the research results of search-based software testing from 1996 to 2016. Zhang et al. [25] comprehensively analyzed the technical characteristics and research status of graph-based and search-based methods for the CITO problem. Zhang et al. [26] conducted a convergence analysis for some related algorithms from the perspective of Markov chain theory. Khari et al. [1] analyzed and compared the effectiveness and efficiency of several meta heuristic algorithms over the automatic test suite generation.

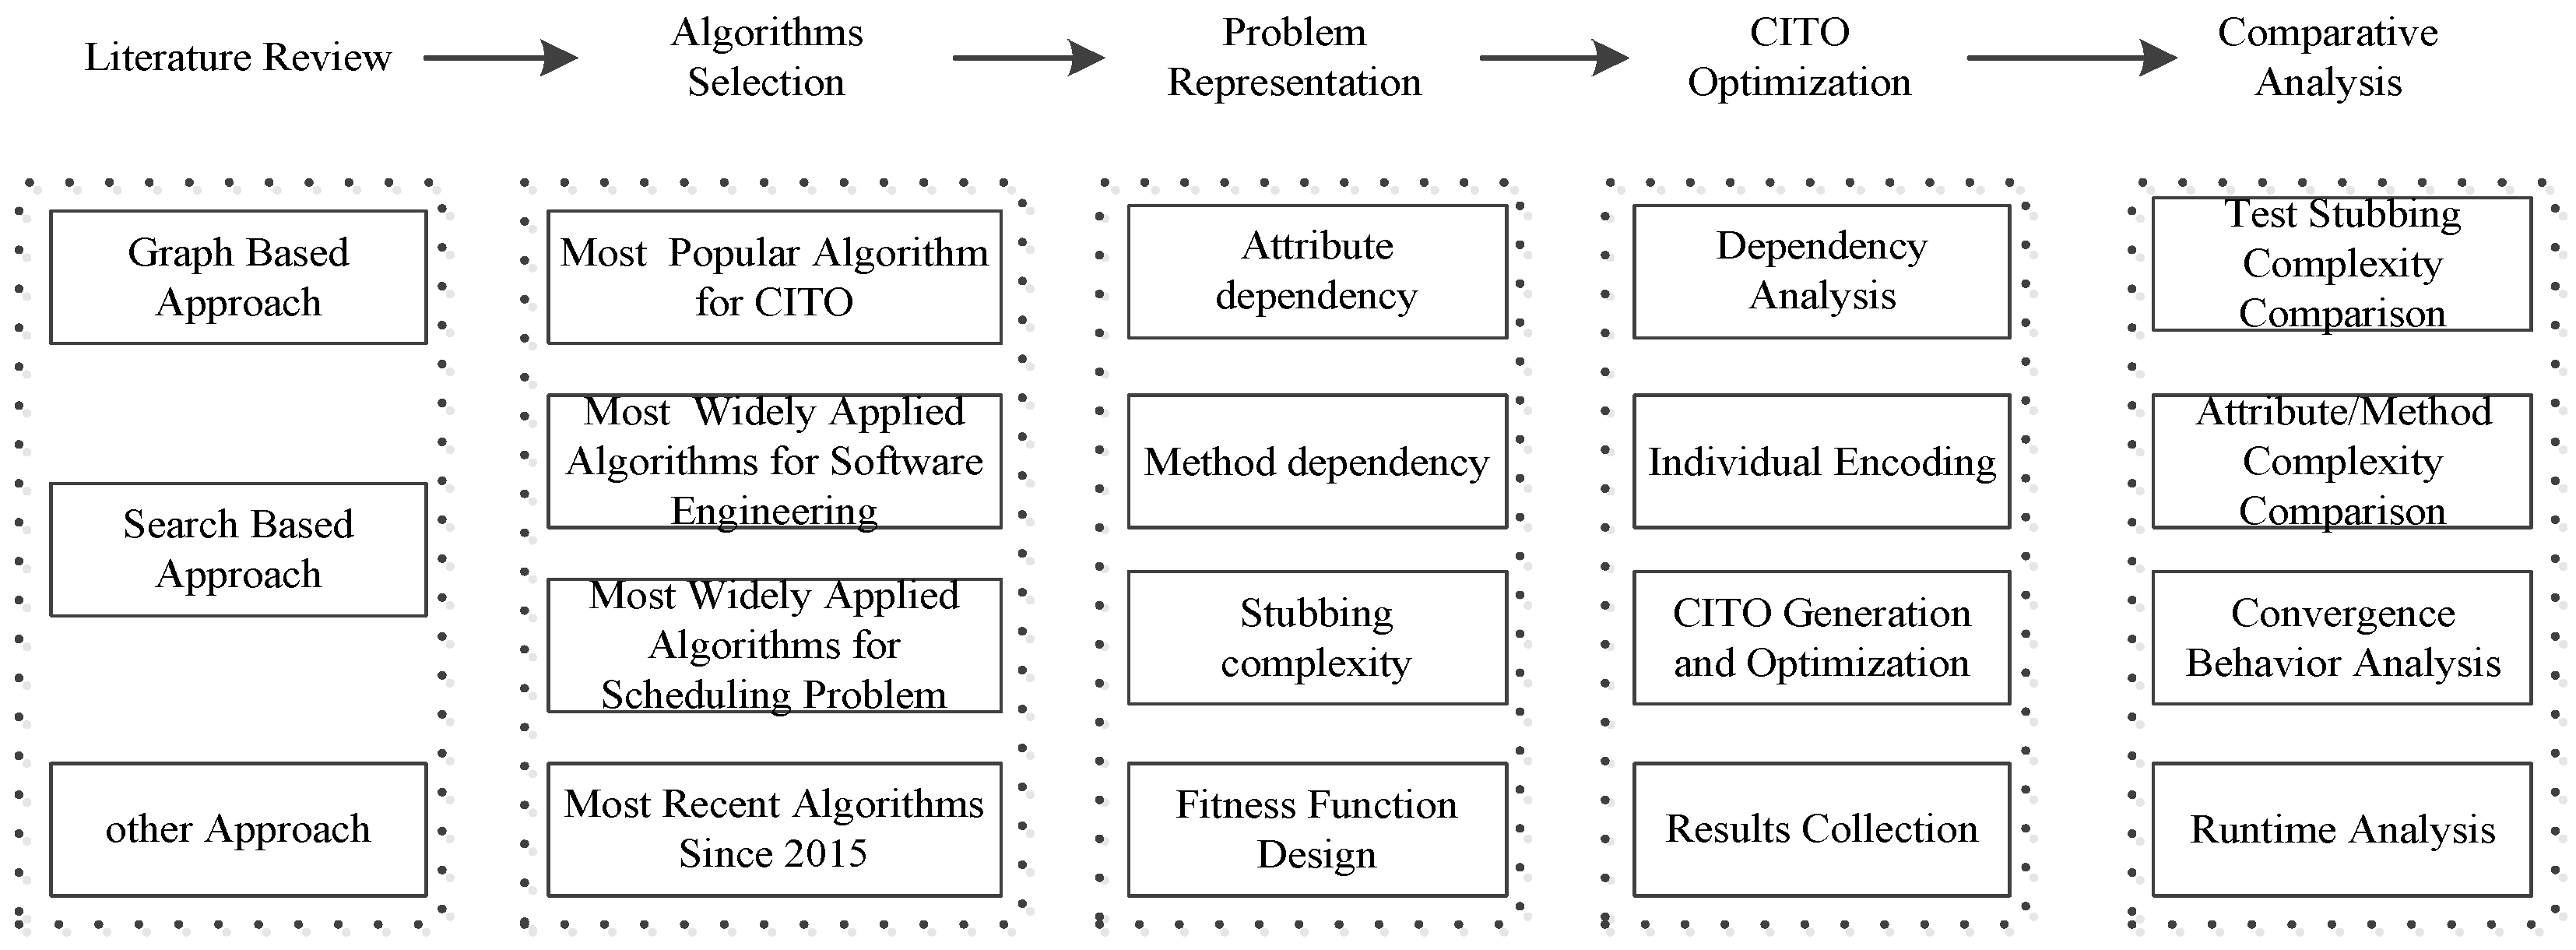
3. Research Methodology

The research methodology and main processes are defined for this comparative study, as shown in Figure 1. The main steps undertaken for this study include algorithm selection, problem representation, CITO optimization and comparative performance evaluation.
The first phase involves conducting a comprehensive literature review on the CITO problem, outlined in Section 2. Both graph-based and search-based approaches have been widely used to obtain class integration test orders. Differently from the reverse topological sorting used in graph-based approaches, search-based approaches are flexible and practical. Researchers have pointed out that the CITO problem, which is very much related to the so-called routing or scheduling problem, is a multi-objective optimization problem. Theoretically, the search space for the CITO problem encompasses all possible integration test orders, and the optimization process could be fraught with numerous local minima in which a stepwise algorithm may get stuck. These unique characteristics of CITO may have a significant impact on the optimization ability of meta heuristics algorithms to converge towards optimal test orders.
After the step of meta heuristic algorithms selection, the reformulation of the CITO problem is presented with mapping strategies between a test order and an individual location. The subsequent step is the execution of each meta heuristic algorithm to search class integration test orders following a set of rules, which are the core of each algorithm. This iterative process is repeated hundreds of times and the stubbing complexity, method complexity, attribute complexity, average time, etc., are recorded for each execution. After this, the optimization performance is analyzed and discussed.

3.1. Algorithms Selection

According to their popularity and how recently they were developed, we selected ten algorithms: genetic algorithm (GA), particle swarm optimization algorithm (PSO), cuckoo search (CS), firefly algorithm (FA), bat algorithm (BA), grey wolf optimizer (GWO), moth flame algorithm (MFO), sine cosine algorithm (SCA), salp swarm optimization algorithm (SSA), and Harris hawk optimization algorithm (HHO). The primary rationale for the selection is based on their simplicity, flexibility, and capability of preventing the optimization process from getting trapped into local optimum. The detailed reasons are as follows.
(1)
Genetic algorithm and particle swarm optimization algorithm are widely recognized and commonly employed for generating integration test orders.
(2)
Cuckoo search algorithm, firefly algorithm, and bat algorithm have been widely used to automate the process of test data generation with the goal of covering target paths in the research field of search-based software engineering [1,27].
(3)
Grey wolf optimization algorithm, moth flame algorithm, sine cosine algorithm, salp swarm algorithm, and Harris hawk optimization algorithm have emerged as more efficient solutions since 2015. They have been successfully applied to scheduling or routing problems and various combinatorial optimization problems with a huge and noisy search space [7]. The relevance of these problems to the test order problem makes these algorithms suitable candidates in the CITO context.
A brief introduction of each algorithm is described below.
Genetic algorithm [12] is a global optimization techniques that mimic biological evolution. Each chromosome evolves under the influence of natural selection and recombination. Natural selection determines which individuals are selected, survive, and reproduce. Recombination ensures the chromosome will be mixed to form a new one. In the context of genetic algorithm, the encoding scheme, crossover, and mutation operators should be designed for a special optimization problem.
Particle swarm optimization [28] is a meta heuristic algorithm proposed by Kennedy in 1995 to simulate the predatory behavior of birds. Each particle represents a candidate solution with its own velocity and spatial position. In the process of evolution, a particle improves its quality under the guidance of individual historical optimal solution p and the global optimal solution g . At the t + 1 iteration, the velocity and position update equations of the dth dimension of individual x are shown in Equations (1) and (2), where w represents the inertia weight, c1 and c2 are learning factors, r1 and r2 are random numbers between 0 and 1.
v i d t + 1 = w t v i d t + c 1 r 1 p i d t x i d t + c 2 r 2 g i d t x i d t
x i d t + 1 = x i d t + v i d t + 1
The cuckoo search algorithm [29] is a meta heuristic algorithm proposed by Yang in 2009, inspired by the hatching parasitism characteristic of cuckoo. Each bird nest improves its quality through random walk. The optimization process discards poor solutions with a certain probability. The position update formula of the ith nest of cuckoo at t + 1 iteration is shown in Equation (3), where represents point-to-point multiplication, α represents the step size subject to normal distribution and L ( λ ) represents the random step size following to Levy distribution.
x i t + 1 = x i t + α L λ
The firefly algorithm [30] is a meta heuristic algorithm proposed by Yang in 2010 inspired by the attracting and information exchanging behavior of fireflies. In the process of evolution, fireflies are attracted by brighter ones. In the t + 1 generation, the dth dimensional update formula of firefly x is defined in Equation (4), where β represents the relative attraction between two fireflies, α represents the step factor, ε represents a random number following the uniform distribution.
x i d t + 1 = x i d t + β x j d t x i d t + α i t ε
The bat algorithm [31] is a meta heuristic algorithm proposed by Yang in 2010 to simulate the precise search and prey hunting behavior of bats using ultrasound. In the process of evolution, the best bat locates the accurate prey position through ultrasonic pulse. The speed and position update formula for each individual are given in Equations (5) and (6), where x represents the global best position and fi represents the search pulse frequency.
v i t = v i t 1 + x i t x · f i
x i t = x i t 1 + v i t
The grey wolf optimization algorithm [32] is a meta heuristic algorithm proposed by Mirjalili in 2014 to simulate the hierarchical structure and hunting behavior of grey wolves. The social groups of wolves are divided into α wolves, β wolves, δ wolves and ω wolves, representing the leader, assistant decision-maker, executor, and lowest level of wolves, respectively. Each ω wolf represents a candidate solution and moves to a new position under the guidance of α, β and δ wolf, as shown in Equations (7) and (8), where D represents the distance between the wolf and the prey, C represents the swing factor, X p t represents the prey position, and A represents the convergence factor.
D = C · X p t X t
X t + 1 = X p t A · D
The moth flame algorithm [33] is a meta heuristic optimization algorithm proposed by Mirjalili in 2015 to simulate the spiral flight path of moths at night. In the process of evolution, the individual position is updated based on its nearby flames, as shown in Equations (9) and (10), where Di represents the distance between the moth and prey, Fj represents the flame j, Mi represents the moth i, and b is the constant coefficient defining the logarithmic spiral shape, and θ is the random path coefficient in [−1, 1].
D i = F j M i  
M i = S M i , F j = D i · e b θ · c o s 2 π t + F j
The sine cosine algorithm [34] is a meta heuristic algorithm proposed by Mirjalili in 2016. Candidate solutions fluctuate towards the best solution using a mathematical model based on sine and cosine functions. At the t + 1 iteration, the position update equation of the individual x is shown in Equation (11), where r2, r3, and r4 are random numbers. In order to balance the exploration and exploitation ability, r2 is viewed as the control parameter of linear decreasing according to (12), in which is a constant.
x i d t + 1 = x i d t + r 1 × s i n r 2 × r 3 P i d t x i d t , r 4 < 0.5 x i d t + r 1 × c o s r 2 × r 3 P i d t x i d t , r 4 0.5
r 1 = × 1 t / T
The salp swarm algorithm [35] is a meta heuristic algorithm proposed by Mirjalili in 2017 to simulate the navigation and foraging chain behavior of salp swarm. The group is divided into leaders and followers, representing the exploration and exploitation ability separately. In the process of evolution, leaders guide followers to move toward the target food, and each follower interacts with the before and after individuals. The position update formula of dimension d of leader x1 is shown in Equation (13), where Fd represents the food position, ub and lb represent the upper and lower bounds of corresponding dimensions, respectively. C2 and C3 are random numbers in [0, 1]. C1 is the convergence factor shown in Equation (14), where t represents the current iterations and T is the max iterations. The update formula of the follower xi is shown in Equation (15).
x d 1 = F d + c 1 c 2 u b l b + l b , c 3 0.5 F d c 1 c 2 u b l b + l b , c 3 < 0.5
c 1 = 2 e 4 t / T m
X d i = ( X d i X d i 1 ) / 2      
The Harris hawk optimization [36] is a meta heuristic algorithm proposed by Heidari in 2019 to simulate the cooperative behavior and chasing style of Harris’ hawks in nature. In view of its large number of position update equations, only the workflow of the algorithm is briefly presented here. The algorithm selects exploration or exploitation stage according to the comparison result between escape energy of prey and the random number set. Further, according to the escape behavior of prey and the chase strategy of the Harris hawk, the algorithm can carry out the process of soft and hard siege and timely switch between soft and hard siege.

3.2. Problem Representation

3.2.1. Stubbing Complexity

Due to complex dependencies among classes, a lot of effort is required to build stubs to simulate services required by the tested object. However, stubs are not a real part of the software and will not be used in the final software. Naturally, people hope that the fewer stubs constructed in the process of class integration testing the better, and the lower construction cost the better. Thus, the cost of a class integration test order can be evaluated by test stub cost.
However, in many cases, the number of stubs is not directly proportional to the test stub cost; hence, the accuracy of using the number of stubs to evaluate the test stub cost is low. Since the stubbing effort cannot be directly measured or estimated, we adopt the coupling-based fitness function, which captures coupling relationships in object-oriented systems, in a fashion similar to the previous studies.
There are various dependencies among classes in the object-oriented software development. Inheritance and composition include not only control coupling but also data coupling, constituting strong dependencies [2]. Breaking such strong relationships would likely lead to complex stubs with high cost. For instance, if B is a subclass of A, A should be integrated before B. Usage, association, and simple aggregations are considered to be weak dependencies with low cost. Two simple and intuitive measures of coupling are used to quantify weak dependencies:
Attribute complexity [12] is quantified as follows: The number of attributes locally declared in the target class when references/pointers to instances of the target class appear in the argument list of some methods in the source class, as the type of their return value, in the list of attributes of the source class, or as local parameters of methods. The number of attributes between target class i and source class j that would be handled in a stub is called attribute complexity A (i, j).
Method complexity [12] is quantified as follows: The number of methods locally declared in the target class which are invoked by the source class methods. The number of methods between target class i and source class j that would be handled in a stub is called method complexity M (i, j).
After the static analysis of the system under test, the attribute complexity matrix A and method complexity matrix M among classes can be constructed. Taking account both attribute complexity and method complexity, we can define stubbing complexity between class i and class j through linear scalarization method.
Further, in order to avoid the strong influence of any complexity measure unit on the stubbing complexity, any complexity measure C p l x i , j is normalized according to Equation (16), expressed as C p l x i , j ¯ .
C p l x i , j ¯ = C p l x i , j / C p l x m a x C p l x m i n
where C p l x m a x and C p l x m i n represent the maximum and minimum value of matrix elements, respectively. When there is no coupling between two classes, the value of the matrix element is specified as 0, that is, the minimum value of the matrix is 0. Therefore, Equation (16) can be simplified to Equation (17).
C p l x i , j ¯ = C p l x i , j / C p l x m a x
For a pair of classes (i, j) with dependency linking, the stubbing complexity SCplx(i, j) can be defined and computed as a weighted geometric average of the two normalized complexity measures, as shown in Equation (18).
S C p l x i , j = W A A i , j ¯ 2 + W M M i , j ¯ 2 1 / 2
where WA and WM represent the weights of attribute complexity and method complexity, respectively, and WA + WM = 1.

3.2.2. CITO Formulation

For a class integration test order o containing n classes, its fitness function can be expressed as the stubbing complexity of the total class dependency pairs (i, j) contained in the testing order o, as shown in Equation (19).
f i t n e s s o = O c p l x o = i = 1 , j = 1 n S C p l x i , j
Assuming that the classes are represented as a set C = {C1, …, Cm} to be integrated, then the CITO problem can be viewed as the problem of constructing a permutation π of {1, 2, …, m} that minimizes the stubbing complexity when classes are integrated in the order given by π: Cπ1,…,m = (Cπ1, Cπ2, …, Cπm).
The search space to the CITO problem is the set of all possible integration test orders. Therefore, the optimization process of generating class integration test orders is to search one or a group of testing orders that can minimize the test stub cost under the guidance of the fitness function, as shown in Equation (20).
m i n   f i t n e s s C π 1 , , m = m i n   o c p l x C π 1 , C π 2 , , C π m

3.3. CITO Optimization

This is the main step wherein each selected meta heuristic algorithm is implemented to generate a set of optimal test orders. The main difference between heuristic algorithm and meta-heuristic algorithm is that the heuristic algorithm needs to be modified according to actual problems, while meta heuristic algorithm can solve most kinds of optimization problems without modification [1]. So we use the standard form of these algorithms to solve the CITO problem. The general search-based CITO optimization process is shown in Figure 2.
There are three modules in the general flow of search-based CITO optimization process. Firstly, a group of class integration test orders are generated randomly. By following the mapping algorithm as shown in Section 3.3.1, each test order is mapped to an individual position in one dimensional space. Secondly, the position of each individual is calculated and improved under the guidance of fitness function as described in Section 3.2, following the optimization rules of different algorithms. Finally, the algorithm stops and the optimum individual position is obtained, and mapped to the optimal class integration test order as described in Section 3.3.2.

3.3.1. Mapping CITO to Individual Position

The search space to the CITO problem is the set of all possible integration test orders for the system under test. Referring to the approach proposed by Zhang [17], any class integration test order can be regarded as an individual in one-dimensional space, while different test orders correspond to different positions in one dimensional space. The mapping pseudo code from a class integration test order to individual position is shown in Algorithm 1.
Algorithm 1: Map a class integration test order to individual position
Input: class integration testing order o
   list of classes in descending order list
   number of classes n
Output: position
  • BEGIN
  • Initialize the individual position = 0;
  • FOR (int i = 0; i < n; i++)
  • temp_class = o.get(i);/*get ith class in o*/
  • index = list.getIndex(temp_class);
  • position = position + index *(n-i-1)!
  • END FOR
  • END
Given a class integration test order o, the classes list in descending order based on the sum of method and attribute coupling list, and the number of classes n, Algorithm 1 can generate the corresponding individual position for o in one dimensional space, position.
Algorithm 1 begins with the initialization step (line 2) where the output position is initialized and set to 0. Every class in a given test order o would be traversed and the individual position of these n classes in test order o would be determined (lines 3–7). For each class in o, the class information and its index in the ordered list are obtained (lines 4–5), then its location can be calculated (line 6). By summing locations of these n classes, we can get the position in one dimensional space for a class integration test order through the above steps.

3.3.2. Mapping Individual Position to CITO

Any individual in search space can be converted to a class integration test order, as shown in Algorithm 2. In the process of evolution, the algorithm generates new class integration test orders by constantly changing their own spatial positions. At the end of the iteration, the algorithm obtains the optimal individual position, which would be further mapped into a class integration test order. The mapping pseudo code from an individual position to a class integration test order is shown in Algorithm 2.
Algorithm 2: Map individual position to a class integration test order
Input: position
   list of classes in descending order list
   number of classes n
Output: a class integration test order o
  • BEGIN
  • FOR (int i = 0; i < n; i++)
  • index = position/(n-i)!
  • temp_class = list.get(index)
  • o.add(temp_class)
  • list.remove(temp_class)
  • position = position % (n-i)!
  • END FOR
  • o.add(list.get(0))
  • END
Given a position of an individual in one dimensional space position, the sorted classes list in descending order based on the sum of method and attribute coupling list, and the number of classes n, Algorithm 2 determines the class integration test order o.
Algorithm 2 calculates the class integration test order that the individual corresponds to, in the form of adding each class in the test order one by one (lines 2–8). The position of a class in list can be calculated through the location information divided by the permutations number of classes at this location (line 3). Then, a class is added to o and removed from list (lines 5–6). After circular computations, the remaining classes can be added to o (lines 2–8). When there is only one class in list, the last class is added to o finally (line 9).

3.3.3. Constraints

A number of dependencies can be found among classes in the object-oriented software development. Different dependencies may lead to stubs of widely varying complexity [12]. Among these various relationships, inheritance and composition relationships usually entail tight attribute coupling or method coupling between child/parent and container/contained classes, constituting strong dependencies. Breaking such strong relationships would likely lead to complex stubs with high cost.
According to the coupling level involved and fitness function designed in Section 3.2, our strategy does not construct stubs for inheritance and composition dependencies. This implies that the parent/container classes must precede child/contained classes in any class integration order.
Based on the static analysis of software under test, a precedence table outlines the conditions requisite for an individual to be accepted. Under these constraints, any integration test order that violates the inheritance and composition dependency relations would be rejected and regenerated until the order fulfills the constrains in the precedence table.

3.4. Comparative Analysis

The execution process of each meta heuristic algorithm to search class integration test orders is done hundreds of times repeatedly to make sure the consistent optimization results. Once the end criteria are achieved, the stubbing complexity, method complexity, etc., are stored for each execution.
Then, the comparative optimization performance is analyzed and discussed to compare the algorithms relative to each other. Here, the metrics of stubbing complexity, method complexity, attribute complexity, average runtime and memory are compared to deduce the suited algorithms for the CITO problem.

4. Experimentation

Taking the stubbing complexity as the fitness function, we design two questions to focus on the performance analysis of these ten meta heuristic algorithms for the CITO problem.
Q1: Which algorithms can devise class integration test orders with low stubbing complexity?
The performance metrics for hundreds executions of each meta heuristic algorithm are collected, analyzed, and compared, including stubbing complexity, attribute complexity, and method complexity. The smaller value of the stubbing complexity, the lower the test stub cost required.
Q2: How efficient are the algorithms for generating class integration test orders?
Different algorithms have different convergence speeds and different iteration runtime. Therefore, this paper attempts to analyze the convergence speed, runtime and memory required of each algorithm to find which algorithms can obtain the same or better class integration test order with less computational resource.

4.1. Experiment Subjects

In order to verify the performance of these meta heuristic algorithms for the CITO problem, ten classic benchmark systems are selected for testing [3,11,17,18,19,21]. These case studies are real-world systems with varying complexities written in Java. Elevator is an elevator operation simulation system. SPM is a patrol monitoring simulation system. ATM is an automated teller machine simulation system. Daisy is a network file system. ANT is a Java program update and build tool supplied by the open source Apache project, which is a part of the Jakarta project. DEOS is a detection error system for concurrency bugs of multi-threaded programs. Email is a supporting system for email operations. BCEL is a byte code engineering library, a part of Jakarta project too. DNS is a domain name service system, and Notepad_SPL (Notepad for short) is a source code editor.
For SPM, ATM, ANT, BCEL and DNS, the same benchmark used by Briand et al. [12] is employed. We take the inter class relationship as input, but not source code. The class information, dependency information are identified and analyzed based on reverse engineering of object relation diagram.
For Elevator, Daisy, DEOS, Email and Notepad, the source code is analyzed by using the open source tool SOOT for detailed relationships among classes. Using the information of variable, method, class name and package name, etc., we can obtain the object relation diagram, attribute complexity, method complexity and precedence relationship. Different from the SPM, ATM, ANT, BCEL and DNS, we have not re-implemented the graph-based algorithm for Elevator, Daisy, DEOS, Email and Notepad, and therefore, we do not know the number of cycles, which is expressed by “N/A” in Table 1.
The detailed information about these systems is shown in Table 1. Column 2 shows the total class numbers, Columns 3–9 give the number of usages, associations and aggregations, compositions, inheritance, the total dependencies, the total elementary circuits, and code lines, respectively. These systems come from various application fields and have different functions. The number of classes ranges from 21 to 65, the cycles from 4 to 416,091, and the code lines from 934 to 6710, making these cases representative.
In order to further describe the detailed coupling distribution, the attribute and method coupling values between classes are summarized in Table 2. Recall that the CITO optimization process should satisfy the inheritance and composition dependency, the value of attribute coupling and method coupling in Table 2 are the coupling value of associations, simple aggregations, and usage dependencies. Column 2 and column 5 are the max values, column 3 and column 6 are the average values, and the sum values are shown in column 4 and column 7.

4.2. Parameters Settings

Ten intelligent algorithms, genetic algorithm, particle swarm optimization algorithm, cuckoo search algorithm, firefly algorithm, bat algorithm, grey wolf optimization algorithm, moth flame algorithm, sine cosine algorithm, salp swarm algorithm and Harris hawk optimization algorithm, are selected for performance analysis.
Since genetic algorithm and particle swarm optimization algorithm have been employed to generate CITO in the literature, the values of their relevant parameters in the literature are used. While other algorithms have not been applied to the CITO problem, their standard implementation form and corresponding parameter values are adopted to minimize the parameters dependence. Although there are many variants of the remaining eight algorithms, most of them were designed to solve certain special engineering problems. Essentially, the standard form of each algorithm embodies the core optimization principles with excellent stability and performance [7]. Additionally, for the NP complete CITO problem, we have not conduct in-depth theoretical research on its mathematical characteristics, hence we use the standard form of these algorithms to generate test orders.
The detailed parameter settings for these ten meta heuristic algorithms are shown in Table 3.

4.3. Experiment Design

The experiment environment is Intel i7 CPU 2.6 GHz. RAM 8 GB. The software used is Windows 10 with minconda3 and Pycharm development environment. For each algorithm, the detail steps are implemented as follows to obtain optimal test orders.
Step 1. Randomly initialize the population, where each individual represents an integration test order.
Step 2. Map each individual in the initialized population into a individual location of one dimensional space, hence each position is used to represent an integration test order instead, as designed in Section 3.3.1.
Step 3. Update the individual location according to the evolve strategy designed by each algorithm, and gain the optimal individual location once achieving the end criteria, as described in Section 3.1.
Step 4. Map the output individual locations to class integration test orders, as designed in Section 3.3.2.
Considering the recommended value of population size rang of 25 to 100, the population size is set to 100 and the maximum iteration is set to 200 to maintain the population diversity in this paper. Additionally, the values of WA and WM in the fitness function are both set to 0.5, referring to previous research findings. To mitigate the impact of randomness, the experimental results are averaged over 20 independent runs.
For Q1, the stubbing complexity is used to measure the test stub cost as defined in Section 3.2. In order to understand the effectiveness of search-based approaches for CITO, we analyze the relationship between optimization results and the number of dependencies, as well as the relationship between optimization results and coupling distribution. Subsequently we conduct statistical Wilcoxon analysis for performance comparison. Furthermore, we discuss the optimization capability on attribute complexity and method complexity separately, to determine which algorithms perform better in attribute coupling guided systems and which algorithms fare better in method coupling guided systems.
For Q2, the convergence behavior, average runtime and memory consumption are used to measure the efficiency of these meta heuristic algorithms. For the convergence behavior analysis, we discuss the influence of dependency cycle on optimization performance. In terms of computational resource, the values of average runtime and memory of each algorithm are stored and analyzed.

4.4. Effectiveness Analysis

4.4.1. Stubbing Complexity

As described in Section 3.2, the fitness function value O c p l x (o) for a given test order o is the sum of a set of weighted geometric average of the normalized attribute complexity A i , j ¯ and method complexity M i , j ¯ , computed according to Equation (17), respectively, ensuring that the resulting stubbing complexity is insensitive to the two measurement units.
During the experiment, each algorithm ran independently 20 times, and the minimum, maximum and average values of the stubbing complexity were recorded. The resulting stubbing complexity implemented by the genetic algorithm, particle swarm optimization algorithm, cuckoo search algorithm, firefly algorithm, bat algorithm, grey wolf optimization algorithm, moth flame algorithm, salp swarm algorithm, sine cosine algorithm and Harris hawk optimization algorithm is shown in Table 4 and Figure 3. In Table 4, for each system under test, the first and second rows represent the best and worst value, the third row provides the average stubbing complexity value, the fourth row represents the standard deviation of the optimization results, then the fifth row represents the ranking of the average optimization results. In Figure 3, the horizontal axis indicates the systems under test and the vertical axis indicates the average stubbing complexity of the CITO generated by each algorithm.
The stubbing complexity is affected by many factors, such as the number of classes, the dependency distribution, the coupling distribution, etc. Some typical influencing factors on performance result are analyzed as follows.
(1)
Dependencies Distribution Factor Analysis
The relationship between the optimization results and the number of dependencies is analyzed as follows:
Systems with few dependencies
For the Elevator and Daisy with few class dependencies, the difference of optimization results among various algorithms is not obvious.
Systems with mid-sized dependencies
Systems with mid-sized dependencies between 61 and 83 include SPM, ATM, ANT, DEOS and Email.
For SPM with 72 dependencies, the algorithms with better optimization results in order are moth flame algorithm, salp swarm algorithm, grey wolf optimization algorithm and particle swarm optimization algorithm.
For ATM with 67 dependencies, the algorithms with better optimization results are moth flame algorithm, salp swarm algorithm, cuckoo search algorithm and grey wolf optimization algorithm in order.
For ANT with 83 dependencies, the algorithms with better optimization results are moth flame algorithm, salp swarm algorithm, sine cosine algorithm and grey wolf optimization algorithm, respectively.
For DEOS with 73 dependencies, the algorithms with better optimization results are moth flame algorithm, salp swarm algorithm, grey wolf optimization algorithm and cuckoo search algorithm in order.
The algorithms with better optimization results are moth flame algorithm, cuckoo search algorithm, genetic algorithm, and sine cosine algorithm in order for Email with 61 dependencies.
From the perspective of ranking results, it can be seen that moth flame algorithm and salp swarm algorithm rank first and second in SPM, ATM, ANT and DEOS, respectively. Grey wolf optimization algorithm appears four times in these five systems, cuckoo search algorithm three times and sine cosine algorithm two times. These data fully illustrate the effectiveness of moth flame algorithm, salp swarm algorithm, grey wolf optimization algorithm and cuckoo search algorithm in the software with medium number of class dependencies.
Systems with large-sized dependencies
For BCEL, DNS and Notepad with large-sized class dependencies, moth flame algorithm continues to rank high in DNS and Notepad. However, it shows obvious stagnation and obtains the worst result in BCEL. Grey wolf optimization algorithm is the best algorithm with the highest precision of optimization results for BCEL. Additionally, it is the better algorithm with the higher precision of optimization results in Notepad. Additionally, it performs well in DNS system.
(2)
Coupling Distribution Factor Analysis
The relationship between the optimization results and the coupling distribution is analyzed as follows.
Systems with relatively low stubbing complexity include Daisy, Email and Notepad. The reason behind is that the sum of method coupling and attribute coupling of these systems is low. It is worth noting that although Notepad contains the most classes, the stubbing complexity is small because of its max value 37 of method coupling and lots of simple attribute and method coupling. BCEL contains 45 classes with 823 coupling which reflects the high coupling of classes, hence its stubbing complexity is also the highest. While 61 classes and 276 dependencies with total 1094 attribute and method coupling in DNS increases the difficulty of test stub construction, the average stubbing complexity is high. The higher coupling degrees in a system, the higher the stubbing complexity.
Among all optimization results for these ten systems, the stubbing complexity of class integration test orders generated by bat algorithm and firefly algorithm is high. Most notably, the standard deviation of bat algorithm is the largest, which indicates the unstable iterative optimization process. The fact that individuals in bat algorithm lack the ability to mutate reduces the population diversity and makes the search process easy to fall into stagnation.
(3)
Wilcoxon Analysis
Taking the experimental results of 20 times of independent running with 200 maximum iteration each time as training samples, we conduct the statistical tests for performance comparison. Due to the small sample size, the stats.shapiro() method in python was used to perform the Shapiro–Wilk normality test on the sample data. The normality test result shows that the sample data does not meet the normality condition, thus we can apply the non-parametric Wilcoxon test on the average stubbing complexity value between any two algorithms. At a significance level of 0.05, the null hypothesis (H0) states that the two algorithms at the row and column have equivalent performance and the alternative hypothesis (H1) states that the two algorithms have significant performance. If the p-value < 0.05, then H0 cannot be valid.
The detailed results of Wilcoxon signed rank test with a p-value threshold of 0.05 are reported in Table 5. Columns and rows represent different meta heuristic algorithms to generate integration test orders. Each cell contains the p-value obtained between the two algorithms at the row and column of this cell. While the values in last column indicate the number of cases where p-value < 0.05. In those cases, significant p-values denote that the algorithms identified by their associated rows are significantly better than the other algorithms being compared. From Table 5, we can observe that grey wolf optimization algorithm is significantly better than 6 algorithms, salp swarm algorithm is significantly better than 5 algorithms, whereas cuckoo search algorithm and moth flame algorithm are significantly better than 4 algorithms. Therefore, we conclude that grey wolf optimization algorithm, salp swarm algorithm, moth flame optimization algorithm and cuckoo search algorithm are the four algorithms achieving better optimization results for the CITO problem of all these ten systems under test.
Combined with the above analysis, moth flame algorithm, salp swarm algorithm, grey wolf optimization algorithm and cuckoo search algorithm algorithms can obtain high-precision solutions for most systems under test. Among them, moth flame algorithm and salp swarm algorithm show good optimization performance for systems with small search space, low dependence, and low complexity. However, they are prone to large optimization errors and unstable performance with the expansion of search space and complex improvement of classes coupling. The optimization performance of grey wolf optimization algorithm and cuckoo search algorithm is exciting for SPM, ATM, ANT, DEOS and Email. With the increment of classes and dependencies, grey wolf optimization algorithm performs more and more prominently. In general, firefly algorithm and bat algorithm have poor optimization performance for the CITO problem and their iterative optimization process is unstable.

4.4.2. Attribute Complexity and Method Complexity

The CITO optimization problem is a multi objective problem with two objectives: attribute complexity and method complexity. According to multi objective researches [15], the linear weights combination approach could not ensure find Pareto front (formed by non-dominated solutions) points of interest. Furthermore, the aggregation fitness function we used is in fact a multiple cost function. Thus, it is impossible to obtain the detailed optimization results of the two single objectives from the normalized weighted average fitness value.
How the two factors, attribute complexity and method complexity, influence the stubbing complexity need to be discussed. In this section, we focus on the attribute complexity A (i, j) and method complexity M(i, j) of test orders generated to find out which algorithms perform better in attribute coupling guided systems and which algorithms perform better in method coupling guided systems.
Observing the coupling distribution information described in Table 2, the systems under test are deemed to be of varying coupling. Some systems have more method coupling while some have more attribute coupling. In order to further analyze the influence of the two factors on stubbing complexity, the range of attribute complexity and method complexity for a given class integration test order are collected and discussed.
The detailed attribute complexity and method complexity for each system are summarized in Table 6 and Table 7, where columns 2–11 are the attribute complexity or method complexity of class integration test orders generated by genetic algorithm, particle swarm optimization algorithm, cuckoo search algorithm, firefly algorithm, bat algorithm, grey wolf optimization algorithm, moth flame algorithm, salp swarm algorithm, sine cosine algorithm and Harris hawk optimization algorithm. Each cell contains the complexity intervals as the optimization results for each system are not consistent across the repeated executions of each algorithm.
Overall, the optimization results of attribute complexity and method complexity are consistent with the coupling distribution information in Table 2. Generally, for systems with more attribute coupling, the attribute complexity value and its interval are large. While for systems with more method coupling, the method complexity value and its interval are large. From the two types of coupling, the characteristics of optimization process for systems with more attribute coupling and more method coupling are analyzed, respectively.
(1)
Attribute Coupling Factor Analysis
According to the coupling distribution information in Table 2, the attribute and method coupling of SPM are 462 and 135, respectively, ATM are 283 and 84, respectively, ANT are 585 and 177, respectively, and DNS are 766 and 328, respectively. The number of attributes coupling in these systems far exceeds the number of methods coupling, thus the optimization process of each algorithm is guided mainly by attribute coupling.
Based on the analysis result of stubbing complexity in Section 4.4.1, the first four algorithms are grey wolf optimization algorithm, salp swarm algorithm, cuckoo search algorithm and moth flame algorithm. As for SPM, ATM, ANT, DNS, moth flame algorithm and salp swarm algorithm perform best in these four systems, grey wolf optimization algorithm appears four times in different order, cuckoo search algorithm, particle swarm optimization algorithm, sine cosine algorithm and genetic algorithm appear once, respectively. Additionally, the method complexity intervals of CITO generated by all algorithms for these systems are relatively small. The attribute complexity intervals of moth flame algorithm, salp swarm algorithm and grey wolf optimization algorithm are narrow, while the attribute complexity intervals of salp swarm algorithm in SPM and ANT are wide, indicating the unstable optimization process.
(2)
Method Coupling Factor Analysis
Similarly, the attribute and method coupling of Elevator are 21 and 158, respectively, Daisy are 34 and 135, respectively, DEOS are 26 and 223, respectively, and Email are 72 and 222, respectively. The method coupling of these systems are much greater than the attribute coupling, thus the optimization process is greatly affected by method coupling.
For Elevator, Daisy, DEOS and Email, the first four algorithms with excellent performance can be counted. Moth flame algorithm, grey wolf optimization algorithm and cuckoo search algorithm algorithms appear four times, salp swarm algorithm and sine cosine algorithm appear twice, and genetic algorithm appears once. The ranking of grey wolf optimization algorithm is higher than that of optimization process guided by attribute coupling, showing its good optimization ability. As seen from Table 6, there is little difference among attribute complexity intervals of CITO generated by all algorithms. Further, the method complexity intervals of moth flame algorithm, grey wolf optimization algorithm, cuckoo search algorithm and salp swarm algorithm for these four systems are narrow, as shown in Table 7. Meanwhile, the method complexity intervals of sine cosine algorithm for Daisy, DEOS and Email are wide. Combined with the standard deviation of sine cosine algorithm’s fitness function value in Table 4, we can see the instability of its optimization performance.
To sum up, the optimization process guided by the coupling-based fitness function can generate encouraging class integration test orders. When using OCplx with WA = WM = 0.5 to measure the stub cost, the designed fitness function can give a proper balance between attribute complexity and method complexity.
For systems with great attribute coupling, moth flame algorithm, salp swarm algorithm and grey wolf optimization algorithm are recommended. However, the intervals of salp swarm algorithm are wide because of SSA’s unstable optimization process.
For systems with great method coupling, moth flame algorithm, grey wolf optimization algorithm, cuckoo search algorithm and sine cosine algorithm are recommended, but the optimization result of sine cosine algorithm is unstable.

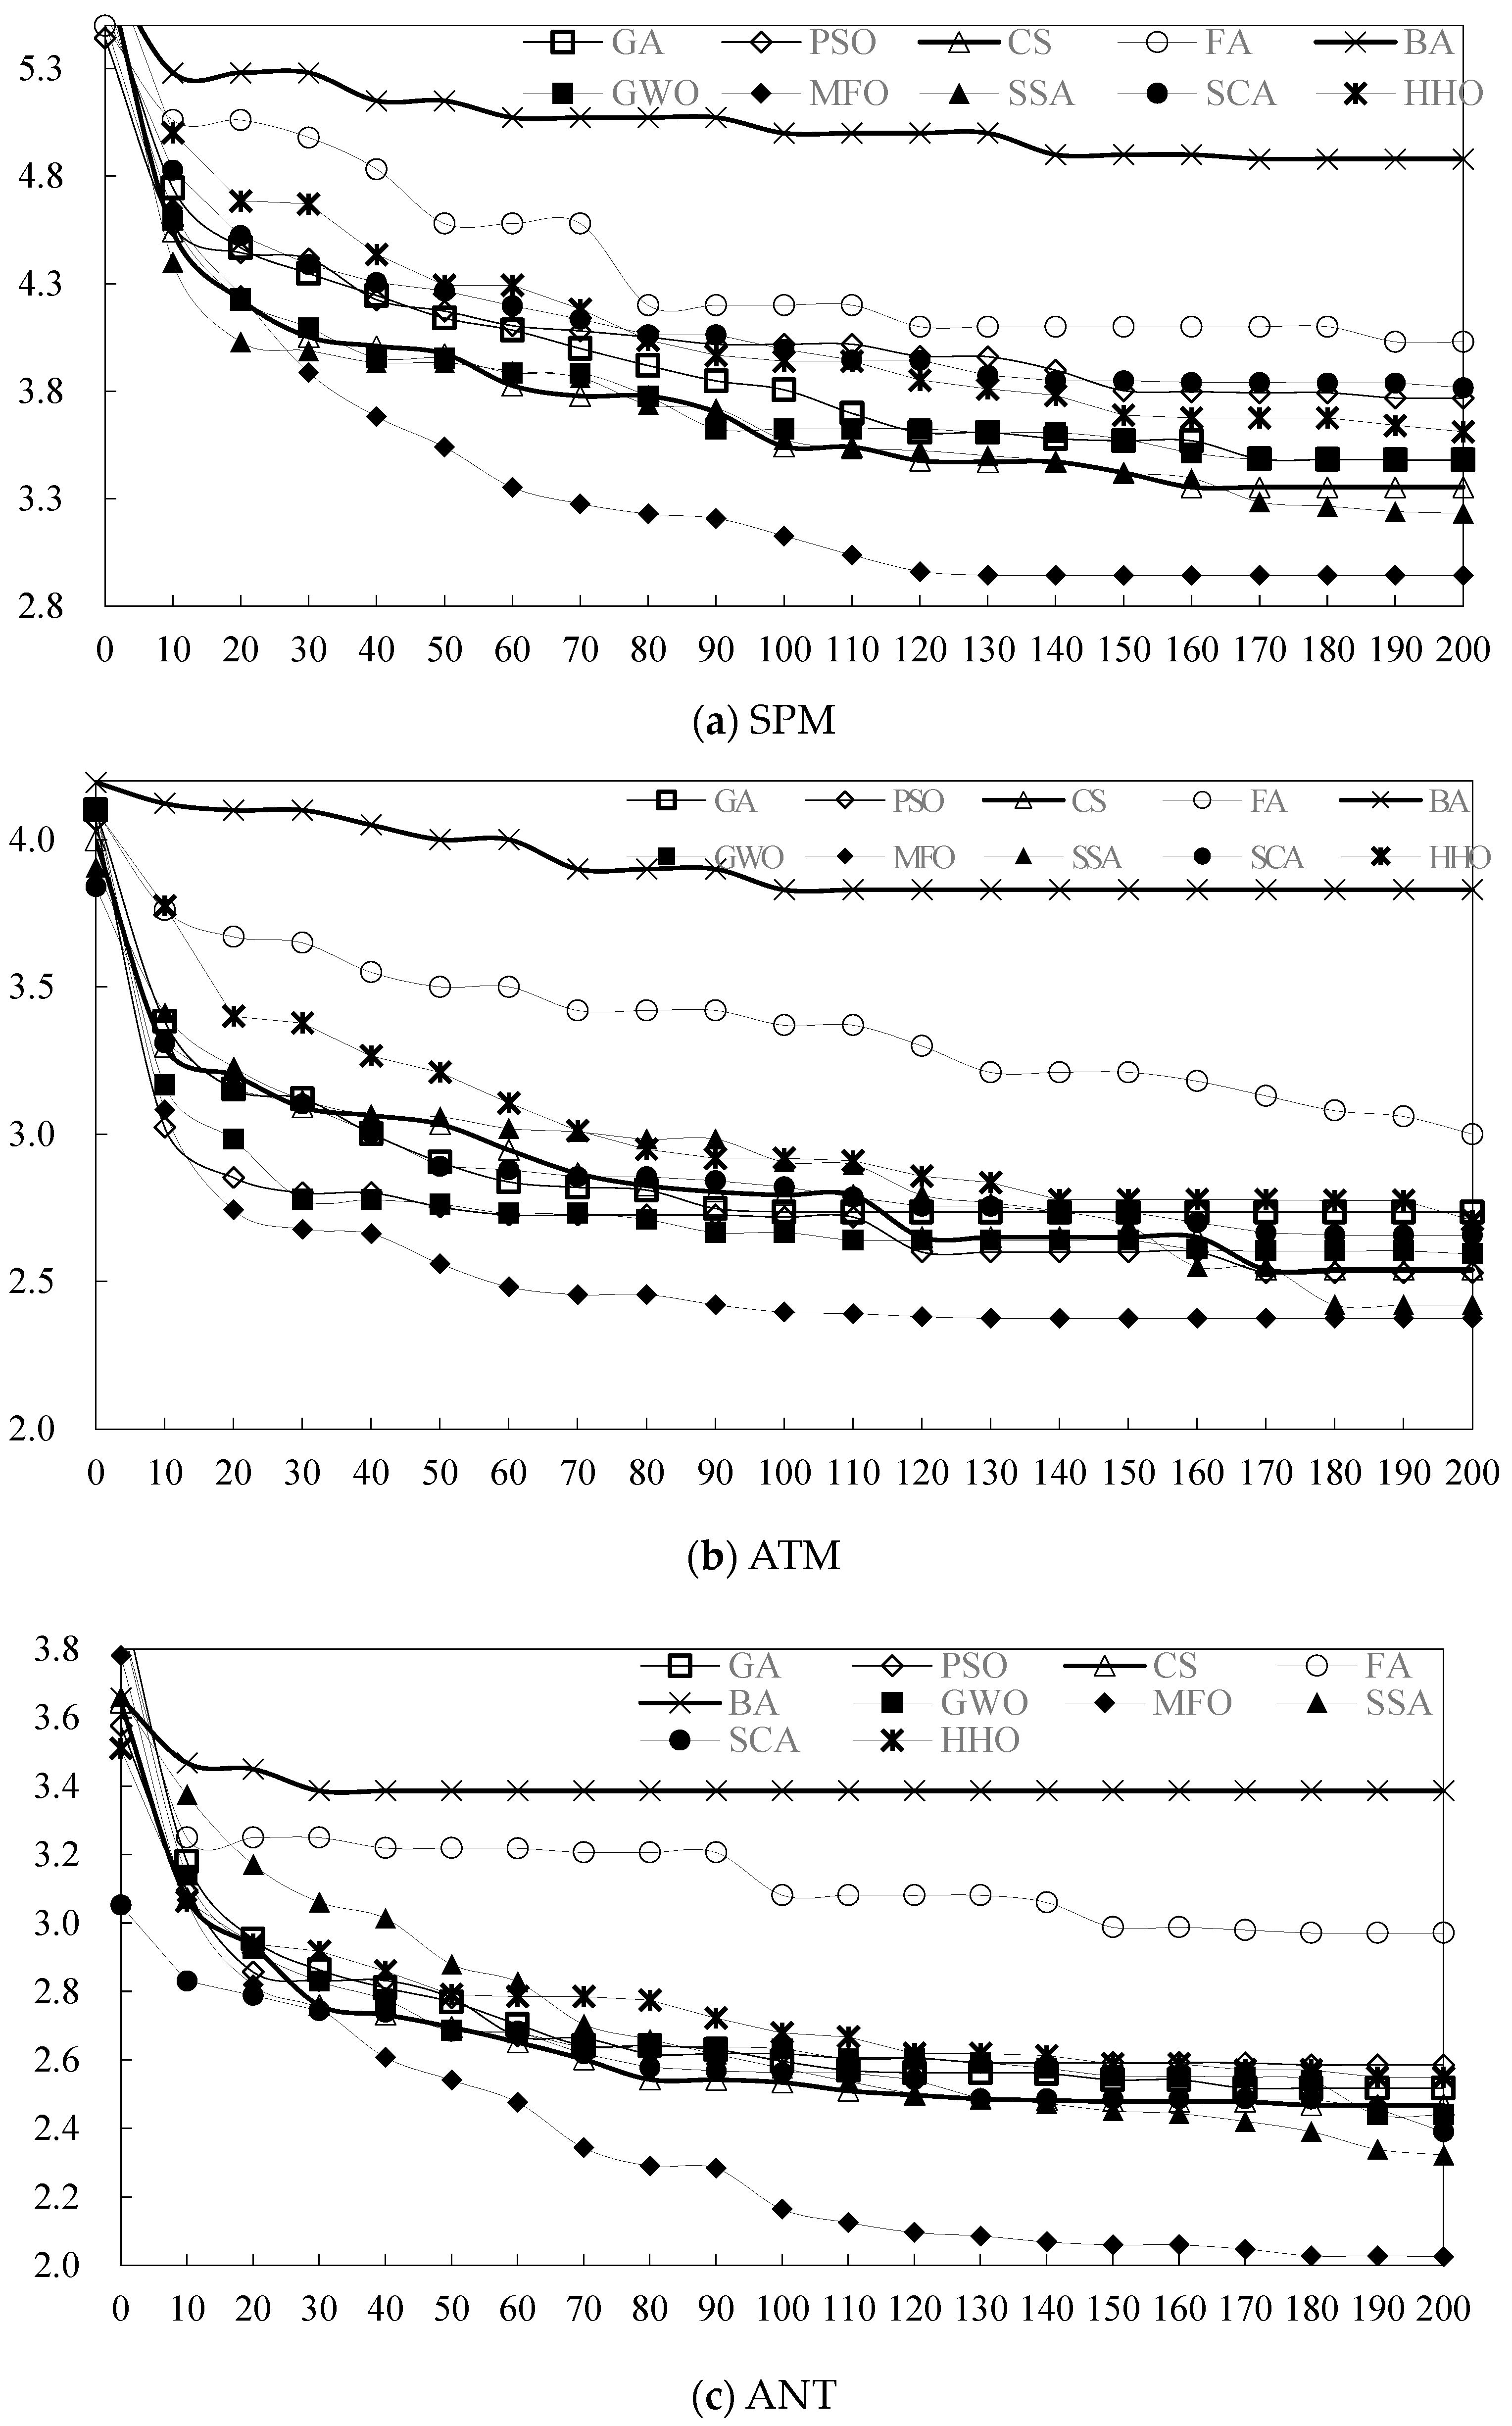
4.5. Efficiency Analysis

4.5.1. Convergence Behavior Analysis

Generally, more dependency cycles indicate high coupling among classes. In the context of search-based approaches, optimization involves searching for test orders that minimizes the coupling-based fitness function. Due to the highly non-linear nature of this fitness function, the search space exhibits a curvy, noisy landscape with numerous local minima. In this section, we focus on the ability of these algorithms to avoid getting stuck and discuss how dependency cycles influence the optimization performance.
In order to observe the convergence behavior to devise test orders for systems in the presence of dependency cycles, we select the systems with dependency cycles, SPM, ATM, ANT, BCEL and DNS. We collect their stubbing complexity values obtained at the 10th, 20th, …. until 200th iteration, respectively. Then, the average value is calculated across 20 executions. The search history and convergence curve of the optimal results obtained by each algorithm are illustrated in Figure 4. The horizontal axis indicates the number of iterations, and the vertical axis indicates the average value of stubbing complexity.
It can be observed that the stubbing complexity generally decreases with the increasing number of iterations, reflecting the effectiveness of the search-based approach for the CITO problem. Generally speaking, the convergence speed of various algorithm for different systems is affected by many factors. Under the same population size and running environment, the convergence behavior is analyzed from following two aspects: individual encoding and optimization performance.
From the perspective of individual encoding strategy, this paper encodes any class integration test order into one individual in one-dimensional space through Algorithm 1, and maps it into CITO through Algorithm 2. The method of using one-dimensional spatial locations to represent individuals reduces the spatial dimension, simplifies the location update process, and reduces the computational complexity. It can be seen that most meta algorithms can gradually improve the quality of solutions and converge faster. However, we also find that this encoding strategy has some limitations. Generally, the search space for the CITO problem increases with the number of classes, so the position coordinate of an individual may be very large. Consequently, it is easy to reduce the precision of the obtained class integration test order because of the large search space.
Illustrated by the optimization trend of these ten algorithms, the convergence speed of bat algorithm and firefly algorithm is comparatively slow, and their convergence curve is relatively flat as a whole. The precision of the optimal solution generated by the firefly algorithm is higher than that of bat algorithm and significantly lower than that of other eight algorithms. The reason behind the slow convergence of the bat algorithm is that the speed term with constant coefficient reduces individual flexibility and population diversity, which make the algorithm converge rapidly in early stage but slow in later stage. The pairwise learning mechanism of firefly algorithm causes oscillation of optimization results, especially in the larger search space caused by more classes.
The top 4 fastest algorithms with excellent optimization results for these five systems are shown in Table 8. The detailed information is described as follows.
SPM contains 19 classes, 72 dependencies and 1178 cycles. There are abrupt changes in the movement of the search individuals over the first 40 iterations of the firefly algorithm and first the 80 iterations of bat algorithm. The precision of optima solutions obtained by both firefly algorithm and bat algorithm is slightly improved in the later stage. The other eight intelligent algorithms can produce promising stubbing complexity within about 120 iterations, among which moth flame algorithm has the fastest convergence speed with best accuracy. At the early stage, the precision of the optima solutions generated by the moth flame algorithm is much higher than that of other algorithms and precision of optima solutions of the salp swarm algorithm, grey wolf optimization algorithm and cuckoo search algorithm is higher than that of other remaining algorithms. When the same precision of optima solutions is required, the moth flame algorithm needs the least iterations, while the salp swarm algorithm, grey wolf optimization algorithm and cuckoo search algorithm need less iterations than other algorithms. Among all ten algorithms, bat algorithm needs the most iterations and firefly algorithm needs more iterations. The convergence speed of the moth flame algorithm, grey wolf optimization algorithm, cuckoo search algorithm and salp swarm algorithm is consistent with the optimization results in Table 4.
ATM contains 21 classes, 67 dependencies and 30 cycles. Most algorithms can find promising solutions in the first 80 iterations. Among them, the convergence speed of the moth flame algorithm is the fastest, the Harris hawk optimization algorithm converges more quickly than the firefly algorithm and the bat algorithm, but more slowly than other intelligent algorithms. At the early stage, the three algorithms with the highest precision under the same iterations are the moth flame algorithm, grey wolf optimization algorithm and particle swarm optimization algorithm. When the same precision of optima solutions is required, the iterations required by the moth flame algorithm, grey wolf optimization algorithm and particle swarm optimization algorithm are significantly less those required by other algorithms, while the firefly algorithm and bat algorithm need the most iterations. Additionally, the convergence speed of moth flame optimization algorithm, grey wolf optimization algorithm and particle swarm optimization algorithm is consistent with the optimization results in Table 4. In particular, salp swarm algorithm shows the characteristics of slow convergence speed at early stage and fast convergence speed at later stage.
ANT contains 25 classes, 83 dependencies and 654 cycles. Most algorithms can find high-precision solutions in the first 110 iterations. At the early stage of optimization process, the convergence speed of sine cosine algorithm and grey wolf optimization algorithm is not as fast as moth flame algorithm. Additionally, the convergence speed and precision of solutions obtained by the salp swarm algorithm are higher than firefly algorithm and bat algorithm, lower than other algorithms. At the same iterations, the algorithm with the highest optimization accuracy is the moth flame algorithm. When the same precision is needed, the iterations required by moth flame algorithm is significantly less than that of other algorithms, but the firefly algorithm and bat algorithm need the most iterations. Additionally, the convergence behavior of moth flame algorithm, sine cosine algorithm and grey wolf optimization algorithm is consistent with the optimization results in Table 4. Although the final optimization results of the salp swarm algorithm rank second, the convergence speed of the salp swarm algorithm is slow at the early stage and becomes fast at later optimization stage.
BCEL contains 45 classes, 294 dependencies and 416,091 cycles, which improves the complexity of the system. As can be seen from the convergence curve, the optimization ability of most algorithms in the first 100 iterations is low. Most algorithms can find stable solutions at 190 iterations. The reason behind this behavior is that the dependencies in BCEL are complex and the search space is large, which makes individuals easy to oscillate in the search space. Among all these algorithms, the wolf optimization algorithm, genetic algorithm, salp swarm algorithm and sine cosine algorithm show exciting convergence speed between 100 and 170 iterations, consistent with the optimization results in Table 4.
DNS contains 61 classes, 276 dependencies and 16 cycles. Although the number of classes in DNS is the most among these five systems, the dependencies among classes are weak. It can be seen that most algorithms can find stable solutions at 150 iterations and maintain a good convergence speed at the early stage. Among these ten algorithms, the optimization performance of the moth flame algorithm is outstanding and the convergence speed is the fastest. In the first 110 iterations, the convergence speed of other algorithms is almost the same except the fastest convergence speed of moth flame algorithm and the slow convergence speed of the bat algorithm, firefly algorithm, Harris hawk optimization and sine cosine algorithm. At the later stage of optimization process, the genetic algorithm, salp swarm algorithm and grey wolf optimization algorithm show their excellent search ability, consistent with the optimization results in Table 4.
Based on the above analysis, the convergence speed is affected by the number of classes and dependency cycles. The more the number of classes and cycles are, the more difficult the optimization process is, and the more iterations are required to achieve higher precision of optima solutions. Combing the consistency between convergence speed and optima solutions obtained, algorithms with fast convergence speed can obtain solutions with high accuracy, except for the salp swarm algorithm.
Generally, the salp swarm algorithm shows the characteristics of slow convergence speed at early stage and fast convergence speed at later stage. Based on the analysis of individual update mechanism in the salp swarm algorithm, the leader’s update process is affected by the maximum number of iterations. The greater the maximum number of iterations, the slower the leader searches in the early stage. Compared with SPM, BCEL and DNS, the number of classes in ATM and ANT is small with low coupling; thus, their maximum iteration is relatively high, resulting in low convergence at early stage.

4.5.2. Runtime Analysis

To ensure the fairness of the experimental results, each algorithm run independently in the same environment. The actual average runtime of each iteration of these algorithms for each system is recorded and shown in Table 9 and Figure 5. In Figure 5, the horizontal axis indicates the software system and the vertical axis indicates the actual average runtime of each iteration.
Search-based software testing is the process of automatically generating test data according to a test adequacy criterion using search-based optimization algorithms. The search-based approaches for the CITO problem means that meta heuristic algorithms need to search acceptable class integration test orders with low stubbing complexity among all possible combinations of classes. As we can see from the growth trend of running time, systems with more classes have larger search space which increases the optimization difficulty and requires more time to obtain optima solutions.
Elevator contains 12 classes, with the average runtime of 1593 ms, minimum runtime of 779 ms and maximum runtime of 2759 ms. ATM contains 21 classes, with the average runtime of 4937 ms, minimum runtime of 2268 ms and maximum runtime of 8199 ms. BCEL contains 45 classes, with the average runtime of 19,577 ms, minimum runtime of 10,358 ms and maximum runtime of 36,527 ms. Notepad contains 65 classes, with the average runtime of 41,028 ms minimum runtime of 24,475 ms and maximum runtime of 78,079 ms. It can be seen from the statistical data that the average runtime is directly proportional to the number of classes in the systems. The more classes in system, the more running time is required.
From the perspective of the running time required by the different algorithms, the Harris hawk optimization spends the least runtime for each iteration. The runtime per each iteration of the grey wolf optimization algorithm, moth flame algorithm, particle swarm optimization algorithm, salp swarm algorithm and sine cosine algorithm is roughly the same. Grey wolf optimization algorithm ranked the second least running time for seven systems. Moth flame algorithm ranked the third least runtime for six systems. Therefore, grey wolf optimization algorithm and moth flame algorithm show their obvious time advantages. Additionally, the running time of the cuckoo search algorithm, firefly algorithm, genetic algorithm and bat algorithm is significantly higher than that of other algorithms. The bat algorithm is the algorithm with most runtime per each iteration.

4.5.3. Memory Analysis

Similarly, the memory of each iteration of these algorithms for each system is collected and shown in Table 10 and Figure 6. In Figure 6, the horizontal axis indicates systems under test and the vertical axis indicates the actual average memory of each iteration.
It can be seen from the statistical data that the used memory of generating optimal test orders is rising with the increasing number of classes. That is, more classes in systems require more memory. For systems with almost the same number of classes, the more dependencies there are, the more memory is required.
It also can be seen that for all systems, the memory by the genetic algorithm, particle swarm optimization algorithm and bat algorithm is the least. The average memory of the grey wolf optimization algorithm, moth flame algorithm and cuckoo search algorithm is less than that generated by the genetic algorithm, particle swarm optimization algorithm and bat algorithm. The average memory of the firefly algorithm, sine cosine algorithm, salp swarm algorithm and Harris hawk optimization is small.

4.6. Answering the Research Questions

Based on the above experimental results and analysis of the test stubbing complexity, method complexity, attribute complexity, convergence speed, average runtime and memory consumption, the conclusions to the research questions are as follows:
Answer to question 1: Comparatively speaking, the moth flame optimization algorithm, salp swarm algorithm, grey wolf optimization algorithm, cuckoo search algorithm and sine cosine algorithm can obtain class integration test orders with low test stubbing complexity. Among these promising algorithms, the moth flame optimization algorithm and salp swarm algorithm are unstable especially in large search space.
Answer to question 2: The moth flame optimization algorithm, grey wolf algorithm, cuckoo search algorithm and sine cosine algorithm have faster convergence speed, but salp swarm algorithm shows the characteristics of slow convergence at the early stage and fast convergence at the late stage. In terms of computational resource consumption, the moth flame optimization algorithm and grey wolf optimization algorithm requires less runtime and memory. The cuckoo search algorithm requires more runtime and more memory than the moth flame optimization algorithm and grey wolf optimization algorithm.

5. Threats to Validity

The main threats to the experiment validity can be summarized into internal validity and external validity.
Internal validity refers to whether the evaluation measure is appropriate and whether the experiment data is accurate. At present, the stubbing complexity has been widely used to evaluate the performance of various approaches for the CITO problem. For these ten algorithms, the choice of parameter values is another threat to the internal validity. Due to the lack of mathematical characteristic analysis of the CITO problem, we adopt the standard form of these algorithms except genetic algorithm and particle swarm optimization algorithm. At the same time, the time() methods are inserted into each iteration to ensure the accuracy. Furthermore, the fact that the mapping from individual location to the stubbing complexity is limited by data accuracy, not only affects the objectivity of evaluation results, but also limits the scope of application of the method.
The external validity refers to the generalization of experimental conclusion. Although these intelligent optimization algorithms have their own unique performance in the experiment, there is no guarantee that the conclusion can be extended to other systems. We selected benchmark systems with various complexity to verify the performance, but we need to do more work to further verify the effectiveness, including conducting some experiments on systems of other language such as C#, python. Additionally, more datasets need to be selected from different fields or scales for testing to further validate the findings reported in this study.

6. Conclusions

This paper propose a testing framework of meta heuristic algorithms for CITO problem. It analyzes the optimization performance of ten typical algorithms: genetic algorithm, particle swarm optimization algorithm, cuckoo search algorithm, firefly algorithm, bat algorithm, grey wolf optimization algorithm, moth flame algorithm, salp swarm algorithm, sine cosine algorithm, and Harris hawk optimization algorithm.
In general, the bat algorithm and firefly algorithm exhibit less effectiveness and efficiency in CITO compared to the other eight algorithms. For systems with fewer dependencies, the moth flame algorithm, salp swarm algorithm, grey wolf optimization algorithm, and cuckoo search algorithm show their excellent optimization performance. In cases of systems with significant class coupling, the grey wolf optimization algorithm and cuckoo search algorithm demonstrate impressive optimization performance with high precision of optima solutions. However, the moth flame algorithm and salp swarm algorithm display instability.
The coupling-based fitness function achieves a proper balance between attribute complexity and method complexity. For systems greatly affected by attribute coupling, the moth flame algorithm, salp swarm algorithm and grey wolf optimization algorithm are recommended. For systems greatly affected by method coupling, the moth flame algorithm, grey wolf optimization algorithm, cuckoo search algorithm and sine cosine algorithm algorithms are recommended. Among these algorithms, the sine cosine algorithm and salp swarm algorithm are unstable. Furthermore, most algorithms with high-precision optima solutions exhibit faster convergence speed, need less runtime and memory.
This study is helpful in selecting appropriate meta heuristic algorithms to generate class integration test orders, thereby laying a foundation for further scientific research and practical applications. However, certain challenges remain, including issues of lack of accuracy, space explosion caused by encoding mechanism and dependency cycles quoted from related works. In the future, we will focus on coding mechanism improvement, space reduction, adaptive optimization and so on. In addition, the CITO problem is a constrained multi-objective optimization problem. We intend to conduct further Pareto analyses in multi-objective optimization algorithms such as NSGA-II to identify better solutions in future work.

Author Contributions

Conceptualization, W.Z.; Data curation, W.Z. and L.G.; Formal analysis, W.Z.; Funding acquisition, Q.Z.; Investigation, W.Z.; Methodology, W.Z.; Project administration, Q.Z.; Resources, W.Z. and D.Z.; Software, W.Z. and L.G.; Supervision, Q.Z.; Validation, W.Z. and X.G.; Visualization, W.Z.; Writing—original draft, W.Z.; Writing—review and editing, W.Z. and D.Z. All authors have read and agreed to the published version of the manuscript.

Funding

This search was supported in part by the Science and Technology Planning Program of Henan Province, under grant numbers 172102210592 and 212102210417.

Data Availability Statement

The dataset used to support the findings of this study is available from the corresponding author upon request.

Conflicts of Interest

The authors declare that there are no conflicts of interest regarding the publication of this paper.

References

  1. Khari, M.; Sinha, A.; Verdu, E.; Crespo, R.G. Performance Analysis of Six Meta-heuristic Algorithms over Automated Test Suite Generation for Path Coverage based Optimization. Soft Comput. 2021, 24, 9143–9160. [Google Scholar] [CrossRef]
  2. Le Hanh, V.; Akif, K.; Le Traon, Y.; Jézéque, J.M. Selecting an Efficient OO Integration Testing Strategy: An Experimental comparison of Actual Strategies. In Proceedings of the 15th European Conference on Object-Oriented Programming, Budapest, Hungary, 18–22 June 2001; pp. 381–401. [Google Scholar]
  3. Jiang, S.J.; Zhang, M.; Zhang, Y.M.; Wang, R.; Yu, Q.; Keung, J.W. An Integration Test Order Strategy to Consider Control Coupling. IEEE Trans. Softw. Eng. 2021, 47, 1350–1367. [Google Scholar] [CrossRef]
  4. Kung, D.; Gao, J.; Hsia, P.; Toyoshima, Y.; Chen, C. A Test Strategy for Object Oriented Programs. In Proceedings of the 19th Annual International Computer Software and Applications Conference, Dallas, TX, USA, 9–11 August 1995; pp. 239–244. [Google Scholar]
  5. Zhang, M.; Keung, J.W.; Chen, T.Y.; Xiao, Y. Validating Class Integration Test Order Generation Systems with Metamorphic Testing. Inf. Softw. Technol. 2021, 132, 106507. [Google Scholar] [CrossRef]
  6. da Veiga Cabral, R.; Pozo, A.; Vergilio, S.R. A Pareto Ant Colony Algorithm Applied to the Class Integration and Test Order Problem. In Proceedings of the esting Software & Systems-ifip Wg 61 International Conference, Natal, Brazil, 8–10 November 2010; Springer: Berlin/Heidelberg, Germany, 2010; pp. 16–29. [Google Scholar]
  7. Hussain, K.; Mohd, M.S.; Cheng, S.; Shi, Y. Metaheuristic Research: A Comprehensive Survey. Artifical Intell. Rev. 2019, 52, 2191–2233. [Google Scholar] [CrossRef]
  8. Tai, K.C.; Daniels, F.J. Interclass Test Order for Object-Oriented Software. In Proceedings of the 21st International Computer Software and Applications Conference, Washington, DC, USA, 11–15 August 1997; pp. 602–607. [Google Scholar]
  9. Traon, Y.L.; Jezequel, J.M. Efficient Object-Oriented Integration and Regression Test. IEEE Trans. Reliab. 2000, 49, 12–25. [Google Scholar] [CrossRef]
  10. Briand, L.C.; Labiche, Y.; Wang, Y. An Investigation of Graph-Based Class Integration Test Order Strategies. IEEE Trans. Softw. Eng. 2003, 29, 594–607. [Google Scholar] [CrossRef]
  11. Zhang, M.; Keung, J.; Xiao, Y.; Kabir, M.A.; Feng, S. A Heuristic Approach to Break Cycles for the Class Integration Test Order Generation. In Proceedings of the IEEE 43rd Annual Computer Software and Applications Conference, Milwaukee, WI, USA, 15–19 July 2019; pp. 47–52. [Google Scholar]
  12. Briand, L.; Feng, J.; Labiche, Y. Experiment with Genetic Algorithms and Coupling Measures to Devise Optimal Integration Test Orders; Technical report SCE-02-03; Carleton University: Ottawa, ON, Canada, 2002. [Google Scholar]
  13. Borner, L.; Paech, B. Integration Test Order Strategies to Consider Test Focus and Simulation Effort. In Proceedings of the International Conference on Advances in System Testing and Validation Lifecycle, Porto, Portugal, 20–25 September 2009; pp. 80–85. [Google Scholar]
  14. Vergilio, S.R.; Pozo, A.; Árias, J.C.G.; Cabral, R.d.V.; Nobre, T. Multi-objective Optimization Algorithms Applied to the Class Integration and Test Order Problem. Softw. Tools Technol. Transf. 2012, 14, 461–475. [Google Scholar] [CrossRef]
  15. Mariani, T.; Guizzo, G.; Vergilio, S.R.; Pozo, A.T. Grammatical Evolution for the Multi-Objective Integration and Test Order Problem. In Proceedings of the Genetic and Evolutionary Computation Conference, Denver, CO, USA, 20–24 July 2016; pp. 1069–1076. [Google Scholar]
  16. Czibula, G.; Czibula, G.; Marian, Z. Identifying Class Integration Test Order Using an Improved Genetic Algorithm based Approach. In Proceedings of the International Conference on Software Technologies, Madrid, Spain, 24–26 July 2018; pp. 163–187. [Google Scholar]
  17. Zhang, Y.M.; Jiang, S.J.; Chen, R.Y.; Wang, X.Y.; Zhang, M. Class Integration Testing Order Determination Method based on Particle Swarm Optimization Algorithm. Chin. J. Comput. 2018, 41, 931–945. [Google Scholar]
  18. Zhang, Y.N.; Jiang, S.J.; Zhang, Y.M. Approach for Generating Class Integration Test Sequence based on Dream Particle Swarm Optimization Algorithm. Comput. Sci. 2019, 46, 159–165. [Google Scholar]
  19. Zhang, M.; Keung, J.W.; Xiao, Y.; Kabir, M.A. Evaluating the Effects of Similar Class Combination on Class Integration Test Order Generation. Inf. Softw. Technol. 2021, 129, 106438. [Google Scholar] [CrossRef]
  20. Zhang, B.Q.; Fei, Q.; Wang, Y.C.; Yang, Z. Study on Integration Test Order Generation Algorithm for SOA. Comput. Sci. 2022, 49, 24–29. [Google Scholar] [CrossRef]
  21. Zhang, W.N.; Zhou, Q.L.; Jiao, C.Y.; Xu, T. Hybrid Algorithm of Grey Wolf Optimizer and Arithmetic Optimization Algorithm for Class Integration Test Order Generation. Comput. Sci. 2023, 50, 72–81. [Google Scholar]
  22. Harman, M.; Mcminn, P. A Theoretical and Empirical Study of Search Based Testing: Local, Global and Hybrid Search. IEEE Trans. Softw. Eng. 2010, 36, 226–247. [Google Scholar] [CrossRef]
  23. Harman, M.; Yue, J.; Zhang, Y. Achievements, Open Problems and Challenges for Search Based Software Testing. In Proceedings of the 8th IEEE International Conference on Software Testing, Verification and Validation, Graz, Austria, 13–17 April 2015. [Google Scholar]
  24. Khari, M. An extensive evaluation of search-based software testing: A review. Soft Comput. 2019, 23, 1933–1940. [Google Scholar] [CrossRef]
  25. Zhang, Y.; Jiang, S.; Zhang, M.; Ju, X. Survey of Class Test Order Generation Techniques for Integration Test. Chin. J. Comput. 2018, 41, 670–694. [Google Scholar]
  26. Zhang, M.; Jiang, S.J.; Zhang, Y.M. Research on Multi-objective optimization in Class Integration Test Order. J. Chines Comput. Syst. 2017, 38, 1772–1777. [Google Scholar]
  27. Khari, M.; Kumar, P.; Burgos, D.; Crespo, R.G. Optimized Test Suites for Automated Testing Using Different Optimization Techniques. Soft Comput. 2018, 22, 8341–8352. [Google Scholar] [CrossRef]
  28. Kennedy, J.; Eberhart, R. Particle swarm optimization. In Proceedings of the IEEE International Conference on Neural Networks, Perth, Australia, 27 November–1 December 1995; pp. 1942–1948. [Google Scholar]
  29. Yang, X.S.; Deb, S. Cuckoo Search via Levy Flights. In Proceeding of the World Congress on Nature and Biologically Inspired Computing (NaBIC2009), Coimbatore, India, 9–11 December 2009; pp. 210–214. [Google Scholar]
  30. Yang, X.S. Nature-Inspired Metaheuristic Algorithms; Luniver Press: London, UK, 2010; pp. 81–89. [Google Scholar]
  31. Yang, X.S. A New Metaheuristic Bat-inspired Algorithm. Comput. Knowl. Technol. 2010, 284, 65–74. [Google Scholar]
  32. Mirjalili, S.; Mirjalili, S.M.; Lewis, A. Grey Wolf Optimizer. Adv. Eng. Softw. 2014, 69, 46–61. [Google Scholar] [CrossRef]
  33. Mirjalili, S. Moth-flame Optimization Algorithm: A Novel Nature Inspired Heuristic Paradigm. Knowl.-Based Syst. 2015, 89, 228–249. [Google Scholar] [CrossRef]
  34. Mirjalili, S. SCA: A Sine Cosine Algorithm for Solving Optimization Problems. Knowl.-Based Syst. 2016, 96, 120–133. [Google Scholar] [CrossRef]
  35. Mirjalili, S.; Gandomi, A.H.; Mirjalili, S.Z.; Saremi, S.; Faris, H.; Mirjalili, S.M. Salp Swarm Algorithm: A Bio-Inspired Optimizer for Engineering Design Problems. Adv. Eng. Softw. 2017, 114, 163–191. [Google Scholar] [CrossRef]
  36. Heidari, A.A.; Mirjalili, S.; Faris, H.; Aljarah, I.; Mafarja, M.; Chen, H. Harris hawks optimization: Algorithm and applications. Future Gener. Comput. Syst. 2019, 97, 849–872. [Google Scholar] [CrossRef]
Figure 1. Research methodology.
Electronics 12 03733 g001
Figure 2. The general flow of search-based CITO optimization process.
Electronics 12 03733 g002
Figure 3. Histogram for test stubbing complexity comparison.
Electronics 12 03733 g003
Figure 4. Graph for convergence analysis.
Electronics 12 03733 g004aElectronics 12 03733 g004b
Figure 5. Histogram for average time analysis.
Electronics 12 03733 g005
Figure 6. Histogram for memory analysis.
Electronics 12 03733 g006
Table 1. Detailed information of the ten systems.
SystemClassesUsagesAssociations & AggregationsCompositionsInheritanceDependenciesCycles#LOC
Elevator128316027N/A934
SPM1924341047211781198
ATM2139915467301390
Daisy233123036N/A1148
ANT255416211836544093
DEOS2552156578N/A2215
Email3944512263N/A2276
BCEL4518226446294416,0913033
DNS61211231230276166710
Notepad651228110141N/A2419
Table 2. Coupling summary of the ten systems.
SystemAttribute CouplingMethod CouplingTotal
MaxAverageSumMaxAverageSum
Elevator31.6221256.33158179
SPM217.9746282.41135597
ATM136.0228372.3384367
Daisy113.7834164.22135169
ANT319.14585142.9177762
DEOS42.0426153.28223249
Email223.1372404.18222204
BCEL82.5245441.55369823
DNS104.3576681.923281094
Notepad81.88102371.74181283
Table 3. Parameter settings for various algorithms.
AlgorithmParametersReference
GApm = 0.01, pc = 0.5Briand 2002 [12]
PSOwmax = 0.9, wmin = 0.4, c1 = 2, c2 = 2Zhang 2018 [17]
CSp = 0.02, α = 0.15, λ = 1.5Yang 2009 [29]
FAα = 0.2, β0 = 1, γ = 1Yang 2010 [30]
BAα = 0.9, γ = 0.7, fmin = 0, fmax = 2Yang 2010 [31]
GWOαfirst = 2, αfinal = 0Mirjalili 2014 [32]
MFOb = 1, θ ∈ [−1, 1]Mirjalili 2015 [33]
SCAα = 2, r2 ∈ [0, 2π], r3 ∈ [−2, 2], r4 ∈ [0, 1]Mirjalili 2016 [34]
SSAm = 2, c2, c3 ∈ [0, 1]Mirjalili 2017 [35]
HHOβ = 1.5, E0 ∈ [−1, 1], J ∈ [0, 2]Heidari 2019 [36]
Table 4. Stubbing complexity values of the ten systems.
SystemStats.GAPSOCSFABAGWOMFOSSASCAHHO
Elevatorbest1.761.791.761.851.971.761.761.761.761.94
worst1.851.951.892.272.371.911.821.881.933.91
mean1.811.861.842.032.201.841.791.791.853.52
Stdev0.020.050.040.090.130.040.020.030.040.54
rank37489512610
SPMbest3.053.402.993.354.053.042.452.553.582.99
worst3.964.163.804.996.373.803.543.774.194.08
mean3.513.753.374.034.883.452.973.193.823.61
Stdev0.280.220.270.460.620.210.230.320.190.30
rank57391041286
ATMbest2.322.172.292.263.022.292.172.172.322.27
worst3.182.822.743.524.902.772.552.942.942.98
mean2.742.532.543.003.832.502.372.422.652.69
Stdev0.250.160.120.170.440.120.090.160.180.21
rank84591031267
Daisybest0.320.320.350.430.550.220.190.480.260.39
worst0.590.740.611.681.220.513.860.770.670.67
mean0.460.540.480.650.940.430.720.610.500.54
Stdev0.090.130.070.280.180.091.000.090.130.08
rank26381019745
ANTbest2.122.162.142.132.691.861.751.932.172.31
worst2.832.792.652.924.362.612.342.682.572.82
mean2.512.592.452.993.412.442.032.302.392.55
Stdev0.210.150.140.210.480.190.160.220.120.15
rank68591041237
DEOSbest3.423.283.203.964.183.242.843.202.923.33
worst4.064.184.024.845.393.853.733.684.054.46
mean3.743.813.634.324.943.573.183.473.713.86
Stdev0.170.280.240.620.360.200.290.150.330.28
rank67491031258
Emailbest0.700.660.651.101.050.730.560.750.700.62
worst0.860.890.811.851.430.910.801.100.910.92
mean0.780.810.731.331.200.820.690.900.780.81
Stdev0.050.060.050.200.110.060.070.100.060.07
rank35210971846
BCELbest10.1910.9010.4511.0011.9810.3511.9810.0010.7110.33
worst11.6511.9811.9513.6311.9811.4711.9811.8511.5911.98
mean10.8911.6211.2911.7511.9810.7911.9810.8311.1411.16
Stdev0.560.510.400.600.000.440.000.630.260.47
rank37689110245
DNSbest6.317.347.206.538.636.976.306.687.346.95
worst9.459.639.1110.2712.808.958.378.7110.059.65
mean7.988.638.149.3110.398.067.337.708.948.64
Stdev0.920.730.700.861.570.690.810.670.760.75
rank36591041287
Notepadbest1.751.831.771.761.901.531.651.431.801.77
worst1.932.171.962.413.091.971.852.211.942.17
mean1.841.981.852.072.501.771.731.921.851.90
Stdev0.050.100.070.240.300.130.060.200.040.15
rank38491021756
Table 5. Wilcoxon analysis results.
AlgorithmGAPSOCSFABAGWOMFOSSASCAHHOCases Where p-Value
< 0.05
GA-0.0530.7220.0010.0010.9580.9200.9470.2390.0423
PSO0.958-0.9990.0010.0010.9990.9760.9930.8130.5282
CS0.3130.002-0.0010.0010.8580.9200.9470.0960.0104
FA1.0001.0001.000-0.0021.0000.9971.0001.0000.9681
BA1.0001.0001.0000.999-1.0000.9971.0001.0000.9760
GWO0.0420.0020.1710.0010.001-0.9030.7840.0100.0026
MFO0.0970.0320.0970.0050.0050.116-0.0960.0650.0424
SSA0.0650.0100.0650.0010.0010.2160.922-0.0420.0145
SCA0.7970.2160.9220.0010.0010.9930.9470.968-0.1612
HHO0.9680.5280.9930.0420.0320.9990.9680.9900.862-2
Table 6. Attribute complexity values of the ten systems.
SystemStats.GAPSOCSFABAGWOMFOSSASCAHHO
Elevatormin9899999999
max99910119991019
mean9.008.909.009.3010.409.009.009.009.4015.70
Stdev0.000.300.000.570.660.000.000.000.403.03
rank2123522246
SPMmin52584960685445475263
max718972103132766374111128
mean61.6068.1861.2083.73100.2763.1353.6056.4786.3695.45
Stdev5.389.217.8912.0517.896.634.678.2718.6419.78
rank46371051289
ATMmin31303135443130304031
max5138395274383435138149
mean36.3033.4033.4543.7055.0033.1031.1531.3581.9170.27
Stdev5.522.332.334.267.481.801.181.2737.0343.29
rank64578312109
Daisymin0001000000
max3112142122328
mean0.360.750.509.911.270.400.180.918.458.82
Stdev0.920.460.535.681.270.700.410.707.5910.33
rank25410731689
ANTmin45484763554234377050
max66767495111695582105124
mean57.5364.456.9373.6085.0757.7342.2053.7389.0091.36
Stdev6.207.867.678.6215.617.935.2110.798.8921.10
rank46378512910
DEOSmin6671486681310
max1212133115119102932
mean8.88.79.121.112.98.97.48.920.519.8
Stdev1.871.892.086.912.081.731.170.885.217.91
rank3259641487
Emailmin576879751111
max13131034211311165744
mean9.649.338.5724.7314.27118.331128.1830.64
Stdev2.2121.628.254.471.411.513.514.139.48
rank4327651589
BCELmin6678537293657844116128
max1021001111551409893106281347
mean83.7290.3986.37107.73111.6478.5481.9167151.36168.72
Stdev8.826.0517.0425.2011.745.7313.711921.5222.73
rank46578231910
DNSmin696873113122767069121154
max1071161121541701009999502318
mean89.1392.593.2131.63140.7588.888381218.36203.27
Stdev11.6715.3714.6213.1117.8810.25127.331.7149.58
rank45678321109
Notepadmin5651495561013
max91276620116132664
mean5.918.26.235.6412.737.95.369.417.831.71
Stdev1.142.350.8422.453.522.510.512.55.1822.30
rank25310741689
Table 7. Method complexity values of the ten systems.
SystemStats.GAPSOCSFABAGWOMFOSSASCAHHO
Elevatormin17181720251717171727
max233325303424222232125
mean20.3022.3021.5027.3428.702118.9018.6024.7076.70
Stdev1.874.012.813.753.282.202.122.064.8226.8
rank36589421710
SPMmin22222024302118192630
max31323137483127284556
mean27.3328.0925.2628.9337.9325.6022.0624.1335.2740.73
Stdev2.742.742.893.454.633.023.082.515.297.32
rank56379412810
ATMmin11111113131211111413
max20191523271514174536
Stdev14.0513.7513.5017.6519.413.2012.7013.2524.8220.09
mean2.091.891.152.663.931.010.751.339.268.85
rank65478213109
Daisymin10109131776134824
max18211981341617228378
mean13.8215.5145427.0912.912.2017.4661.3647.55
Stdev2.484.002.7518.125.483.143.282.6613.0316.40
rank35497216108
ANTmin32303334363029304740
max47424251704236407473
mean38.2737.0736.6742.6048.5336.4732.5334.5358.2058.09
Stdev3.943.412.793.788.942.882.472.889.0712.22
rank65478312109
DEOSmin42484366554039377364
max60616712684545352109118
mean52.85450.892.970.248.945.546.990.289.9
Stdev6.274.747.3118.758.554.184.934.6814.7115.76
rank56410731298
Emailmin22242238342620227162
max34393414557343346131129
mean3032.1128.57105.6446.3629.3326.33496.64102.36
Stdev3.614.484.1630.969.713.084.326.820.8520.28
rank45210731689
BCELmin87929610210986918910499
max109109109121123106109109198241
mean91.55103.28101.10113.36117.4590.63105.82100.72150.64160.18
Stdev4.855.574.0110.994.635.7422.326.8926.7138.37
rank25478163910
DNSmin50595380755247549288
max778474100114856779163152
mean64.2568.3861.687.7595.1362.65966.5116.64127.91
Stdev8.927.397.706.4813.8210.77.549.420.9021.10
rank46278315910
Notepadmin69607367615356568063
max80827811994737780100100
mean76.1074.37692.7382.2764.170.36689.290.14
Stdev3.598.081.8717.2410.687.427.489.47.5513
rank64510713289
Table 8. The top 4 fastest algorithms with excellent optimization results.
SystemClassesDependenciesCyclesTop 4 Fastest Algorithms with Excellent Optimization Results
SPM19721178MFO (moth flame optimization algorithm)
GWO (grey wolf algorithm)
CS (cuckoo search algorithm)
SSA (salp swarm algorithm)
ATM216730MFO (moth flame optimization algorithm)
GWO (grey wolf optimization algorithm)
PSO (particle swarm optimization algorithm)
SSA (salp swarm algorithm) with slow convergence speed at early stage and fast convergence speed at later stage
ANT2583654MFO (moth flame optimization algorithm)
SCA (sine cosine algorithm)
GWO (grey wolf optimization algorithm)
SSA (salp swarm algorithm) with slow convergence speed at early stage and fast convergence speed at later stage.
BCEL45294416,091GWO (grey wolf optimization algorithm)
GA (genetic algorithm)
SSA (salp swarm algorithm)
SCA (sine cosine algorithm)
DNS6127616MFO (moth flame optimization algorithm)
GA (genetic algorithm)
SSA (salp swarm algorithm)
GWO (grey wolf algorithm)
Table 9. Average runtime (ms).
SystemGAPSOCSFABAGWOMFOSSASCAHHOAverage
Elevator257810042067265227591003101099310857791593
SPM59192489481663358159239424322428266818263947
ATM10,5032948572376538199291829053027322522684937
Daisy75403566696280279320347635143546387726755250
ANT842641898011942211,874406941514157456031496201
DEOS832342258037967811,720405441564158460231086206
Email20,216997519,49522,87628,365970410,061998510,958760814,924
BCEL26,85513,23225,82129,35036,52713,15713,14013,18114,15010,35819,577
DNS81,97324,30647,80060,89272,79123,69824,19124,96426,14117,21240,397
Notepad74,44527,41352,76061,34978,07926,83127,33428,08429,50924,47543,028
Table 10. Average memory (KB).
SystemGAPSOCSFABAGWOMFOSSASCAHHOAverage
Elevator216256236332208264336320332248275
SPM252312160416244166332360380368299
ATM148132200364160184348332264388252
Daisy196208184360192302328332320456288
ANT208160580592209268328332328496350
DEOS288140220488384360324520320360340
Email176248532640236392332692368436405
BCEL612616656604644556544572768476605
DNS96887695610841324115210881392129612481138
Notepad844524844628372832688856840840727
Disclaimer/Publisher’s Note: The statements, opinions and data contained in all publications are solely those of the individual author(s) and contributor(s) and not of MDPI and/or the editor(s). MDPI and/or the editor(s) disclaim responsibility for any injury to people or property resulting from any ideas, methods, instructions or products referred to in the content.

