Article

Investigation of Trap Density Effect in Gate-All-Around Field Effect Transistors Using the Finite Element Method

1
Laboratory of Electronics and Microelectronics, Faculty of Science of Monastir, University of Monastir, Monastir 5019, Tunisia
2
Department of Physics, College of Science, Princess Nourah bint Abdulrahman University, P.O. Box 84428, Riyadh 11671, Saudi Arabia
3
Department of Physics, College of Science at Zulfi, Majmaah University, P.O. Box 1712, Zulfi 11932, Saudi Arabia
*
Author to whom correspondence should be addressed.
Electronics 2023, 12(17), 3673; https://doi.org/10.3390/electronics12173673
Submission received: 12 July 2023 / Revised: 23 August 2023 / Accepted: 29 August 2023 / Published: 31 August 2023

Abstract

:
Trap density refers to the density of electronic trap states within dielectric materials that can capture and release charge carriers (electrons or holes) in a semiconductor channel, affecting the transistor’s performance. This study aims to investigate the influence of trap density on the electrothermal behavior of nanowire gate-all-around GAAFET devices. The numerical solution of Poisson’s equations and continuity equations, coupled with the heat conduction model, has been used to predict the temperature inside the GAAFET device. The finite element method has been used to discretize the semiconductor equations. Investigations have been carried out on a number of physical and geometric parameters, such as oxide thickness, nanowire radius, and gate length. Their effects on output characteristics and device temperature have been discussed. A thinner oxide thickness, lower device radius, and longer channel length led to a higher current flow. Results also reveal that high trap densities can have significant impacts on the degradation of electronic devices, particularly in the context of semiconductor devices like transistors.

1. Introduction

In search of higher device performance and lower power consumption, new structures such as FinFETs [1] and Pi-gate [2], tri-gate [3], Omega-gated [4], and gate-all-around (GAA) MOSFETs [5] have been reported [6,7]. GAAFET structures are seen as the near-term future of integrated circuits as they provide highly electrostatic gate control [8]. GAAFET transistors have a gate-all-around structure, where the gate surrounds the semiconductor channel. This structure demonstrates an enhancement in gate control that reduces SCEs, with lower leakage currents and operational voltages [9,10,11]. This results in improved performance and reduced power consumption. A comparative electrothermal study of GAAFETs and FinFETs has been proposed by Zhao et al. [12]. A higher Ion current and a lower Ioff current are obtained for the GAAFET structure at Vd = 0.7 V and Vd = 0.05 V. The electric properties, including transfer characteristics, output characteristics, gain, mobility roll-off, subthreshold slope, and drain-induced barrier lowering (DIBL), in GAAFET structures have been analyzed by Mohan et al. [13]. The selection of adequate gate material and architecture has been proposed by several authors to improve the device’s performance [14,15,16,17,18]. The various technology nodes and their limitations have been presented by Narula et al. [19] (Table 1). A comparative study by Kumar et al. [20] reveals that the GS-GAA structure shows the most improved results. However, the thermal resistance of GAAFETs [21] compared with planar transistors [22,23] and FinFETs [24,25,26,27] shows that GAAFETs have significantly higher thermal resistance (Figure 1). This parameter has a direct influence on the device performance and overall functionality.
This effect is mainly due to the intensive scaling down of field-effect transistors. As a result, this higher thermal resistance could induce many issues that cause degradation of device performance, including a tunnel effect, increased power consumption, and excess heat production [28,29,30,31,32,33]. When the oxide SiO2 is scaled down, gate current leakage occurs as a result of carriers being able to tunnel through the gate dielectric [34]. Therefore, since SiO2 is inappropriate for nanodevices, the use of high-k materials is essential for overcoming the limitations of SiO2, which faces challenges in maintaining sufficient gate control in modern nanoscale transistors. In our previous work [35], we have compared the behavior of several high-k materials such as HfO2, ZrO2,La2O3, and Al2O3. We have shown that Al2O3 as a substitute produces significant reductions in thermal effects and can be used as a potential candidate in transistor devices. While high-k materials offer advantages in improving device performance, they tend to have higher trap densities compared to SiO2. The presence of traps in the dielectric can lead to charge trapping, affecting the overall charge control in the transistor channel. In fact, the traps are defined as energy levels in the bandgap of the semiconductor. These traps can capture and release charge carriers. This phenomenon can cause several reliability problems that affect the device’s electrical and thermal characteristics. When trapped carriers are later released back into the channel, it leads to a change in the device’s threshold voltage and electrical characteristics. For that reason, it is crucial to account for trap density and its effects in order to accurately model and simulate the electrothermal behavior of GAAFET devices.
Device designers and researchers often use advanced simulation techniques, which include trap models, to study the impact of traps on a device’s performance under different operating conditions [36,37,38,39]. The effects of interface trap charges (ITCs) on doping-less NW-based devices were addressed for the first time by Kumar et al. [40]. The proposed device performed better in the presence of positive ITCs. The influence of interface traps on the I–V characteristics of InAs-nanowire-FETs and MOSFETs has been investigated by Pala et al. [41]. They demonstrated that traps have a significant impact on subthreshold slopes and that even a single trap can deteriorate the subthreshold reverse-slope of an InAs nanowire.
The simulation of nanoscale devices is computationally intensive due to the fine mesh needed to accurately capture the intricacies of small-scale structures. Several mesh-free methods have been developed to solve physical and engineering problems [42,43,44,45,46]. The finite element method has gained extensive attention due to its ability to solve partial differential equations for difficult problems with irregular geometries [47,48]. This method is based on the discretization of partial differential equations (PDEs) [49], which describe space-and-time-dependent physical problems. The solution of the equation is an approach to the real solution. Previously, we analyzed the self-heating effect in GAAFETs [50] using the finite element method. The finite element discretization has been used to tackle the effect of Joule heating in a conductive-bridge random-access memory (CBRAM) for the single-phase-lag heat conduction model [51].
This paper aims to contribute to the investigation of the trap density effect on the electro-thermal behavior of GAAFETs. High-k dielectric Al2O3 has been used as the gate dielectric, and the finite element method has been used for modeling semiconductor equations, coupled with the heat conduction model. The device’s structure and the numerical method are developed in Section 2. The results are discussed in Section 3. In Section 4, the conclusions of this work are presented.

2. Device Structure and Simulation Approach

2.1. Device Structure and Flow Process

Figure 2a shows the entire 3D GAAFET structure. Between the two outer gates, a thin oxide layer Al2O3 surrounds the silicon channel region. The fabrication processes of the GAAFET structure are illustrated in Figure 2b. More details about the process flow is reported with [52]. A 2D axial-symmetry schematic cross-sectional view of the structure is seen in Figure 2c.
As the 3D structure presents an axial symmetry around the z-axis, a 2D axial-symmetry structure is considered in this work. The supply voltage to the device is 0.5 V and the oxide thickness is 2 nm. The source/drain doping concentration is 1 × 1017 cm−3, the channel doping is 1 × 1020 cm−3, the device radius, R, is 5 nm, and the length of the gate, Lg, is 100 nm. Table 2 displays other physical and thermal parameters.
  • For the semiconductor equations, as boundary conditions, a constant electrostatic potential equal to Vd is applied at the drain contact and a potential equal to VG at the gate contact n = n0, p = p0, and φ = V0 at the source and drain regions, and ∇n = ∇p = ∇φ = 0 at the other boundary sides.
  • For the heat conduction equation, we suppose that the devices are completely isolated. The right side, as well as the top and bottom boundaries in the GAAFET, are assumed to be adiabatic (∇T = 0). A Dirichlet boundary condition (T0 = 300 K) is adopted at the gate, implicitly assuming that the heat rapidly dissipates in metallic contacts.
  • A symmetric boundary is used at the symmetry axis for the electrothermal simulation.

2.2. Model Description

Semiconductor equations are based on Poisson’s equation and the continuity equation of electrons and holes. The main equations are expressed as follows:
2 V = q ε p n + N D + N A
. J p + q p t = q R p
. J n q n t = q R n
C T t = λ T + H
where [V, Jn, Jp] are determined from auxiliary equations:
E = V
J p = q ( p ν p D p p )
J n = q ( n ν n D n n )
H = J · E
The parameter descriptions are illustrated in Table 3.
Spatial discretization of the semiconductor Equations (1)–(3) and heat conduction Equation (4) is carried out by the finite element method. The principle of the finite element method is to approximate an unknown to an expression with a shape function; an appropriate function interpolates the solution at the mesh nodes between the discrete values, and a function Ψ can be approximated by:
ψ r , t = ϕ r × Ψ i ( t )
where Ψi is the value of Ψ at the nodes i, and ϕ(r) is the line vector of the shape functions, which is given by:
ϕ i r = j i r r j r i r j
The disruption of the function is defined by:
δ ψ r = ϕ T r δ ψ i T
where T is the transposed.
For a rectangular element with eight nodes, the desired function, ϕ, is interpolated by a quadratic polynomial (Figure 1), which depends on the variables x and y.
Ψ ( x , y ) = C 1 + C 2 x + C 3 y + C 4 x 2 + C 5 x y + C 6 y 2 + C 7 x 2 y + C 8 x y 2
ϕ 1 ( x , y ) = ( 1 x ) ( 1 y ) ( 1 2 y 2 x )
ϕ 2 ( x , y ) = ( 1 x ) ( 1 y ) ( 1 2 y 2 x )
In our case, the approximation of the function, Φ = [V, p, n, T], can be expanded in terms of the shape function into:
Φ r , t = i = 1 N Φ i t ϕ i ( r )
We introduced a shape function, ϕj, in the disturbance of the unknown function Φ, expressed as follows:
ϕ j = δ Φ t , r = i = 1 N δ Φ i e ( t ) T r ϕ i ( r ) T r
where Tr is the transpose matrix. The function distribution Φ(r) inside an element is an interpolation between its nodal.
The integral form is obtained by multiplying (1–3) by ϕj and integrating over Ω, the region occupied by the device. After applying the divergence theorem, we find:
Ω ϕ j ε V Ω Ω ϕ j q p n + N A N D Ω = Γ ϕ j ε V Γ
Ω ϕ j p t Ω + Ω ϕ j D p p p ν p Ω + Ω ϕ j R p Ω = Γ ϕ j D p p p ν p Γ
Ω ϕ j n t Ω Ω ϕ j D n n + n ν n Ω + Ω ϕ j R n Ω = Γ ϕ j D n n + n ν n Γ
The left terms of Equations (17)–(19) represent the boundary conditions which make the integrals over Γ vanish. After development, using Equation (4), the system of Equation (1) can be written as:
Ω ϕ j ε i = 1 N V i t ϕ i r Ω Ω ϕ j q i = 1 N p i t ϕ i r i = 1 N n i t ϕ i r + N A N D Ω = Γ ϕ j ε i = 1 N V i t ϕ i ( r ) Γ
Similar developments of Equations (2) and (3) give the following equation:
i = 1 N α M i j Φ ˙ i + β K i j + γ L i j Φ i + F j = 0
where:
M i j = Ω ϕ i ϕ j Ω
L i j = Ω ϕ i ϕ j Ω
K i j = Ω ϕ i ϕ j Ω
F j = Γ δ Φ ϕ j Γ
α = 0 1 1 C , β = 0 D p D n λ , γ = 0 1 1 0 ,   a n d   δ Φ = q / ε ( N D N A ) R R H
After assembling the elementary matrices, we obtain the global matrix form:
M α Φ ˙ + β K + γ L Φ + F = 0
where Φ is the vector of an unknown nodal transportable quantity, M is the damping matrix, (β[K] + γ[L]) is the stiffness matrix, and F is the external flux vector.
The discretization of the ordinary differential equation gives:
Φ n + 1 = Φ n 1 2 Δ t α M β K + γ L Φ n + F

2.3. Simulation Setup

As nanoscale devices often exhibit size-dependent behavior, it is essential to understand and accurately model size effects to predict device performance. The FEM consists of dividing the domain of interest into smaller elements (mesh) with particular attention to interfaces and contacts in order to approximate the behavior of the device. The FEM assumes that:
  • The physical domain is continuous and can be represented by a finite number of elements.
  • A linear relationship between stresses, strains, and displacements exists.
  • The material properties are isotropic and homogeneous.
However, there could be some limitations to the application of FEM at the nanoscale. Among these, we mention the extremely small size of the structures, which requires a very fine mesh grid to capture the details. This could lead to computationally expensive models in terms of computational resources and calculation time. In such cases, careful consideration and mesh refinement are necessary. Therefore, finding a trade-off between computational time and accuracy is required for simulation problems. In our study, we use an adequate mesh, more refined at the interfaces and contacts. In addition, FEM is not ideal for accounting for quantum behaviors and often requires specialized methods based on quantum mechanics. Furthermore, FEM can face challenges in correctly dealing with boundary and interface properties that can be difficult to model accurately. In this study, the mesh has been refined so that it will be close to the positions of the atoms, meaning that the oxide–semiconductor interface is assumed to be smooth and that we do not hold the interface roughness. A linear shape function is adopted for potential, electron, and hole densities, with a relative tolerance of 10−6 as convergence criteria [53,54].
The numerical resolution of the electrothermal model follows the following steps:
i.
The Poisson equation and the continuity equations are solved iteratively, with convergence achieved.
ii.
The heat conduction equation is solved using a 300 K initial temperature assumption for the device to determine the temperature profile.
The parts of (i) and (ii) are solved iteratively to reach the convergent solution.
For ensuring the accuracy and reliability of the simulations, we have compared our numerical simulation using the finite element method with existing experimental data from the literature, reported in [55,56]. Figure 3a depicts the log scale drain current versus the gate voltage at Vd = 1 V. Hafnium dioxide (HfO2) is considered as the gate dielectric; the other parameters are shown in the figure. Figure 3b exhibits the drain current versus the drain voltage at VG = 0.6 V. The simulation was considered for a cylindrical GAAFET structure having a channel length of 180 and a diameter of 5 nm for a gate voltage of 0.6 V. Figure 4 illustrates a good agreement in output characteristics.

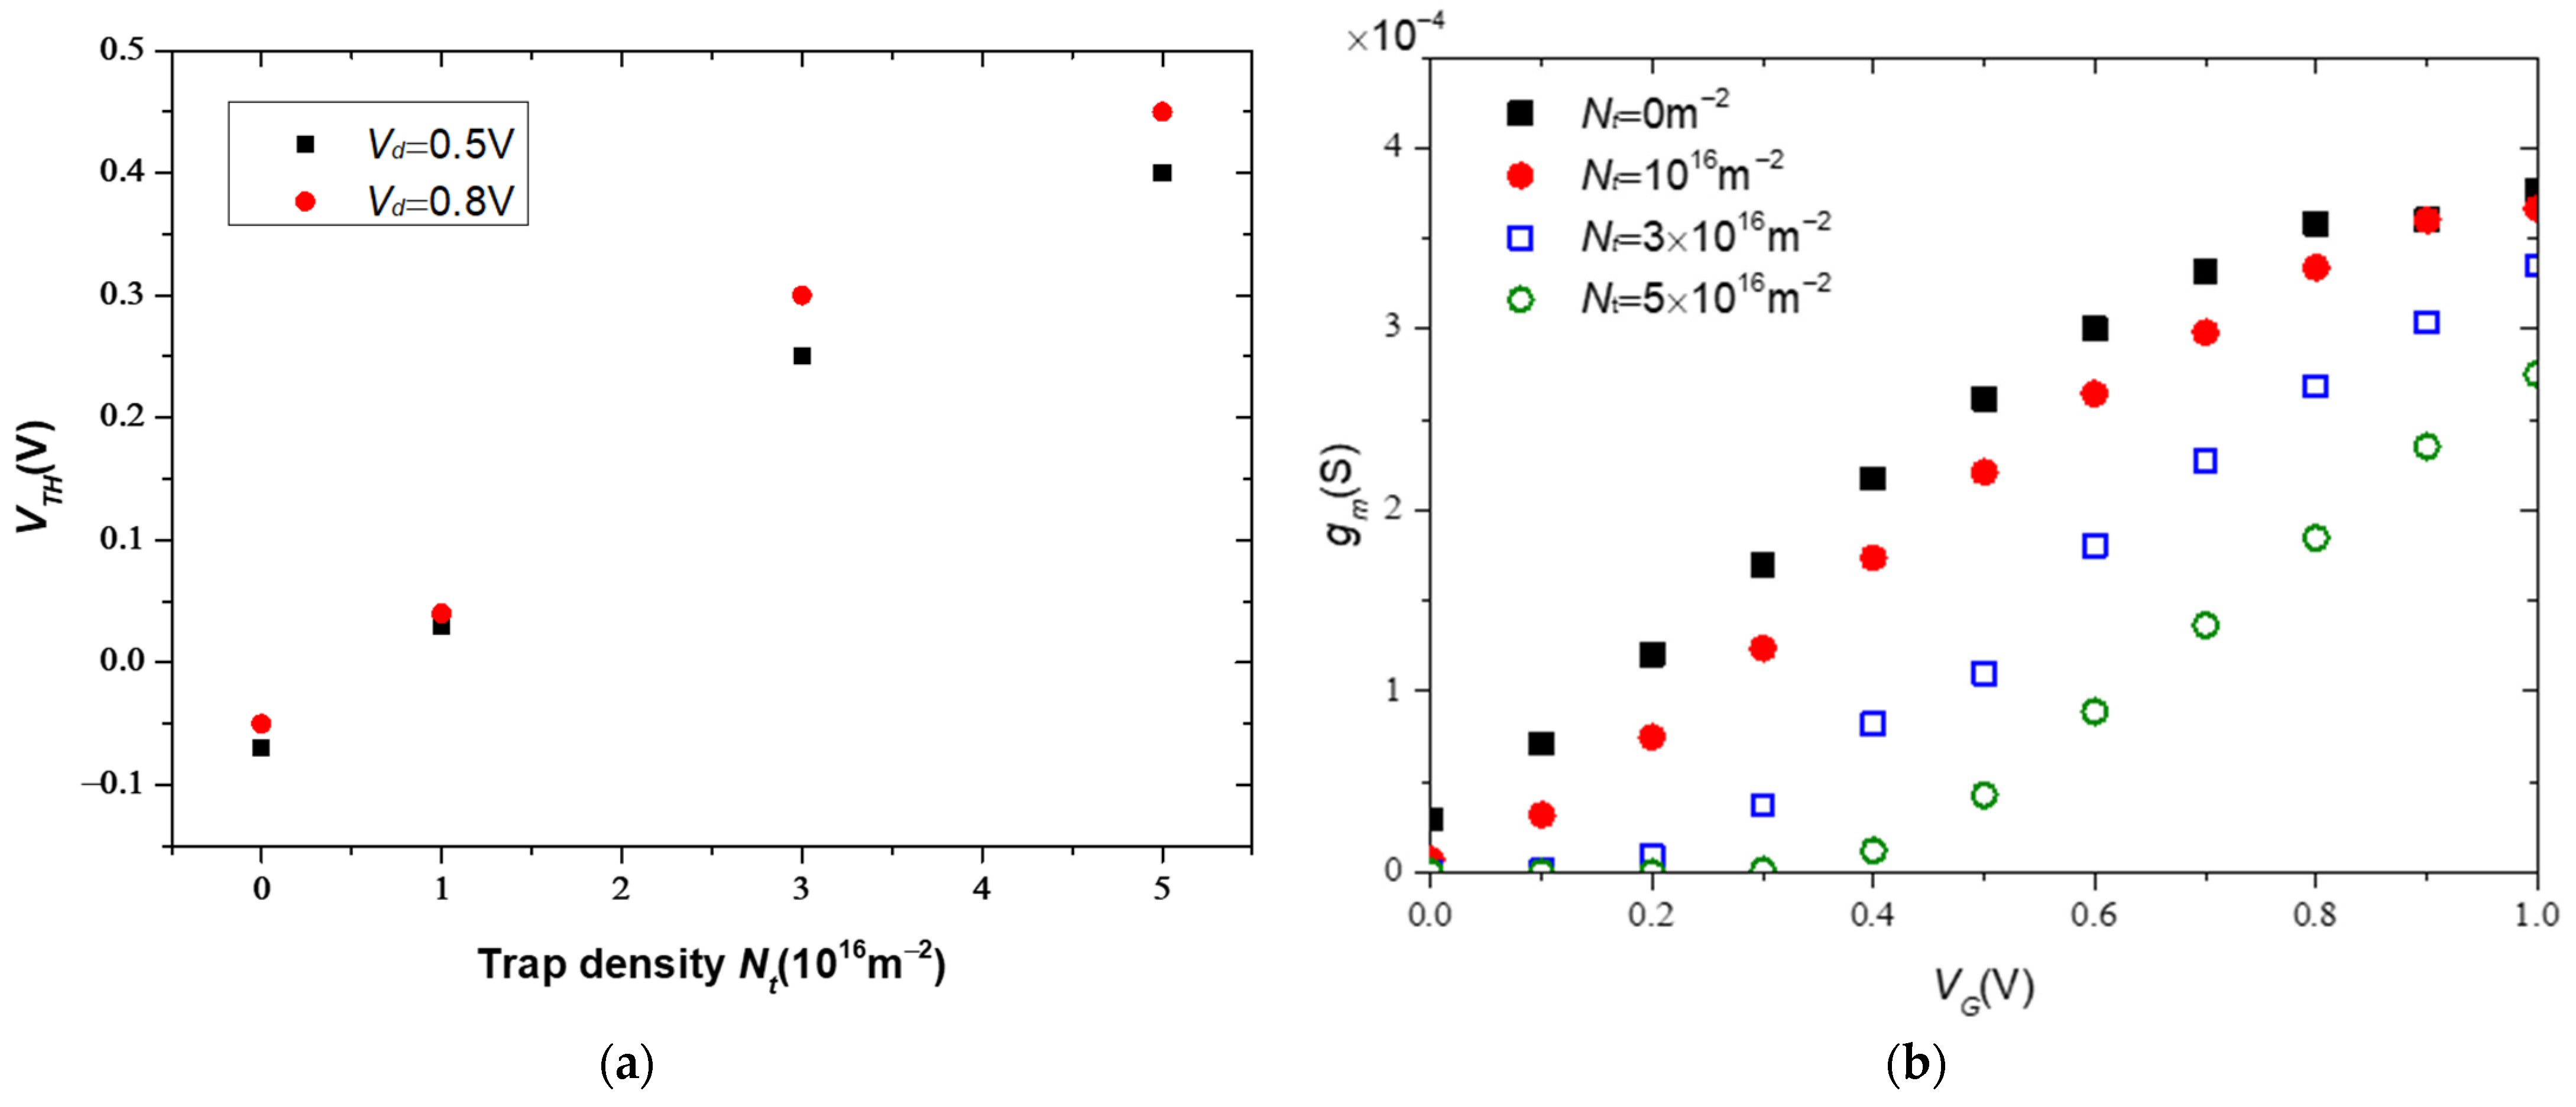
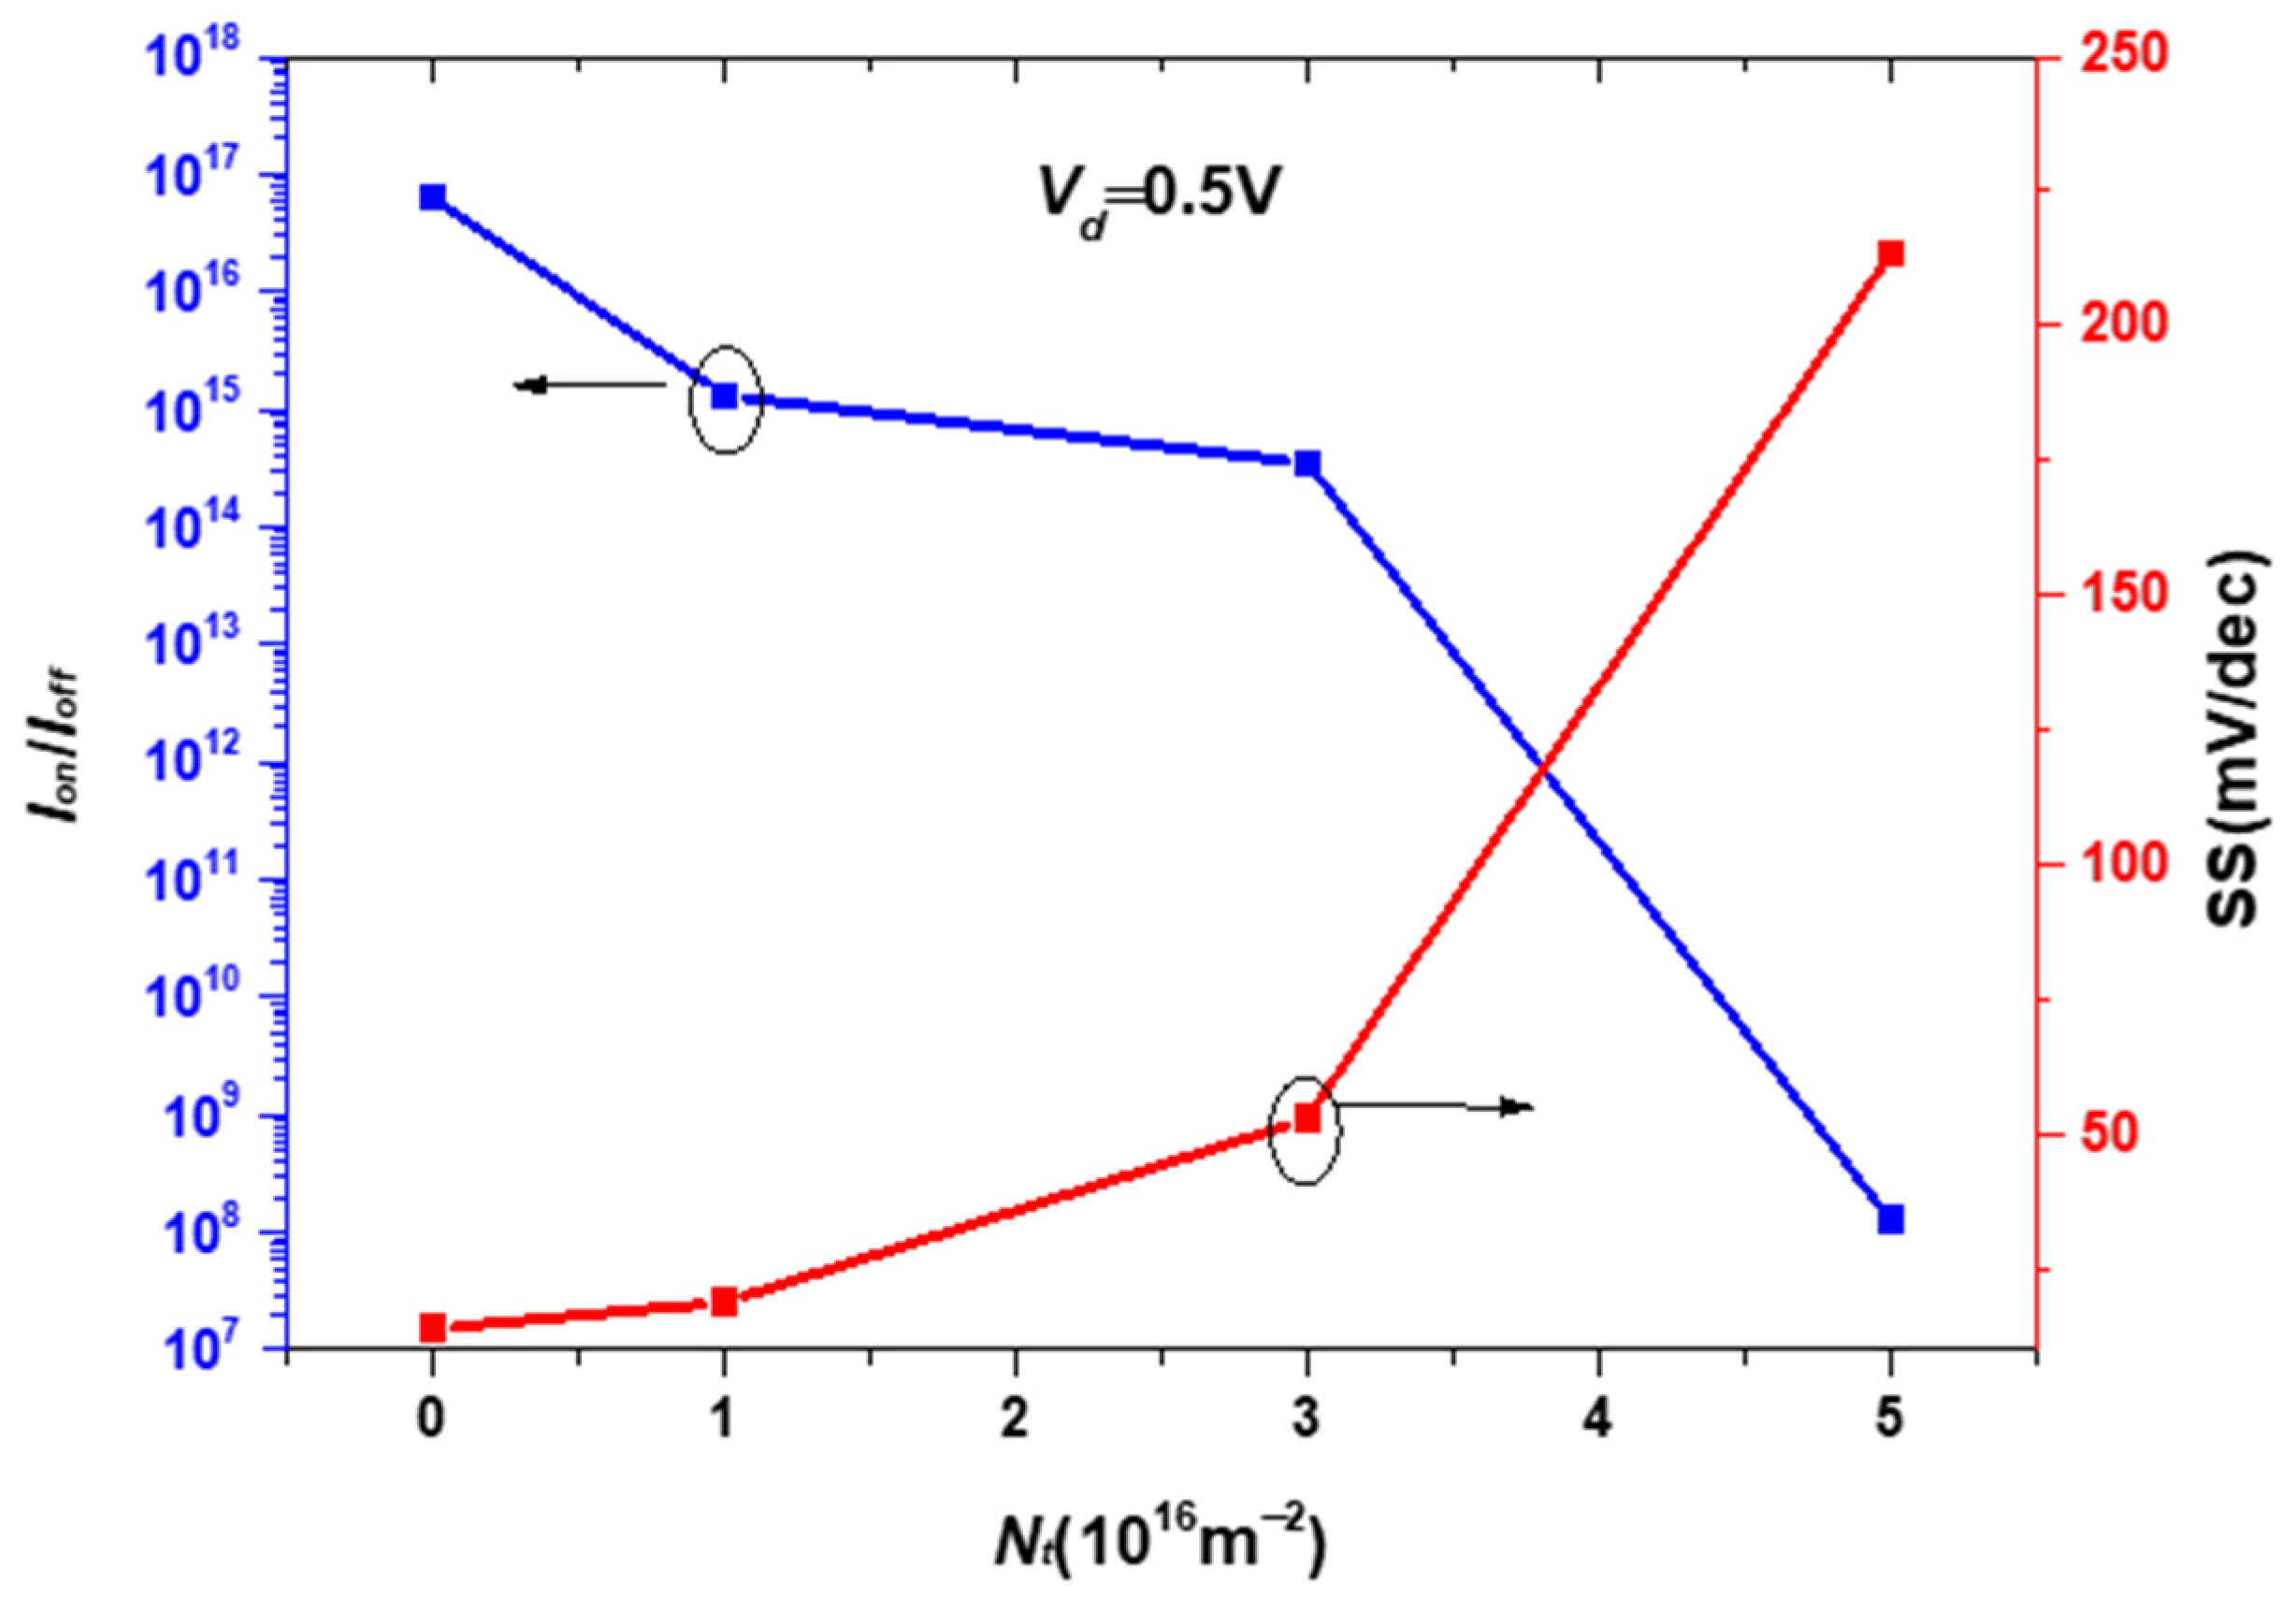
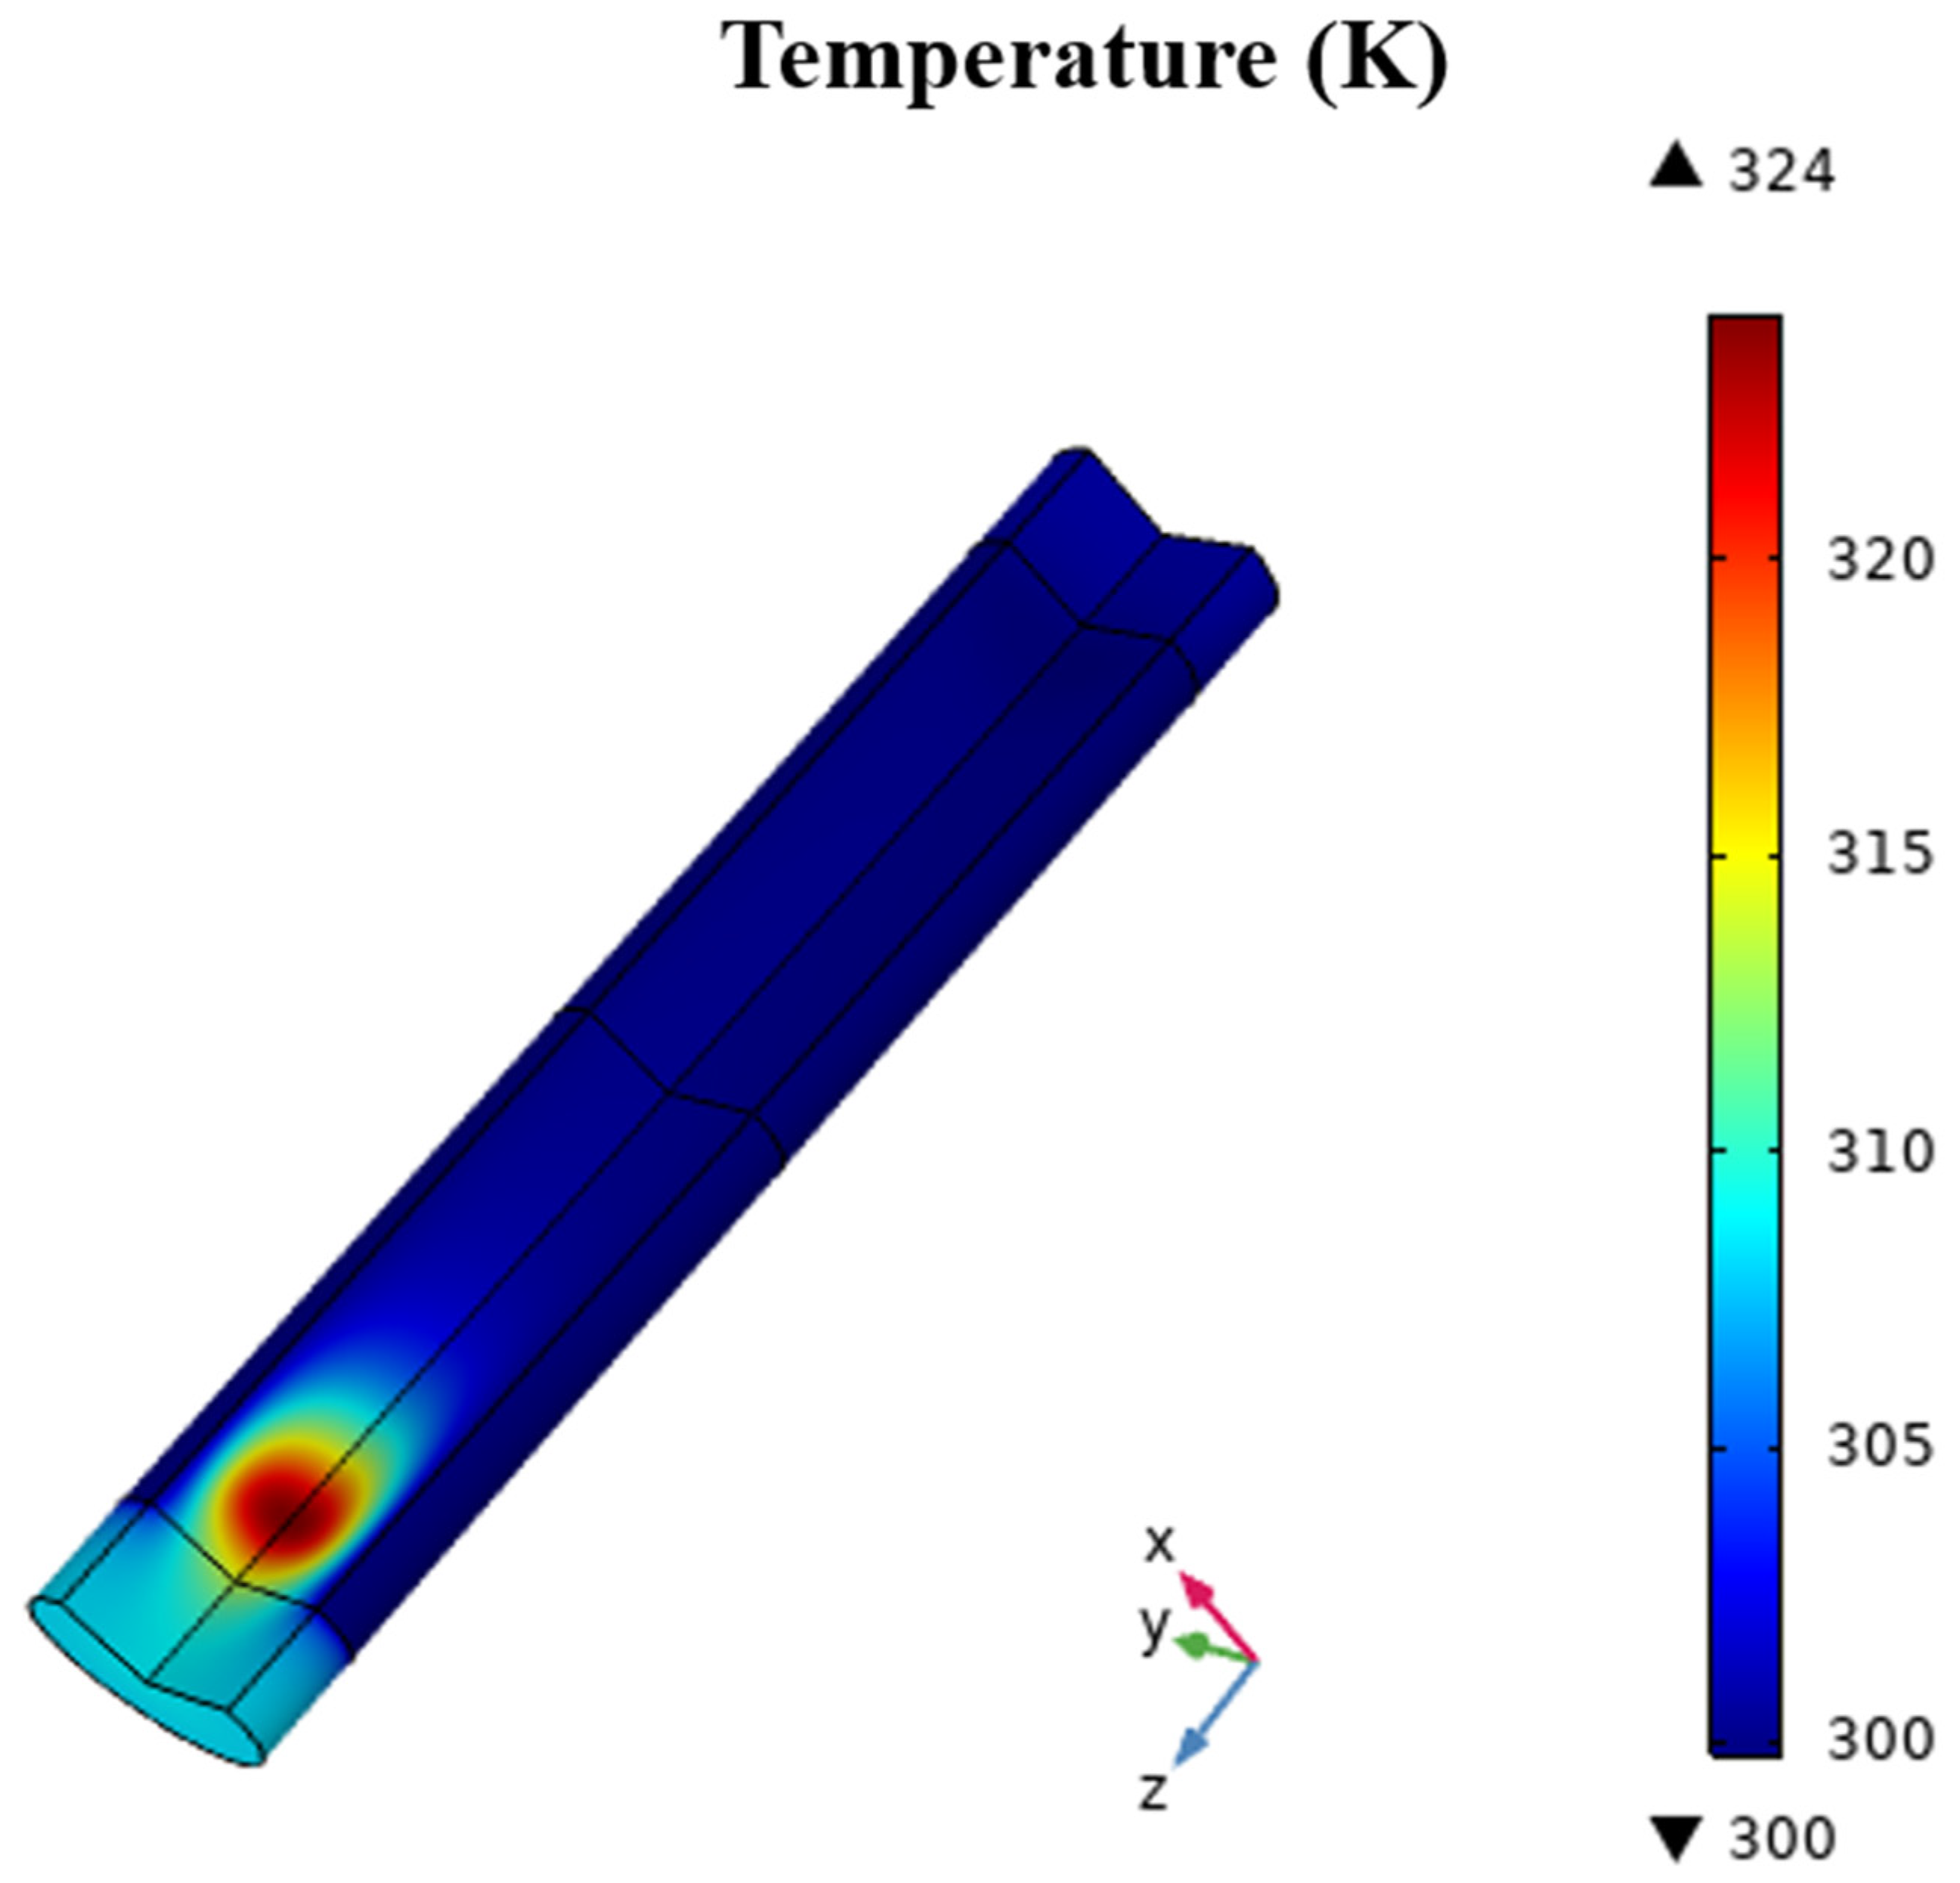
3. Results and Discussion

Figure 5 depicts the output characteristics of the GAAFET in linear and logarithmic views at Vd = 0.5 V. The results are evaluated for different high-k dielectric materials with and without trap density. The drain current is enhanced with higher-k dielectric materials (ZrO2). This improvement in the device characteristics for higher permittivity is due to better electrostatic control of the channel region, which can both enhance ION at higher gate biases and reduce IOFF at low gate voltages. It is observed from this figure that the oxide SiO2 causes one order of reduction in IOFF and about 350 µA enhancement of drive current at VD =0.5 V and VG = 1.5 V compared to Al2O3. The effect of trap density is more significant for dielectric materials with lower permittivity. In the following, the investigation is carried out on the GAAFET with Al2O3 due to its improvement in drain current compared to SiO2.
In this section, we propose to investigate the effect of the trap density on the electric characteristics of the GAAFET device. Figure 6 shows the electric potential along the channel at the central cross-section of the channel for different values of Nt. The results are simulated for a constant drain value, Vd =1 V, and gate voltages VG = 1.5 V. The relevant results show that the electric potential decreases with an increase in surface trap concentrations. The electric potential profile is similar along the channel and is higher near the drain region.
The output characteristic of the GAAFET is illustrated in Figure 7 with different trap density values at Vd = 0.5 V. It is clear from the figure that the higher drain current is obtained with a higher trap density, and the effect of the trap density is more intensive, especially for a higher value of the gate voltage. Furthermore, it can be observed that as the trap density ratio increases, the turn-on voltage decreases. Similar results are proven in [57].
Figure 8a shows the threshold voltage of the GAAFET as a function of the trap density for different drain currents, Vd. As can be seen from the figure, the threshold voltage versus the trap density is almost linear with trap density. These traps cause shifts in the device’s performance. Over time, the shifts in threshold voltage can result in device degradation and reduced reliability. Furthermore, continuous capture and release of charge carriers can cause physical damage and defects in the channel and the gate oxide, leading to a decrease in the device’s performance over time. Figure 8b depicts the transductance versus the gate voltage for different values of Nt. It is noticeable that a higher transductance value means a faster transistor. Results reveal that a higher gm is obtained for Nt = 0 m−2. It can also be noted that the value is illustrated for VG = 1 V.
Figure 9 shows the Ion/Ioff ratio in the left axis and the subthreshold slop in the right axis at Vd = 0.5 V. A higher on/off-state current ratio is provided for a lower trap density. A higher Ion/Ioff ratio indicates a larger difference between the current levels when the transistor is in the on-state and off-state, so the transistor can switch more efficiently. The sub-threshold slope in (mV/decade) is an important parameter that indicates how the drain current changes with the gate-source voltage when the transistor operates in the subthreshold region. A lower subthreshold slope is desirable because it indicates that the transistor can be turned off and on more efficiently with smaller gate voltage changes. In such cases, to achieve the best possible subthreshold slope performance in GAAFET transistors, it is important to minimize the trap density, as shown in the figure.
Figure 10 shows the effect of trap density on the log scale output characteristics Id-VG of the GAAFET. This study is carried out for different geometric parameters such as the oxide thickness, the radius, and the gate length of the device. Figure 10a shows that the drain current varies with the gate voltage for different trap density values of Nt = 0, 1016 m−2 and 5 × 10¹⁶ m−2. It is clear from the figure that the drain current is higher in the case where the trap density is not taken into account. For VG = 0, the drain current is 10−11, 2 × 10⁻⁷, and 10−6 A and for Nt = 5 × 10¹⁶, 1016, and 0 m−2, respectively. Figure 10b depicts the impact of the trap density on the drain current with different oxide thickness values. Results indicate that, especially at higher gate voltages, the drain current is higher with a lower oxide thickness. Likewise, it is apparent that the trap density reduces the drain current, in particular at lower gate voltages for the same oxide thickness. Similarly, the radius effect on the output characteristics of GAAFET devices is illustrated in Figure 10c. The lower radius gives a higher drain current. Figure 10d shows how the log scale Id-VG behaves with different gate lengths. When channel length increases, the drain current of the GAAFET decreases. This behavior is associated with the impact of short channel effects. The simulation’s results agree with those previously reported by [34].
Although the electrical study shows that reducing oxide thickness can enhance gate control and raise the on-state current of the transistor, shorter gate lengths can amplify short channel effects. They also increase the gate leakage current, which increases the device’s off-state power consumption and causes reliability issues. In what follows, we propose to investigate the effect of trap density on the thermal behavior of the device.
Figure 11 shows the temperature distribution in a 3D GAAFET structure for VG = 1 V, Vd = 2 V without trap density. It is noted from the figure that the maximum temperature, Tmax = 324 K, is localized near the drain region at the center of the device. The temperature decreases at the drain zone, where it is about 310 K. It is seen that the temperature significantly decreases from the hot spot (T = Tmax) to the source region. On the source side, the temperature is equal to T0 = 300 K.
To study the impact of the trap density, the temperature distribution in the GAAFET structure is evaluated for the different gate voltages Nt = 1016 m−2 and Nt = 5 × 10¹⁶ m−2. Figure 12 shows the surface distribution of the temperature for Vd = 2 V. Relevant results indicate that for a lower value of Vg (Vg = 0.5 V), the maximum temperature decreases from 311 K for Nt = 1016 m−2 to 303 K for Nt = 5 × 10¹⁶ m−2, and for VG = 1 V, the decrease is about 5 K between the two values of trap density. For a high value of VG (VG = 1.5), the maximum temperature increases from 323 K to 325 K. Additional to these results, as it can be seen from the figure, the temperature distribution is not uniform for the different values, especially in the drain region. For that reason, the temperature profile along the z-axis, from the source to the drain side, is investigated and presented in Figure 13. As can be seen, the effect of the trap density is more noticeable in the hot spot region, where the temperature is at maximum. On the other hand, the results are evaluated along the symmetric axis of the GAAFET structure (R = 0) and at the oxide–semiconductor interface (R = 5 nm). For a constant value of Nt, (the dashed line in the figure), the temperature is more significant at the center of the device than at the oxide–semiconductor interface. The heat dissipation is evacuated forward into the drain region.
The impact of reducing oxide thickness and gate length on the device temperature is illustrated in Figure 14. The temperature profile along the z-axis is evaluated at Vg = 0.5 V and Vd = 1 V for Lg = 100 nm (a) and for Lg = 50 nm (b) with different oxide thicknesses. While reduced oxide thickness and gate length can enhance performance, they can also lead to increased device temperature. The results revealed that reducing oxide thickness results in higher standby temperature and, therefore, power consumption. This trade-off becomes more pronounced at smaller scales. For tox = 1 nm, the maximum temperature increases from 323.17 K to 350.24 K when Lg decreases from 100 nm to 50 nm. The temperature increase is about 16 K for tox = 2 nm.
The heat flux and temperature profile, in the middle of the structure (r = 2 nm) along the channel from the source side to the drain, are presented in Figure 15. Obtained results are evaluated at Vg = 0.8 V and Vd = 1 V. The profiles are presented for r = 0.5 nm, near the symmetry axis, where the hot spot is confined. The peak temperature is Tmax = 324 K and the maximum heat flux is about 2.2 × 10²⁰ Wm−3. We observe that the hot spot is localized, particularly at the channel and drain contact.
Figure 16 shows the effect of the trap density on the temperature rise profile versus the drain voltage Vd. The outcomes are shown when Vd ranges from 0 to 1.8 V and Vg is 0.5 V. The temperature rise is found to increase quadratically with drain voltage according to the results. Without taking the trap density into account, the maximum temperature rise is noted for higher drain voltage values. For a constant drain voltage, the temperature rise becomes smaller as the trap density increases.

4. Conclusions

GAAFETs have the potential to be used for various applications due to their unique advantages over traditional MOSFETs and FinFETs. The electrothermal behavior of GAAFETs has been analyzed in this work. This study demonstrates how the trap density can affect the electrical responses and thermal behavior of GAAFETs. The numerical simulation has been investigated in a 2D axis-symmetry structure, the finite element method has been used in the discretization of the semiconductor equations, and the impact of the trap density on the output characteristics has been discussed. Moreover, the effect of the geometric parameters is investigated, taking into account the trap density on the output characteristics of the GAAFET. It has been shown that reducing the oxide thickness can improve gate control and increase the transistor’s on-state current. However, it also increases the gate leakage current, which increases the power consumption of the device in the off state. On the other hand, shorter gate lengths can increase short channel effects, reducing control over the channel and leading to potential reliability issues. Following that, the thermal behavior was analyzed. The results reveal that the electrical and thermal responses of transistors are significantly influenced by trap density. An enhancement of the output characteristics in the device is obtained using lower geometric dimensions such as oxide thickness, gate length, and device radius. In summary, comprehending and controlling trap density will enable researchers to produce more efficient, dependable, and high-performance GAAFET transistors in the future.

Author Contributions

M.B. contributed to the simulation and implementation of the research and to the writing of the relevant subsection of the manuscript. F.A. contributed to the analysis of the results and the writing of the manuscript. S.A.A. and F.E. contributed to the correction and organization of the manuscript. H.B. is the supervisor of the work presented in this manuscript. All authors have read and agreed to the published version of the manuscript.

Funding

The authors extend their appreciation to the Deputyship for Research & Innovation, Ministry of Education in Saudi Arabia for funding this research work through the project number RI-44-0327.

Data Availability Statement

No new data were created.

Acknowledgments

The authors extend their appreciation to the Deputyship for Research & Innovation, Ministry of Education in Saudi Arabia for funding this research work through the project number RI-44-0327.

Conflicts of Interest

The authors declare no conflict of interest.

References

  1. Hisamoto, D.; Lee, W.-C.; Kedzierski, J.; Takeuchi, H.; Asano, K.; Kuo, C.; Anderson, E.; King, T.-J.; Bokor, J.; Hu, C. FinFET-a self-aligned double-gate MOSFET scalable to 20 nm. IEEE Trans. Electron Devices 2000, 47, 2320–2325. [Google Scholar]
  2. Park, J.-T.; Colinge, J.-P.; Diaz, C.H. Pi-gate soi mosfet. IEEE Electron Device Lett. 2001, 22, 405–406. [Google Scholar] [CrossRef]
  3. Doyle, B.; Datta, S.; Doczy, M.; Hareland, S.; Jin, B.; Kavalieros, J.; Linton, T.; Murthy, A.; Rios, R.; Chau, R. High performance fully-depleted tri-gate CMOS transistors. IEEE Electron Device Lett. 2003, 24, 263–265. [Google Scholar] [CrossRef]
  4. Yang, F.-L.; Chen, H.-Y.; Chen, F.-C.; Huang, C.-C.; Chang, C.-Y.; Chiu, H.-K.; Lee, C.-C.; Chen, C.-C.; Huang, H.-T.; Chen, C.-J. 25 nm CMOS omega FETs. In Proceedings of the Digest International Electron Devices Meeting, San Francisco, CA, USA, 8–11 December 2002; pp. 255–258. [Google Scholar]
  5. Monfray, S.; Skotnicki, T.; Morand, Y.; Descombes, S.; Coronel, P.; Mazoyer, P.; Harrison, S.; Ribot, P.; Talbot, A.; Dutartre, D. 50 nm-gate all around (GAA)-silicon on nothing (SON)-devices: A simple way to co-integration of GAA transistors within bulk MOSFET process. In Proceedings of the 2002 Symposium on VLSI Technology, Kyoto, Japan, 10 June 2022; Digest of Technical Papers (Cat. No. 01CH37303). pp. 108–109. [Google Scholar]
  6. Kumar, M.J.; Orouji, A.A.; Dhakad, H. New dual-material SG nanoscale MOSFET: Analytical threshold-voltage model. IEEE Trans. Electron Devices 2006, 53, 920–922. [Google Scholar] [CrossRef]
  7. Wang, H.-K.; Wu, S.; Chiang, T.-K.; Lee, M.-S. A new two-dimensional analytical threshold voltage model for short-channel triple-material surrounding-gate metal–oxide–semiconductor field-effect transistors. Jpn. J. Appl. Phys. 2012, 51, 054301. [Google Scholar] [CrossRef]
  8. Mo, F.; Spano, C.E.; Ardesi, Y.; Ruo Roch, M.; Piccinini, G.; Vacca, M. NS-GAAFET Compact Modeling: Technological Challenges in Sub-3-nm Circuit Performance. Electronics 2023, 12, 1487. [Google Scholar] [CrossRef]
  9. Karbalaei, M.; Dideban, D.; Heidari, H. A sectorial scheme of gate-all-around field effect transistor with improved electrical characteristics. Ain Shams Eng. J. 2021, 12, 755–760. [Google Scholar] [CrossRef]
  10. Lee, C.-C.; Huang, P.-C.; Hsiang, T.-P. Interactive Lattice and Process-Stress Responses in the Sub-7 nm Germanium-Based Three-Dimensional Transistor Architecture of FinFET and Nanowire GAAFET. IEEE Trans. Electron Devices 2022, 69, 6552–6560. [Google Scholar] [CrossRef]
  11. Min, J.; Shin, C. Study of line edge roughness on various types of gate-all-around field effect transistor. Semicond. Sci. Technol. 2019, 35, 015004. [Google Scholar] [CrossRef]
  12. Zhao, P.; Zhao, S.-H.; He, Y.-D.; Du, G. A comparative study of self-heating effects in 3nm node GAAFETs and FinFETs. In Proceedings of the 2022 IEEE 16th International Conference on Solid-State & Integrated Circuit Technology (ICSICT), Nanjing, China, 25–28 October 2022; pp. 1–3. [Google Scholar]
  13. Mohan, C.; Choudhary, S.; Prasad, B. Gate All Around FET: An Alternative of FinFET for Future Technology Nodes. Int. J. Adv. Res. Sci. Eng. 2017, 6, 563–569. [Google Scholar]
  14. Barraud, S.; Berthome, M.; Coquand, R.; Cassé, M.; Ernst, T.; Samson, M.-P.; Perreau, P.; Bourdelle, K.; Faynot, O.; Poiroux, T. Scaling of trigate junctionless nanowire MOSFET with gate length down to 13 nm. IEEE Electron Device Lett. 2012, 33, 1225–1227. [Google Scholar] [CrossRef]
  15. Sallese, J.-M.; Chevillon, N.; Lallement, C.; Iniguez, B.; Prégaldiny, F. Charge-based modeling of junctionless double-gate field-effect transistors. IEEE Trans. Electron Devices 2011, 58, 2628–2637. [Google Scholar] [CrossRef]
  16. Yeo, K.H.; Suk, S.D.; Li, M.; Yeoh, Y.-Y.; Cho, K.H.; Hong, K.-H.; Yun, S.; Lee, M.S.; Cho, N.; Lee, K. Gate-all-around (GAA) twin silicon nanowire MOSFET (TSNWFET) with 15 nm length gate and 4 nm radius nanowires. In Proceedings of the 2006 International Electron Devices Meeting, San Francisco, CA, USA, 11–13 December 2006; pp. 1–4. [Google Scholar]
  17. Dhanaselvam, P.S.; Balamurugan, N. Analytical approach of a nanoscale triple-material surrounding gate (TMSG) MOSFETs for reduced short-channel effects. Microelectron. J. 2013, 44, 400–404. [Google Scholar] [CrossRef]
  18. Pravin, J.C.; Nirmal, D.; Prajoon, P.; Ajayan, J. Implementation of nanoscale circuits using dual metal gate engineered nanowire MOSFET with high-k dielectrics for low power applications. Phys. E Low-Dimens. Syst. Nanostructures 2016, 83, 95–100. [Google Scholar] [CrossRef]
  19. Narula, M.S.; Pandey, A. A Comprehensive Review on FinFET, Gate All Around, Tunnel FET: Concept, Performance and Challenges. In Proceedings of the 2022 8th International Conference on Signal Processing and Communication (ICSC), Noida, India, 1–3 December 2022. [Google Scholar]
  20. Kumar, B.; Kumar, A.; Chaujar, R. The effect of gate stack and high-ĸ spacer on device performance of a Junctionless GAA FinFET. In 2020 IEEE vlsi Device Circuit and System (vlsi dcs); IEEE: Piscataway, NJ, USA, 2020; pp. 159–163. [Google Scholar]
  21. Alam, M.A.; Mahajan, B.K.; Chen, Y.-P.; Ahn, W.; Jiang, H.; Shin, S.H. A device-to-system perspective regarding self-heating enhanced hot carrier degradation in modern field-effect transistors: A topical review. IEEE Trans. Electron Devices 2019, 66, 4556–4565. [Google Scholar] [CrossRef]
  22. Bury, E.; Kaczer, B.; Roussel, P.; Ritzenthaler, R.; Raleva, K.; Vasileska, D.; Groeseneken, G. Experimental validation of self-heating simulations and projections for transistors in deeply scaled nodes. In Proceedings of the 2014 IEEE International Reliability Physics Symposium, Waikoloa, HI, USA, 1–5 June 2014; pp. XT. 8.1–XT. 8.6. [Google Scholar]
  23. Takahashi, T.; Matsuki, T.; Shinada, T.; Inoue, Y.; Uchida, K. Direct evaluation of self-heating effects in bulk and ultra-thin BOX SOI MOSFETs using four-terminal gate resistance technique. IEEE J. Electron Devices Soc. 2016, 4, 365–373. [Google Scholar] [CrossRef]
  24. Scholten, A.; Smit, G.; Pijper, R.; Tiemeijer, L.; Tuinhout, H.; Van der Steen, J.-L.; Mercha, A.; Braccioli, M.; Klaassen, D. Experimental assessment of self-heating in SOI FinFETs. In Proceedings of the 2009 IEEE International Electron Devices Meeting (IEDM), Baltimore, MD, USA, 7–9 December 2009; pp. 1–4. [Google Scholar]
  25. Jang, D.; Bury, E.; Ritzenthaler, R.; Bardon, M.G.; Chiarella, T.; Miyaguchi, K.; Raghavan, P.; Mocuta, A.; Groeseneken, G.; Mercha, A. Self-heating on bulk FinFET from 14nm down to 7nm node. In Proceedings of the 2015 IEEE International Electron Devices Meeting (IEDM), Washington, DC, USA, 7–9 December 2015; pp. 11.16. 11–11.16. 14. [Google Scholar]
  26. Ahn, W.; Shin, S.H.; Jiang, C.; Jiang, H.; Wahab, M.; Alam, M.A. Integrated modeling of self-heating of confined geometry (FinFET, NWFET, and NSHFET) transistors and its implications for the reliability of sub-20 nm modern integrated circuits. Microelectron. Reliab. 2018, 81, 262–273. [Google Scholar] [CrossRef]
  27. Jiang, H.; Shin, S.; Liu, X.; Zhang, X.; Alam, M.A. The impact of self-heating on HCI reliability in high-performance digital circuits. IEEE Electron Device Lett. 2017, 38, 430–433. [Google Scholar] [CrossRef]
  28. Koh, M.; Mizubayashi, W.; Iwamoto, K.; Murakami, H.; Ono, T.; Tsuno, M.; Mihara, T.; Shibahara, K.; Miyazaki, S.; Hirose, M. Limit of gate oxide thickness scaling in MOSFETs due to apparent threshold voltage fluctuation induced by tunnel leakage current. IEEE Trans. Electron Devices 2001, 48, 259–264. [Google Scholar] [CrossRef]
  29. Pimbley, J.M.; Meindl, J.D. MOSFET scaling limits determined by subthreshold conduction. IEEE Trans. Electron Devices 1989, 36, 1711–1721. [Google Scholar] [CrossRef]
  30. Seo, K.-I.; Haran, B.; Gupta, D.; Guo, D.; Standaert, T.; Xie, R.; Shang, H.; Alptekin, E.; Bae, D.-I.; Bae, G. A 10nm platform technology for low power and high performance application featuring FINFET devices with multi workfunction gate stack on bulk and SOI. In Proceedings of the 2014 Symposium on VLSI Technology (VLSI-Technology): Digest of Technical Papers, Honolulu, HI, USA, 9–12 June 2014. [Google Scholar]
  31. Zeitzoff, P.M. MOSFET scaling trends and challenges through the end of the roadmap. In Proceedings of the IEEE 2004 Custom Integrated Circuits Conference (IEEE Cat. No. 04CH37571), Orlando, FL, USA, 3–6 October 2004; pp. 233–240. [Google Scholar]
  32. Echouchene, F.; Belmabrouk, H. Effect of Temperature Jump on Nonequilibrium Entropy Generation in a MOSFET Transistor Using Dual-Phase-Lagging Model. J. Heat Transf. 2017, 139, 122007. [Google Scholar] [CrossRef]
  33. Echouchene, F.; Mabrouk, H.B. Non equilibrium entropy generation in nano scale MOSFET transistor based a nonlinear DPL heat conduction model. In Proceedings of the 2018 9th International Renewable Energy Congress (IREC), Hammamet, Tunisia, 20–22 March 2018; pp. 1–6. [Google Scholar]
  34. Junior, N.G.; Costa, F.J.; Trevisoli, R.; Barraud, S.; Doria, R.T. Influence of interface traps density and temperature variation on the NBTI effect in p-Type junctionless nanowire transistors. Solid-State Electron. 2021, 186, 108097. [Google Scholar]
  35. Belkhiria, M.; Echouchene, F.; Jaba, N.; Bajahzar, A.; Belmabrouk, H. Impact of high-k gate dielectric on self-heating effects in PiFETs structure. IEEE Trans. Electron Devices 2020, 67, 3522–3529. [Google Scholar] [CrossRef]
  36. Li, J.; Pud, S.; Petrychuk, M.; Offenhausser, A.; Vitusevich, S. Sensitivity enhancement of Si nanowire field effect transistor biosensors using single trap phenomena. Nano Lett. 2014, 14, 3504–3509. [Google Scholar] [CrossRef]
  37. Yoon, J.-S.; Kim, K.; Rim, T.; Baek, C.-K. Performance and variations induced by single interface trap of nanowire FETs at 7-nm node. IEEE Trans. Electron Devices 2016, 64, 339–345. [Google Scholar] [CrossRef]
  38. Kalb, W.L.; Batlogg, B. Calculating the trap density of states in organic field-effect transistors from experiment: A comparison of different methods. Phys. Rev. B 2010, 81, 035327. [Google Scholar] [CrossRef]
  39. Sai, P.; Jorudas, J.; Dub, M.; Sakowicz, M.; Jakštas, V.; But, D.; Prystawko, P.; Cywinski, G.; Kašalynas, I.; Knap, W. Low frequency noise and trap density in GaN/AlGaN field effect transistors. Appl. Phys. Lett. 2019, 115, 183501. [Google Scholar] [CrossRef]
  40. Kumar, N.; Raman, A. Performance assessment of the charge-plasma-based cylindrical GAA vertical nanowire TFET with impact of interface trap charges. IEEE Trans. Electron Devices 2019, 66, 4453–4460. [Google Scholar] [CrossRef]
  41. Pala, M.G.; Esseni, D. Interface traps in InAs nanowire tunnel-FETs and MOSFETs—Part I: Model description and single trap analysis in tunnel-FETs. IEEE Trans. Electron Devices 2013, 60, 2795–2801. [Google Scholar] [CrossRef]
  42. Zienkiewicz, O.C.; Taylor, R.L.; Nithiarasu, P.; Zhu, J. The Finite Element Method; McGraw-hill London: London, UK, 1977; Volume 3. [Google Scholar]
  43. Sewell, G. Analysis of a Finite Element Method: PDE/PROTRAN; Springer Science & Business Media: Berlin/Heidelberg, Germany, 2012. [Google Scholar]
  44. Pratap, Y.; Ghosh, P.; Haldar, S.; Gupta, R.; Gupta, M. An analytical subthreshold current modeling of cylindrical gate all around (CGAA) MOSFET incorporating the influence of device design engineering. Microelectron. J. 2014, 45, 408–415. [Google Scholar] [CrossRef]
  45. Ajay, B.; Gadicha, V.B.G. Om Prakash Jena Mechanism to protect Decentralized Transaction Using Blockchain Technology. In Machine Learning Adoption in Blockchain-Based Intelligent Manufacturing: Theoretical Basics, Applications, and Challenges; Taylor & Francis Publication: Abingdon, UK, 2021. [Google Scholar]
  46. Sibabrata Mohanty, K.C.R.a.O.P.J. Implementation of Total Productive Maintenance (TPM) in Manufacturing Industry for Improving Production Effectiveness. In Industrial Transformation: Implementation and Essential Components and Processes of Digital Systems; Taylor & Francis Publication: Abingdon, UK, 2021. [Google Scholar]
  47. Reddy, J.N. Introduction to the Finite Element Method; McGraw-Hill Education: London, UK, 2019. [Google Scholar]
  48. Zlámal, M. Finite element solution of the fundamental equations of semiconductor devices. I. Math. Comput. 1986, 46, 27–43. [Google Scholar] [CrossRef]
  49. Lin, P.T.; Shadid, J.N.; Sala, M.; Tuminaro, R.S.; Hennigan, G.L.; Hoekstra, R.J. Performance of a parallel algebraic multilevel preconditioner for stabilized finite element semiconductor device modeling. J. Comput. Phys. 2009, 228, 6250–6267. [Google Scholar] [CrossRef]
  50. Belkhiria, M.; Echouchene, F.; Jaba, N.; Bajahzar, A.; Belmabrouk, H. 2-D-Nonlinear Electrothermal Model for Investigating the Self-Heating Effect in GAAFET Transistors. IEEE Trans. Electron Devices 2021, 68, 954–961. [Google Scholar] [CrossRef]
  51. Jemii, E.; Belkhiria, M.; Aouaini, F.; Echouchene, F.; Alyousef, H. Electrothermal analyses in Cu/ZrO2/Pt CBRAM memory using a dual-phase-lag model. J. Comput. Electron. 2022, 21, 792–801. [Google Scholar] [CrossRef]
  52. Han, K.; Long, S.; Deng, Z.; Zhang, Y.; Li, J. A novel germanium-around-source gate-all-around tunnelling field-effect transistor for low-power applications. Micromachines 2020, 11, 164. [Google Scholar] [CrossRef]
  53. Jagota, V.; Sethi, A.P.S.; Kumar, K. Finite element method: An overview. Walailak J. Sci. Technol. (WJST) 2013, 10, 1–8. [Google Scholar]
  54. de Arantes e Oliveira, E.R. The patch test and the general convergence criteria of the finite element method. Int. J. Solids Struct. 1977, 13, 159–178. [Google Scholar] [CrossRef]
  55. Singh, S.; Solay, L.R.; Anand, S.; Kumar, N.; Ranjan, R.; Singh, A. Implementation of Gate-All-Around Gate-Engineered Charge Plasma Nanowire FET-Based Common Source Amplifier. Micromachines 2023, 14, 1357. [Google Scholar] [CrossRef]
  56. Singh, N.; Agarwal, A.; Bera, L.; Liow, T.; Yang, R.; Rustagi, S.; Tung, C.; Kumar, R.; Lo, G.; Balasubramanian, N. High-performance fully depleted silicon nanowire (diameter/spl les/5 nm) gate-all-around CMOS devices. IEEE Electron Device Lett. 2006, 27, 383–386. [Google Scholar] [CrossRef]
  57. Zaini, M.; Mohd Sarjidan, M.; Abd, W. The effect of trap density on the trapping and de-trapping processes in determining the turn-on voltage of double-carrier organic light-emitting devices (OLEDs). J. Electron. Mater. 2021, 50, 4511–4523. [Google Scholar] [CrossRef]
Figure 1. Thermal resistance of Bulk planar, SOI planar, FinFETs, and GAAFET devices.
Electronics 12 03673 g001
Figure 2. GAAFET 3D geometry structure (a), fabrication processes (b) and 2D axial-symmetry schematic cross-sectional view (c).
Electronics 12 03673 g002
Figure 3. Quadratic interpolation of shape function in rectangular element.
Electronics 12 03673 g003
Figure 4. Log scale output characteristics of numerical simulation and experimental data [55] (a) and drain current versus the drain voltage compared to experimental data [56] (b).
Electronics 12 03673 g004
Figure 5. Logarithmic (left axis) and linear (right axis) output characteristics for different high-k dielectric materials.
Electronics 12 03673 g005
Figure 6. Trap density effect on the electric potential.
Electronics 12 03673 g006
Figure 7. Trap density effect on the output characteristics.
Electronics 12 03673 g007
Figure 8. Trap density effects on threshold voltage with different drain voltages (a) and a transconductance-versus-gate-voltage plot in the ON state (b).
Electronics 12 03673 g008
Figure 9. On-state current over off-state current ratio (left axis) and subthreshold slope (SS) (right axis) variations with different trap density.
Electronics 12 03673 g009
Figure 10. Output characteristics of GAAFET with different (a) trap density, (b) oxide thickness, (c) radius, and (d) gate length.
Electronics 12 03673 g010
Figure 11. Temperature distribution For Vd = 2 V.
Electronics 12 03673 g011
Figure 12. Temperature distribution for different gate voltages at Nt = 1016 m−2 and Nt = 5 × 10¹⁶ m−2.
Electronics 12 03673 g012
Figure 13. Temperature profile along z-axis for Vg = 1 V (a) and Vg = 1.5 V (b) for different radius positions and trap density values.
Electronics 12 03673 g013
Figure 14. Temperature profile along z-axis at Vg = 0.5 V and Vd = 1 V for Lg = 100 nm (a) and Lg = 50 nm (b) with different oxide thicknesses.
Electronics 12 03673 g014
Figure 15. Heat flux (left) and temperature (right) profiles along the arc length for r = 2 nm.
Electronics 12 03673 g015
Figure 16. Temperature rise profile as a function of the drain voltages for Vg = 0.5 V.
Electronics 12 03673 g016
Table 1. Node issues and solutions of the different technologies.
NodeBest DeviceIssueSolution
<0.1 µmBulk MOSFETSCE, low drive current
-
Strained SiGe
-
Metal gate
-
High-k dielectric
0.1 µm–32 µmSOI MOSFETPower leakage current
-
Ultra-thin body SOI MOSFET
32 µm–10 nmFinFETSCE are prominent
-
Use of multi-gate material
-
Stacked oxide
<10 nmGAAPower, cost
-
Vertically stacked GAA
-
Work function engineering
-
High–k dielectric
Table 2. Physical and thermal parameters.
Materialsλ (Wm−3K−1)C (MJm−3K−1)ε
Si1501511.8
Al2O3352.8910
Table 3. Parameters description.
ParametersDescription
VVoltage
qElectron charge
ΕSemiconductor permittivity
pHole concentration
nElectron concentration
TTemperature
CVolumetric heat capacity
λThermal conductivity
HHeat source
Jn,pElectron and hole current densities
Dn,pElectron and hole diffusion coefficients
ν n,pElectron and hole drift velocities
Disclaimer/Publisher’s Note: The statements, opinions and data contained in all publications are solely those of the individual author(s) and contributor(s) and not of MDPI and/or the editor(s). MDPI and/or the editor(s) disclaim responsibility for any injury to people or property resulting from any ideas, methods, instructions or products referred to in the content.

