Article

An Innovative Electromechanical Joint Approach for Contact Pair Fault Diagnosis of Oil-Immersed On-Load Tap Changer

1
School of New Energy and Power Engineering, Lanzhou Jiaotong University, Lanzhou 730070, China
2
Institute of Economics and Technology, State Grid Ningxia Electric Power Co., Ltd., Yinchuan 750011, China
3
School of Automation and Electrical Engineering, Lanzhou Jiaotong University, Lanzhou 730070, China
*
Authors to whom correspondence should be addressed.
Electronics 2023, 12(17), 3573; https://doi.org/10.3390/electronics12173573
Submission received: 12 July 2023 / Revised: 16 August 2023 / Accepted: 18 August 2023 / Published: 24 August 2023

Abstract

:
This paper presents a novel fault diagnosis method for oil-immersed on-load tap changers (OLTC) to address the issue of limited diagnostic accuracy. The proposed method combines the analysis of mechanical vibration signals and high-frequency current signals from the contact pair, aiming to improve the precision of fault diagnosis. To begin with, an experimental platform was used to simulate the OLTC contact, enabling the collection of mechanical vibration signals and high-frequency current signals under different operational states. These signals underwent wavelet packet transform for denoising, followed by correlation analysis to investigate their interrelationships across various states. Features were then extracted and analyzed using ensemble empirical mode decomposition and the Hilbert–Huang transform. Subsequently, a support vector machine (SVM) was employed to analyze both the mechanical vibration signal and high-frequency current signal, facilitating the classification of the OLTC contact state. The results demonstrated that the joint analysis of electrical and mechanical signals provided a comprehensive representation of the actual contact state under different conditions. The SVM classification achieved an error below 10% in predicting the values of the two signal types, validating the efficiency and feasibility of the proposed fault diagnosis method for OLTC contacts. The findings presented in this paper offer valuable insights for on-site fault diagnosis of practical OLTCs.

1. Introduction

The on-load voltage regulating a transformer plays a crucial role in power systems by regulating voltage and reactive power flow to ensure smooth operation. The oil-immersed on-load tap changer (OLTC) is a key component of the on-load voltage-regulating transformer responsible for voltage regulation. However, it is prone to wear, spark, and ablation during the tapping process, which can degrade its performance. Statistics show that between 2005 and 2015, faults caused by OLTC performance failure accounted for 20% to 41% of total faults in on-load voltage-regulating transformers, with contact performance failure contributing to over half of these faults [1,2]. Therefore, real-time monitoring and diagnosis of the OLTC contact state are essential for understanding the operational status of on-load voltage-regulating transformers.
Currently, offline hanging core maintenance is the primary method for maintaining OLTC, but it is time-consuming and labor-intensive. To address this, an online monitoring and fault diagnosis technology for OLTCs has emerged, significantly reducing costs and improving maintenance efficiency. Various signal processing and fault diagnosis methods have been proposed by scholars, including hidden Markov chain [3], short-time Fourier transform (STFT) [4], wavelet transform (WT) [5,6], empirical mode decomposition (EMD) [7,8], Hilbert transform (HT) [9,10], K-means cluster analysis [11,12], fuzzy C-means clustering (FCM) analysis [13,14], and others. These methods primarily rely on mechanical vibration signals for fault diagnosis of OLTC, but they have not yielded satisfactory results.
While STFT analyzes vibration signals using time-domain localized window functions, its resolution cannot be optimized simultaneously in the time and frequency domains due to limitations of the window function based on Heisenberg’s uncertainty criterion. WT overcomes this limitation by allowing modifications in the window function with frequency, enabling analysis in the time–frequency domain. However, its analysis results are constrained by the choice of the basic wavelet. EMD is an adaptive signal time–frequency processing method suitable for analyzing nonlinear and nonstationary signals. It addresses WT’s limitations when selecting a basic wavelet and enhances the decomposition accuracy in the time–frequency domain. However, mode aliasing can occur when dealing with vibration signals containing significant pure white noise. K-means clustering analysis is a concise and efficient partition clustering algorithm for analyzing vibration signals, but its results are sensitive to the predetermined number of clusters (K). Fuzzy C-means (FCM) clustering analysis, as the primary method of unsupervised clustering, optimizes clustering results by eliminating the need to predefine the K value compared to K-means clustering. However, it may encounter issues of local optimization during the clustering process. Apart from these algorithms, some deep learning methods are also applied for fault prognosis [15,16]. However, these methods are not applicable for the diagnosis of OLTC contact pairs due to sample limitations.
Existing research methods primarily concentrate on investigating and implementing algorithms for processing mechanical vibration signals or high-frequency current signals. Through enhancements to these algorithms, the accuracy of feature signal detection can be significantly improved, thus enhancing the diagnostic accuracy of the tap changer contact status. However, the field of rotating machinery fault diagnosis has witnessed numerous studies on unifying mechanical and electrical signals with various time scales and physical characteristics as fault features to determine the machinery’s operational status. Unfortunately, the application of such methods in OLTC diagnostic approaches remains scarce. Therefore, this paper proposes a novel fault diagnosis method for OLTC contact by combining mechanical vibration signals and high-frequency current signals. By collecting and analyzing vibration signals and current signals, characteristic parameters related to contact faults can be obtained, enabling effective fault diagnosis and determination. The key advantage of the proposed method is its ability to comprehensively and accurately describe the condition of the moving contact by combining both mechanical vibration signals and high-frequency current signals. Furthermore, the implementation of SVM is straightforward, even when the available condition signals are limited. This combination of techniques enhances the effectiveness of fault detection and diagnosis in OLTC systems.
To validate the proposed method, an experimental platform simulating OLTC contact was established. Different signal states, including mechanical vibration signals and high-frequency current signals, were collected from the platform. Wavelet packet transform (WPT) was employed to denoise these signals, while correlation analysis explored their relationships under various conditions. Features were extracted and analyzed using ensemble empirical mode decomposition (EEMD) and Hilbert–Huang transform (HHT). Finally, a support vector machine (SVM) was used to jointly analyze the mechanical vibration signal and high-frequency current signal, allowing classification of the contact state of OLTC. In summary, the main innovations of this paper are as follows:
(1)
The combination of mechanical vibration signals and high-frequency current signals for OLTC contact fault diagnosis.
(2)
The establishment of an experimental platform to collect comprehensive signal data.
(3)
The application of WPT for denoising and correlation analysis to explore the relationships between signals.
(4)
The utilization of EEMD and HHT for feature extraction and analysis, and the use of SVM for joint analysis and classification of signals, enabling accurate fault diagnosis.
The remainder of this paper is structured as follows. Section 2 describes the experimental setup, while Section 3 outlines the signal acquisition and preprocessing procedures as well as basic signal collection of the OLTC. The process for signal feature extraction is presented in Section 4. In Section 5, a comprehensive analysis of the results is provided. Finally, the conclusions drawn from this study are summarized in Section 6.

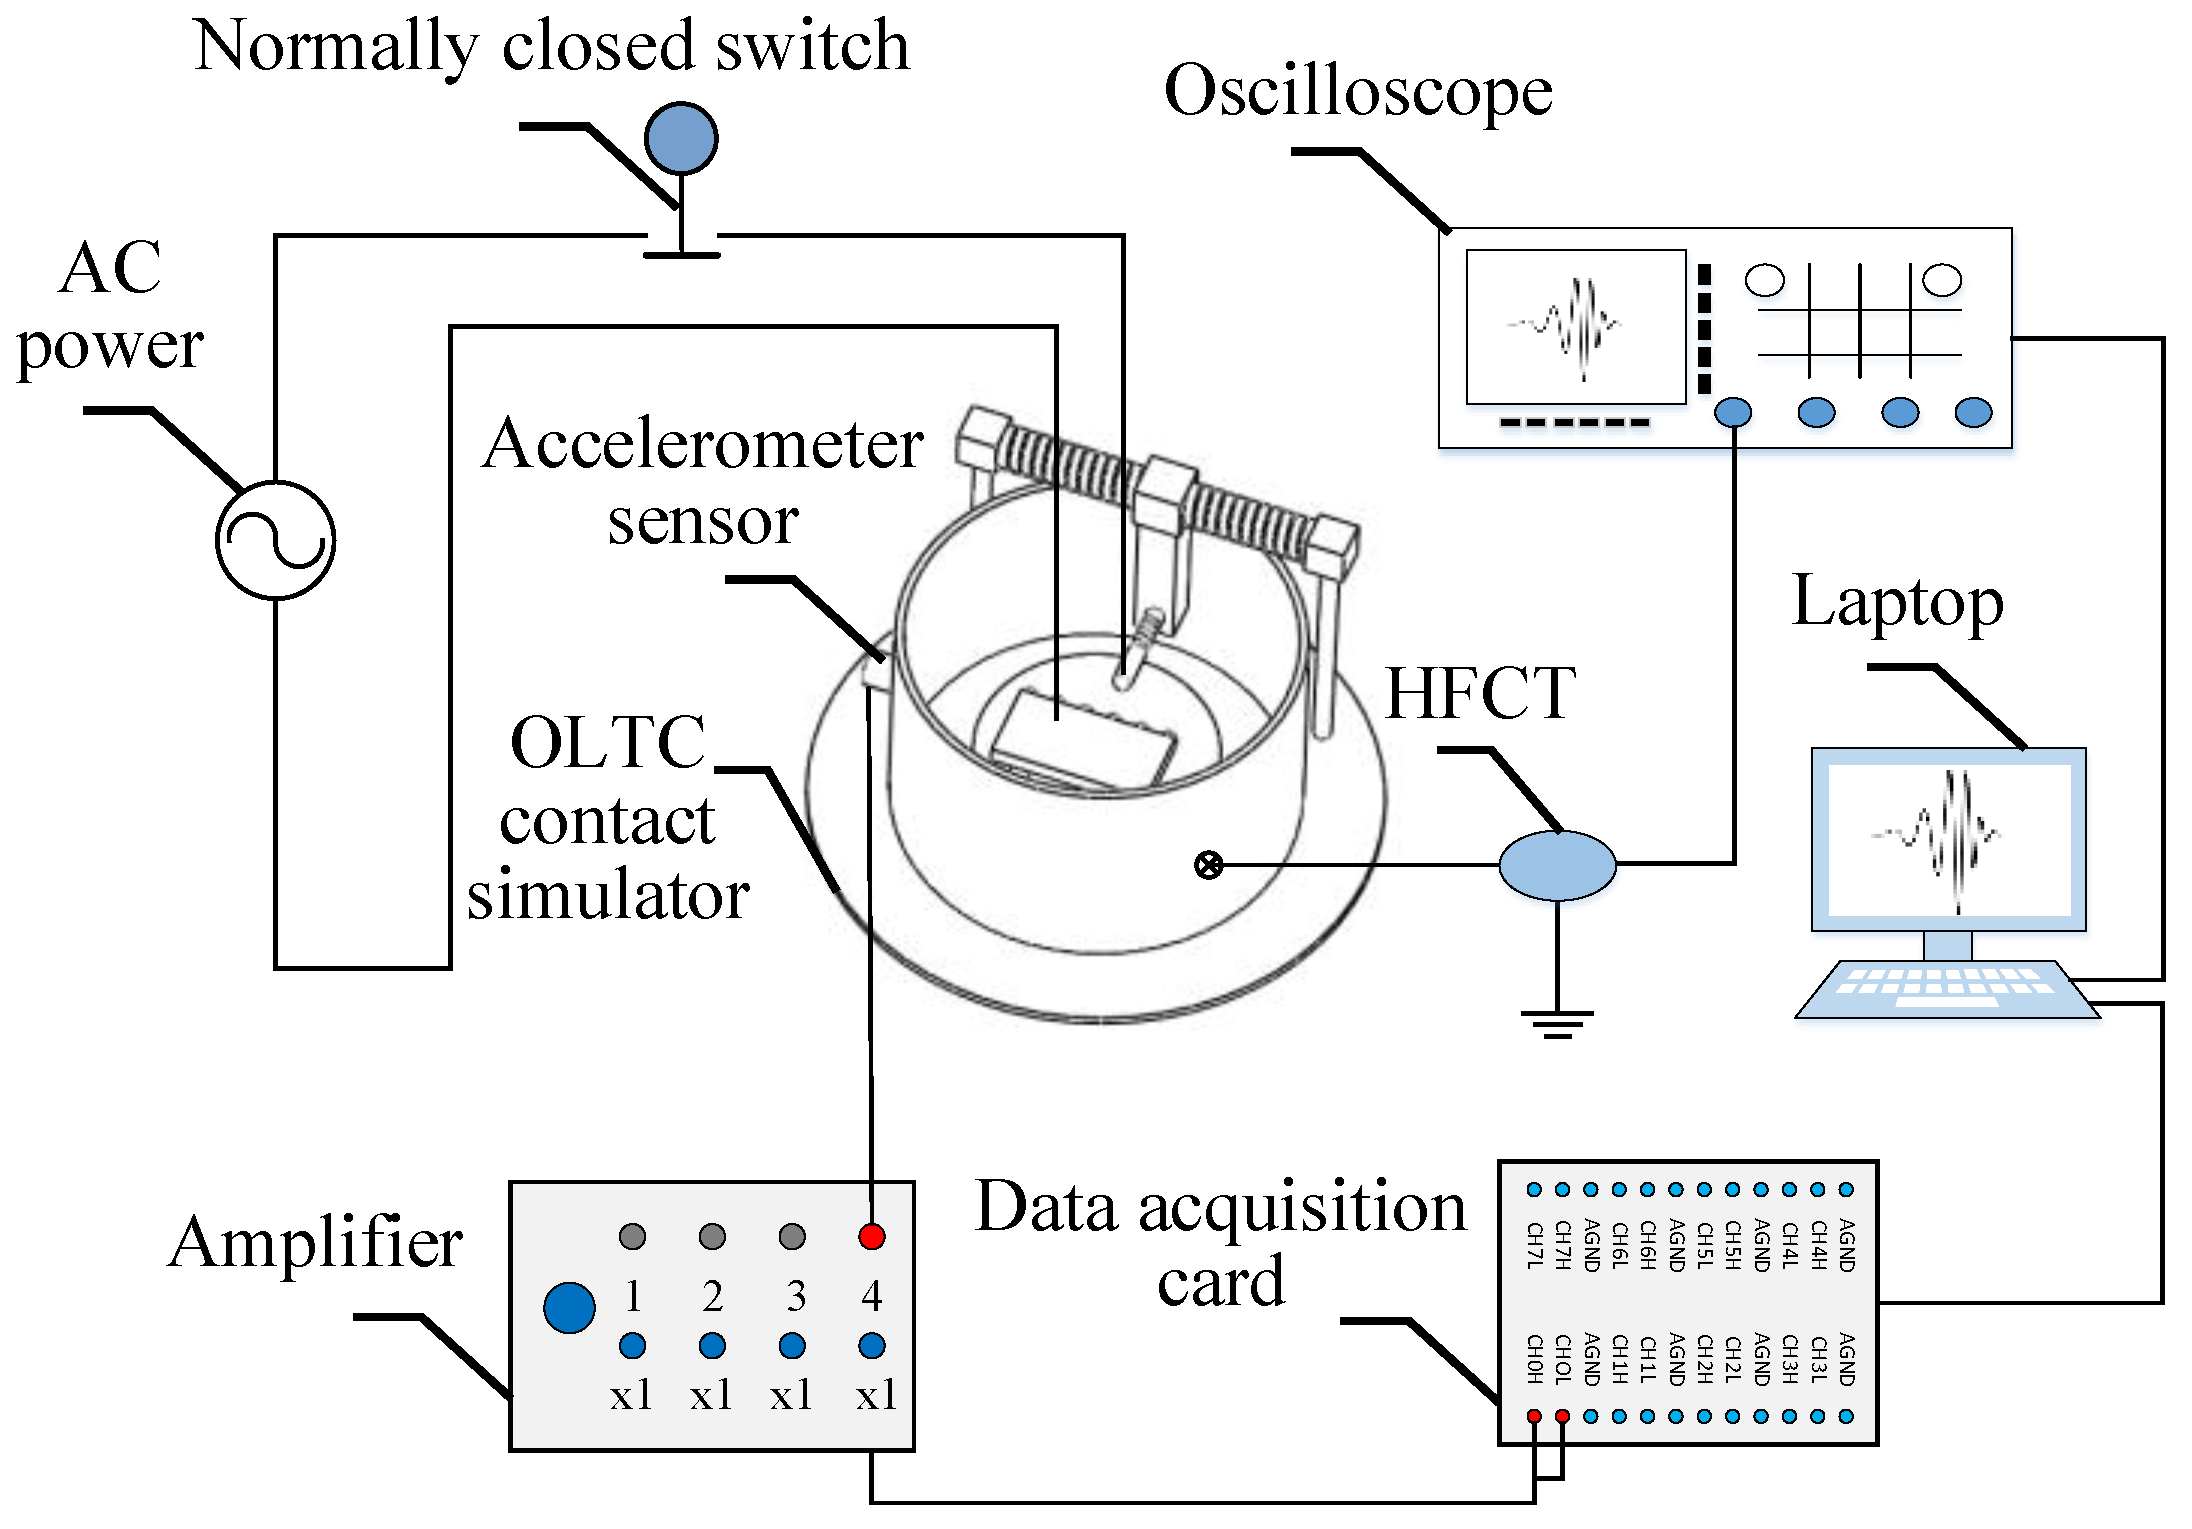
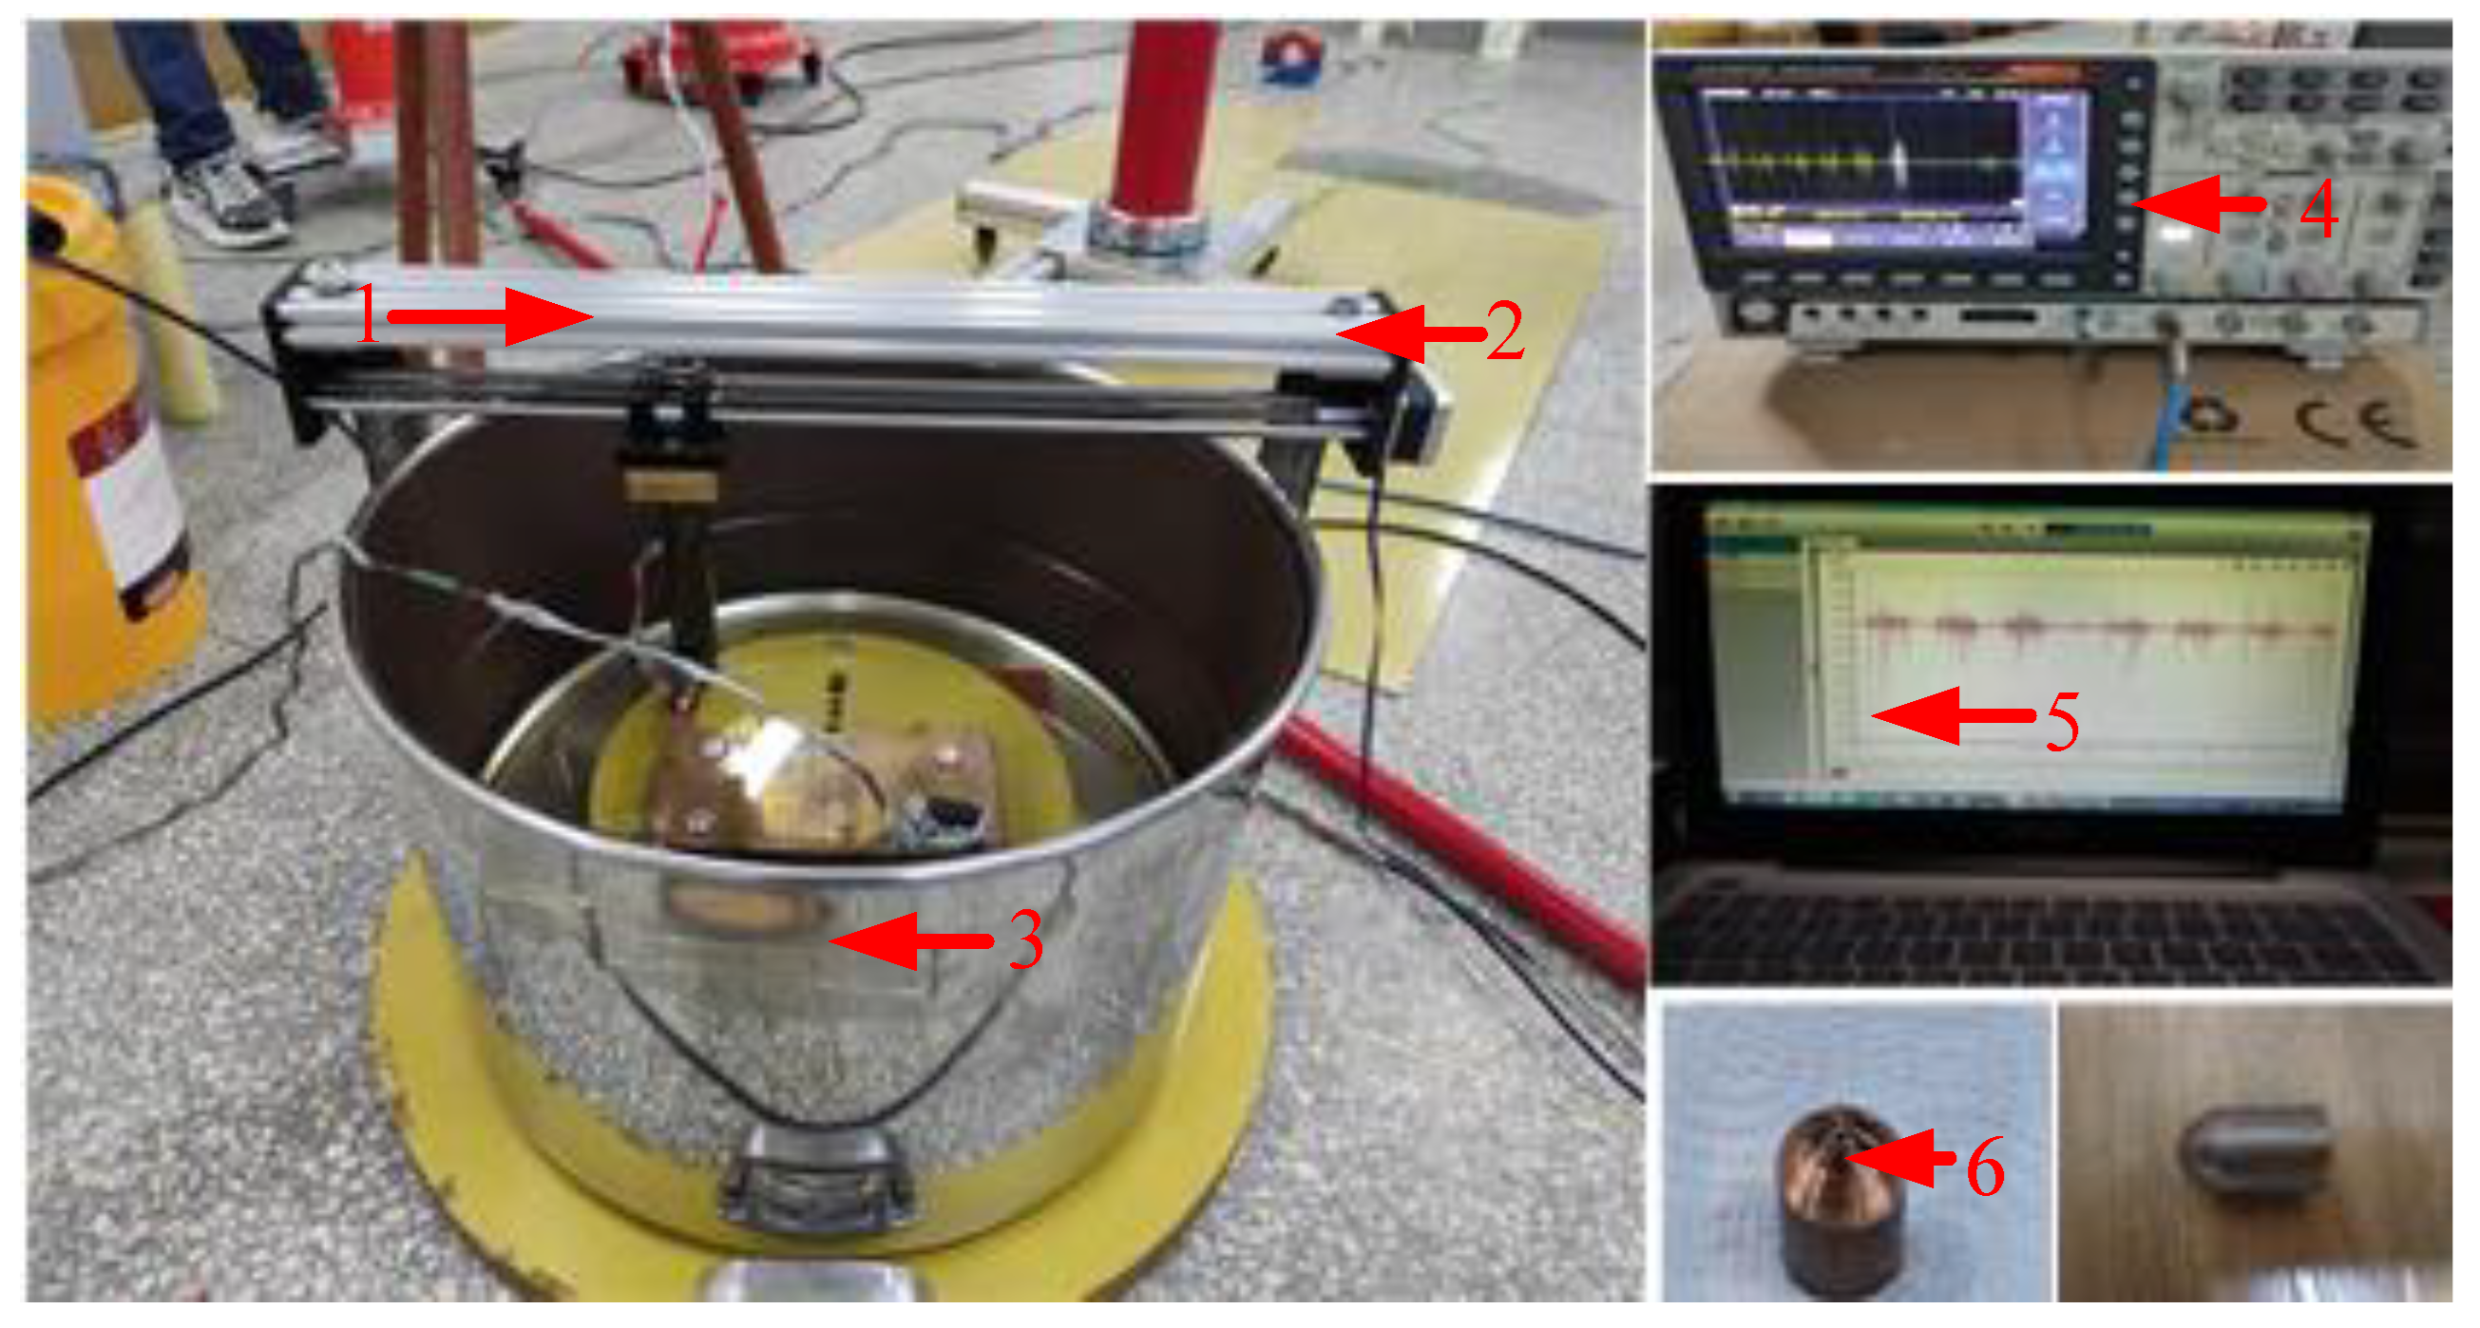
2. Experimental Setup

The oil-immersed OLTC serves as a crucial component in voltage-regulating transformers, facilitating the operation of voltage regulation. Its primary function is to adjust the turns ratio on the high-voltage side of the transformer by switching between dynamic and static contacts. This adjustment allows the desired voltage regulation outcome to be achieved. However, with an increase in the number of voltage regulation cycles, faults such as loosening and wearing begin to emerge within the OLTC contacts. Additionally, during the tapping process, both the moving and static contacts of the OLTC experience characteristics of sliding electrical contact while carrying current, which can lead to spark generation and ablation. To accurately simulate the structure and internal environment of an oil-immersed OLTC, we constructed an experimental platform using a simulated OLTC contact device. The contacts within this device were fabricated from a silver copper alloy containing 2% silver to closely mimic actual OLTC contacts. The transmission medium used within the oil tank of the experimental platform was Karamay 25 mineral oil, which is commonly employed in on-site transformer oil tanks. Furthermore, insulating paper was affixed to the inner wall of the oil tank in order to replicate the conditions found in practical scenarios. Consequently, we achieved the construction of a laboratory test system capable of simulating the genuine operation of an OLTC, as illustrated in Figure 1. The system included the following:
(1)
A contact switching device.
(2)
A data acquisition system.
Details of the two parts are described as follows.
Based on the experimental platform of an OLTC contact simulation device, the mechanical vibration signals and high-frequency current signals under four simulated states (normal, loose, slight wear, and severe wear) were collected at the same time. Firstly, three CT1005LC accelerometer sensors were evenly installed on the outer wall of the simulation device at a spacing of 120°, and the height was kept horizontal with the position of moving and static contacts so as to collect mechanical vibration signals under various states. Secondly, a CT5204 amplifier was used to power the accelerometer sensors and amplify the collected mechanical vibration signal. Then, an MCC1608G data acquisition card was used to convert the amplified mechanical vibration analog signal into digital signal. Finally, it was transmitted to the laptop through the data line for storage and analysis. For the acquisition of high-frequency current signals, firstly, the high-frequency current transducer (HFCT) was installed on the grounding cable of the experimental platform of the OLTC contact simulation device to collect high-frequency current signals in four states. Secondly, the high-frequency current signal collected by HFCT was transmitted to an MDO-2204 oscilloscope for display through a BNC cable. Finally, the oscilloscope transmitted the high-frequency current signal to the laptop through the USB data line for storage and analysis. The physical image of the OLTC contact simulation device is shown in Figure 2. For precision moving control of the OLTC contact pair and denoising, the method proposed in [17] is referenced in this paper.

3. Signal Acquisition and Preprocessing

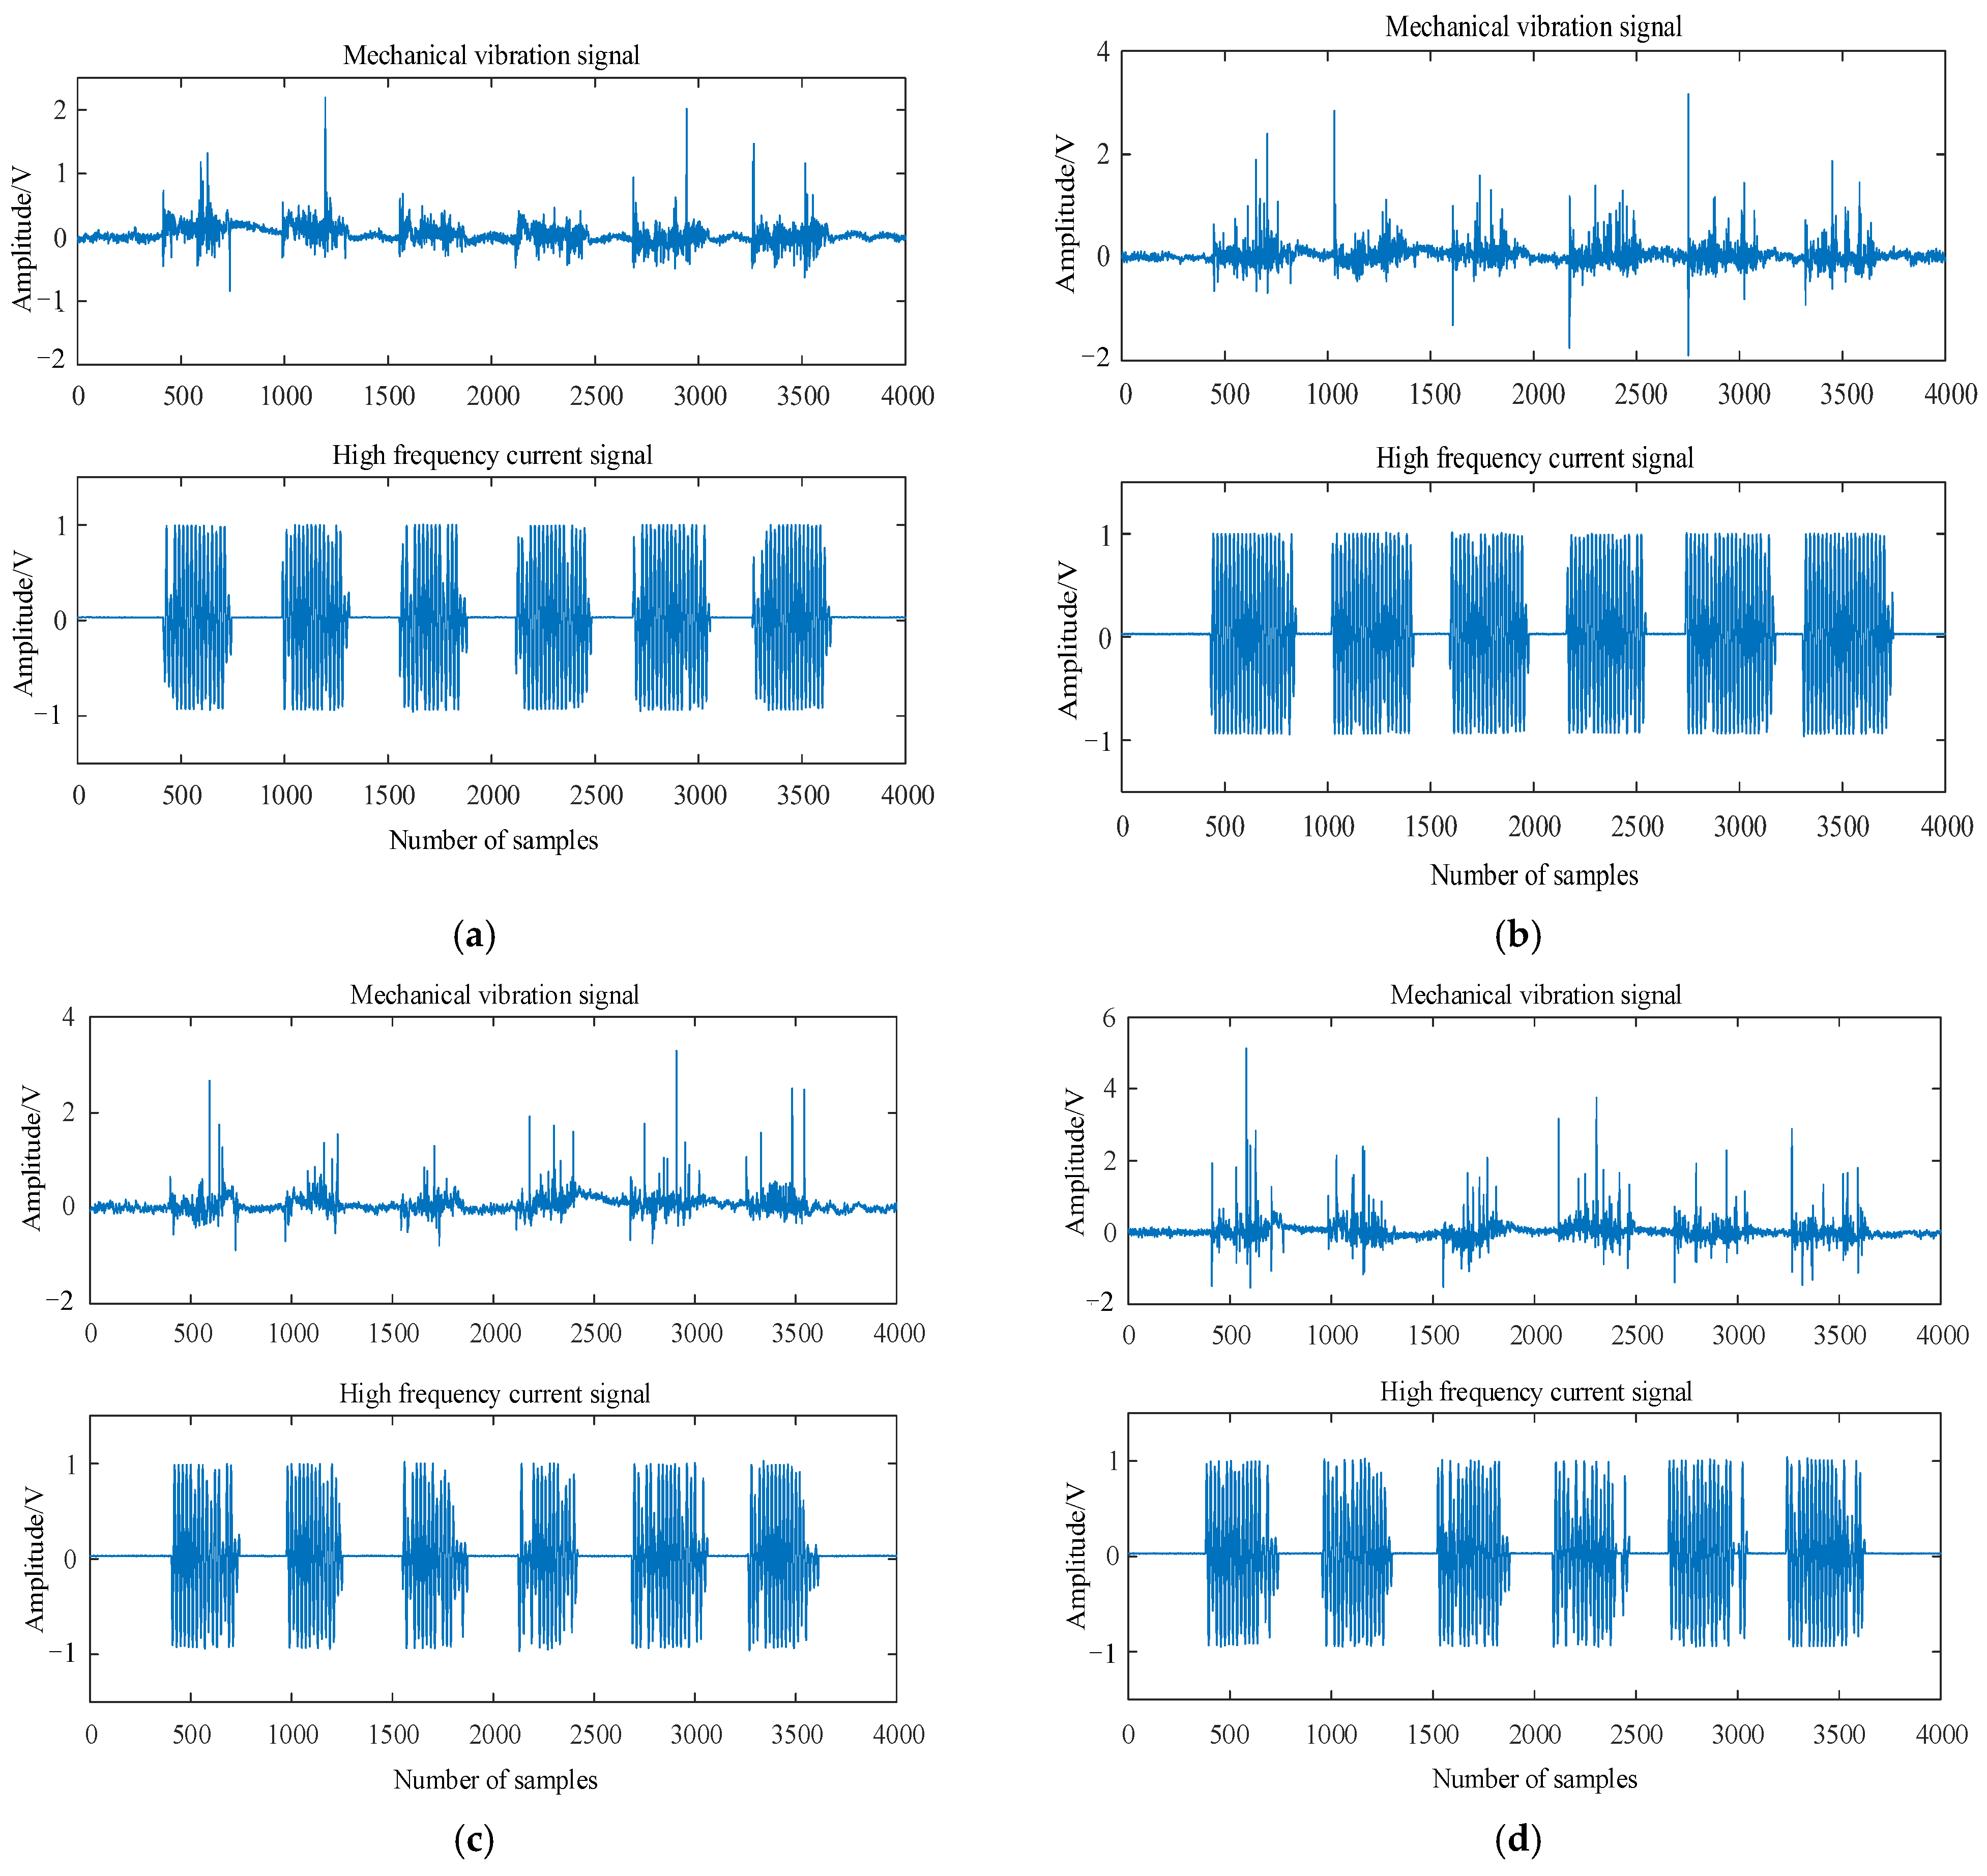
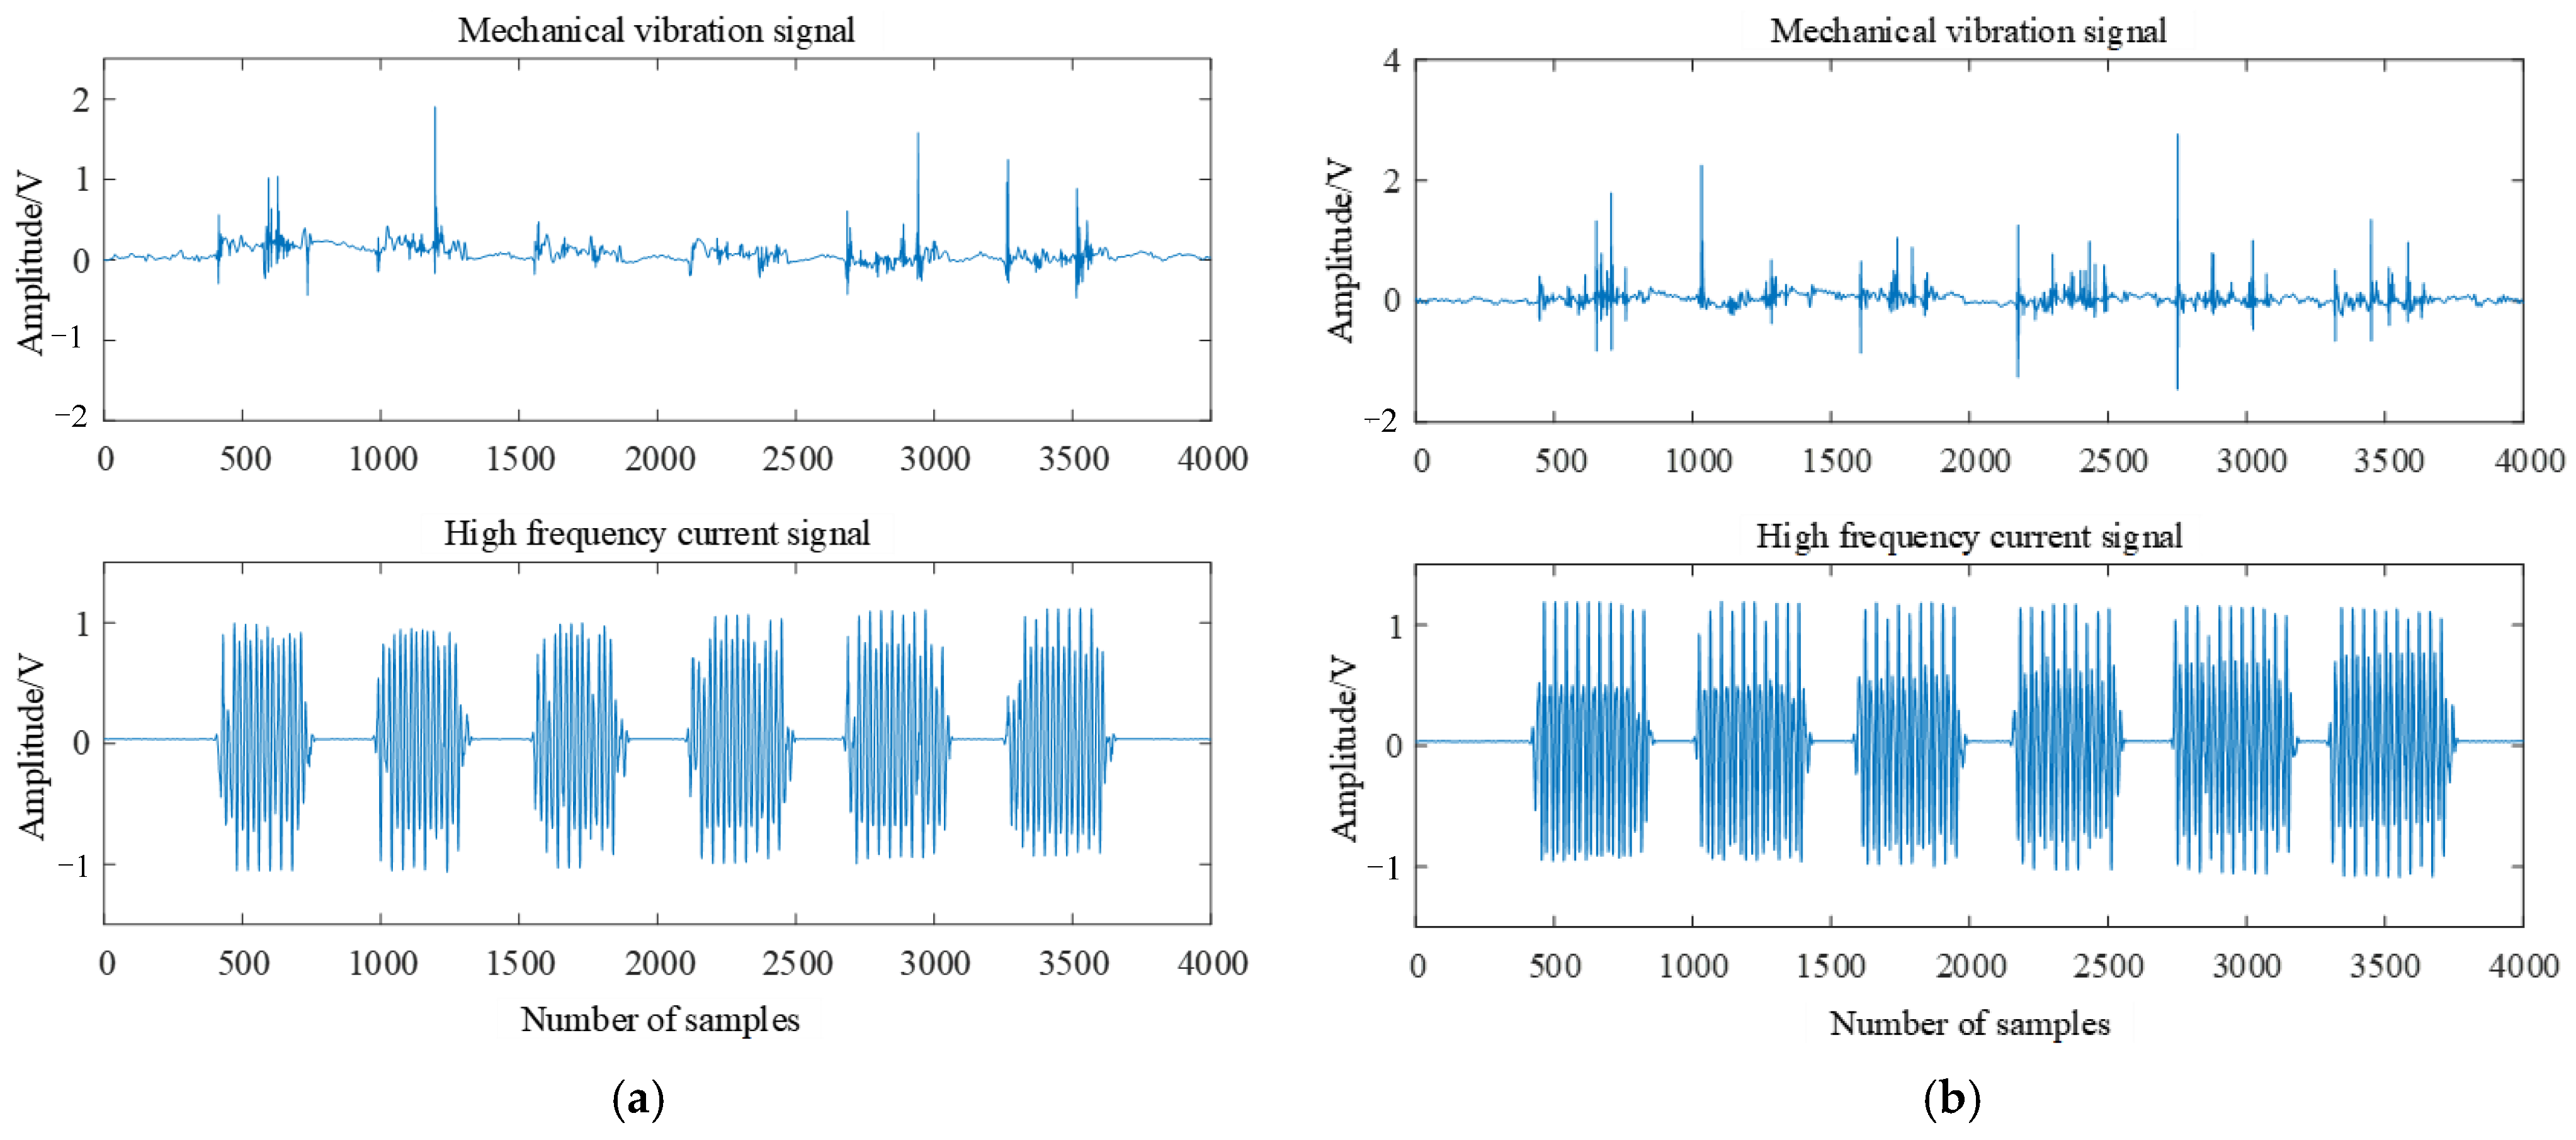
3.1. Signal Acquisition

Utilizing the experimental platform of the OLTC contact simulation device, we conducted simulations to replicate various states of the OLTC contact. Firstly, we manually loosened the contact to simulate the loose state. Next, the single-chip microcomputer control system was programmed to automatically switch the moving and static contacts back and forth for 3000 cycles, imitating the state of slight wear on the OLTC contacts. Furthermore, to replicate the severe wear fault state, the contacts were automatically switched for 10,000 cycles. During each state of the OLTC contact (normal, loose, slight wear, and severe wear), we collected both the mechanical vibration signal and high-frequency current signal simultaneously. To accomplish this, we employed a vibration acceleration sensor and a high-frequency current transformer (HFCT) to capture the mechanical vibration signal and high-frequency current signal generated during the switching process of the moving and static contacts within the experimental device. The collected mechanical vibration signal was then amplified by an amplifier and converted from analog to digital using a data acquisition card. Subsequently, the digitized signal was saved to a laptop via a transmission line. Similarly, the high-frequency current signal was collected using the HFCT and displayed on an oscilloscope before being saved to the laptop. Finally, the electromechanical signals collected in all four states were concurrently analyzed on the laptop. The signals obtained for the different states are presented in Figure 3.

3.2. Signal Preprocessing

Due to the limitation of the experimental environment, the collected mechanical vibration signal and high-frequency current signal were affected by white noise and pulse interference. In order to improve the accuracy of OLTC contact fault diagnosis, wavelet packet transform (WPT) was used to denoise the two kinds of signals. WPT is a signal processing algorithm based on WT optimization. It solves the problem of WT not being able to decompose high-frequency components and improves the processing ability of nonlinear and nonstationary signals.
Let x(t) be a signal whose corresponding decomposition coefficient is pln. G and H are the wavelet decomposition filters. G is related to the wavelet function, and H is related to the scale function. The mathematical expression is (1)~(3) [18,19,20,21,22]:
p 0 1 ( t ) = x ( t )
p l 2 n 1 ( t ) = k H ( k 2 t ) p l 1 n ( t )
p l 2 n ( t ) = k G ( k 2 t ) p l 1 n ( t )
where t = 1, 2, 3, …, 2L−l; n = 1, 2, 3, …, 2l; L = log2N. Through the above analysis, the frequency fs of the original signal will be decomposed by WPT in n-layers, and the frequency domain is divided into 2n segments.
The corresponding frequency information of each decomposition is [0, fs/2n], [fs/2n, (2fs)/2n], …, [(k−1)fs/2n, (2kfs)/2n], …, [(2n−2)fs/2n, (2n−1)fs/2n], [(2n−1)fs/2n, fs]. The p generated by decomposition is the wavelet packet coefficient, and the original data of the signal are taken as the lowest wavelet packet coefficient. If there are many frequency signals, the signals of each frequency band can be decomposed as long as n is large enough. Secondly, by selecting the appropriate threshold and threshold function, the high-frequency component generated by decomposition is threshold quantized. Through repeated comparative experiments, this study finally selected the heuristic threshold heursure and the threshold function ddencmp. Finally, the low-frequency component and the quantized high-frequency component were reconstructed as a whole to obtain the denoised signal, as shown in Figure 4.
As shown in Figure 4, when the OLTC contact evolved from normal state to serious wear fault state, the amplitude of the mechanical vibration signal gradually increased and the signal component became more and more complex. The amplitude of the high-frequency current signal remained basically unchanged, but the characteristic component of high-frequency current signal was gradually missing.

3.3. Relevance Analysis

In order to describe the relevance between the signals collected under various states when the OLTC contact evolves from the normal state to the fault state, it is necessary to analyze the relevance of the two types of signals collected by the OLTC contact under four states. In mathematical statistics, the related coefficient is −1 ≤ r ≤ 1, and the greater the r value, the higher the relevance between the two signals. The related coefficient is defined as follows [23]:
r = n x y x y n x 2 x 2 n y 2 y 2
where r represents the related coefficient; x and y represent two sets of signal data sets in different states; and n represents the number of samples in the data sets.
In this paper, x specifically represents the mechanical vibration signal data sets and high-frequency current signal data sets collected by OLTC contacts under normal conditions, and y represents the mechanical vibration signal data sets and high-frequency current signal data sets collected by OLTC contact under loose, slight wear, and severe wear conditions. The relevance analysis results are shown in Table 1.
The analysis showed that with the increase of OLTC contact fault degree, the relevance between the collected mechanical vibration signal and high-frequency current signal in fault state and its corresponding signal in normal state gradually decreased. With the aggravation of the fault degree of the OLTC contact, the characteristic components of the collected mechanical vibration signal and high-frequency current signal in the normal state and the characteristics of the collected mechanical vibration signal and high-frequency current signal in the fault state increased gradually.

4. Signal Feature Exaction

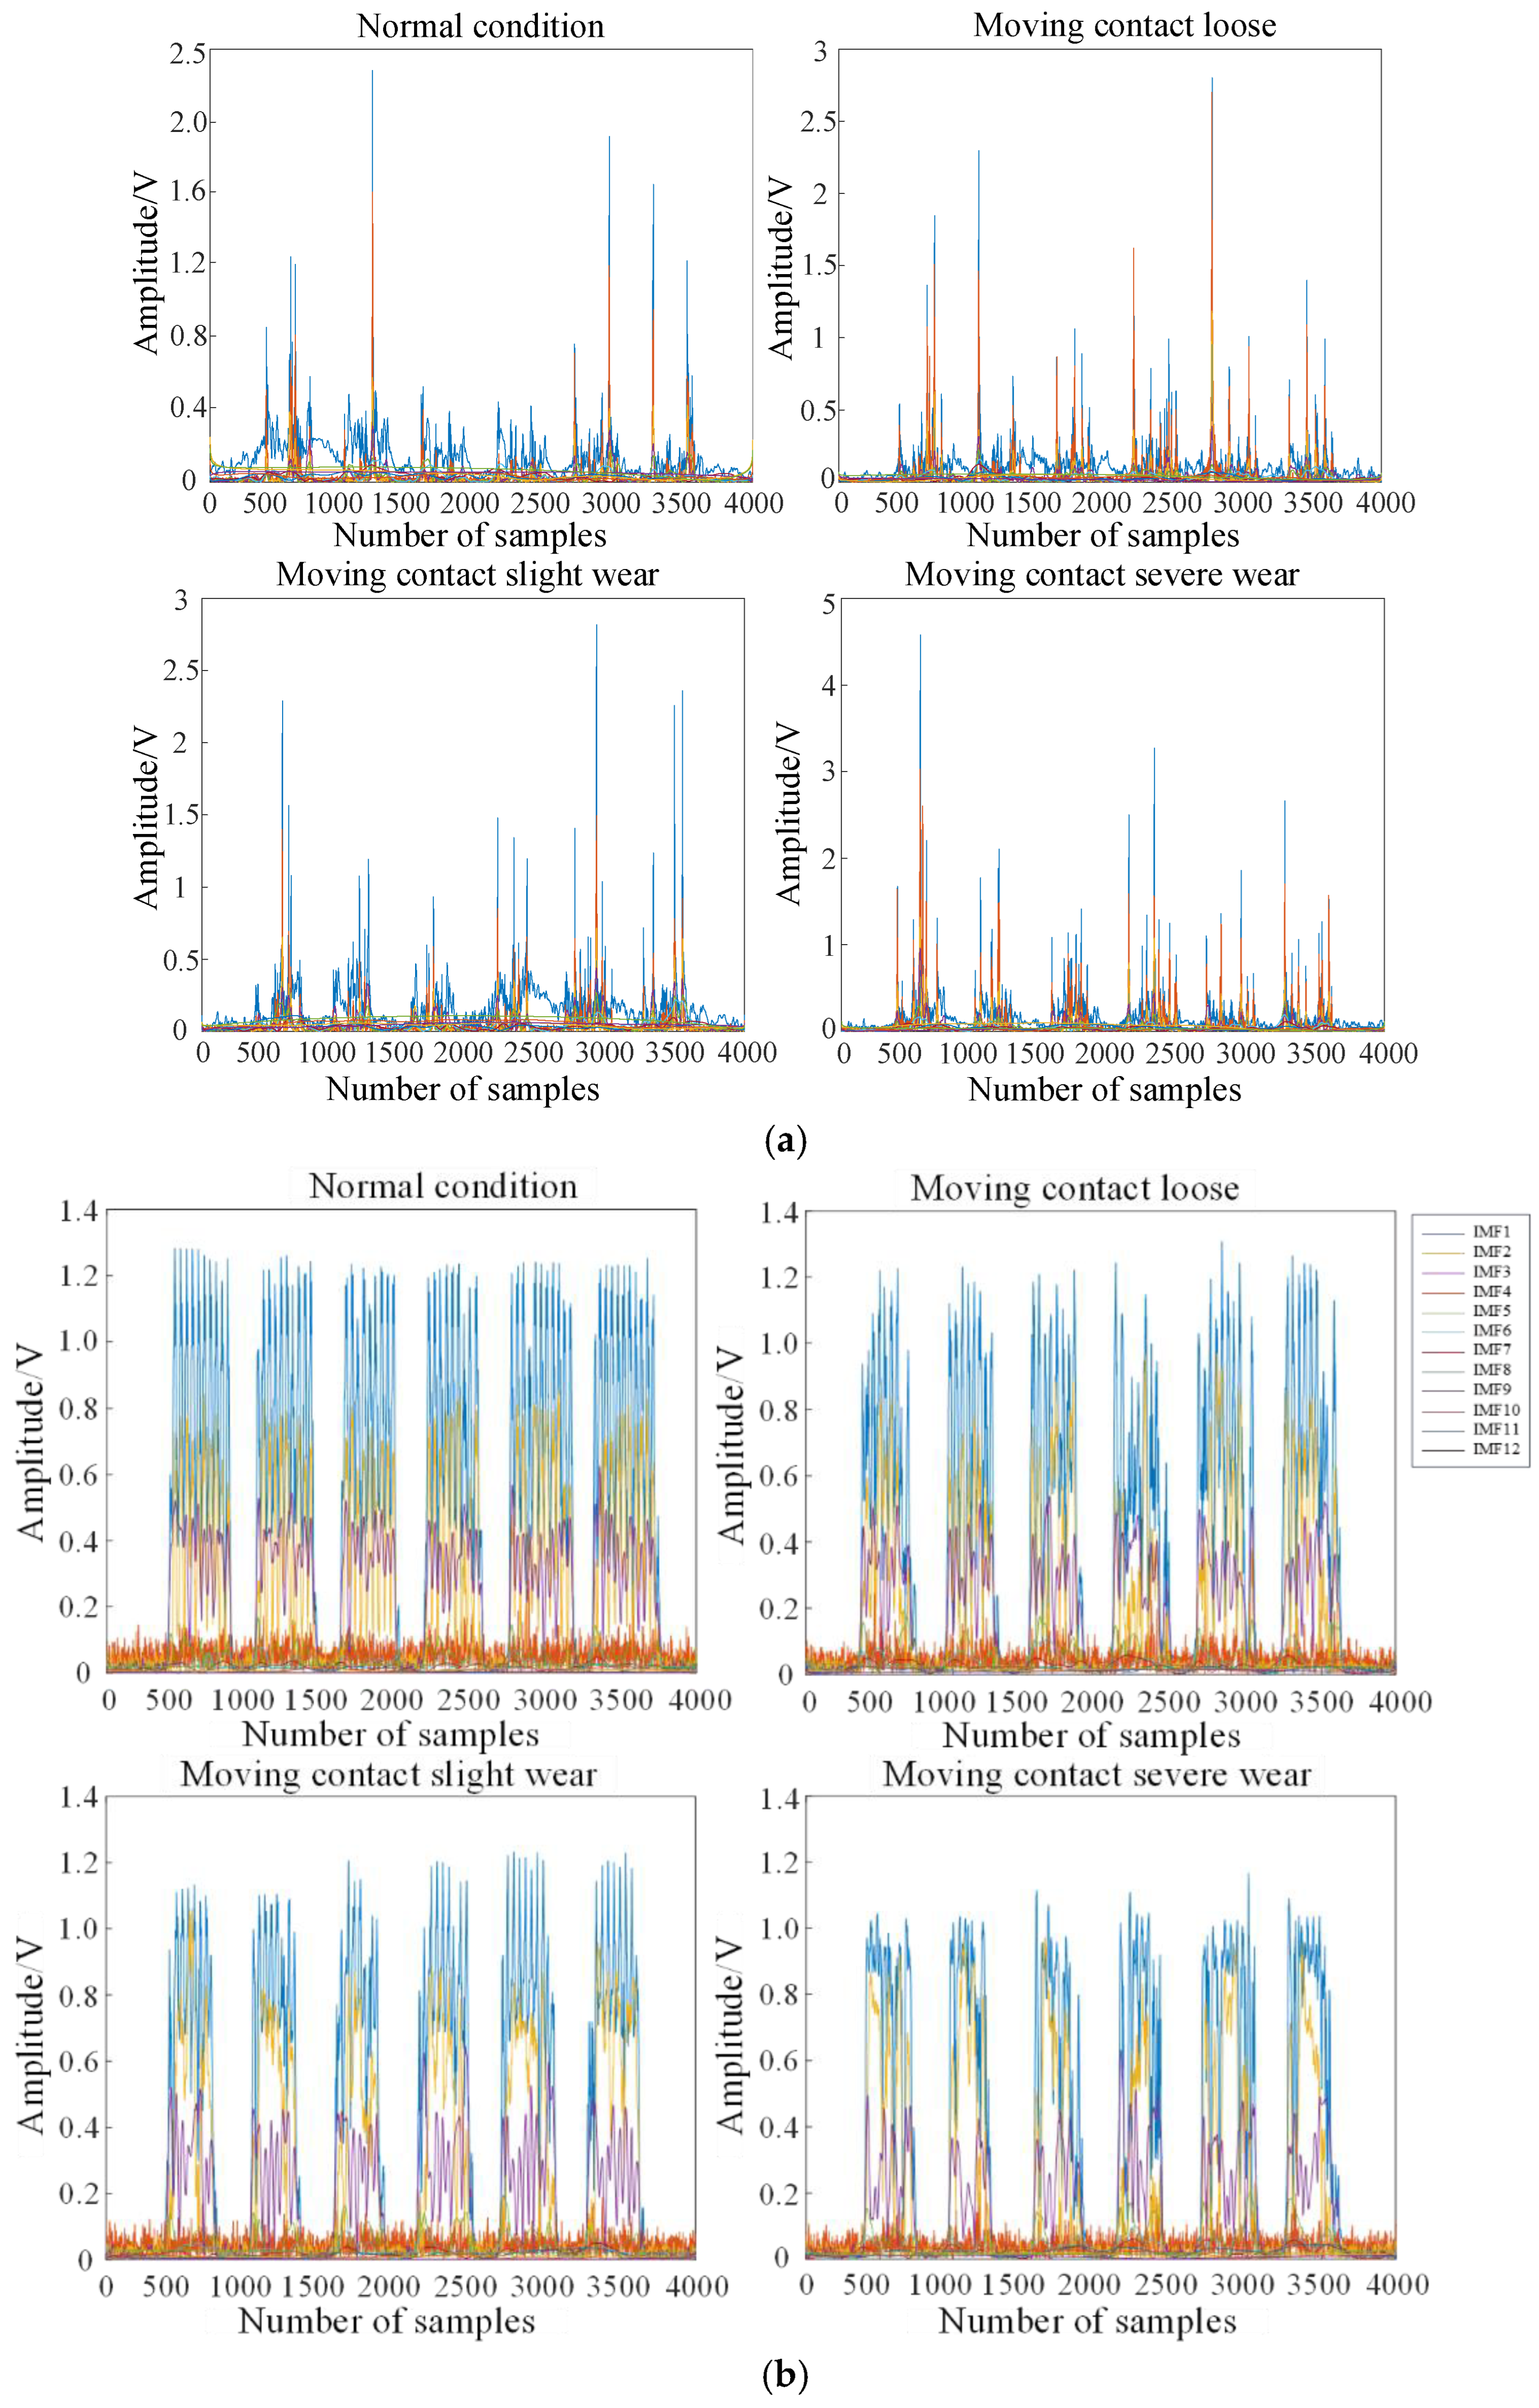
4.1. EEMD-Based Signal Decomposition

EEMD is an improved signal decomposition method based on EMD. It adds evenly distributed white noise to the original signal and ensures that the white noise added in each independent test is different. Several independent tests are then carried out, and the average value of all tests are calculated to cancel the noise contained in the signal. Therefore, EEMD can better improve the mode aliasing problem when EMD decomposes the signal to improve the feature extraction accuracy of the signal. The steps of EEMD signal processing are as follows [24,25,26]:
Add the white noise signal ni(t) to the original signal x(t), i.e.,
x 1 ( t ) = x ( t ) + n i ( t )
Decompose the added white noise signal x1(t) to generate intrinsic mode function (IMF), i.e.,
x 1 ( t ) = j = 1 n c 1 j + r 1 n
Add different white noise signals in each independent test and repeat step 1 and step 2 n times, i.e.,
x i ( t ) = j = 1 n c i j + r i n
Calculate the mean value of each IMF obtained by n-times decomposition and take it as the final result, i.e.,
c j = 1 n i = 1 n c i j
where n is the number of times to add white noise, c is the IMF value, and r is the decomposition residual component.

4.2. HT-Based Signal Feature Extraction

Hilbert–Huang transform (HHT) comprises two main techniques, namely, empirical mode decomposition (EMD) and Hilbert transform (HT). The objective of HHT is to decompose nonlinear, nonstationary signals into intrinsic mode functions (IMFs) using EMD, followed by extracting the instantaneous frequency of the signal using HT. To address the issue of mode aliasing during the EMD signal decomposition process, ensemble empirical mode decomposition (EEMD) was employed as a replacement, enhancing the accuracy of feature extraction. The optimized process of HHT for signal feature extraction was as follows.
Firstly, the mechanical vibration signal and high-frequency current signal, after undergoing noise reduction, were separately decomposed using EEMD, resulting in the extraction of IMF components.
Secondly, HT was applied to each IMF component, and the absolute value of the transformed signal was obtained, representing its upper envelope (refer to Figure 5). Figure 5 illustrates that as the OLTC contact transitioned from a normal state to a fault state, the amplitude of the mechanical vibration signal gradually increased and the signal components became more complex. The amplitude of the high-frequency current signal and the fundamental frequency component, represented by the purple portion, remained relatively unchanged. However, the characteristic components, depicted by the blue and yellow portions of the signal, gradually decreased.
Then, HT was used to decompose the IMF component using the following formula, and the corresponding Hilbert time–frequency spectrum was obtained [27], as shown in Figure 6.
H ( ω , t ) = Re i = 1 n a i ( t ) e j ω i ( t ) d t
It can be seen from Figure 6 that when the OLTC contact evolved from the normal state to the fault state, the frequency of the mechanical vibration signal was mainly concentrated in 0~450 Hz, the signal component became more complex, and the energy corresponding to its frequency gradually increased. The frequency of the high-frequency current signal was mainly concentrated between 0 and 100 Hz. Its corresponding energy amplitude remained basically unchanged, but the frequency component decreased gradually.
Finally, the Hilbert time–frequency spectrum was integrated on the time axis using the following formula to obtain the Hilbert marginal spectrum [28], as shown in Figure 7.
h ( ω ) = 0 T H ( ω , t ) d t
where T is the length of the signal sequence; H(ω,t) is the relationship among signal amplitude, frequency, and time in the whole frequency range of the signal; h(ω) is the relationship between signal amplitude and frequency in the whole frequency range of the signal.
It can be seen from Figure 7 that when the OLTC contact evolved from the normal state to the fault state, the energy amplitude of the mechanical vibration signal gradually increased from 62.41 to 96.41 mV. The energy amplitude of the high-frequency current signal gradually increased from 64.13 to 97.91 mV, and the energy amplitude of the mechanical vibration signal and high-frequency current signal was mainly concentrated between 0 and 100 Hz.
The Hilbert marginal spectrum energy value is E(ω), and it can be finally obtained through (11) [29]:
E ( ω ) = ω 1 ω 2 h 2 ( ω ) d ω
where ω1 and ω2 are the Hilbert marginal spectrum h(ω) frequency ranges.
The energy value was normalized, and the Hilbert marginal spectrum energy entropy was defined according to the basic principle of information entropy, which can be expressed by the following formula [29]:
H j = ε j log ε j
where εj is the ratio of the IMF component energy to total energy in the j layer.
By calculating the Hilbert marginal spectrum energy entropy of the mechanical vibration signal and high-frequency current signal and inputting it as mechanical characteristic quantity and electrical characteristic quantity into the SVM algorithm for OLTC contact state diagnosis, the partial Hilbert marginal spectrum energy entropy of the electromechanical signal are shown in Table 2 and Table 3.
The analysis of Table 2 and Table 3 reveals a noteworthy trend in the behavior of oil-immersed OLTC contacts as they progressed from a normal state to a fault state. The Hilbert marginal spectrum energy entropy, calculated through HHT, gradually decreased for both the mechanical vibration signal and high-frequency current signal. This decline can be attributed to the fact that, under normal conditions, the energy distribution of these signals is relatively even and uncertain.
However, in the presence of faults, such as loose contacts or wear, the mechanical vibration signal and high-frequency current signal resonate within their respective frequency bands. Consequently, the energy becomes concentrated in these particular frequency bands, leading to a reduction in the uncertainty of the marginal spectrum energy distribution. As a result, the marginal spectrum energy entropy decreases.
It is important to note that the degree of fault in OLTC contacts due to wear is more severe compared to that caused by loose contacts. This increased severity leads to a higher concentration of energy in the corresponding frequency band, resulting in even lower marginal spectrum energy entropy. Based on these findings, the marginal spectrum energy entropy obtained through HHT can serve as an informative input vector for the SVM algorithm. This approach enables the identification of the operational state and type of fault in oil-immersed OLTC contacts.

5. Result Analysis and Discussion

5.1. Analysis of Generation and Propagation Process of Electromechanical Signal

In order to extract the feature quantity that can truly reflect the information contained in the mechanical vibration signal and high-frequency current signal, this study used EEMD to decompose the mechanical vibration signal and high-frequency current signal after noise reduction.
When there is a change in the load of the on-load voltage-regulating transformer, it becomes necessary to adjust the OLTC and modify the number of winding turns on the high-voltage side of the transformer to ensure voltage stability at the output. The OLTC operates by sliding the electrical contacts, resulting in a tapping process that generates mechanical vibration signals due to collision and wear between the moving and static contacts. Additionally, the opening and closing of these contacts can create the arc phenomena, leading to the generation of high-frequency current signals. However, it is important to note that mechanical vibration signals can also arise from the core and winding vibrations within the transformer. Furthermore, in a laboratory environment, the collected mechanical vibration signals and high-frequency current signals may exhibit complex components due to the presence of white noise and pulse interference. Therefore, it holds great significance to analyze the propagation process of these two types of signals and preprocess the collected mechanical vibration signals and high-frequency current signals to reduce noise levels.
Firstly, the driving motor drives the OLTC to switch between the moving and static contacts, which then produces the arc phenomenon, and the mechanical vibration signal and high-frequency current signal are generated at the same time. The generated mechanical vibration signal will not reach the inner wall of the oil chamber until it propagates for a certain distance in the insulating oil in the OLTC oil chamber. Because the oil chamber wall is relatively smooth, the vibration signal will be catadioptric when it reaches the oil chamber wall from the mineral oil in the oil chamber, which makes the vibration signal more complex. However, the damping of the mineral oil in the oil chamber can reduce the complexity of the vibration signal to a certain extent. When the vibration signal passes through the oil chamber wall and reaches the insulating oil in the transformer oil tank, catadioptric reflection will also occur, and the vibration of the iron core and winding during the transformer operation will also produce vibration signals in the transformer oil tank. Therefore, the components of vibration signals collected outside the transformer oil tank by the vibration acceleration sensor are more complex. When the moving and static contacts of OLTC are tapped, the arc phenomenon will occur. The high-frequency current signal can be collected by installing HFCT on the grounding cable of an on-load voltage-regulating transformer. Then, the collected high-frequency current signal can be transmitted to an MDO-2204 oscilloscope for display by a BNC cable. Finally, the oscilloscope transmits the high-frequency current signal to the laptop through the USB data line for storage and analysis. In addition, the arc generated by the switching operation of the OLTC moving and static contacts will decompose the mineral oil in the oil chamber, resulting in C2H2, H2, C2H4, and other fault gases, which will degrade the mineral oil in the OLTC oil chamber, reduce the insulation degree of mineral oil, affect its arc-extinguishing effect and the transmission of mechanical vibration signal, and increase the complexity and acquisition difficulty of the mechanical vibration signal. Therefore, it is of great significance to denoise the collected mechanical vibration signal and high-frequency current signal.

5.2. OLTC Contact Fault Classification Based on SVM

In order to diagnose the fault state of the OLTC contact, this study adopted the SVM algorithm with the characteristics of high efficiency and high classification accuracy in small sample data processing to analyze the mechanical vibration signal and high-frequency current signal at the same time [30,31,32]. In this study, the Hilbert marginal spectrum energy entropy of the electromechanical signal was taken as the input characteristic of SVM, and the relative energy amplitude was taken as the output of SVM. According to the experimental scheme, 20 groups of mechanical vibration signals and high-frequency current signals were collected in different states, with each type of signal corresponding to four states, making up a total of 160 groups of data. The overall experimental data samples were small, which could fully utilize the advantages of SVM in the classification and processing of small sample data.
SVM is a supervised learning method for solving binary classification problems. It has the characteristics of good generalization and ability to avoid falling into the local minima. Its basic principle is to map the input space to the high-dimensional space according to the principle of structural risk minimization and find an optimal hyperplane for classification so as to maximize the difference of training data samples [33]. The SVM algorithm includes two parts: data training and data testing. Its data training strategy is to maximize the interval of feature space, which can be transformed into a linear constrained convex quadratic programming problem. Suppose the data training set T = {xi, yi}, where (i = 1, 2, …, l), xiRN, and yiR. By nonlinear mapping Φ, the data set xi can be mapped to the high-dimensional feature space F by a kernel function [34]. Then, the given data are analyzed by constructing a linear discriminant function f.
In the process of diagnosis, 120 groups of experimental data were selected for the training of the SVM algorithm, and the remaining 40 groups of data were used for test classification. Therefore, the experimental data ratio between the training set and test set was 120:40 (3:1). According to the Hilbert time–frequency spectrum and Hilbert marginal spectrum, electromechanical signals have different energy amplitudes at the same frequency, so the relative energy amplitude was used to distinguish the state of the OLTC contact. Because the input dimension of the SVM algorithm in this study was 3, the output dimension was 1, and the number of samples was small, the Gaussian kernel function was adopted. After many comparisons, the penalty factor C = 50 was obtained. Before the numerical test, all data sets were standardized and preprocessed using the maximum–minimum standardization method shown in Equation (13). Finally, the SVM algorithm was applied to train and test the mechanical vibration signal and high-frequency current signal at the same time. The results are shown in Figure 8. In this Figure, the dotted ellipse and corresponding arrow indicate the misclassified sample.
x = x x min x max x min
Based on the analysis in Figure 8, the SVM algorithm demonstrated accurate identification of the normal state and severe wear fault state of the OLTC contact based on the mechanical vibration signal. Despite some misclassification of individual data samples in the loose state and slight wear state of the OLTC contact, the overall accuracy of fault identification remained high at 92.97%. Regarding the high-frequency current signal, SVM also achieved accurate identification of the normal state and severe wear fault state of the OLTC contact. Although there were misclassified data samples during the loose state and slight wear state, the number of misclassifications was lower compared to the classification based on mechanical vibration signals. As a result, the overall accuracy of fault identification was relatively high at 93.15%. When considering the fault classification results obtained from both the mechanical vibration signal and high-frequency current signal simultaneously using the SVM algorithm, it was observed that although a small number of data was misclassified, they primarily occurred in adjacent regions, with only a few isolated data points crossing boundaries. Hence, these errors were considered acceptable within the allowable range. The classification accuracy of both signals exceeded 90%, thereby validating the feasibility and efficiency of the proposed method in this study.
In practical applications, an accelerated sensor can be utilized to measure vibration signals by attaching a magnetic sensor to the outer surface of the actual OLTC. Similarly, a high-frequency current transducer can be employed to collect current signals by clamping it onto the low-voltage side of the transformer bushing. These collected signals can then undergo preprocessing using ensemble empirical mode decomposition and Hilbert–Huang transform, followed by programming. Additionally, the condition classification of the OLTC contact pair can be easily programmed and implemented. As a result, the proposed method is both feasible and straightforward to deploy on-site.

6. Conclusions and Future Work

In this study, we utilized an experimental platform designed for simulating OLTC contacts. By deploying vibration acceleration sensors and high-frequency current transformers (HFCTs), we simultaneously collected mechanical vibration signals and high-frequency current signals from OLTC contacts in four distinct states. Subsequently, we applied noise reduction preprocessing and feature extraction techniques to the collected signals. Our objective was to diagnose faults in the OLTC contacts by integrating the mechanical vibration and high-frequency current signals. The results obtained revealed the following key findings:
(1)
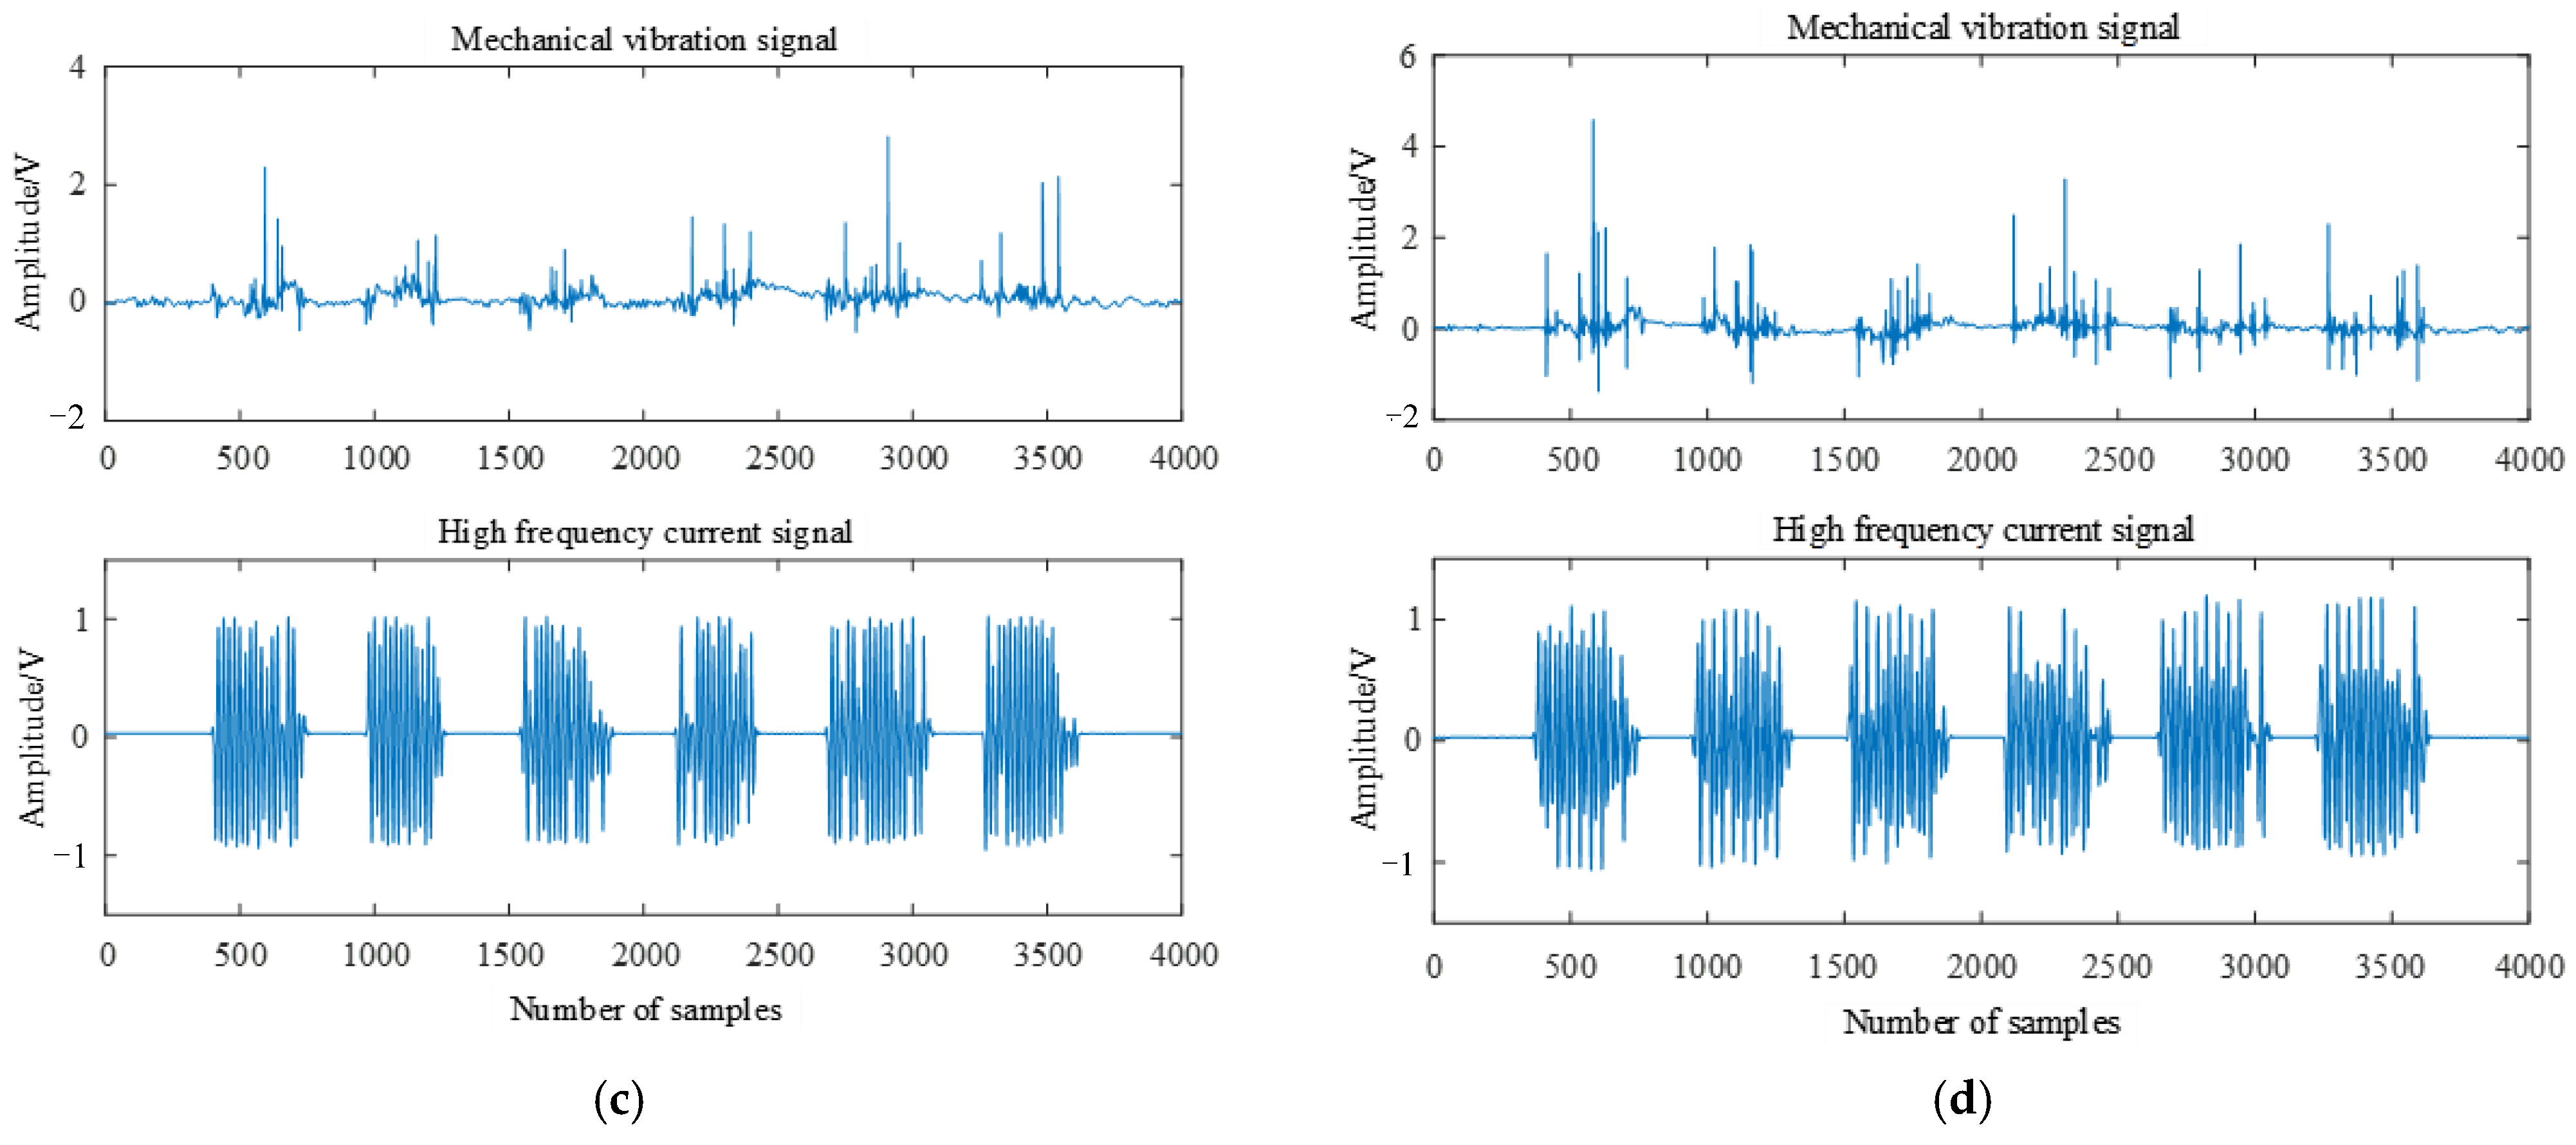
As the OLTC contact transitioned from a normal state to a fault state, the amplitude of the mechanical vibration signal gradually increased, while the characteristic components of the high-frequency current signal gradually diminished.
(2)
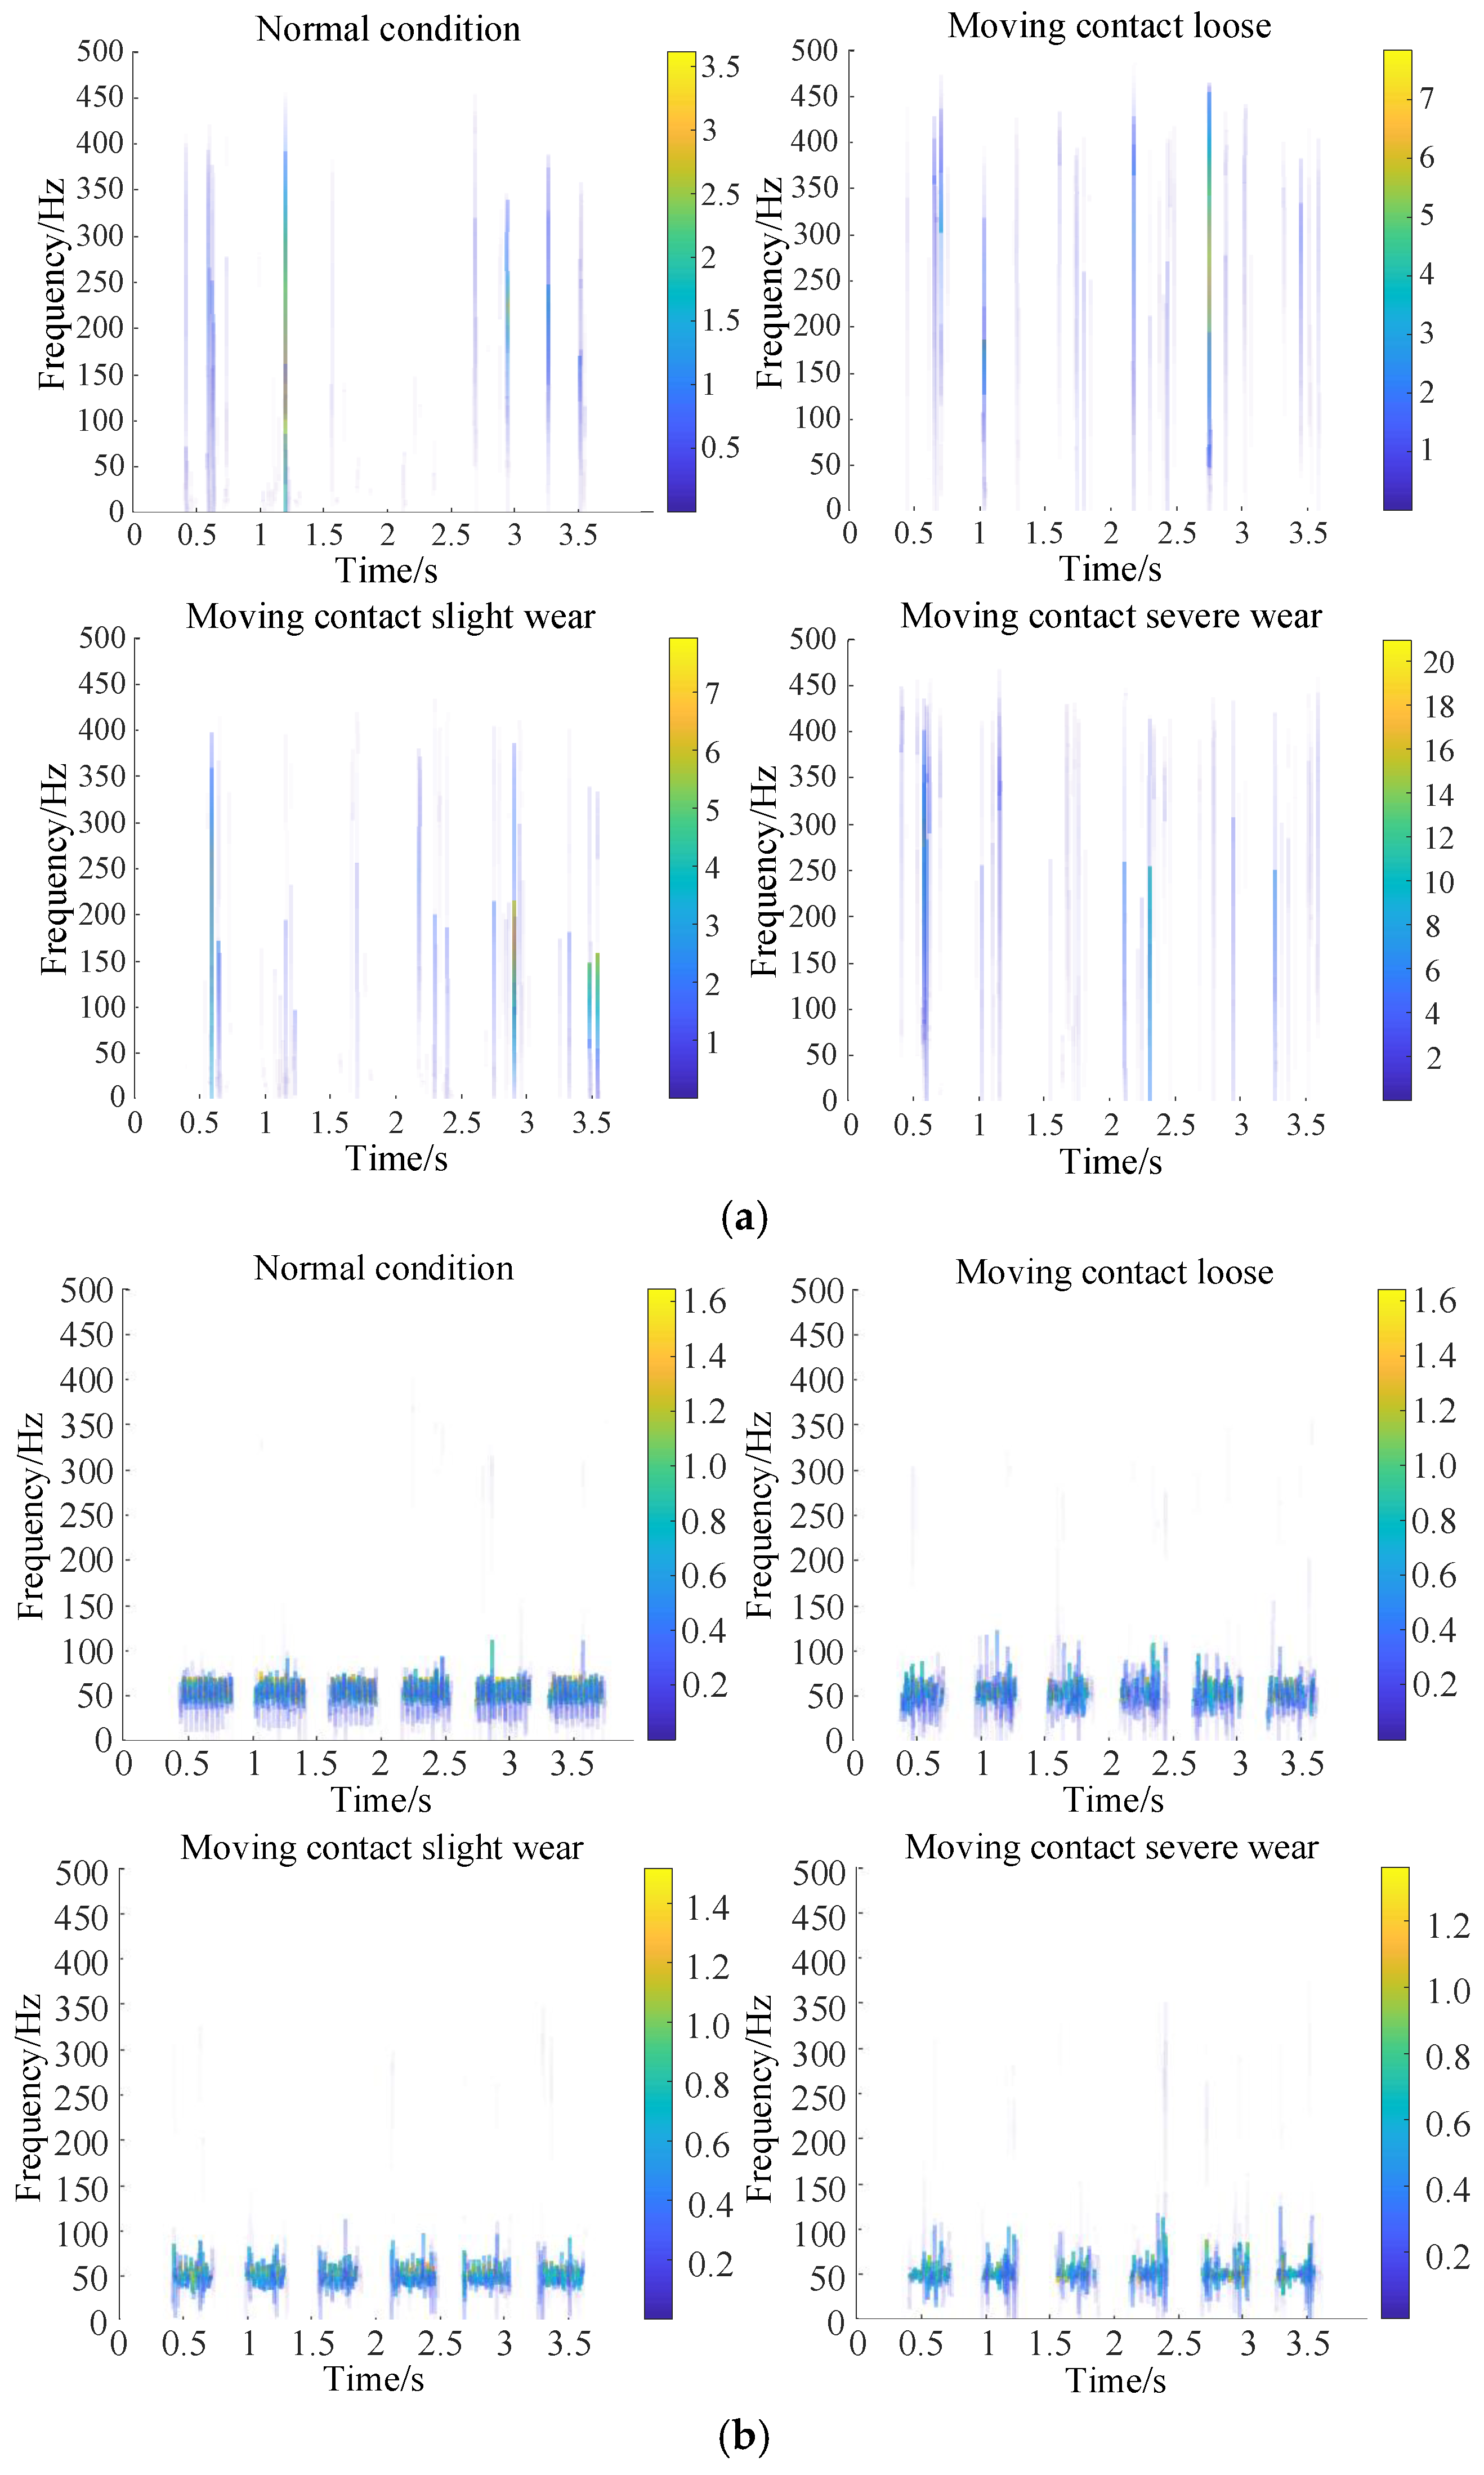
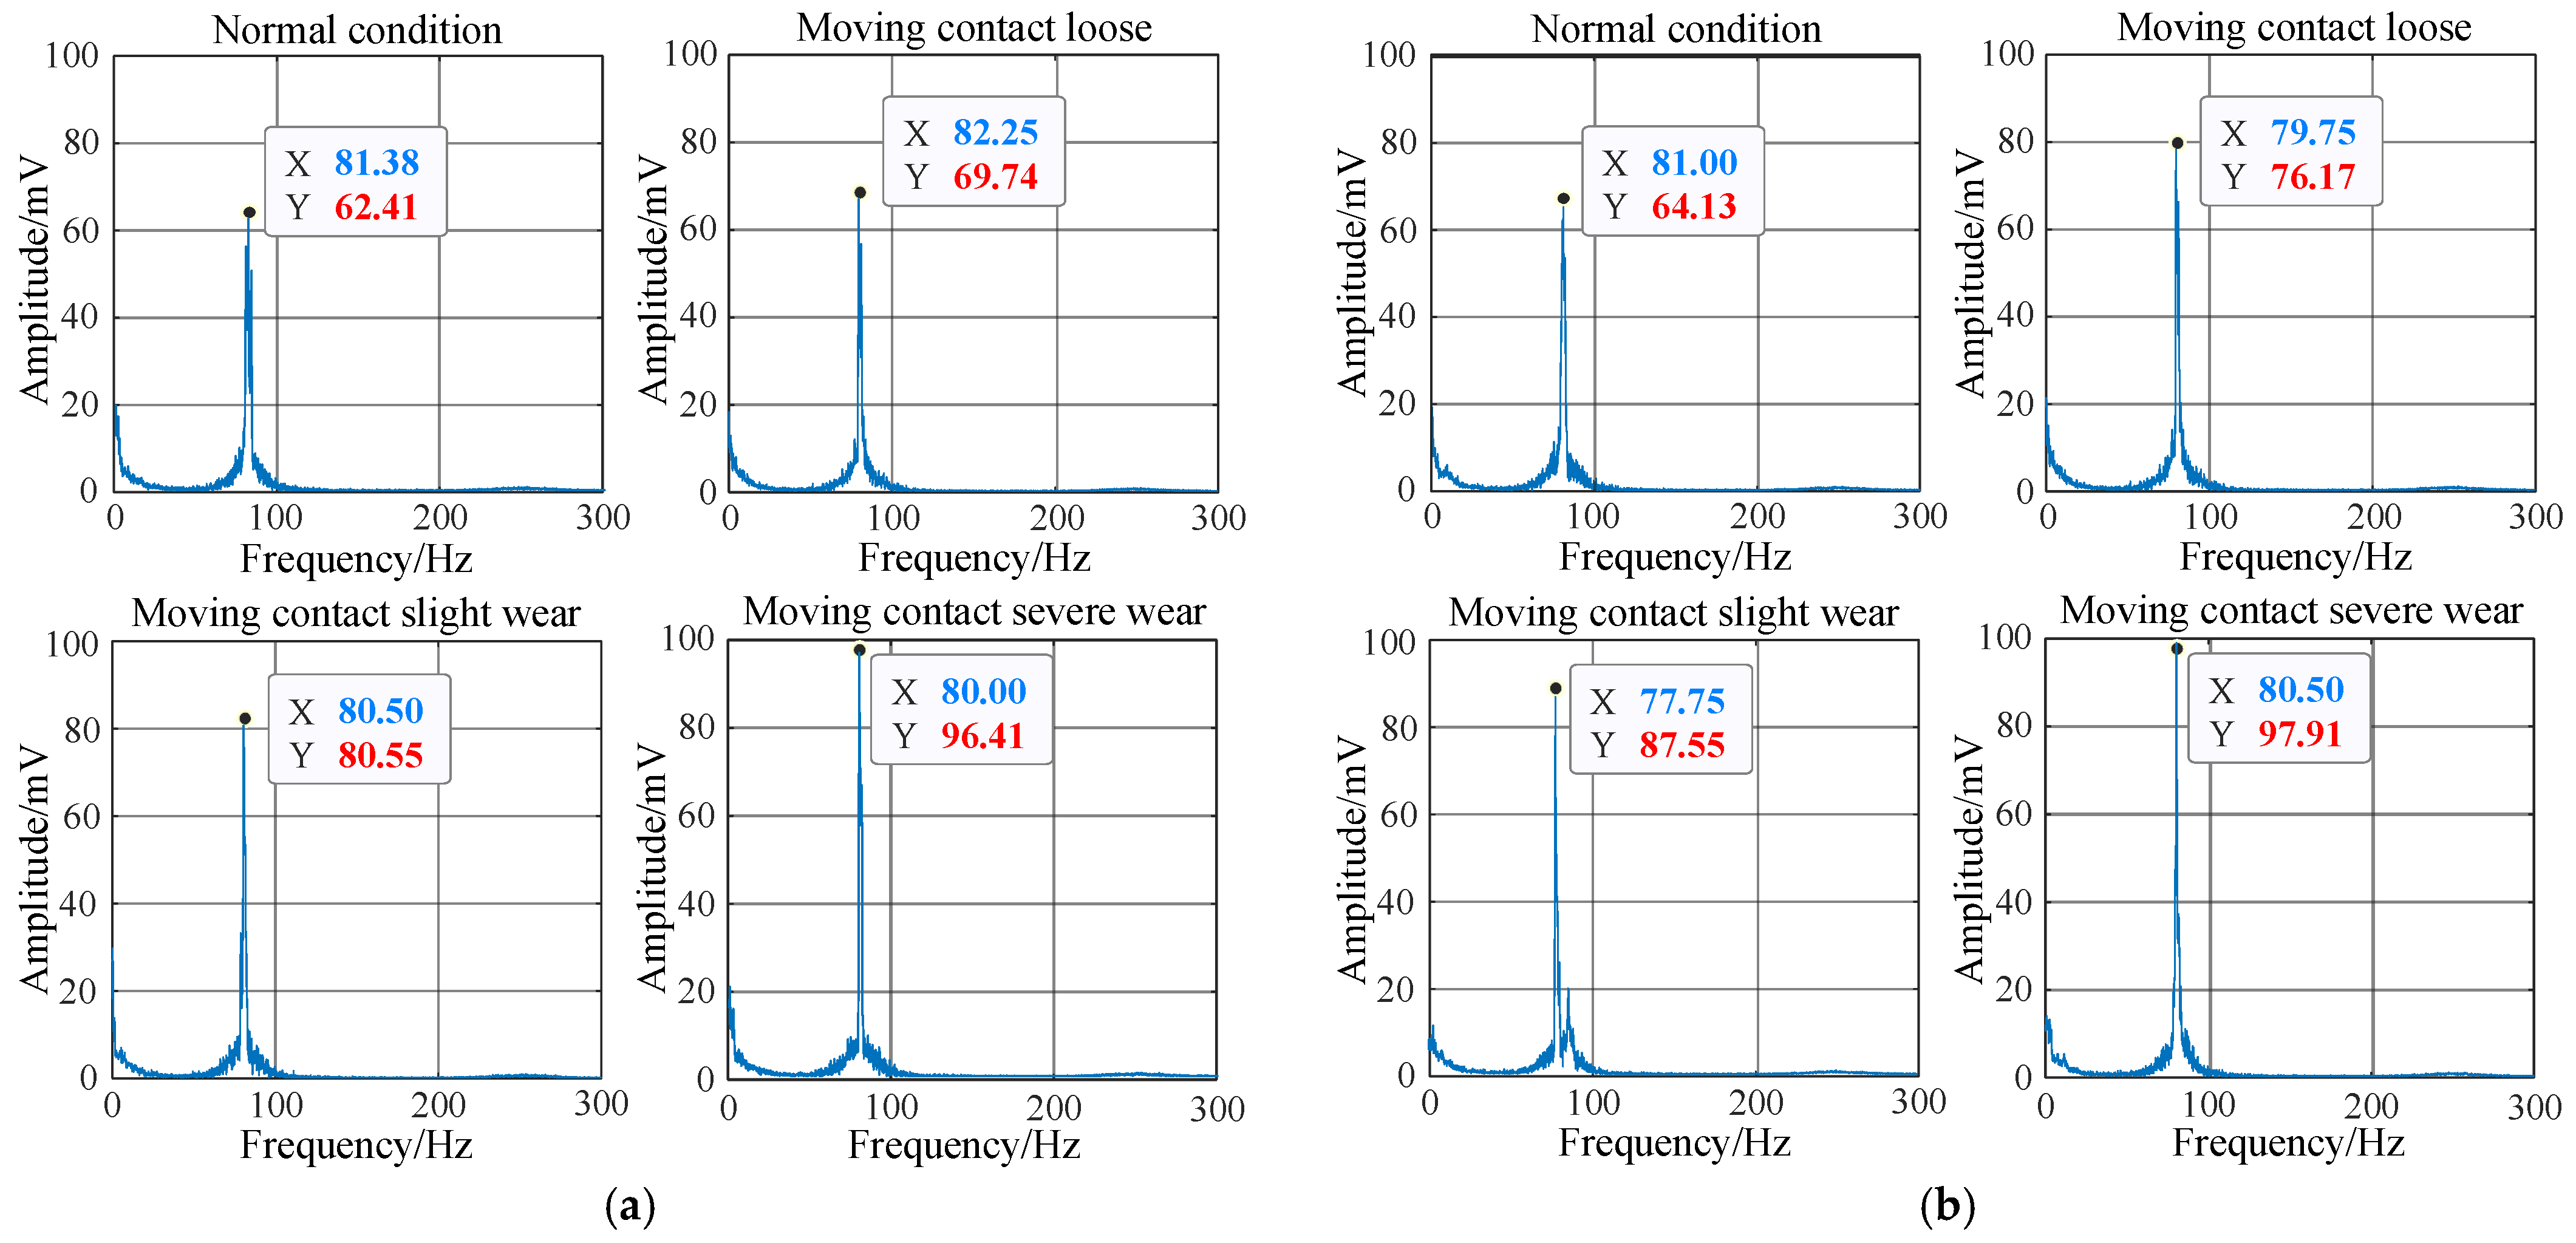
Analysis of the Hilbert time–frequency spectrum and Hilbert marginal spectrum demonstrated that the frequency range of the mechanical vibration signal was mainly concentrated between 0 and 450 Hz when the OLTC contact progressed from a normal state to a fault state. Additionally, the energy corresponding to the frequency of the mechanical vibration signal gradually increased. Similarly, the frequency range of the high-frequency current signal was primarily between 0 and 100 Hz, exhibiting an increase in energy amplitude as well.
(3)
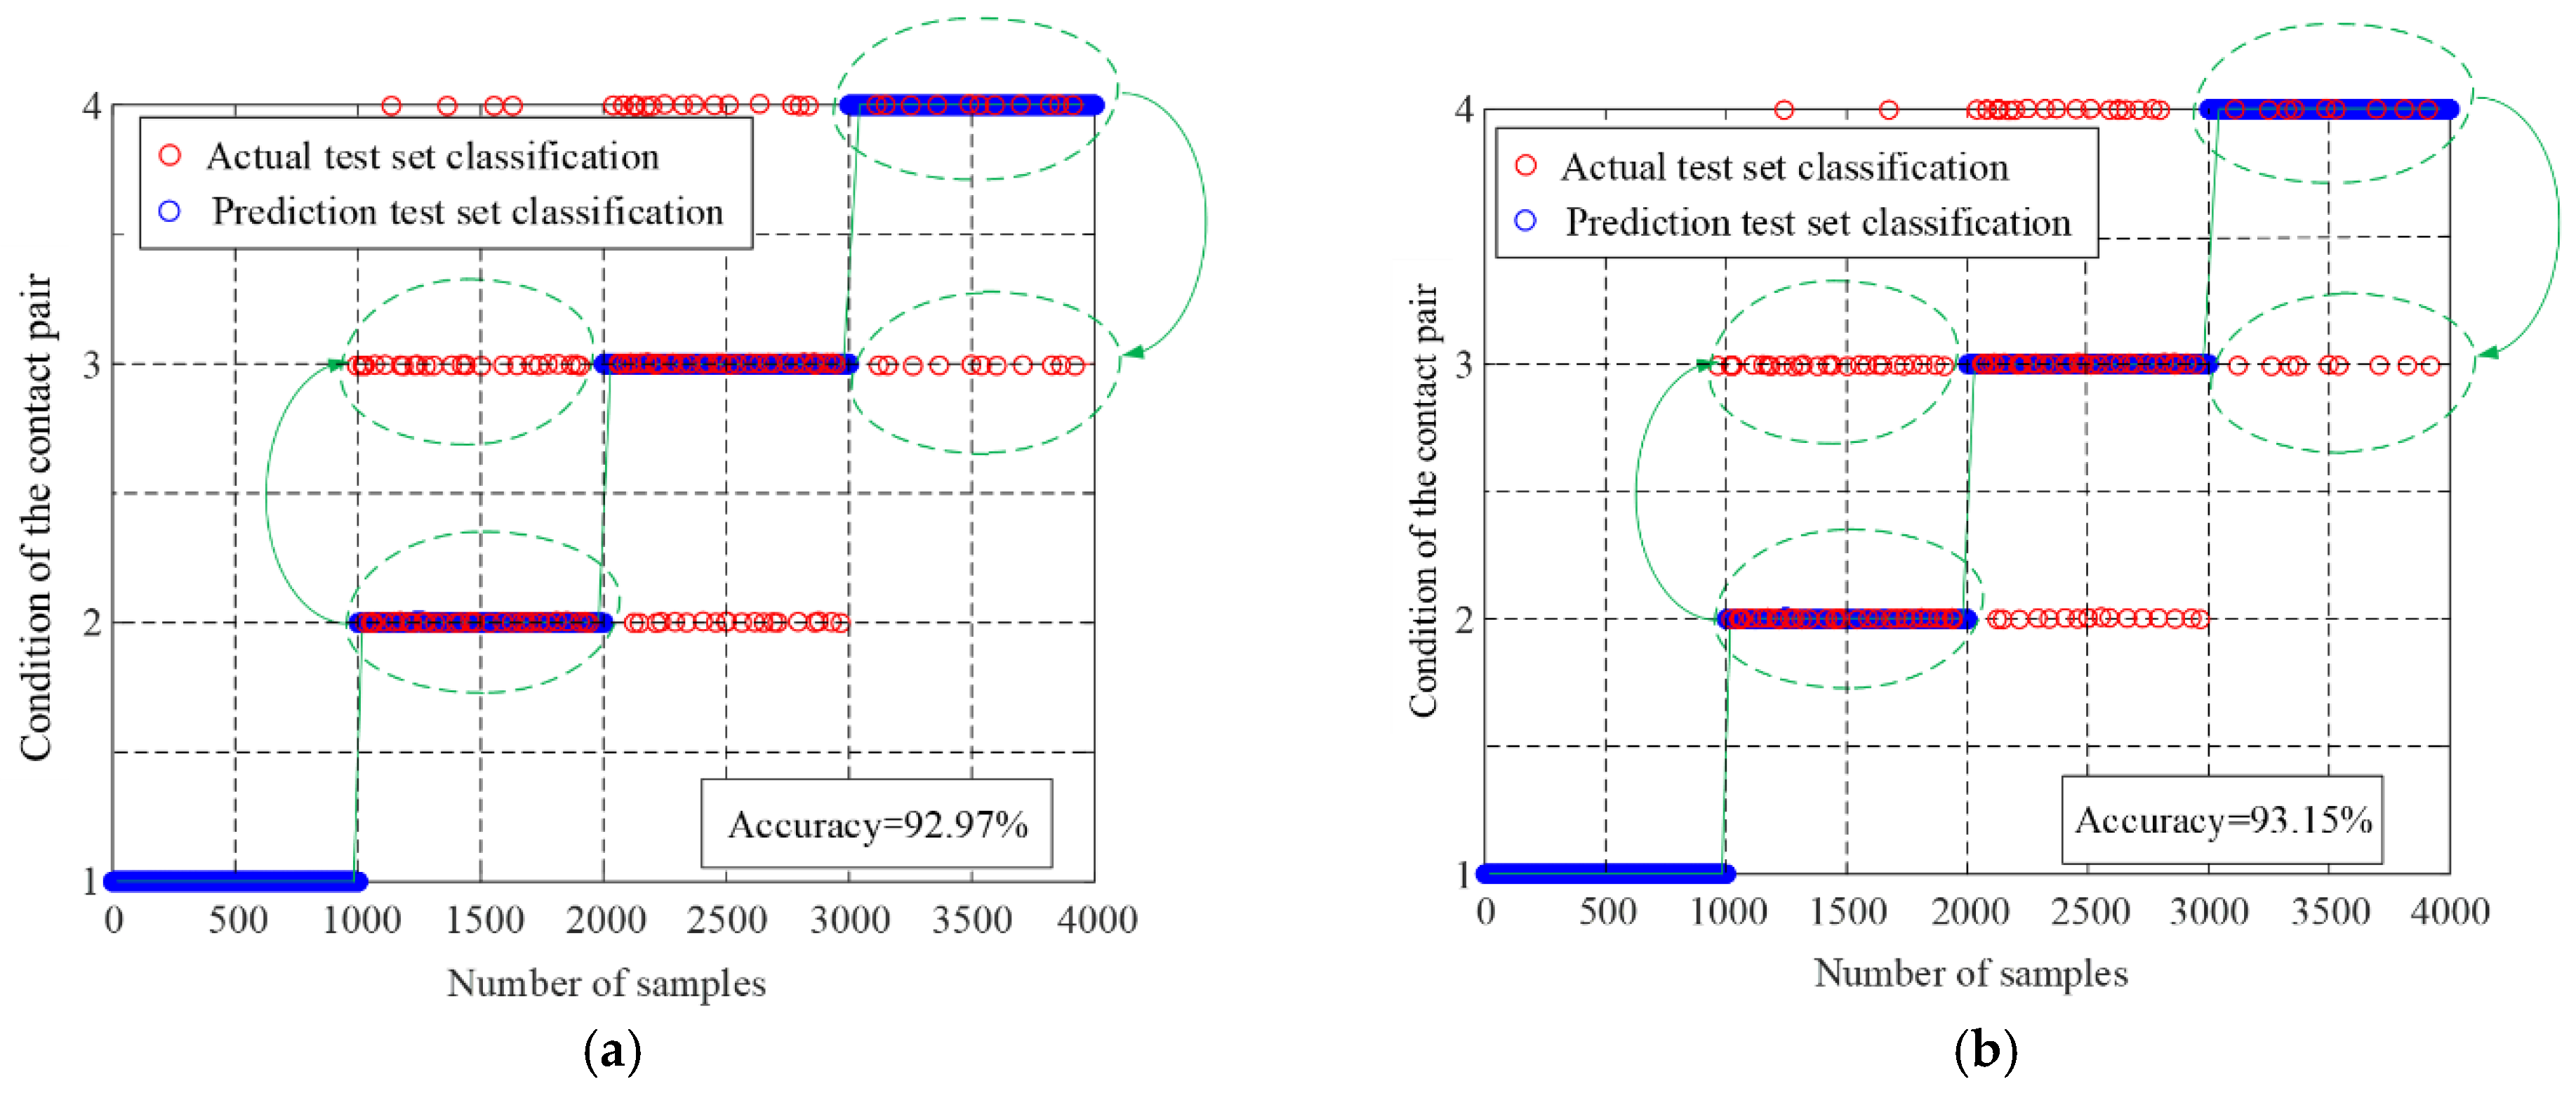
The results obtained from classifying OLTC contact faults indicate that electromechanical joint diagnosis enables a more comprehensive analysis of the contact’s condition. Furthermore, when utilizing the SVM algorithm, the classification outcomes exhibited high accuracy with error rates below 10%. These findings provide substantial evidence supporting the feasibility and effectiveness of the electromechanical joint diagnosis method.
The research on fault diagnosis of OLTC contacts through electromechanical joint feature analysis holds significant potential for future development. In forthcoming studies, there will be a focus on realizing the proposed methods and experimental systems. The objective will be to enhance the ability and reliability of fault diagnosis by attempting the integration of multimodal feature fusion and deep learning methods. Furthermore, the combination of real-time monitoring and prediction techniques will be explored to further improve fault diagnosis in complex noise environments during on-site applications.

Author Contributions

S.L. contributed to the conceptualization and proofread the article; L.D. wrote and revised the manuscript; S.L. and H.L. proposed the main idea, contributed to the conceptualization, and proofread the article; Z.L. and Y.K. summarized the references and proofread the article; Z.L. and H.L. guided the writing and reference organization. All authors have read and agreed to the published version of the manuscript.

Funding

This research was funded by the Gansu University Innovation Fund under contract No. 2021B-111 and the Doctoral Foundation of Colleges and Universities in Gansu Province under contract No. 2021QB-061.

Institutional Review Board Statement

Not applicable.

Informed Consent Statement

Not applicable.

Data Availability Statement

Not applicable.

Conflicts of Interest

The authors declare no conflict of interest.

References

  1. Liu, C.; Zhao, T.; Sun, Y.; Wang, X.; Cao, S. Dynamic behaviour of a suspended bubble and its influence on the distribution of electric fields in insulating oil of an on-load tap-changer within power transformers. Int. J. Electr. Power Energy Syst. 2023, 145, 108680. [Google Scholar] [CrossRef]
  2. Liu, J.; Yu, S.; Chen, P.; Wang, F.; Ma, X.; Hu, X.; Qian, Y. Fault identification of energy storage spring of on-load tap-changer of transformer based on cluster analysis. High Volt. Appar. 2020, 56, 159–165+172. [Google Scholar]
  3. Mostafa, E.S.; Gholamhassan, N.; Barat, G.; Shiva, G.; Rizalman, M.; Mohd, F.G. Multi-microgrid optimization and energy management under boost voltage converter with Markov prediction chain and dynamic decision algorithm. Renew Energy 2022, 201, 179–189. [Google Scholar]
  4. Wang, F.; Zeng, Q.; Zheng, Y.; Qian, Y. Mechanical fault diagnosis of on-load tap-changer based on Bayes estimation phase space fusion and CM-SVDD. Proc. CSEE 2020, 40, 58–368+402. [Google Scholar]
  5. Li, L.; Fu, X.; Cui, J.; Zhang, C.; Zhu, D.; Wu, K. Ground-penetrating radar soil layer information recognition based on envelope detection and STFT spectrum analysis. J. Geo-Inf. Sci. 2020, 22, 316–327. [Google Scholar]
  6. Li, K.; Li, X.; Su, L.; Su, W. Bearing fault diagnosis based on DTCWT and GA improved sparse decomposition. J. Huazhong Univ. Sci. Technol. (Nat. Sci. Ed.) 2021, 49, 56–61. [Google Scholar]
  7. Zhang, X.; Li, L.; Liu, S.; Lei, J. Empirical wavelet transform based on energy peak location and its application in weak bearing fault diagnosis. J. Xi’an Jiaotong Univ. 2021, 55, 1–8. [Google Scholar]
  8. Duan, R.; Wang, F.; Zhou, L.; Yao, G. Detection of mechanical state of on load tap changer for converter transformer using narrowband noise assisted multiple empirical mode decomposition algorithm. J. Electrotech. 2017, 32, 182–189. [Google Scholar]
  9. Geng, C.; Wang, F.; Zhang, J. Modal parameters identification of power transformer winding based on improved Empirical Mode Decomposition method. Electr. Power Syst. Res. 2014, 108, 331–339. [Google Scholar] [CrossRef]
  10. Shi, Y.; Zhuang, Z.; Lin, J. Bearing fault diagnosis based on convolution sparse representation and isometric mapping. Vib. Test Diagn. 2019, 39, 1081–1088+1138. [Google Scholar]
  11. Wu, C.; Zhang, D.; He, J. Protection scheme for VSC-MTDC based on low-frequency reactive power. Electr. Power Syst. Res. 2022, 204, 107703. [Google Scholar] [CrossRef]
  12. Zamani, R.; Mohammad, E.; Hamedani, G.; Hassan, H. A novel synchronous DGs islanding detection method based on online dynamic features extraction. Electr. Power Syst. Res. 2021, 195, 107180. [Google Scholar] [CrossRef]
  13. Zhou, X.; Wang, F.; Fu, J.; Lin, J.; Jin, Z. Mechanical condition monitoring of on load tap changer based on Chaos Theory and K-means clustering. Proc. CSEE 2015, 35, 1541–1548. [Google Scholar]
  14. Mehdi, B.; Ahmed, A. Clustering of transformer condition using frequency response analysis based on k-means and GOA. Electr. Power Syst. Res. 2022, 202, 107619. [Google Scholar]
  15. Zhang, J.; Tian, J.; Li, M.; Leon, J.I.; Franquelo, L.G.; Luo, H.; Yin, S. A parallel hybrid neural network with integration of spatial and temporal features for remaining useful life prediction in prognostics. IEEE Trans. Instrum. Meas. 2023, 72, 3501112. [Google Scholar] [CrossRef]
  16. Zhang, J.; Li, X.; Tian, J.; Luo, J.; Yin, S. An integrated multi-head dual sparse self-attention network for remaining useful life prediction. Reliab. Eng. Syst. Saf. 2023, 233, 109096. [Google Scholar] [CrossRef]
  17. Shangguan, X.; He, Y.; Zhang, C.; Jin, L.; Yao, W.; Jiang, L.; Wu, M. Control performance standards-oriented event-triggered load frequency control for power systems under limited communication bandwidth. IEEE Trans. Control Syst. Technol. 2022, 30, 860–868. [Google Scholar] [CrossRef]
  18. Liu, J.; Li, Q.; Chen, W.; Yan, Y. Fault diagnosis method for tram fuel cell system based on multi class correlation vector machine and fuzzy C-means clustering. Proc. CSEE 2018, 38, 6045–6052. [Google Scholar]
  19. Wu, J.; Wu, Z.; Mao, X. Risk early warning method for distribution system with sources-networks-loads-vehicles based on fuzzy C-mean clustering. Electr. Power Syst. Res. 2020, 180, 106059. [Google Scholar]
  20. Ding, Y.; He, Y.; Li, B.; Cui, J. Inverter fault diagnosis based on wavelet packet and quantum neural network. J. Chongqing Univ. Technol. (Nat. Sci.) 2021, 35, 152–158. [Google Scholar]
  21. Deng, M. Research on mechanical fault diagnosis of on load tap changer based on vibration signal. Transformer 2018, 55, 26–29. [Google Scholar]
  22. Liu, B.; Yu, Y.; Bai, X.; Ke, Z.; Wang, J. Research on transformer fault detection system based on vibration signal analysis. Electr. Autom. 2020, 42, 80–82+86. [Google Scholar]
  23. Gao, G.; Han, T.; Wu, B.; Fu, J.; Xia, Z. A hue preservation lossless contrast enhancement method with RDH for color images. Digit. Signal Process. 2023, 136, 103965. [Google Scholar] [CrossRef]
  24. Zhou, H.; Yan, P.; Huang, Q.; Yuan, Y.; Pei, J.; Yang, Y. Hob vibration signal denoising and effective features enhancing using improved complete ensemble empirical mode decomposition with adaptive noise and fuzzy rough sets. Expert Syst. Appl. 2023, 233, 120989. [Google Scholar] [CrossRef]
  25. Shao, Z.; Zheng, Q.; Liu, C. A feature extraction and ranking-based framework for electricity spot price forecasting using a hybrid deep neural network. Electr. Power Syst. Res. 2021, 200, 107453. [Google Scholar] [CrossRef]
  26. Ozgonenel, O.; Yalcin, T.; Guney, I. A new classification for power quality events in distribution systems. Electr. Power Syst. Res. 2013, 95, 192–199. [Google Scholar] [CrossRef]
  27. Huang, N.; Long, S.; Zheng, S. A new view of nonlinear water waves: The Hilbert spectrum. Annu. Rev. Fluid Mech. 1999, 31, 457–471. [Google Scholar] [CrossRef]
  28. Gao, A.; Zhu, Y.; Zhang, Y.; Cai, W. Partial discharge pattern recognition of transformers based on marginal spectrum image and deep residual network. Power Syst. Technol. 2021, 45, 2433–2442. [Google Scholar]
  29. Yan, J.; Ma, H.; Zhu, H.; Zhang, Y.; Li, Y.; Xu, H. Transformer winding looseness diagnosis based on LMD marginal spectral energy entropy and FWA-SVM. Electr. Meas. Instrum. 2021, 58, 74–80. [Google Scholar]
  30. Yu, M.; Zhao, W.; Wu, L.; Li, Y. Research on electric vehicle driving conditions based on K-means clustering and support vector machine. J. Chongqing Jiaotong Univ. (Nat. Sci. Ed.) 2021, 40, 129–139. [Google Scholar]
  31. Abdelhalim, M.; Boubakeur, Z.; Mohammed, B. Fixed least squares support vector machines for flashover modelling of outdoor insulators. Electr. Power Syst. Res. 2019, 173, 29–37. [Google Scholar]
  32. Yang, H.; Zhang, W.; Chen, J.; Wang, L. PMU-based voltage stability prediction using least square support vector machine with online learning. Electr. Power Syst. Res. 2018, 160, 234–242. [Google Scholar] [CrossRef]
  33. Li, Z.; Wang, H.; Qian, Y.; Huang, R.; Cui, Q. Pattern recognition of noisy partial discharge based on SURF. J. Electrotech. 2021, 10, 100–110. [Google Scholar]
  34. Yang, S.; Chen, S.; Li, G.; Jiang, J. Mechanical fault diagnosis of transformer on-load tap-changer based on variational modal decomposition and feature selection. South. Power Syst. Technol. 2019, 13, 39–47+59. [Google Scholar]
Figure 1. Schematic of an OLTC switching signal acquisition system.
Electronics 12 03573 g001
Figure 2. Test devices to simulate the fault of an OLTC contact pair. 1—sliding guide rail; 2—DC motor; 3—oil tank; 4—oscillograph; 5—PC; 6—silver copper contact.
Electronics 12 03573 g002
Figure 3. The original signal in four states. (a) Normal condition; (b) moving contact loose; (c) moving contact slight wear; (d) moving contact severe wear.
Electronics 12 03573 g003
Figure 4. The original signal after noise reduction in four states. (a) Normal condition; (b) moving contact loose; (c) moving contact slight wear; (d) moving contact severe wear.
Electronics 12 03573 g004aElectronics 12 03573 g004b
Figure 5. Hilbert upper envelope diagram in four states. (a) Upper envelope of mechanical vibration signal in four states; (b) upper envelope of high-frequency current signal in four states.
Electronics 12 03573 g005
Figure 6. Hilbert time–frequency spectrum diagram in four states. (a) Time–frequency spectrum of mechanical vibration signal in four states; (b) time–frequency spectrum of high-frequency current signal in four states.
Electronics 12 03573 g006
Figure 7. Hilbert marginal spectrum diagram in four states. (a) Marginal spectrum of mechanical vibration signal in four states; (b) marginal spectrum of high-frequency current signal in four states.
Electronics 12 03573 g007
Figure 8. OLTC contact fault classification results. (a) Contact fault classification results of the mechanical vibration signal SVM; (b) contact fault classification results of the high-frequency current signal SVM.
Electronics 12 03573 g008
Table 1. Relevance analysis results between different states of OLTC contacts.
OLTC Moving Contact StatusRelated Coefficient (r)
Mechanical Vibration SignalHigh-Frequency Current Signal
Normal condition11
Loose state0.5650.634
Slight wear0.4700.553
Severe wear0.2610.319
Table 2. Hilbert marginal spectrum energy entropy of the IMF component of the vibration signal.
IMF ComponentNormal ConditionMoving Contact LooseMoving Contact Slight WearMoving Contact Severe Wear
IMF12.92132.56272.39011.8172
IMF22.2762.01421.92831.5116
IMF31.9841.7451.6171.624
IMF41.79981.56371.38691.964
IMF51.5071.30641.1180.5927
IMF61.86171.0140.90810.5677
IMF71.8190.65920.41850.1278
IMF81.7170.42370.6050.0779
Table 3. Hilbert marginal spectrum energy entropy of the IMF component of the high-frequency current signal.
IMF ComponentNormal ConditionMoving Contact LooseMoving Contact Slight WearMoving Contact Severe Wear
IMF10.66910.43750.30170.1699
IMF20.42060.40620.28560.1428
IMF30.50130.36080.26010.1641
IMF40.39180.41200.30150.1329
IMF50.32160.33060.25900.0918
IMF60.29610.30140.23100.0764
IMF70.26540.29380.20450.1028
IMF80.30130.22370.24070.0839
Disclaimer/Publisher’s Note: The statements, opinions and data contained in all publications are solely those of the individual author(s) and contributor(s) and not of MDPI and/or the editor(s). MDPI and/or the editor(s) disclaim responsibility for any injury to people or property resulting from any ideas, methods, instructions or products referred to in the content.

