Article

Explainable B2B Recommender System for Potential Customer Prediction Using KGAT

1
Department of Applied Data Science, Sungkyunkwan University, 25-2, Sungkyunkwan-Ro, Jongno-gu, Seoul 03063, Republic of Korea
2
Bizdata, Gangnam-daero 53-gil, Seocho-gu, Seoul 06621, Republic of Korea
3
School of Convergence/Convergence Program for Social Innovation, Sungkyunkwan University, Hoam Hall 50806, 25-2, Sungkyunkwan-Ro, Jongno-gu, Seoul 03063, Republic of Korea
*
Author to whom correspondence should be addressed.
Electronics 2023, 12(17), 3536; https://doi.org/10.3390/electronics12173536
Submission received: 28 July 2023 / Revised: 14 August 2023 / Accepted: 17 August 2023 / Published: 22 August 2023

Abstract

:
The adoption of recommender systems in business-to-business (B2B) can make the management of companies more efficient. Although the importance of recommendation is increasing with the expansion of B2B e-commerce, not enough studies on B2B recommendations have been conducted. Due to several differences between B2B and business-to-consumer (B2C), the B2B recommender system should be defined differently. This paper presents a new perspective on the explainable B2B recommender system using the knowledge graph attention network for recommendation (KGAT). Unlike traditional recommendation systems that suggest products to consumers, this study focuses on recommending potential buyers to sellers. Additionally, the utilization of the KGAT attention mechanisms enables the provision of explanations for each company’s recommendations. The Korea Electronic Taxation System Association provides the Market Transaction Dataset in South Korea, and this research shows how the dataset is utilized in the knowledge graph (KG). The main tasks can be summarized in three points: (i) suggesting the application of an explainable recommender system in B2B for recommending potential customers, (ii) extracting the performance-enhancing features of a knowledge graph, and (iii) enhancing keyword extraction for trading items to improve recommendation performance. We can anticipate providing good insight into the development of the industry via the utilization of the B2B recommendation of potential customer prediction.

1. Introduction

Recommender systems have become increasingly important in various areas, such as music, movies, books, online shopping, news, points of interest (POIs), and e-learning materials, due to the growth of e-commerce and the increase in data volume [1,2]. While most B2C online services are equipped with diverse recommender system algorithms, B2B online services have received comparatively less attention from researchers, despite the growth of e-commerce in both sectors. Understanding differences between B2B and B2C is imperative for developing an appropriate approach to recommender systems for B2B. These differences include customers, transaction prices, product volumes, sales cycles, purchase decision processes, and trading relationships as highlighted by Saha et al. (2014) [3]. B2B transactions target companies dealing with many high-priced products, with longer sales cycles and decision-making processes. This emphasizes the importance of trading relationships in B2B, while B2C tends to prioritize the product. Furthermore, B2B purchasing decisions are typically driven by planned and logical needs, unlike the impulse purchases often seen in B2C transactions. Thus, recommender systems for B2B require a different approach.
There are not many papers available on B2B recommender systems due to the confidentiality and non-disclosure of inter-company transaction data. In this paper, three papers related to B2B recommendation systems are identified. One paper proposes a framework for a B2B recommender system [4], and another paper suggests a hybrid model and its applicability to B2B as a case study [5]. However, unlike this paper, the first thesis focuses on a framework that recommends suppliers to buyers. In B2B, most buyers have specific requirements and order in a planned way [3]. They need search engines rather than a recommender system since they know what they want. In the second paper, the model is based on collaborative filtering (CF), not utilizing side information. Side information refers to information other than the user’s interaction with the item, such as the user profile, item properties, item reviews, and the user’s social network [2,6]. If side information is used together, more diverse recommendations can be made than CF. Apart from these two papers, there is another B2B recommendation study similar to this one, which proposes a supplier-centric recommendation system [7]. Nevertheless, its objective is to recommend the supplier’s products to client companies using a co-clustering technique. Furthermore, the difference from this research is that it relies solely on the past purchase network without utilizing side information to identify recommendation candidates.
This study intends to present two new perspectives on how recommender systems can be utilized in B2B. (1) Recommending buyers to sellers. The system aims to recommend buyers to sellers, contrary to the more conventional recommendation pair, which is items to buyers, and this is done as such for two reasons. Firstly, relationship plays a crucial part in B2B transaction. Secondly, recommending sellers to buyers could be less effective because buyers make a planned and rational transaction [3]. Consequently, this manuscript focuses on the perspective of a company that sells products and recommends buyers unexpected by them to help discover customers (i.e., compared with the generic terms of recommender systems, users become suppliers, and items become buyers in this study). (2) Explainability must be guaranteed. In B2B, where the transaction amount is large and long term, it is not enough to recommend a company without explanation. For a recommender system to become a service in B2B, it needs to be able to explain what made the recommendations so that sales and marketing teams can also use the analysis.
Many algorithms have been developed to recommend products that meet the tastes of customers. CF is a popular method for recommendation systems, along with content-based, hybrid, and knowledge-based methods [2]. However, CF methods perform poorly in sparse data due to their inability to model side information [6]. To address this limitation, various recommendation systems have incorporated side information, including supervised learning (SL) and knowledge-based models. While SL models such as factorization machine [8], neural factorization machine [9], Wide&Deep [10], and AutoInt [11] are effective, they have limited capacity to explain recommendation outcomes. For instance, AutoInt is an SL model that identifies meaningful combination features through correlations between different feature fields [11], yet it cannot reveal the individual characteristics of users. Thus, to provide more persuasive recommendations that take into account specific variable correlations for each user, this study utilizes the knowledge-based KGAT (knowledge graph attention network for recommendation) model [6]. Other well-known knowledge-based models, such as CFKG [12] and KGCN [13], are considered, but the KGAT is selected as the primary model for this paper. The KGAT considers network information in its recommendations and employs a knowledge graph (KG), which is a heterogeneous graph capturing information about items and their attributes, to understand the mutual relations between entities [2]. The KGAT possesses strengths in providing explainable and personalized recommendations.
This project not only proposes a new perspective on the B2B recommender system but also provides explainability for individual company recommendations through the attention mechanism from B2B transaction statements. Additionally, it suggests a performance improvement method through feature extraction and data preprocessing from B2B transaction data. This research offers new insights into the potential application of recommender systems in the B2B domain, enabling the analysis of big data transactions between companies. The main tasks of this study are summarized as follows: (1) proposing a new perspective on applying an explainable recommender system in B2B potential customer identification; (2) extracting features from B2B transaction statements that can be used in a knowledge graph; and (3) advancing keyword extraction techniques for trade items to improve modeling performance.

2. Theoretical Background

As data have become abundant, B2B has evolved to enable the recommendation of similar companies based on their purchase history. Unlike typical recommendation systems that recommend products to customers, this paper introduces a novel perspective in the B2B context by suggesting recommendations of potential customers to suppliers. This is because, in the B2B context, buyers are generally aware of the products they desire and make purchases under planned conditions, rendering product recommendations less essential [3]. By recommending suitable potential customers to suppliers, these suppliers can identify future customers, and these potential customers can receive the desired products. This approach results in time savings for both parties. Furthermore, through data analysis utilizing deep neural networks, not only B2B experts but also non-experts can track recommendation outcomes to gain market insights. By analyzing a company’s transaction trends, it is possible to identify core transaction items and pinpoint popular products and potential areas for improvement.
In the context of B2B, characterized by substantial and crucial transactions, the looming potential for high risks underscores the necessity for robust recommendations to guide decision making. Thus, a recommendation algorithm capable of elucidating the rationale behind individual recommendations is essential. As a solution, the KGAT model is employed, which provides personalized and relevant recommendations by synergistically combining graph-based representation learning with the attention mechanism [6]. The KGAT leverages the structured nature of a knowledge graph, encoding relationships between entities along with their attributes, such as transaction history, industry sector, and more. Through learning entity representations within the graph, the KGAT captures both the inherent characteristics of entities and the intricate interactions among them. This synergistic approach empowers the KGAT to deliver recommendations that are not only more accurate but also contextually aware. Upon comparing multiple recommendation models during this project, the KGAT provides a detailed rationale and demonstrates strong overall performance.

3. Related Work

3.1. B2B Recommender System

B2B recommendation systems have been the subject of several research papers. Among them, three papers have been selected for comparison. One paper introduces a framework for the system in B2B e-commerce [4]. In contrast to this paper, the focus is on the system’s framework rather than the recommendation model itself. Additionally, while this paper focuses on recommending suppliers to buyers, it discusses the structure of recommending buyers to suppliers.
The second paper describes an item-based trust module, which is a variation of the collaborative filtering (CF) model [5]. It calculates trust matrices for users and items and utilizes a hybrid prediction module to forecast user–item ratings. Unlike the current research, it constructs a B2B recommendation system using rating data from companies. Furthermore, this paper differs by not incorporating side information when retrieving candidate recommendations.
Finally, the third paper proposes a supplier-centric B2B recommendation system similar to the perspective of this research [7]. However, its emphasis lies in recommending products that suppliers can offer to customers, rather than suggesting buyer companies. the third paper utilizes the co-clustering technique and relies on the past purchase history of customers to identify recommendation candidates. This research distinguishes itself from previous studies by aiming to provide a potential customer recommendation system in B2B using evidence-based approaches and incorporating side information within the model.

3.2. Recommendation Models

In this study, a comparative analysis is conducted among the KGAT, KGCN, AutoInt, and factorization machine (FM) models [6,8,11,13]. Among these models, the hypothesis is posited that the KGAT model would be particularly well-suited for the B2B dataset, and the empirical results validate this hypothesis.
The knowledge graph attention network (KGAT) is a deep learning recommender model that effectively utilizes interactions with a knowledge graph to generate personalized recommendations. The KGAT offers several advantages in recommendation tasks, including the ability to capture high-order connectivity and provide explanations for each company through the attention mechanism. The attention mechanism in the KGAT computes attention weights for entities and relations in the knowledge graph, allowing for a more precise modeling of their importance. Moreover, as the KGAT is built upon the architecture of graph convolution networks, it is well-equipped to deliver accurate predictions on the network structure present in the market transaction dataset.
Moving on to the KGCN model, this deep learning approach focuses on leveraging graph convolutional networks to capture and incorporate the structural information present in the knowledge graph. The KGCN aims to improve the recommendation performance by effectively utilizing the graph structure and its inherent relationships. The model exploits the power of graph convolutional layers to aggregate information from neighboring entities, enabling it to capture the complex interactions and dependencies within the B2B dataset. However, in contrast to attention mechanisms, it lacks the capacity to overtly elucidate rationales for individual recommendations.
AutoInt, on the other hand, is a model that combines deep learning with the attention mechanism to enhance recommendation accuracy. It employs self-attention mechanisms to capture the dependencies between different feature dimensions, enabling the model to effectively learn feature interactions and generate personalized recommendations. AutoInt offers the advantage of being able to capture both low-order and high-order feature interactions, which can be beneficial in the context of B2B recommendation systems, where complex relationships between features exist. Nevertheless, similar to the KGCN, it does not offer explicit explications for individual recommendation justifications.
Lastly, the FM model is a classic approach used in recommendation systems. It models feature interactions through factorization techniques, allowing it to capture both linear and non-linear relationships between features. FM is known for its efficiency and ability to handle sparse datasets, making it a popular choice in various recommendation scenarios. However, it exhibits limitations in modeling complex relationships and high-order interactions.

4. Overall Process of the KGAT Recommender System

The overall process of the KGAT model can be summarized in four parts: data preparation, collaborative knowledge graph (CKG) embedding layer, attention embedding propagation layers, prediction layer, and optimization. The following passages are a rephrased rendition of the content from the KGAT [6].
The first step in building the KGAT model is to prepare the data, which involves creating a user–item bipartite graph and knowledge graph. These two graphs are then combined to form a hybrid structure called the collaborative knowledge graph (CKG). Figure 1 illustrates an example of CKG. The user–item bipartite graph G1 represents the relationship between users U and items I, which is defined as u , y u i , i u U , i I , where y u i = 1 if a link exists between them [6]. In contrast to the typical B2C recommendation system data, this paper considers users as suppliers and items as buyers. The knowledge graph typically illustrates the relationship between item I and its side information e. KG G 2 is represented as a set of triplets h , r , t h , t E , r R , where head entity h and tail entity t can represent either an item or side information, and r denotes the relationship between them [6]. In the context of B2B data, I represents buyers, while side information about them is represented as e. Then, CKG is a unified graph that merges the user–item bipartite graph and KG. So, CKG is represented as h , r , t h , t E , r R , where E is the union of E and U, and R includes the interaction relation [6].
The second step is to create the collaborative knowledge graph (CKG) embedding layer, which involves learning low-dimensional representations of the nodes in CKG by utilizing graph-embedding techniques. This step helps to capture the interactions between users, items, and their side information in the low-dimensional space. In the KGAT, TransR is employed as the graph-embedding technique [14]. TransR is a technique that uses distinct embedding spaces for entities and relations within a knowledge graph, taking into account their unique properties and characteristics. The embedding for h , r , and t is expressed as e h , e t R d and e r R k . With the given triplet ( h , r , t ) , one of the objective functions is as follows:
L K G = ( h , r , t , t ) Γ l n σ W r e h + e r W r e t 2 2 W r e h + e r W r e t 2 2
Here, Γ = h , r , t , t h , r , t G , h , r , t G , and t represents a broken tail that is obtained by randomly replacing one of the entities in a valid triplet [6]. W r is the parameter matrix for relation r. This matrix helps the model to incorporate the relation information into the learned representations. σ ( · ) is the sigmoid function. This sigmoid function compresses the input value to a range between 0 and 1. The function penalizes the model when the triplet in the knowledge graph is not true, with the degree of penalty being determined by a pairwise ranking loss in Equation (1). The model adjusts its parameters to minimize this loss function, thereby enhancing the performance of the recommender system.
After applying TransR, the KGAT utilizes the attentive embedding propagation layers to recursively propagate the learned embeddings to other entities in the graph. The embeddings learned in the previous step are utilized to update the embeddings through the attentive propagation layer. This enables the KGAT to learn high-order relations and capture the complex structural information of KG [6]. To consider the first-order connectivity of entity h, it is computed by the linear combination of e t :
e N h = ( h , r , t ) N h π ( h , r , t ) e t
where N h is a triple neighbor set for entity h. The KGAT applies the relational attention mechanism via implementing π ( h , r , t ) . π ( h , r , t ) represents the attention weights, indicating the importance propagated from t to h under the condition of relation r. The expression of π ( h , r , t ) is normalized using the softmax function:
π ( h , r , t ) = e x p ( π ( h , r , t ) ) ( h , r , t ) N h e x p ( π ( h , r , t ) )
π ( h , r , t ) is composed of ( h , r , t ) , and the detailed formula is as follows:
π ( h , r , t ) = ( W r e t ) T t a n h ( ( W r e h + e r ) )
The tanh function is chosen as the nonlinear activation function, and the attention weights are assigned using the inner product method with learnable parameters W r . Next, the entity representation e h and its ego-network representations e N h are combined to create a new representation of entity h [6]. This is expressed as e h ( 1 ) = f ( e h , e N h ) , where the bi-interaction aggregator is utilized as f ( ) in this paper:
f B i - i n t e r a c t i o n = L e a k y R e L U ( w 1 ( e h + e N h ) ) + L e a k y R e L U ( w 2 ( e h e N h ) )
High-order propagation involves stacking propagation layers to create multiple stacks, where the lth steps can be expressed as e h ( l ) = f ( e h ( l 1 ) , e N h ( l 1 ) ) .
In the prediction layer, the KGAT utilizes the layer-aggregation mechanism to concatenate the representations of each step into one vector. And then, the prediction of the matching score between a user and item is achieved via an inner product of their corresponding representations:
y ^ ( u , i ) = ( e u ( 0 ) e u ( L ) ) T ( e i ( 0 ) e i ( L ) )
The final objective function of the KGAT comprises two loss functions. One of the loss functions is used to learn Equation (1), while the other loss function is defined as follows:
L C F = ( u , i , j ) O l n σ ( y ^ ( u , i ) y ^ ( u , j ) )
Set O contains triples ( u , i , j ) , where ( u , i ) belongs to the set of observed interactions between user u and item i, and ( u , j ) belongs to the set of unobserved interactions. The activation functions is the sigmoid function. The final objective function with L2 regularization is as follows:
L K G A T = L K G + L C F + λ Θ 2 2
Two loss functions are alternatively optimized during the training process. The loss function L K G , as expressed in Equation (1), is used to optimize the structural embedding from KG. On the other hand, L C F is utilized to optimize the pairwise ranking from KG [6].

5. Recommender System for Identifying B2B Prospects

5.1. Building B2B Knowledge Graphs of Buyers

Section 5 provides a detailed description of the B2B transaction data used in the research for studying the B2B recommendation system. It outlines the construction of knowledge graphs based on the data, specifying the types of relationships or links defined within these knowledge graphs. These relationships can encompass various aspects, such as the transaction history, industry sectors, customer preferences, or other relevant attributes that play a crucial role in B2B interactions. The section also highlights the efforts made to enhance the performance of the recommendation system using the available data, discussing a preprocessing step that involves extracting keywords from item names to better understand the patterns within the B2B transaction data.

5.1.1. Market Transaction Dataset

The Korea Electronic Taxation System Association provides the market transaction dataset in South Korea. The dataset is a part of the Korean B2B market, not all the data of Korean companies. A sample of the dataset is shown in Table 1. The dataset in 2018 is used. The original dataset comprises more than 70,000 suppliers and 950,000 buyers. However, to ensure the quality of the dataset and the credibility of the represented businesses, a data-filtering process is employed. The study implements a 10-core setting filtering approach, a methodology that the KGAT paper also employs. This approach entails excluding records that involve either a buyer or a seller with a total of interactions fewer than 10. By adopting this method, the dataset is refined to include only those entities with a more substantial level of engagement. This refinement enhances the robustness and reliability of the data used in the analysis. Therefore, 6677 suppliers and 15,279 buyers exist in the dataset. The summary of the dataset statistics is presented in Table 2.
The dataset includes the date, supplier business index, supplier industry code, buyer business index, buyer industry code, and transaction item name. The trading items are Korean, but an English translation is shown for the comprehension purpose. The method of extracting keywords from transaction names is described in Section 5.1.3. The industry code is called the Korea Standard Industry Code, which provides a classification of specific business types. For example, “C25111” means the manufacture of metal doors, windows, shutters, and related products. Figure 2 shows the distributions of industry types for both suppliers and buyers. The analysis of the suppliers’ industry distribution reveals that most of them operate in the manufacturing or the wholesale and retail sectors.

5.1.2. Overall Relations of Knowledge Graphs

A knowledge graph of buyers can be created with three relations in the dataset: trade item names, supplier industry code, and buyer industry code. A sample of the knowledge graph is exhibited in Figure 3 and Figure 4. In these Figures, the knowledge graph contains the information based on buyers. Hence, the supplier’s industry code can be interpreted as the industry code of supplier companies that the buyers are interested in as shown in Figure 4. The importance of each relation appears in Figure 5, which shows the F1 score when recommending Top@N popular buyers to each supplier in each relation. The buyer’s interested supplier industrial code is not in Figure 5, because its F1 score keeps increasing until Top@90. Starting from 1.66, the F1 score increases to a maximum of 19.331. The F1 score for each relation’s Top-N recommendation is executed to verify whether buyers’ features influence a recommendation. Figure 5 reflects that buyer’s industry code is significantly related to the recommendation.
Three advantages of a knowledge-based recommender system are as follows. (1) The knowledge-based recommender system can recommend even unrecommended areas in CF. According to Figure 3, a pink box (CF) represents interactions between suppliers and buyers, and a blue box shows a knowledge graph of buyers. For example, supplier S311 in the red area is not connected to buyers who are associated with other suppliers in the blue area. Thus, buyer B403 cannot be recommended to supplier S311 through CF, but with a keyword knowledge graph (blue dotted box), the B403 buyer can be linked to the S311 supplier. (2) With the knowledge graph, it is possible to find companies with more similar demands than CF. Even though buyer B620 and buyer 403 seem unrelated in the collaborative filtering box (Figure 3), they are connected to the same entities in the knowledge graph according to Figure 3. They both have bought items with “Kappa engine” and their industry code is C30121, the manufacture of passenger motor vehicles. Also, they have traded with suppliers whose industry code is C30310, the manufacture of parts and accessories for motor engines. It can be seen that B125 is a similar company to B620, although the industry code is different. Consequently, more similar buyers can be mapped through entities of the knowledge graph. (3) With side information, recommendation factors become more diverse. Side information in the knowledge graph, such as keywords and industry code, helps to better understand buyers. If the weight between entities can be calculated, it can also be known which entity each buyer is interested in. Fortunately, the KGAT can calculate the weight between entities through the attention score.

5.1.3. Keyword Feature Extraction for Knowledge Graphs

As shown in Table 1, trading item names need to be preprocessed. The process depicted in Figure 6 is carried out. For natural language processing (NLP) in the trade item text, four techniques are used: Mecab, a branching entropy, a cohesion score, and TF-IDF. Mecab is an open-source library designed for Korean language text mining. Like Mecab, there are other tagging classes, such as Kkm, Okt, Komoran, and Hannanum. However, Mecab is the fastest tagging class among them [15]. In the 2018 transaction data, there are more than 40,000 unique transaction items from supplier companies, which are manufacturers. Therefore, Mecab is applied to reduce the computation time. Basic nouns can be extracted with Mecab, and words not registered in Mecab can be extracted by adding them to a user dictionary. For extracting words not registered in Mecab, cohesion and branching entropy are calculated for a text string. The cohesion score is a value obtained by calculating the probability of the following character appearing when the other characters are given, while increasing the context from the left [16]. A branching entropy calculates uncertainty for the following character after being given successive characters [17]. For example, at the position where one word is complete, various postpositions or combination words may follow, leading to an increase in entropy value. The cohesion equation is shown in Equation (9), and the branching entropy is in Equation (10) [16,17]. New words are extracted by measuring word scores multiplied by cohesion and branching entropy. Nevertheless, neologisms extracted through cohesion and branching entropy also encompass compound words, which should not be classified as neologisms:
c o h e s i o n ( C 1 : n ) = ( i = 1 n 1 P ( C 1 : i + 1 C 1 : i ) ) 1 n 1
H ( X X n ) = x X P ( x | x n ) l o g P ( x | x n )
After extracting Mecab nouns and neologisms by cohesion and branching entropy, if the Mecab nouns’ combinations are in the neologisms, they are added to the list as compound nouns. Then, from a neologism’s extraction list, a list is created, excluding the list of Mecab nouns and compound nouns. An example is depicted in Table 3. The preprocessed neologisms are grouped by the supplier’s major industry code, and the TF-IDF of the words is calculated. To filter neologisms that are necessary, only words with TF-IDF above the average are extracted, and the number of <span> tags in HTML is calculated when each word is google searched. The reason for obtaining the number of <span> tags by searching google for each word is to verify indirectly whether it is a word that is used in practice or not. The extracted words are checked heuristically, and the necessary words are added to Mecab as a user dictionary.
Through the word extraction process, the performance of the potential customer recommender system is improved. After extracting new words and compound nouns, the highest F1 score becomes 15.765 from the previous 11.761 at the Top@1 recommendation. It can be confirmed that NLP helped improve performance.

6. Experiments Setup

6.1. Evaluation Metrics

Except for interactions between suppliers and buyers, all the interactions that have not interacted each other are treated as negative items. The interaction rating is 1 if there is an interaction and 0 otherwise. As the evaluation metric, recall@20 is adopted. This is because the average actions of buyers have about 20 interactions with suppliers.

6.2. Baselines

As reported by the KGAT paper, they compare the KGAT with SL models like FM, NFM, etc. Basically, in this work, three other models are compared with the KGAT: FM, AutoInt, and KGCN.

6.3. Parameter Settings

The KGAT model is implemented in Pytorch. Most of the parameters are based on the KGAT paper [6]. All the embedding size is fixed to 64, and the batch size is fixed at 1024. For each interaction, four negative samplings are added. In the KGCN, one iter is conducted because the performance is the best at one iter. For the AutoInt, three layers are set. The depth of the KGAT (L) is with three hidden dimensions: 64, 32, and 16. For each dataset, 80% of the interaction records are randomly selected as the training set, 10% as the validation set, and the remaining 10% as the test set. Top N is tuned in {5, 10, 20, 30, 40}, where the valid metric that recall@N also follows Top N.

6.4. Results

Recall@20 is adopted as an evaluation metric for comparison with other models. To account for potential variations caused by different random seeds, each model is executed five times with different random seeds, producing results for recall, NDCG, hit, precision, and MRR. Subsequently, a one-way ANOVA test is conducted on these results. The analysis yields a p-value of 0.999 for all models, indicating that there is no statistically significant difference among the evaluated metrics. Thus, it can be concluded that the performance of all models remains consistent regardless of the specific random seed used. Table 4 shows the results of the baselines and the KGAT. The random method refers to a recommendation approach, where items are randomly recommended to users with equal probability. Randomly recommending companies show recall and hit rate that are close to zero because the sparsity of the dataset is about 99.66%. As anticipated, the KGAT performs best with 0.2121 (Recall@20), followed by the KGCN with 0.1948. The bold text indicates the highest score for each. This observation suggests that the integration of knowledge-based interactions, attention mechanisms, and graph convolutional networks of the KGAT confers a competitive advantage in transactional data. Referring to the fact that recall@20 is 0.1981 for Movielens, the most representative dataset in the recommendation, it seems that the performance is favorable [18]. Figure 7 illustrates the performance based on Top@N, where N is {5, 10, 20, 30, 40}. As the value of N increases, both the recall and hit rate show an upward trend, while the precision exhibits a downward trend. In addition, the KGAT demonstrates superior performance across almost all Top@N result values. The KGAT performance of each relation is indicated in Table 5. While using all relations may not result in the highest performance, it is utilized for various interpretations. This work aims not only to improve performance but also to consider the analytical perspective.
Figure 8 provides a clear and visually intuitive representation of the KGAT attention mechanism, showcasing the analytical perspective of the study. It effectively elucidates the reasoning behind the recommendations of buyer D to supplier A and buyer H to supplier E. Focusing on the relationship between supplier A and buyer D, as depicted in the left portion of the figure, it can be observed that buyer B, who has more influence in its dealings with supplier A, belongs to the field of electrical precision instruments (C34020), and is associated with waste-related businesses. Additionally, another customer of supplier A, buyer C, is involved in businesses requiring underwater pumps and belts. Consequently, the recommendation model suggests that buyer D’s company, similar to buyers B and C, may also demonstrate interest in the products offered by supplier A. The right portion of the figure illustrates the reasons behind the recommendations for other companies. This visualization not only demonstrates the potential for personalized prospect recommendations but also enhances the study’s explanatory power. The attention scores in the KGAT are better for comparisons within a single connectivity layer. For instance, (Supplier A → Buyer B, Supplier A → Buyer C) represents one layer, while (Buyer B, Buyer C → side information) represents another layer. It is advisable to interpret the attention scores as a measure for ranking comparisons rather than quantifying their exact meaning. To conduct a comprehensive analysis, it is important to consider attention scores not only from the side information but also from the interactions between users (suppliers) and items (buyers). This allows us to capture additional factors in the analysis.

7. Conclusions and Future Work

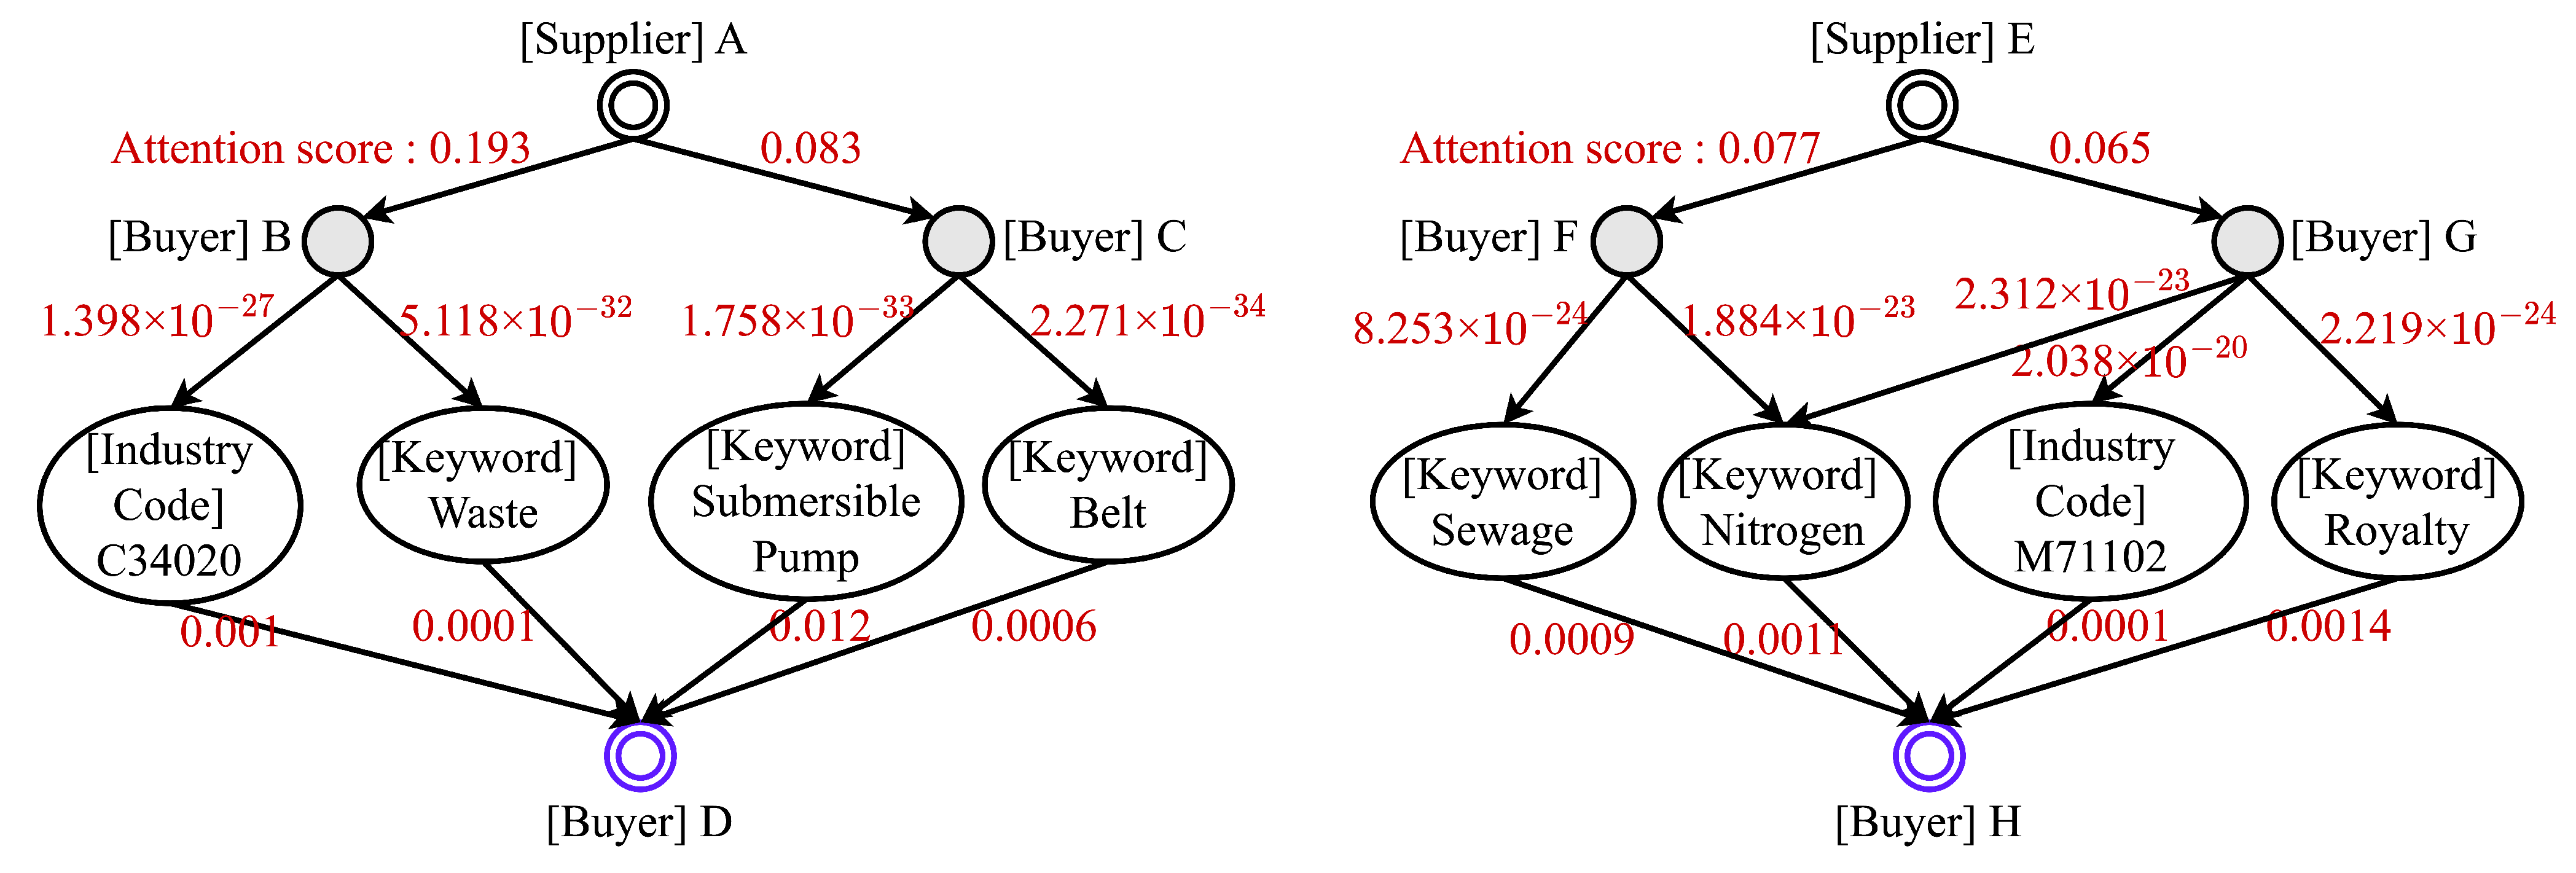
This work introduces a new framework for a B2B recommender system with the goal of identifying potential prospects in the B2B domain. Various recommendation algorithms are considered, and the KGAT is found to perform well. Additionally, a buyer’s knowledge graph is introduced, incorporating features, such as traded item names and industry codes of buyers and suppliers, for potential customer identification. A new word extraction process is also proposed to improve performance. Furthermore, the visualization of the attention mechanism provides insights into the reasons behind the recommendations, which can be valuable for marketing and sales teams. They can utilize the visualization to identify similar companies and understand buyer interests. This study represents a novel attempt to showcase the scalability of the recommender system in the B2B domain. It is anticipated that this research will assist B2B supply companies in identifying potential customers.
To further advance this study, there are several aspects that should be taken into consideration. Firstly, it is crucial to tackle the performance drop of the KGAT with increasing triples. Efficient graph learning and embedding strategies can play a vital role in optimizing performance. Moreover, to further extend the potential of the KGAT model, the incorporation of additional side information from users could be explored. For instance, integrating supplementary details, such as user interests, into the model can provide more sophisticated recommendations. Additionally, the efficiency of the KGAT model is substantially dependent on the quality and availability of the fundamental knowledge graph and data. Hence, focusing on improving data quality and reducing noise can significantly enhance performance. Considering these avenues of development, the KGAT model can evolve into a more effective and accurate B2B recommendation system.

Author Contributions

G.C.: Conceptualization, Data curation, Investigation, Methodology, Formal analysis, Software, Validation, Visualization, Writing—original draft. P.-s.S.: Data curation, Writing—Review. J.K.: Methodology, Supervision, Writing—Review and Editing. All authors have read and agreed to the published version of the manuscript.

Funding

This research was supported by the MSIT (Ministry of Science and ICT), Korea, under the ICT Creative Consilience Program (IITP-2023-2020-0-01821) and the ICAN (ICT Challenge and Advanced Network of HRD) support program (IITP-2023-RS-2023-00259497), both supervised by the IITP (Institute for Information & Communications Technology Planning & Evaluation).

Data Availability Statement

The data presented in this study are available in this article.

Acknowledgments

Thanks to Korea Electronic Taxation System Association for providing the Market Transaction Dataset in Republic of Korea.

Conflicts of Interest

The funders had no role in the design of the study; in the collection, analyses, or interpretation of data; in the writing of the manuscript, or in the decision to publish the results.

References

  1. Bobadilla, J.; Ortega, F.; Hernando, A.; Gutiérrez, A. Recommender systems survey. Knowl.-Based Syst. 2013, 46, 109–132. [Google Scholar] [CrossRef]
  2. Guo, Q.; Zhuang, F.; Qin, C.; Zhu, H.; Xie, X.; Xiong, H.; He, Q. A survey on knowledge graph-based recommender systems. IEEE Trans. Knowl. Data Eng. 2022, 34, 3549–3568. [Google Scholar] [CrossRef]
  3. Saha, S.K.; Aman, A.; Hossain, S.; Islam, A.; Rodela, R.S. A comparative study on b2b vs. b2c based on asia pacific region. Int. J. Sci. Technol. Res. 2014, 3, 294–298. [Google Scholar]
  4. Zhang, X.; Wang, H. Study on Recommender Systems for Business-to-Business Electronic Commerce. Commun. IIMA 2015, 5, 53–61. [Google Scholar] [CrossRef]
  5. Shambour, Q.; Lu, J. An effective recommender system by unifying user and item trust information for b2b applications. J. Comput. Syst. Sci. 2015, 81, 1110–1126. [Google Scholar] [CrossRef]
  6. Wang, X.; He, X.; Cao, Y.; Liu, M.; Chua, T.-S. KGAT: Knowledge graph attention network for recommendation. In Proceedings of the 25th ACM SIGKDD International Conference on Knowledge Discovery & Data Mining, Anchorage, AK, USA, 4–8 August 2019; pp. 950–958. [Google Scholar] [CrossRef]
  7. Vlachos, M.; Vassiliadis, V.G.; Heckel, R.; Labbi, A. Toward interpretable predictive models in B2B Recommender Systems. IBM J. Res. Dev. 2016, 60, 11:1–11:12. [Google Scholar] [CrossRef]
  8. Rendle, S.; Gantner, Z.; Freudenthaler, C.; Schmidt-Thieme, L. Fast context-aware recommendations with factorization machines. In Proceedings of the 34th International ACM SIGIR Conference on Research and Development in Information Retrieval, Beijing, China, 24–28 July 2011. [Google Scholar] [CrossRef]
  9. He, X.; Chua, T.S. Neural factorization machines for sparse predictive analytics. In Proceedings of the 40th International ACM SIGIR Conference on Research and Development in Information Retrieval, Tokyo, Japan, 7–11 August 2017. [Google Scholar] [CrossRef]
  10. Cheng, H.; Koc, L.; Harmsen, J.; Shaked, T.; Chandra, T.; Aradhye, H.; Anderson, G.; Corrado, G.; Chai, W.; Ispir, M.; et al. Wide & deep learning for recommender systems. In Proceedings of the 1st Workshop on Deep Learning for Recommender Systems, Boston, MA, USA, 15 September 2016. [Google Scholar] [CrossRef]
  11. Song, W.; Shi, C.; Xiao, Z.; Duan, Z.; Xu, Y.; Zhang, M.; Tang, J. Autoint: Automatic feature interaction learning via self-attentive neural networks. In Proceedings of the 28th ACM International Conference on Information and Knowledge Management, Beijing, China, 3–7 November 2019; pp. 1161–1170. [Google Scholar] [CrossRef]
  12. Ai, Q.; Azizi, V.; Chen, X.; Zhang, Y. Learning Heterogeneous Knowledge Base Embeddings for Explainable Recommendation. Algorithms 2018, 11, 137. [Google Scholar] [CrossRef]
  13. Wang, H.; Zhao, M.; Xie, X.; Li, W.; Guo, M. Knowledge graph convolutional networks for Recommender Systems. In Proceedings of the World Wide Web Conference, San Francisco, CA, USA, 13–17 May 2019; pp. 3307–3313. [Google Scholar] [CrossRef]
  14. Lin, Y.; Liu, Z.; Sun, M.; Liu, Y.; Zhu, X. Learning entity and relation embeddings for knowledge graph completion. In Proceedings of the AAAI Conference on Artificial Intelligence, Austin, TX, USA, 25–29 January 2015; Volume 29. [Google Scholar]
  15. Park, E.L.; Cho, S. Konlpy: Korean natural language processing in python. In Proceedings of the 26th Annual Conference on Human & Cognitive Language Technology, Chuncheon, Republic of Korea, 10–11 October 2014. [Google Scholar]
  16. Kim, H.; Cho, S. Cleansing Noisy Text Using Corpus Extraction and String Match. Master’s Thesis, Seoul National University, Seoul, Republic of Korea, February 2013. [Google Scholar]
  17. Jin, Z.; Tanaka-Ishii, K. Unsupervised segmentation of Chinese text by use of branching entropy. In Proceedings of the COLING/ACL on Main Conference Poster Sessions, Sydney, Australia, 17–18 July 2006; pp. 428–435. [Google Scholar] [CrossRef]
  18. G19—Knowledge Driven Recommender Systems: A Case Study on Movielens Dataset. Available online: http://66.42.115.218/static/files/recommender.pdf (accessed on 20 June 2023).
Figure 1. Illustration of the KGAT model framework.
Electronics 12 03536 g001
Figure 2. Industry code distributions of suppliers (left) and buyers (right).
Electronics 12 03536 g002
Figure 3. A sample of collaborative knowledge graph based on buyers’ trade items. Through the knowledge graph (blue dotted line box), even areas not recommended by collaborative filtering (pink dotted line box) can be recommended.
Electronics 12 03536 g003
Figure 4. A sample of collaborative knowledge graph of all entities like keyword, buyer industry code, and buyer’s interested supplier industry code.
Electronics 12 03536 g004
Figure 5. A buyer(item)-based Top@N F1 score. Major industry code is buyers’ major classification code, such as manufacturer (C). The industry code is a complete 6-digit industry code.
Electronics 12 03536 g005
Figure 6. A keyword extraction pipeline from transaction items.
Electronics 12 03536 g006
Figure 7. Performance comparison according to Top N. (In the leftmost chart, the metrics displayed are recall, precision, and hit rate).
Electronics 12 03536 g007
Figure 8. Real example of attention scores between entities.
Electronics 12 03536 g008
Table 1. A sample of the 2018 market transaction dataset in South Korea.
DateSup Biz IndexSup Industry CodeByr Biz IndexByr Industry CodeItem English Name
201802S303C25111B395G46739Triple glass production and delivery
201804S307C21210B508C21210Generic-Dexphine Tabs (300 mg)
201801S613C29241B613C25912January scrap metal
201805S124C11111B402G46331Kooksundang Makgeolli-Rice
201803S106C21210B108G46441Gaslon Tab. 4 mg, et
Table 2. Summary of the market transaction dataset: the number of suppliers, the number of buyers, the number of interactions, and the sparsity of the dataset.
Number of Suppliers6677
Number of Buyers15,279
Number of Interactions347,388
The sparsity of the dataset99.66%
Table 3. A sample of a trading item in natural language processing.
Item NameNouns Extracted Using MecabWords Not in MecabCompound NounPreprocessed New Word
Johnnie Walker Blue Sales CommissionSales, CommissionJohnnie Walker Blue, Sales CommissionSales CommissionJohnnie Walker Blue
Table 4. Comparison of the overall performance in the test set based on the average results obtained from five different random seeds.
ModelsRecall@20Hit@20
Random0.00130.0498
KGAT0.21210.3639
KGCN0.19480.3348
AutoInt0.06070.2911
FM0.15430.2813
Table 5. The KGAT performance comparison according to relations.
RelationsRecall@20Precision@20Hit@20# Triples
Interested Supplier Industry Code0.2240.03650.3834469,594
Buyer Industry Code0.22780.03620.379229,302
Keyword0.2110.03450.36263,488,792
All Three0.21160.03430.36123,987,688
Disclaimer/Publisher’s Note: The statements, opinions and data contained in all publications are solely those of the individual author(s) and contributor(s) and not of MDPI and/or the editor(s). MDPI and/or the editor(s) disclaim responsibility for any injury to people or property resulting from any ideas, methods, instructions or products referred to in the content.

