Article

Improved Parallel Implementation of 1D Discrete Wavelet Transform Using CPU-GPU

by
Eduardo Rodriguez-Martinez
,
Cesar Benavides-Alvarez
,
Carlos Aviles-Cruz
*,†,
Fidel Lopez-Saca
and
Andres Ferreyra-Ramirez
Electronics Department, Autonomous Metropolitan University, Av. San Pablo 180, Col. Reynosa, Mexico City 02200, Mexico
*
Author to whom correspondence should be addressed.
These authors contributed equally to this work.
Electronics 2023, 12(16), 3400; https://doi.org/10.3390/electronics12163400
Submission received: 23 July 2023 / Revised: 3 August 2023 / Accepted: 8 August 2023 / Published: 10 August 2023
(This article belongs to the Topic Theory and Applications of High Performance Computing)

Abstract

:
This work describes a data-level parallelization strategy to accelerate the discrete wavelet transform (DWT) which was implemented and compared in two multi-threaded architectures, both with shared memory. The first considered architecture was a multi-core server and the second one was a graphics processing unit (GPU). The main goal of the research is to improve the computation times for popular DWT algorithms for representative modern GPU architectures. Comparisons were based on performance metrics (i.e., execution time, speedup, efficiency, and cost) for five decomposition levels of the DWT Daubechies db6 over random arrays of lengths 10 3 , 10 4 , 10 5 , 10 6 , 10 7 , 10 8 , and 10 9 . The execution times in our proposed GPU strategy were around 1.2 × 10 5 s, compared to 3501 × 10 5 s for the sequential implementation. On the other hand, the maximum achievable speedup and efficiency were reached by our proposed multi-core strategy for a number of assigned threads equal to 32.

1. Introduction

Nowadays, the number of electronic devices has increased worldwide, and with it has come the need for more memory and more processing capacity, which has resulted in the need to reduce signal processing time.
Significant progress has been made in optimizing algorithms, both in terms of processing time and the accuracy of results. Central processing units (CPUs) perform optimally for the design and technology conditions (nanometers) they are given, i.e., memory, number of cores, bandwidth, processing speed. CPUs are designed to execute algorithms sequentially. However, new techniques are constantly being explored to increase efficiency in terms of time and information processing capacity. An alternative approach is, therefore, parallel programming [1]. Running algorithms in parallel implies a change in the programming paradigm [2], which becomes a challenge for the software engineering community [3]. The effectiveness and efficiency of the algorithms (serial or parallel) developed and implemented are continuously evaluated and improved, taking into account parameters such as execution time, speedup, efficiency, and cost [4]. The general term used to describe the difficulty of an algorithm is “computational complexity”. Complexity is applied to both serial and parallel algorithms.
Parallel algorithms can be designed and implemented in shared memory or non-shared memory [5,6,7]. Parallelizing algorithms on GPUs is more complicated. The number of basic operations, the type of arithmetic, the logic used, and the memory accesses directly affect the actual computation time. As a result, algorithms (serial or parallel) implemented on both CPUs and GPUs must have the following characteristics: versatility, simplicity, ease of implementation, ease of modification, use of hardware resources, speedup achieved, communication complexity, synchronization, and portability, among others.
There are several papers in the literature on the implementation of DWT filter banks and DWT applications. In the following, we describe the application areas.
In the analysis of EEG signals, DWT has been used to remove noise caused by involuntary facial gestures [8,9], to detect movement intention (MI) has focused on the design of descriptors that allow a better characterization of electroencephalographic signals (EEG) [10], for pinpointing the source of chronic stress [11], for human emotion detection and classification [12], and for epileptic seizure identification [13]. Using DWT in portable computing applications is attractive since it can be implemented in devices with low power consumption without losing computing capacity. That combination would eliminate the compromise between power consumption and performance, affecting most brain–computer interface (BCI) systems. Overall strategies to eliminate the compromise mentioned above tend to detect the start of MI through a separate unit. Such a unit is independent of the BCI and acts in real time, thus avoiding turning on the BCI every time there is a false positive. For instance, the work in [14] presents a wavelet-based strategy that reduces the MI onset detection time (OdT) to three seconds. However, in lag-sensitive applications [15,16,17], one expects the OdT to be below one second. On the other hand, the work in [14] not only uses the DWT to characterize the EEG signal but also forms a feature vector composed of auto-regression and FFT coefficients. This vector is projected onto a space with better discrimination and lower dimensionality using Fisher’s discriminant analysis method (FDA). After being projected, the low-dimensional descriptor trains a classifier that produces a reliable MI start label.
The Dabuchies DWT has also been applied in several areas such as audio compression [18], analysis and quantification of in vitro drug dissolution behaviours [19], detection of muscle fatigue during intense mouse use [20], discrimination of air pollutants [21], cardiac arrhythmia classification using electrocardiogram signals [22], and uncovering cadmium pollution in lettuce leaves [23]. Its popularity in such a wide range of applications is due to its high selectivity and ability to filter information.
In terms of DWT implementations, the most prominent structures are lifting [24], polyphase [25], direct matrix-based [26], and lattice [27]. Based on the construction of a transformation matrix and a Fourier transform, the classical DWT algorithm is a direct implementation of a two-channel filter bank [28].
The paper that comes closest to our proposal is Stokfiszewski [29], where the authors present implementation variants of the discrete wavelet transform (DWT) algorithm and compare their execution times with those of GPUs. The authors avoid short and slow modular splits for low-pass, band-pass, and high-pass filters. The number of data points processed in their algorithm varies from 256 to 8,388,608.
This work proposes a data-level parallelization strategy to accelerate the computation of the DWT for the Dabubechies family. This strategy was implemented and compared in two multi-threaded architectures with shared memory. The first considered architecture was a multi-core server, where one or more processes are assigned to each core. The second architecture was a graphics processing unit (GPU) programmed using CUDA. Comparison metrics were based on execution times for five decomposition levels of the DWT Daubechies db6 over random arrays of lengths 10 3 , 10 4 , 10 5 , 10 6 , 10 7 , 10 8 , and 10 9 .
Comparing our proposal with Stokfiszewski’s work [29], we can say that we work with a larger number of data, 1,000,000,000 (10 9 ), i.e., they process only 0.83% of our data. The processing times with our proposal are much lower, as can be seen in the results section. A final advantage of our proposal is that the DWT coefficients are introduced directly into the convolution matrices. We emphasize that our approach is not comparable to any other work found in the literature, as it depends strongly on the technology used, i.e., CPU speed, memory, and GPU type.
The organization of this paper is as follows. Section 2 details the proposed methodology. Section 3 shows the experimental results. Finally, Section 4 argues the limitations of this work and presents courses for future action.

2. 1D Discrete Wavelet Transform

The DWT heart consists of the iterative application of a pair of orthonormal filters, a low-pass filter g = [ g 0 , g 1 , g 2 , , g m 1 ] , and a high-pass filter h = [ h 0 , h 1 , h 2 , , h m 1 ] , defined by the coefficients of their respective impulse response, { g j } and { h j } , j = 0 , 1 , 2 , , m 1 . Figure 1 shows the cascade structure of the DWT for three decomposition levels.
Given the input signal x = [ x 0 , x 1 , x 2 , , x n 1 ] , with n > > m , its discrete wavelet transform at the k-th decomposition level is given by the approximation and detail coefficients, A k and D k , respectively, defined as
A k = 2 g A k 1 D k = 2 h A k 1
where k = 1 , 2 , , L , A 0 = x , 2 ( y ) indicates subsampling of signal y, and ( w z ) denotes convolution between the discrete signals w and z.
At each decomposition level, the response of both filters to the input A k 1 has to be calculated as the convolution with their respective impulse responses. Let y = g A k 1 be the response of filter g to the input A k 1 , with length p = n + m 1 . Each element of y can be expressed as
y [ i ] = j = 0 m 1 g [ j ] A k 1 [ i j ]
where y [ j ] = y j is the j-th element of array y. We can observe in Equation (1) that each y [ i ] only depends on m elements of A k 1 ; consequently, it is possible to parallel compute all elements of y. That scheme can be used to compute the response of both filters to the input A k 1 , thus achieving a single decomposition level in the DWT at once. To implement db6 DWT using the cascade structure, the coefficients of each filter are set as shown in Table 1.

3. Methodology

The following subsections describe two implementations of the db6 DWT, which differ in the parallel strategy adopted to compute the elements of y. The first implementation was carried out in a multi-core architecture with shared memory, where the number of simultaneously executed threads equals the number of available cores. The second implementation was carried out in a GPU, which can simultaneously execute as many tasks as operations are needed. Each implementation takes advantage of the unique characteristics of the architecture to maximize throughput.

3.1. Sequential Multi-Core Strategy

The strategy designed for the multi-core architecture is shown in Figure 2 as a block diagram. It consists of four operations inside the main loop. Each iteration in the main loop performs a one-level decomposition of signal A k 1 . The first operation performs padding on A k 1 by concatenating the last m elements of A k 1 at its head and the first m elements of A k 1 at its tail. The padding described above was used to implement circular convolution as described in [30].
The second operation in the main loop of Figure 2 performs parallel convolution on the padded signal. It creates t threads, each of which computes q elements of the convolution sequence y, so that the relationship p = q t + r is met, where r Z + is the number of extra operations assigned to the first r threads. The k-th thread computes y [ i ] , i E k = { k 1 , t + k 1 , 2 t + k 1 , , p t + k 1 } , so that | E k | = q , k { 1 , 2 , 3 , , t } , when r = 0 . On the other hand, when 0 < r < t , the first r threads additionally compute the elements y [ j ] , j = q t + 1 , q t + 2 , , q t + r . Each thread computes the convolution sequence for both filters, the low-pass filter response is stored in the array R g , and the high-pass filter response is stored in the array R h .
The third block subsamples the filter responses to the padded signal. Padding is removed after subsampling, discarding the first and last m elements of R g and R h , leading into the approximation coefficients A k and the detail coefficients D k . Finally, the fourth operation, depicted as block number four in Figure 2, saves A k and D k .

3.2. Parallel Graphics Processing Unit Strategy

Figure 3 shows our proposed GPU strategy. It mainly differs from our multi-core strategy in how convolution is computed. Equation (2) presents the symmetrical version of Equation (1). It is called symmetrical because m / 2 elements before and after A k 1 [ i ] are required to compute y [ i ] .
y [ i ] = j = 0 m 1 g [ m 1 j ] A k 1 j m 1 2 + i
There is an additional requirement for Equations (1) and (2) to produce the same convolution sequence; both convolutions must be circular. Therefore, padding A k 1 is needed again, but only m elements are added. As can be seen in Figure 3, padding concatenates the last m / 2 elements of A k 1 at its head, and the first m / 2 elements of A k 1 at its tail.
Once padding has been performed, we compute y using as many threads as there are elements in the convolution sequence, since each thread computes one element of y [ i ] . Threads belong to computational units called CUDA blocks. The number of CUDA blocks b is automatically computed using the relationship p = a b + c , where a is the number of threads per block, and c Z + is the number of extra operations assigned to the last CUDA block. The number of assigned CUDA blocks b is a function of p and a. Thus, for an input signal of n = 10 3 samples, a filter with m = 12 coefficients, and a = 32 threads per CUDA block, b p a = 10 3 + 12 1 32 = 31.59 , setting b = 31 give us a b = 992 threads, thus the last CUDA block would need to perform c = p a b = 19 extra operations. The number of CUDA blocks changes at each decomposition level because p also changes. Within each decomposition level, the number of CUDA blocks is computed in the same way as in the last example. The computational model in CUDA requires building a grid of blocks. Therefore, each block is modeled as a grid of threads. For this work’s purposes, we consider one-dimensional grids for both blocks and threads, as shown in Figure 3. Therefore, each block is a one-dimensional array of threads.
Equation (2) also can be used to compute the high-pass filter response, substituting the filter coefficients g with those of h. Thus, each thread computes one element of both responses, which are stored in R g and R h , respectively. The following stages in our proposed GPU strategy are similar to those of the multi-core strategy except that subsampling only removes m / 2 samples from the start and end of both R g and R h to produce A k and D k , respectively.
Both { g j } and { h j } are stored in constant memory, but x and y are stored in shared memory. The arrays holding x and y are allocated using the cudaMalloc instruction. Data exchange between GPU and CPU is implemented by means of the cudaMemcpy instruction.

4. Experimental Setup and Results

The parallel architecture selected to implement the proposed multi-core strategy consisted of a PowerEdge T630 server with two Intel Xeon E5-2670 v3 and 70 GB in RAM running on Ubuntu 18.04. Each processor hosts 12 cores and manages up to 24 active threads simultaneously. The GPU strategy was implemented on an NVIDIA GeForce GTX 1080 with the characteristics listed in Table 2. All programs were implemented using the C language and compiled using gcc version 7.4.0, the OpenMP API for the multi-core strategy (release 5.0.1), and the CUDA API (release 9.1) for the GPU strategy. The accuracy will be the same as both the CPU and GPU are configured for simple FP64 precision.

4.1. Parallel Convolution Performance and Scalability

Since parallel convolution is the core of both proposed strategies, we analysed its performance using three standard metrics: speedup, efficiency, and cost. Additionally, we measured the scalability of parallel convolution by computing each of the metrics mentioned above over a set of test signals with lengths varying from 10 3 to 10 9 with a unit increment in the exponent. The test signals were built using a Gaussian random number generator with zero mean and unit covariance. The parallel convolution algorithm in each proposed strategy was used to compute the convolution of each test signal with the impulse response of the low-pass filter g detailed in Table 1. Since the algorithm performance depends on the number of assigned threads t, we decided to compute the referred metrics as t changes from 2 to 512.

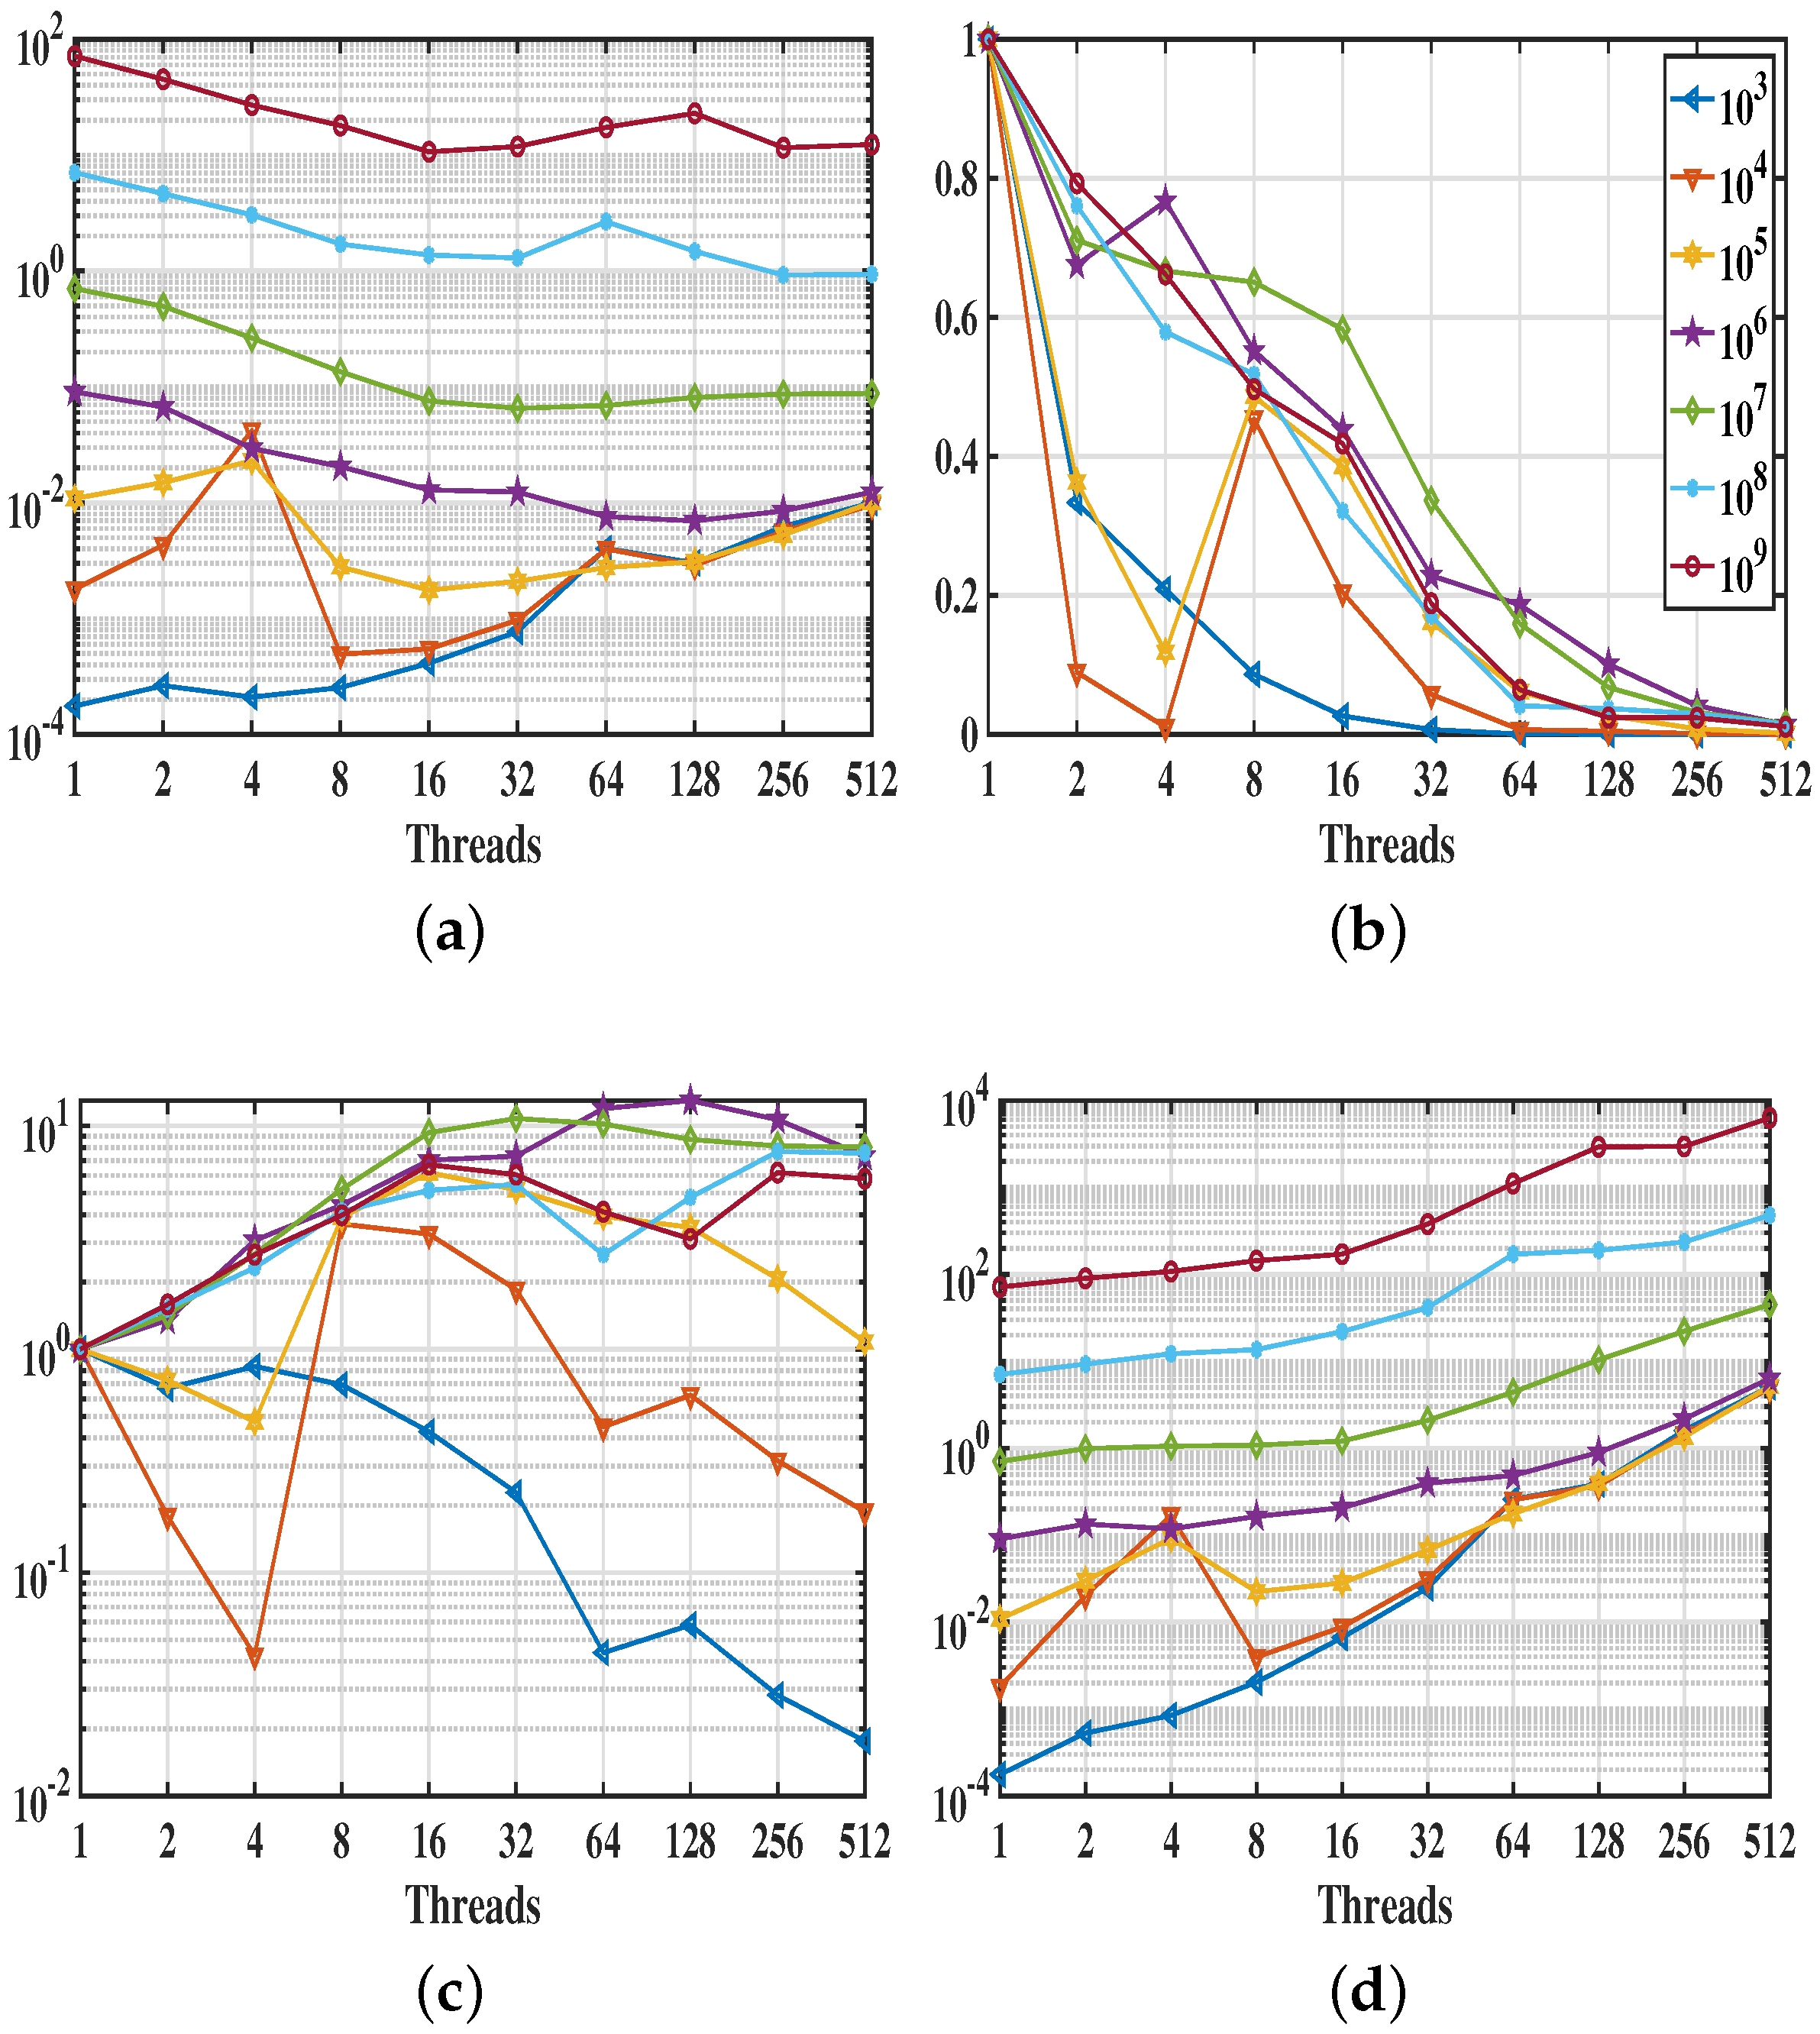
4.1.1. Multi-Core Strategy

The plots shown in Figure 4 describe the parallel convolution performance and scalability for the proposed multi-core strategy. As expected, execution times are reasonably linear; the more threads are assigned to the algorithm, the faster it finishes. Regarding speedup, the algorithm displays a sublinear behaviour for most test signals, except for the lengths 10 3 and 10 4 . Considering efficiency measures the amount of time a thread is active, the parallel convolution algorithm assigns less work to a given thread as the number of threads increases, thus decreasing the time each thread remains active. As a result, the efficiency becomes almost linear as the test signal length increases.
Based on the previous results, the proposed parallel convolution algorithm scales relatively well to the input size, showing an efficiency increase with the input size for a given number of assigned threads. The algorithm can also be cost-optimal by adjusting the number of assigned threads and the input size. Cost-optimality occurs when the algorithm is assigned between 32 and 64 threads, and the test signal length is greater than 10 6 .

4.1.2. Graphics Processing Unit Strategy

The fundamental difference between the multi-core and GPU strategies lies in how the total number of convolution elements p is divided among threads. In the multi-core strategy, each thread must compute q = p / t elements of y, while in the GPU strategy, each thread computes one element of y; thus, we need to create p threads at once. Threads are grouped and executed in CUDA blocks, which are assigned and executed in multiprocessors [31]. We can change the amount of work performed by each multiprocessor, varying the number of assigned threads t.
The performance and scalability analysis of the parallel convolution algorithm in our proposed GPU strategy followed the same design as in the multi-core strategy. However, due to constraints in the memory size of the selected GPU, the maximum test signal length was 10 8 . The plots in Figure 5 detail the analysis results, where instead of changing the number of threads assigned to the parallel convolution algorithm, we changed the number of threads t per CUDA block. Execution times significantly decrease compared to the parallel convolution in our multi-core strategy. Nonetheless, all the curves in Figure 5a show similar behaviour and range within the same interval, pointing out that there is not a significant difference between the amount of work performed by the parallel convolution as the test signal length increases.
Although speedup is less impressive than in the multi-core strategy, where almost a 10-fold gain can be achieved, the parallel convolution algorithm behaviour is sublinear for all the test signals. Efficiency and cost plots are linear, in log scale, after four threads per CUDA block have been assigned. The curves in Figure 5b,d for all test signals are almost identical. Hence, the scalability of parallel convolution in our proposed GPU strategy scales better than that of the multi-core strategy, as the efficiency and cost can be kept constant as the problem size increases. This algorithm can also reach cost-optimality by assigning 32 threads per CUDA block, as in this point we achieve a fair trade-off between speedup, efficiency and cost.

4.2. Dwt Performance and Scalability

To test the cascade implementation performance and scalability, we computed the db6 DWT of each test signal using a five-level decomposition; thus, the parallel convolution algorithm was executed five times, one per decomposition level. The number of assigned threads was kept constant among levels. We recorded the DWT execution time for each test signal and computed speedup, efficiency and cost. This analysis was performed for both strategies. The performance and scalability results for the multi-core strategy are shown in Figure 6 and those for the GPU strategy are displayed in Figure 7.

4.2.1. Multi-Core Strategy

Execution times for a five-level DWT decomposition using the multi-core strategy are displayed in Figure 6a. Each curve in the referred to subfigure shows how the execution time changes with the number of assigned threads t for a given test signal. One should note that one can tell each curve apart before t = 32 ; after that, all curves cluster together in a single linear trend. A similar behaviour is observed for cost curves in Figure 6d, as the cost is defined as the product of execution time and the number of assigned threads. Thus, the DWT execution time is almost the same for all test signals after t = 32 , no matter the input size. Regarding speedup, the multi-core DWT implementation inherits the parallel convolution properties, showing a sublinear behaviour for all test signals, as can be observed in Figure 6c. Efficiency curves for all test signals show an inflexion point at different t values; all efficiency curves are almost parallel and decrease linearly after that point.
Based on our previous analysis, an appropriate DWT operation point in the multi-core strategy is t = 32 , as it offers a good trade-off between execution time, efficiency, speedup, and cost. Additionally, such an algorithm boasts excellent scalability, as efficiency can be kept constant by increasing the number of assigned threads and the test signal length.

4.2.2. Graphics Processing Unit Strategy

The GPU DWT implementation loses the desired characteristics of its multi-core counterpart, namely, excellent scalability and inflexion points in the efficiency and speedup curves. It also inherits the properties of its parallel convolution algorithm, that is to say, similar execution times, efficiencies, and costs for all test signal lengths as the number of threads per CUDA block changes, as can be observed in Figure 7a,b,d, respectively. Execution times are also significantly lower than in the DWT multi-core implementation. The fact that we launch as many threads as elements in the convolution sequence leads to flat execution time and speedup curves after t = 8 , as it will always launch p threads in total, no matter how many threads are assigned per CUDA block. Based on the previous analysis and the results shown in Figure 7, we can say that an appropriate DWT operation point in the GPU strategy is t = 8 , as at such a point we achieve the highest speedup and similar execution times, for most test signals.

5. Comparison vs. Most Competitive Work

The comparison is made with the most recent work found in the bibliography [29], as the other articles found are more than five years old. The main reason is that the performance of the algorithms (both serial and parallel) depends strongly on the equipment used, i.e., CPU, memory, GPU, among others. In the present proposal, four performance parameters are analysed: execution time, speedup, efficiency, and cost. By comparison, Stokfiszewski’s work [29] only presents the execution time.
The first advantage of our proposal is the number of data to be processed (see Table 3). The maximum number processed by Stokfiszewski is 2 23 , that is, 8 , 388 , 608 elements.
Comparing this proposal with Stokfiszewski’s work, the proposal works with a larger number of data, 1,000,000,000 ( 10 9 ) , that is, they process only 0.83 % of the number of elements processed in this proposal.
The second and main advantage of our proposal is the processing time. In the case of CPU processing (see Table 4), our results are better when processing more than one million elements. As for GPU processing (see Table 5), our results are more or less constant and better than those of the compared author.

6. Conclusions and Further Research

We presented a data-level parallelization strategy to accelerate DWT computation. Said strategy was implemented and compared in two multi-threaded architectures, each with shared memory. The first considered architecture was a multi-core server and the second one was a graphics processing unit (GPU). All programs were implemented using the C language, the OpenMP API for the multi-core server, and the CUDA API for the GPU. The DWT was implemented through the cascade structure shown in Figure 1, which consists in iteratively applying a pair of orthonormal filters to the approximation coefficients (i.e., the low-pass filter response). As the main operation to compute the approximation and detail coefficients at each decomposition level is convolution, the proposed data-level parallelization strategy focused on distributing the computation of convolution sequence elements among as many threads as possible, leading to the design of a parallel convolution algorithm.
The convolution sum structure was a significant difference in the parallel convolution algorithm designed for each architecture, which led to two different padding methods. The multi-core strategy used the classical convolution sum described in Equation (1), where causal filters are assumed. Conversely, the GPU strategy used the symmetric convolution described in Equation (2), where time-centred filters are assumed. The resulting convolution sequences are equivalent up to a unit delay.
We analysed the parallel convolution algorithm using execution times, speedup, efficiency and cost as performance metrics in each multi-threaded architecture. The results showed that the multi-core strategy scales reasonably well with the input size. However, execution times remain high compared to those of the GPU strategy. Furthermore, both parallel implementations displayed sublinear behaviour in their speedup curves as the number of assigned threads increased. However, there was no significant gain after t = 8 in the GPU strategy because the workload is already evenly distributed among threads. Based on the performance analysis results, we were able to identify an optimal number of threads assigned to the parallel convolution algorithm for both architectures. That number nearly matches the available cores in the multi-core strategy, while in the GPU strategy, it is convenient to select the smallest t in the flat zone of the speedup curves.
To sum up, although the multi-core strategy boasts excellent scalability, the GPU strategy is preferred as it is faster. It is recommended to use the multi-core strategy for signals greater than 10 8 elements in length, as the GPU architecture cannot allocate enough RAM in the selected device.
Future work involves implementing better convolution schemes that reduce RAM requirements, such as overlap-and-add or overlap-and-save, in frequency space. Additionally, we could design truly parallel DWT algorithms, taking advantage of hardware pipeline designs that improve throughput, such as the lifting scheme.

Author Contributions

Conceptualization, C.A.-C. and F.L.-S.; methodology, C.A.-C., C.B.-A. and F.L.-S.; software, C.B.-A. and F.L.-S.; validation, C.A.-C., E.R.-M. and F.L.-S.; formal analysis, C.A.-C., A.F.-R., C.B.-A. and F.L.-S.; investigation, C.A.-C. and F.L.-S.; resources, C.A.-C. and A.F.-R.; data curation, C.B.-A. and F.L.-S.; writing—original draft preparation, C.A.-C.; writing—review and editing, C.A.-C.; supervision, C.A.-C.; project administration, E.R.-M. All authors have read and agreed to the published version of the manuscript.

Funding

This research received no external funding.

Institutional Review Board Statement

Not applicable.

Informed Consent Statement

Not applicable.

Data Availability Statement

The data that support the findings of this study are available from the corresponding author upon request.

Conflicts of Interest

The authors declare no conflict of interest.

References

  1. Yin, F.; Shi, F. A Comparative Survey of Big Data Computing and HPC: From a Parallel Programming Model to a Cluster Architecture. Int. J. Parallel Program. 2022, 50, 27–64. [Google Scholar]
  2. Di Rocco, L.; Ferraro Petrillo, U.; Palini, F. Using software visualization to support the teaching of distributed programming. J. Supercomput. 2023, 79, 3974–3998. [Google Scholar] [CrossRef]
  3. Umayanganie Munipala, W.; Moore, S.V. Position paper: An evaluation framework for scientific programming productivity. In Proceedings of the 2016 IEEE/ACM International Workshop on Software Engineering for Science (SE4Science), Austin, TX, USA, 16 May 2016; pp. 27–30. [Google Scholar]
  4. Barlas, G. Computer Architecture: A Quantitative Approach, 2nd ed.; Morgan Kaufmann: Burlington, MA, USA, 2022. [Google Scholar]
  5. Gulcan, S.; Ozdal, M.M.; Aykanat, C. Load balanced locality-aware parallel SGD on multicore architectures for latent factor based collaborative filtering. Future Gener. Comput. Syst. 2023, 146, 207–221. [Google Scholar] [CrossRef]
  6. Ketchaya, S.; Rattanatranurak, A. Parallel Multi-Deque Partition Dual-Deque Merge sorting algorithm using OpenMP. Sci. Rep. 2023, 13, 6408. [Google Scholar] [CrossRef]
  7. Williams-Young, D.B.; Asadchev, A.; Popovici, D.T.; Clark, D.; Waldrop, J.; Windus, T.L.; Valeev, E.F.; De Jong, W.A. Distributed memory, GPU accelerated Fock construction for hybrid, Gaussian basis density functional theory. J. Chem. Phys. 2023, 158, 234104. [Google Scholar] [CrossRef]
  8. Peng, H.; Hu, B.; Shi, Q.; Ratcliffe, M.; Zhao, Q.; Qi, Y.; Gao, G. Removal of ocular artifacts in EEG—An improved approach combining DWT and ANC for ubiquitous applications. IEEE J. Biomed. Health Inform. 2013, 17, 600–607. [Google Scholar] [CrossRef]
  9. Hu, B.; Peng, H.; Zhao, Q.; Hu, B.; Majoe, D.; Zheng, F.; Moore, P. Signal quality assessment model for wearable EEG sensor on prediction of mental stress. IEEE Trans. Nanobioscience 2015, 14, 553–561. [Google Scholar]
  10. Guger, C.; Allison, B.Z.; Miller, K. (Eds.) Brain-Computer Interface Research: A State-of-the-Art Summary 8; SpringerBriefs in Electrical and Computer Engineering; Springer: Cham, Switzerland, 2020. [Google Scholar]
  11. Peng, H.; Hu, B.; Zheng, F.; Fan, D.; Zhao, W.; Chen, X.; Yang, Y.; Cai, Q. A method of identifying chronic stress by EEG. Pers. Ubiquitous Comput. 2013, 17, 1341–1347. [Google Scholar] [CrossRef]
  12. Wagh, K.P.; Vasanth, K. Performance evaluation of multi-channel electroencephalogram signal (EEG) based time frequency analysis for human emotion recognition. Biomed. Signal Process. Control 2022, 78, 103966. [Google Scholar] [CrossRef]
  13. Sharmila, A.; Geethanjali, P. DWT based detection of epileptic seizure from EEG signals using naive bayes and k-nn classifiers. IEEE Access 2016, 4, 7716–7727. [Google Scholar] [CrossRef]
  14. Chamanzar, A.; Shabany, M.; Malekmohammadi, A.; Mahammadinejad, S. Efficient hardware implementation of real-time low-power movement intention detector system using FFT and adaptive Wavelet transform. IEEE Trans. Biomed. Circ. Syst. 2017, 11, 585–596. [Google Scholar] [CrossRef]
  15. Healey, J.A.; Picard, P.W. Detecting stress during real-world driving task using physiological sensors. IEEE Trans. Intell. Transp. Syst. 2005, 6, 156–166. [Google Scholar] [CrossRef] [Green Version]
  16. Strickland, E. Mind games. IEEE Spectr. 2018, 55, 40–41. [Google Scholar] [CrossRef]
  17. Qiu, S.; Li, Z.; He, W.; Zhang, L.; Yang, C.; Su, C.Y. Brain-machine interface and visual compressive sensing-based teleoperation control of an exoskeleton robot. IEEE Trans. Fuzzy Syst. 2017, 26, 58–59. [Google Scholar] [CrossRef] [Green Version]
  18. Ali, A.H.; George, L.E. High synthetic audio compression model based on fractal audio coding and error-compensation. Ann. Emerg. Technol. Comput. 2022, 2, 1–12. [Google Scholar]
  19. Ding, E.; Ozdemir, N.; Ustundag, O.; Buker, E.; Tikan, G.; Hoang, V.D. Wavelet signal processing tools for quantifying and monitoring the in-vitro dissolution profiles of Tenofovir Disoproxil Fumarate and Emtricitabine in tablets. J. Mex. Chem. Soc. 2022, 66, 488–499. [Google Scholar]
  20. Mota-Carmona, J.R.; Pérez-Escamirosa, F.; Minor-Martínez, A.; Rodríguez-Reyna, R.M. Muscle fatigue detection in upper limbs during the use of the computer mouse using discrete wavelet transform: A pilot study. Biomed. Signal Process. Control 2022, 76, 103711. [Google Scholar]
  21. Dong, Y.; Zhou, H.; Fu, Y.; Li, X.; Geng, H. Wavelet periodic and compositional characteristics of atmospheric PM2.5 in a typical air pollution event at Jinzhong city, China. Atmos. Pollut. Res. 2021, 12, 245–254. [Google Scholar] [CrossRef]
  22. Wang, Y.; Yang, G.; Li, S.; Li, Y.; He, L.; Liu, D. Arrhythmia classification algorithm based on multi-head self-attention mechanism. Biomed. Signal Process. Control 2023, 79, 104206. [Google Scholar] [CrossRef]
  23. Zhou, X.; Zhao, C.; Sun, J.; Cao, Y.; Fu, L. Classification of heavy metal Cd stress in lettuce leaves based on WPCA algorithm and fluorescence hyperspectral technology. Infrared Phys. Technol. 2021, 119, 103936. [Google Scholar] [CrossRef]
  24. La Cour-Harbo, A.; Jensen, A. Wavelets and the Lifting Scheme. In Encyclopedia of Complexity and Systems Science; Meyers, R.A., Ed.; Springer: New York, NY, USA, 2009; pp. 10007–10031. [Google Scholar]
  25. Relkar, R.E.; Rathkanthiwar, A.P. VLSI architecture design for DWT: Using polyphase and pipelining and their effective comparasion. In Proceedings of the 2015 International Conference on Information Processing (ICIP), Pune, India, 16–19 December 2015; pp. 828–832. [Google Scholar] [CrossRef]
  26. Zhi, L.; Liu, W.; Liu, Q. Matrix Operation of Discrete Wavelet Transform. In Proceedings of the 2012 International Conference on Industrial Control and Electronics Engineering, Hangzhou, China, 23–25 March 2012; pp. 1214–1216. [Google Scholar] [CrossRef]
  27. Wang, Y.; Li, Z.; Wang, C.; Feng, L.; Zhang, Z. Implementation of discrete wavelet transform. In Proceedings of the 2014 12th IEEE International Conference on Solid-State and Integrated Circuit Technology (ICSICT), Guilin, China, 28–31 October 2014; pp. 1–3. [Google Scholar]
  28. Nicolier, F.; Laligant, O.; Truchetet, F. Discrete wavelet transform implementation in Fourier domain for multidimensional signal. J. Electron. Imaging 2002, 11, 338–346. [Google Scholar]
  29. Kamil, S.; Kamil, W.; Mykhaylo, Y. An efficient implementation of one-dimensional discrete wavelet transform algorithms for GPU architectures. J. Supercomput. 2022, 78, 11539–11563. [Google Scholar]
  30. Proakis, J.; Manolakis, D. Digital Signal Processing: Principles, Algorithms, and Applications; Pearson-Prentice Hall: Hoboken, NJ, USA, 2007. [Google Scholar]
  31. Hennessy, J.; Patterson, D. Computer Architecture: A Quantitative Approach, 6th ed.; Morgan Kaufmann: Burlington, MA, USA, 2019. [Google Scholar]
Figure 1. DWT cascade structure for three decomposition levels.
Electronics 12 03400 g001
Figure 2. Multi-core strategy for parallel DWT.
Electronics 12 03400 g002
Figure 3. GPU strategy for parallel DWT.
Electronics 12 03400 g003
Figure 4. Scalability and performance analysis of parallel convolution for the multi-core strategy. The number of threads t assigned to compute the convolution sequence is shown on the x-axis. The legend in (b) shows the colour and marker used to plot the results for each test signal. (a) Execution time (s). (b) Efficiency. (c) Speedup. (d) Cost.
Electronics 12 03400 g004
Figure 5. Scalability and performance analysis of parallel convolution for the GPU strategy. The number of threads t per CUDA block assigned to compute the convolution sequence is shown in the x-axis. The legend in (a) shows the colour and marker used to plot the results for each test signal. (a) Execution time (s). (b) Efficiency. (c) Speedup. (d) Cost.
Electronics 12 03400 g005
Figure 6. Scalability and performance analysis of the DWT for the multi-core strategy. The number of threads t assigned to the parallel convolution is shown in the x-axis. The legend in (a) shows the colour and marker used to plot the results for each test signal. (a) Execution time (s). (b) Efficiency. (c) Speedup. (d) Cost.
Electronics 12 03400 g006
Figure 7. Scalability and performance analysis of the DWT in the GPU strategy. The number of threads t per CUDA block assigned to the parallel convolution is shown in the x-axis. The legend in (a) shows the colour and marker used to plot the results for each test signal. (a) Execution time (s). (b) Efficiency. (c) Speedup. (d) Cost.
Electronics 12 03400 g007
Table 1. Filter coefficients needed to implement db6 DWT.
j01
h j −0.11154074340.4946238904
g j −0.00107730110.0047772575
j23
h j −0.75113390800.3152503517
g j 0.0005538422−0.0315820393
j45
h j 0.2262646940−0.1297668676
g j 0.02752286550.0975016056
j67
h j −0.09750160560.0275228655
g j −0.1297668676−0.2262646940
j89
h j 0.03158203930.0005538422
g j 0.31525035170.7511339080
j1011
h j −0.0047772575−0.0010773011
g j 0.49462389040.1115407434
Table 2. Device GeForce GTX 1080.
AttributeValue
CUDA driver version/runtime version11.0/10.2
CUDA capability6.1
Total amount of global memory8 GB
(20) Multiprocessors, (128) CUDA cores/MP2560 CUDA cores
Maximum number of threads per multiprocessor2048
Maximum number of threads per block1024
Max dimension size of a thread block (x, y, z)(1024, 1024, 64)
Max dimension size of a grid (x, y, z)(2,147,483,647, 65,535, 65,535)
Table 3. Comparison of maximum data processing length.
Data Size 1Data Size 2Data Size 3Data Size 4Data Size 5Data Size 6Data Size 7
Stokfiszewski [29] 2 10 2 13 2 17 2 20 2 23
Proposal 10 3 10 4 10 5 10 6 10 7 10 8 10 9
Table 4. Comparison of computing time using CPU for filter length 4 (milliseconds).
Length/Time
Stokfiszewski [29] 2 10 / 0.001 2 13 / 0.014 2 17 / 0.227 2 20 / 1.879 2 23 / 18.14
Proposal 10 3 / 1 . 10 4 / 1.01 10 5 / 1.1 10 6 / 1.15 10 7 / 1.2 10 8 / 1.25 10 9 / 1.3
Table 5. Comparison of computing time using GPU for filter length 4 (milliseconds).
Length/Time
Stokfiszewski [29] 2 10 / 0.1971 2 13 / 0.2339 2 17 / 0.6547 2 20 / 4.6263 2 23 / 30.1746
Proposal 10 3 / 0.12 10 4 / 0.12 10 5 / 0.121 10 6 / 0.123 10 7 / 0.123 10 8 / 0.125
Disclaimer/Publisher’s Note: The statements, opinions and data contained in all publications are solely those of the individual author(s) and contributor(s) and not of MDPI and/or the editor(s). MDPI and/or the editor(s) disclaim responsibility for any injury to people or property resulting from any ideas, methods, instructions or products referred to in the content.

