1. Introduction
The inception of requirements specification in software engineering can be traced back to the nascent stages of software development, characterized by ad hoc project execution and a lack of standardized or formalized requirements gathering procedures. As the field of software development progressed and the demand for higher quality software intensified, there arose a compelling need for a more structured and formalized approach to requirements gathering and specification.
In the 1970s and 1980s, a number of software development methodologies and frameworks were developed that emphasized the importance of requirements gathering and specification, such as structured analysis and design, information engineering, and entity-relationship modeling. Some more systematic software management methods were also proposed. The waterfall model, known for its linear and sequential nature, places a significant emphasis on upfront requirement gathering and specification. However, this method may encounter challenges in managing evolving requirements or incorporating feedback from stakeholders during later stages of development. V-model emphasizes thorough upfront planning and the validation of requirements through well-defined stages. While this approach provides a structured framework for software development, it can be less flexible when accommodating changing requirements or incorporating feedback during the development process. Agile methodologies, characterized by iterative and incremental development, have gained prominence for their ability to adapt to changing requirements and deliver valuable software in shorter timeframes. However, one of the limitations of agile methods is the potential challenge in maintaining comprehensive and up-to-date requirement documentation throughout the rapid development cycles. This paper aims to overcome these limitations by leveraging automation techniques, providing an efficient and reliable approach to generate and verify requirements specifications, thereby enhancing the overall software development process.
Software requirement analysis [
1,
2] serves as the foundational bedrock and primary source for software system design and implementation, with its precision and comprehensiveness constituting a pivotal assurance for software quality [
3]. Regrettably, the manual composition of software requirements specifications is laborious and time-intensive, frequently resulting in misconceptions and straying from the actual requirements.
The creation of requirements specifications demands a significant level of skill and expertise from professionals such as systems engineers and UML diagrams can make requirements specifications more intuitive and clearer, thus assisting software development. However, developers may struggle to create precise UML diagrams [
4,
5], including software architecture and data flow diagrams [
6]. Additionally, non-standard requirements specifications can lead to unclear and difficult-to-read requirements documents, causing ambiguity. In addition, small software projects often lack a product manager, which results in a lack of smooth transition from business requirements to functional requirements. Therefore, technicians often develop software projects with subjective understanding, which often leads to rework by customers, resulting in a waste of resources. To avoid these issues and optimize software development work, automatic conversion of business requirements into standard software requirements specifications is necessary.
Indeed, even standardized requirements specification documents are not immune to defects. For instance, a Use/Create (U/C) matrix [
7], also referred to as the process/data class matrix in relevant literature, constitutes a tabular representation consisting of a column containing a list of functions and a row containing data classes. The relationship of a function and a data class is represented at the intersection of their corresponding cell, which needs to be filled in. During software requirement modeling, the U/C matrix is a widely accepted approach that links system functions with business data tables. This aids in identifying functional requirements and data specifications for the software’s subsequent development and subsystem distribution. However, the U/C matrix exhibits certain limitations in its scope, as it only records the relationship between summarized functional entities and data entities. In practice, the exploration of business requirements during the initial stages of a software project typically entails collaborative efforts involving multiple individuals or even different departments. Consequently, the U/C matrix becomes unsuitable when comparing local requirements across individuals or departments.
Currently, there are three primary approaches for generating standard functional requirements specifications. These include manual UML writing, automatic generation based on structured language and rules, and automatic generation based on knowledge graph. Although manual writing boasts high accuracy, it is time-consuming and often influenced by the developers’ subjectivity. The method based on structured language and rules stipulates the strict sentence structure for writing requirements documents, so as to formulate the conversion rules of diagram elements and realize the graphical generation of UML, but it proves challenging for complex structures. Furthermore, the quality of requirements specifications produced through this approach cannot be evaluated quantitatively. The concept of utilizing knowledge graph technology for automated software requirements specifications generation is a novel approach. A knowledge graph consists of a database or a structured data model that captures and represents the relationships between different entities and concepts. The central aspect of UML diagrams is the representation of entities and their connections, which is similar to what knowledge graph represents. Knowledge graph [
8,
9] technology has achieved considerable progress and efficacy in generating software requirements specifications predominantly in the English language, and there are similar models in the Chinese domain. Nonetheless, there are still some challenges to overcome in this regard:
Existing studies mostly focus on functions, use cases, and classes, with inadequate attention devoted to data-related aspects, including the accuracy of data and the division of functional granularity.
The lack of a comprehensive evaluation concerning the quality of the generated requirements specifications restricts the ability to make necessary adjustments based on the actual circumstances of software development.
This paper presents a proposed resolution to the aforementioned challenges by introducing an automatic generation model for requirements specifications, leveraging the potential of a knowledge graph. The BiLSTM-CRF kg [
10] method is used to automatically extract the structured information of functional requirements from the business requirements description corpus and construct a functional structure knowledge graph, while another function-data knowledge graph is built using the structured data in the data tables. Then, merge the two knowledge graphs together. By utilizing the functional entity relationships and data entity relationships within the graph, this model can generate UML diagrams including architecture diagrams and data flow diagrams which can then automatically produce standardized requirements specifications. Additionally, an improved Send/Use/Create (S/U/C) matrix is proposed to address the limitations of the traditional U/C matrix in accommodating coordination and cooperation among multiple departments. This improved matrix can assess the quality of requirements specifications based on the S/U/C situation of data.
2. Related Work
A range of methods and models have been introduced in previous research to (semi-) automatically generate requirements specifications.
Miranda, MA et al. [
11] proposed the implementation of language of use case to automate models (LUCAM). LUCAM is a specific language that enables the creation of textual use cases and semi-automated generation of use case diagrams, class diagrams, and sequence diagrams using LUCAMTool. However, it only accommodates English business requirements and lacks the assessment of the precision and rationality of UML diagrams. Emeka, B et al. [
12] proposed a formal technique for concurrent generation of functional requirements that can help provide a systematic way of accounting for specifying the functional requirements of a software, but it is only limited to the development process of industrial system, and its applicability in other fields has not been verified. Qu, MC et al. [
13] introduced a method that can automatically produce standardized requirements and test documentation, addressing problems such as inconsistency, lack of integrity in document-related content, and enhancing efficiency. However, while this method enables tracking of requirements, it does not visually exhibit the results of target labeling. Additionally, the studies mentioned above do not involve creating requirements specifications with regard to data entities.
At the same time, for the testing and evaluation of generating requirements specifications, Mahalakshmi, G et al. [
14] emphasized automating the testing process during the software development cycle, starting from the early stages of requirement gathering. Nevertheless, this approach solely considers the use case flow that arises from the use cases and overlooks testing other components in the requirements specification. Tsunoda, T et al. [
15] used two specification metrics for SRSs to evaluate their effectiveness to predict future modifications in two actual developments. Franch et al. [
16] created a data-based approach, known as Q-Rapids, aimed at enhancing the acquisition, evaluation, and recording of quality requirements in agile software creation. Nonetheless, this approach does not modify and iterate the requirements specification, which fails to facilitate the development team’s enhancement in the analysis of requirements and the application of the assessment findings.
Besides, formal methods are based on strict mathematical foundations, which can generate rigorous, precise, and unambiguous formal constraints, and can be used for model verification and theorem proving, and are complementary to UML. There has been a lot of work on formal methods for writing and verifying requirements. Georgiades et al. [
17] provided a novel software tool that attempted to formalize and automate the RE process and extended the use of the tool’s SRS document component, which automatically generated well-structured natural language SRS documents. SOFL [
18] was proposed to precisely define functional behavior and incorporate security rules as constraints, which created a solid foundation for implementation and testing. There is also a formal method called RSL-IL [
19], allowing for the automated verification and creation of complementary views by performed additional computations on requirements representations, which assist stakeholders in validating requirements. Formal methods generally involve the use of formal languages, mathematical notation, and rigorous techniques. This complexity makes it difficult for non-experts or stakeholders without formal training to understand the requirements generation process and participate effectively in it.
Software development is a knowledge-intensive activity [
20]. Some knowledge-based software specification requirements generation methods were also proposed. Avdeenko et al. [
21] proposed a hybrid model for classifying requirements using framework ontology and production rules. This method allows property inheritance from parent requirement classes to child classes, and this hierarchy can be used to test the traceability, completeness, and consistency attributes of the requirements specification.
3. Structural Information Extraction Model of Functional Requirements
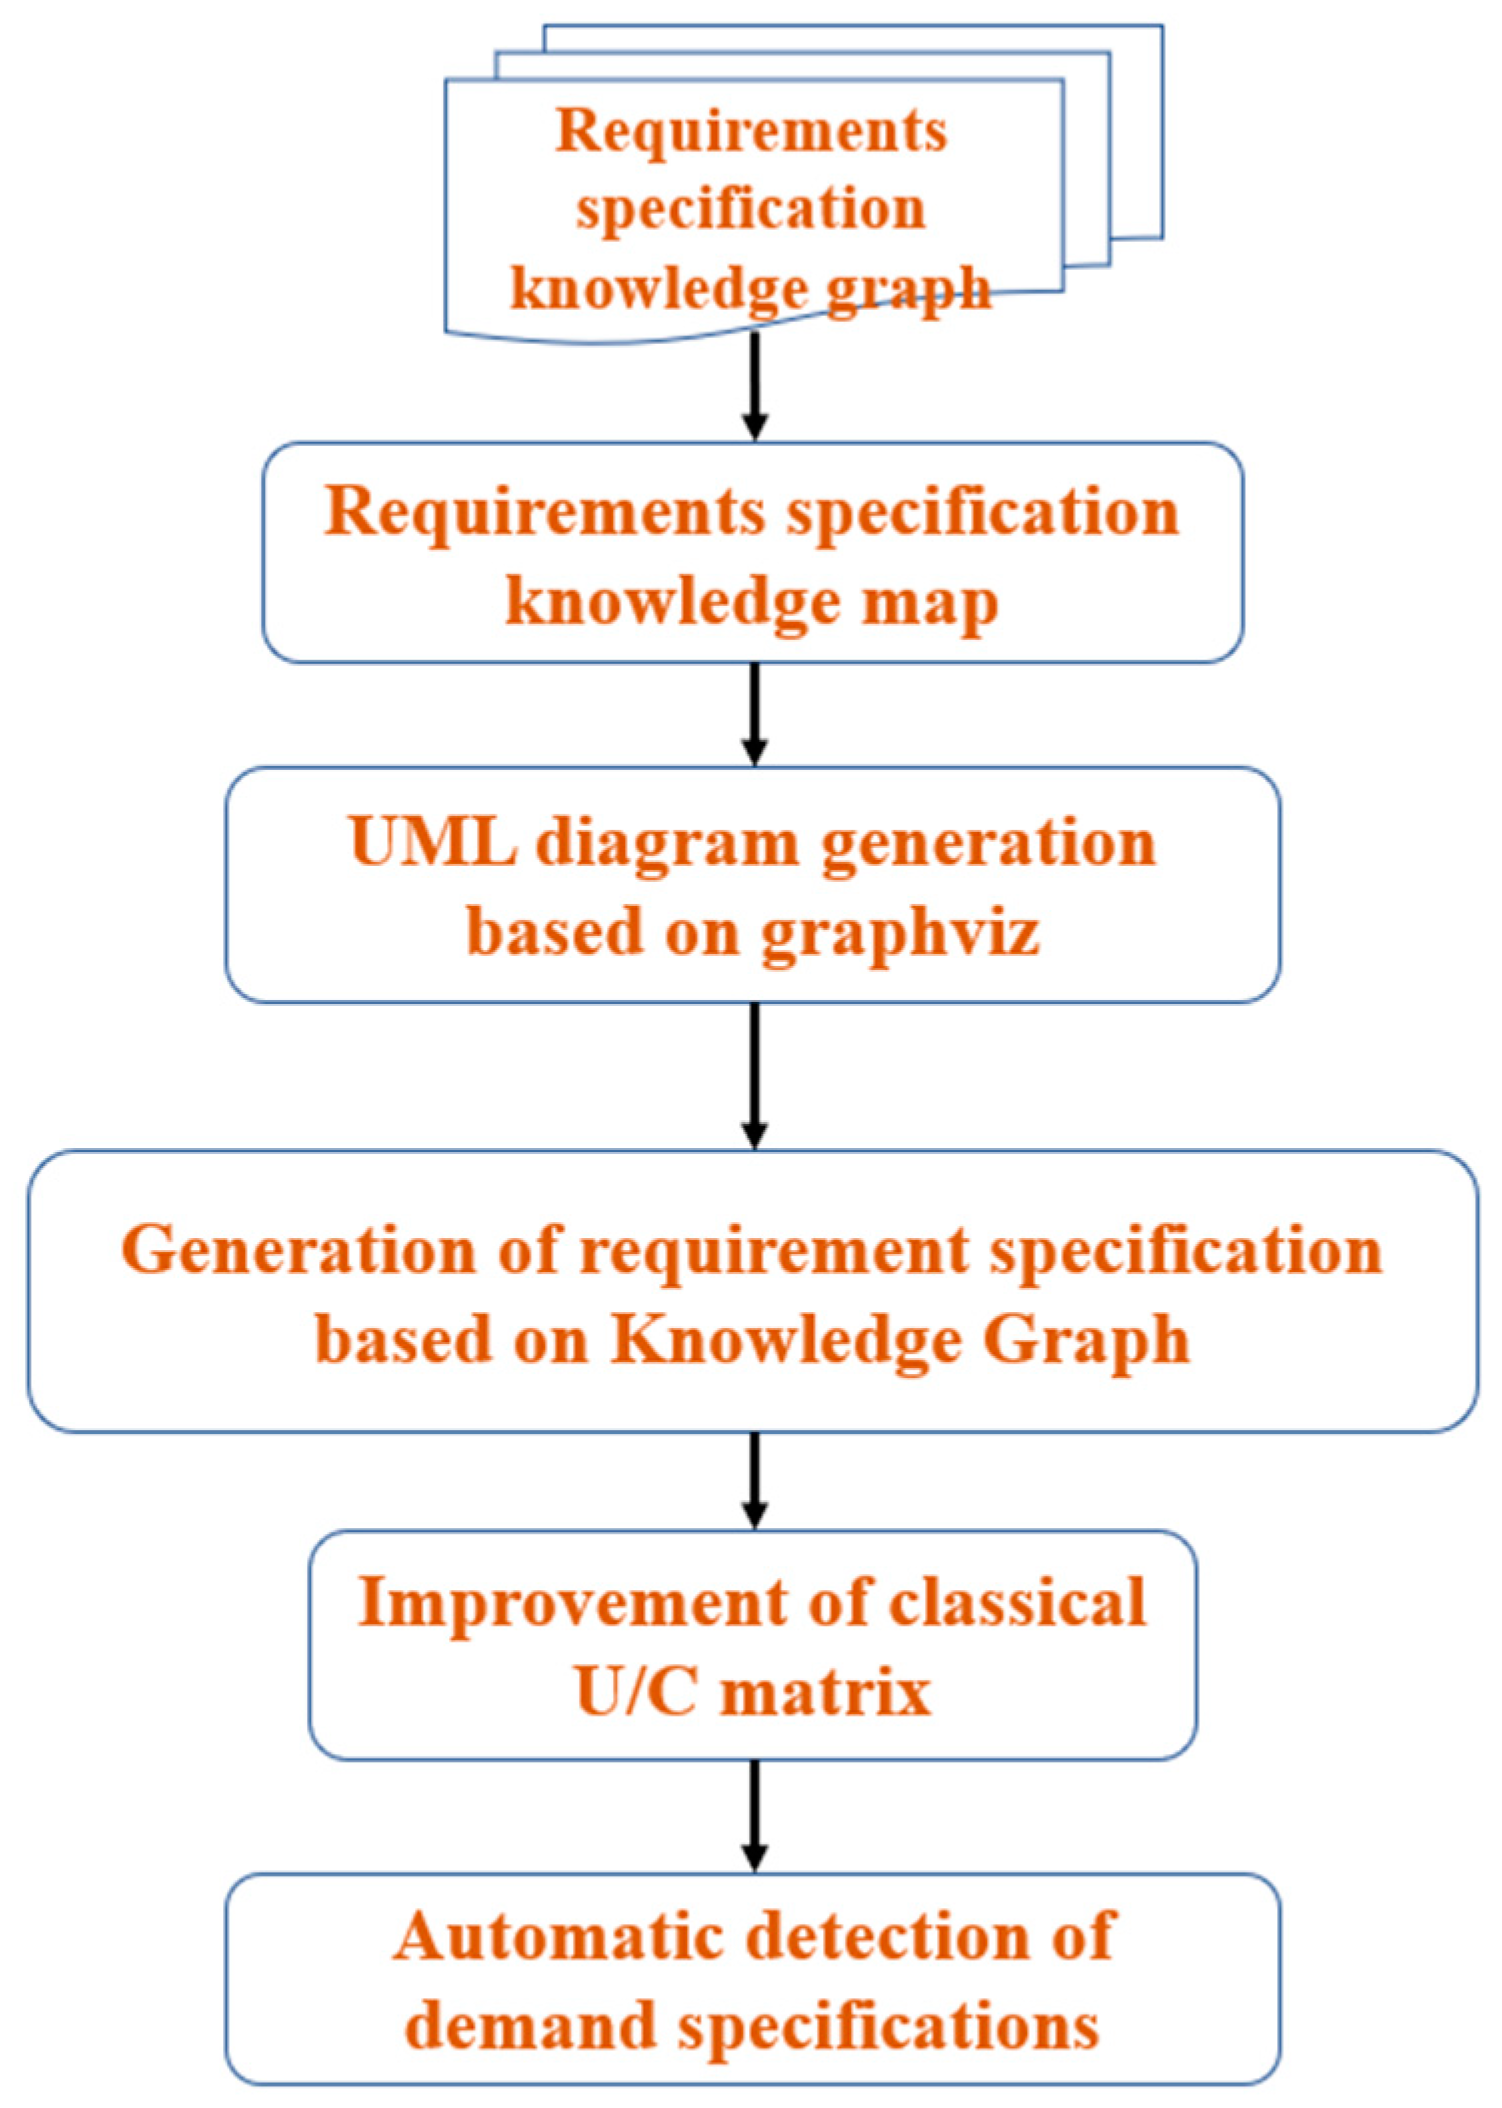
Standard requirements decomposition typically involves breaking down high-level system requirements into smaller and more specific requirements that can be assigned to different components or subsystems of a software system. It helps in organizing and managing complex requirements by dividing them into manageable units. In this paper, software requirements are expressed in the form of knowledge graph. The method first constructs requirements specification knowledge graphs by automatically extracting various entities (manageable units) in the requirements and the relationship between them, and then fuses these graphs into a map. By using the requirements specification knowledge map, it automatically generates UML diagrams, then automatically generates and evaluates the requirements specification. The process is shown in
Figure 1:
3.1. Requirements Specification Knowledge Graph
The knowledge graph for requirements specification comprises two entities, namely functional entity and data entity. Functional entities have parent–child relationships, while they have creator and user relationships with data entities. Hence, the knowledge graph for requirements specification consists of three triples:
In this paper, the BiLSTM-CRF kg method is used to realize the automatic generation of the requirements specification knowledge graph. This method first realizes the embedding of the functional structure knowledge graph from the original business description, and then realizes the embedding of the function-data knowledge graph from the U/C matrix established by business data table description, and finally merges the two graphs to generate a requirements specification map.
In the process of generating the functional structure map, firstly, word segmentation, part-of-speech tagging, functional entity naming tagging, and relationship tagging are performed on the requirement description in the original business description corpus to obtain the functional word segmentation tagging results. Then, entity relationship extraction, entity disambiguation and hidden relationship learning are carried out successively, and the functional structure knowledge graph can be embedded after obtaining the disambiguated functional entity-relationship set and saving it to Neo4j graph database.
In the process of generating the function-data knowledge map, the function-data triplet is obtained by improving the U/C matrix, and then the knowledge graph is automatically embedded by using Neo4j graph database.
3.2. UML Diagram Generation Based on Graphviz
After the requirements specification knowledge graph is formed, this paper uses graphviz module to automatically generate architecture diagram according to the parent–child relationship between functional entities and generate data flow diagram according to the relationship between functional entities and data entities.
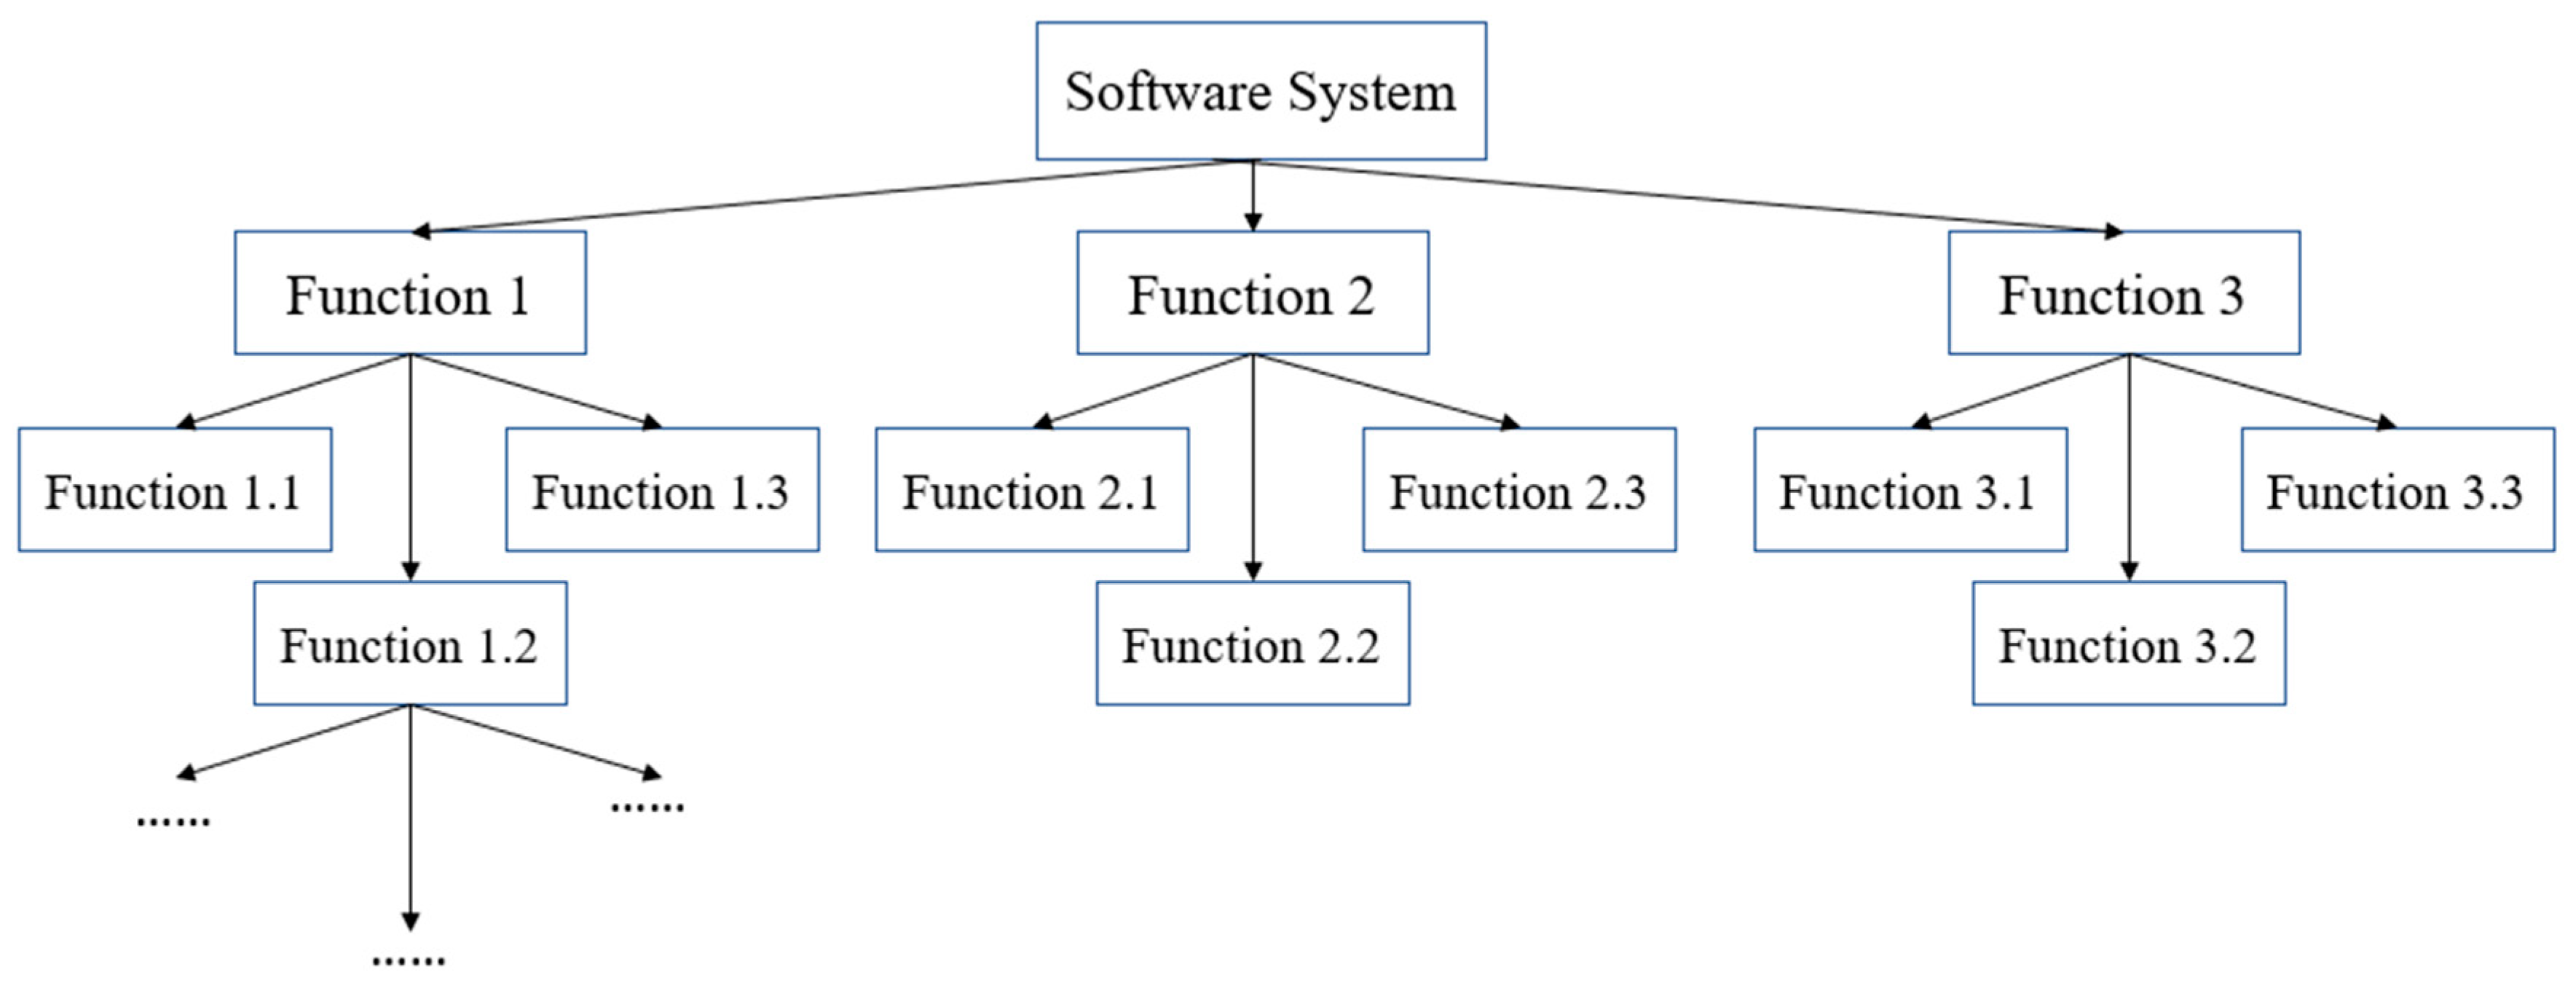
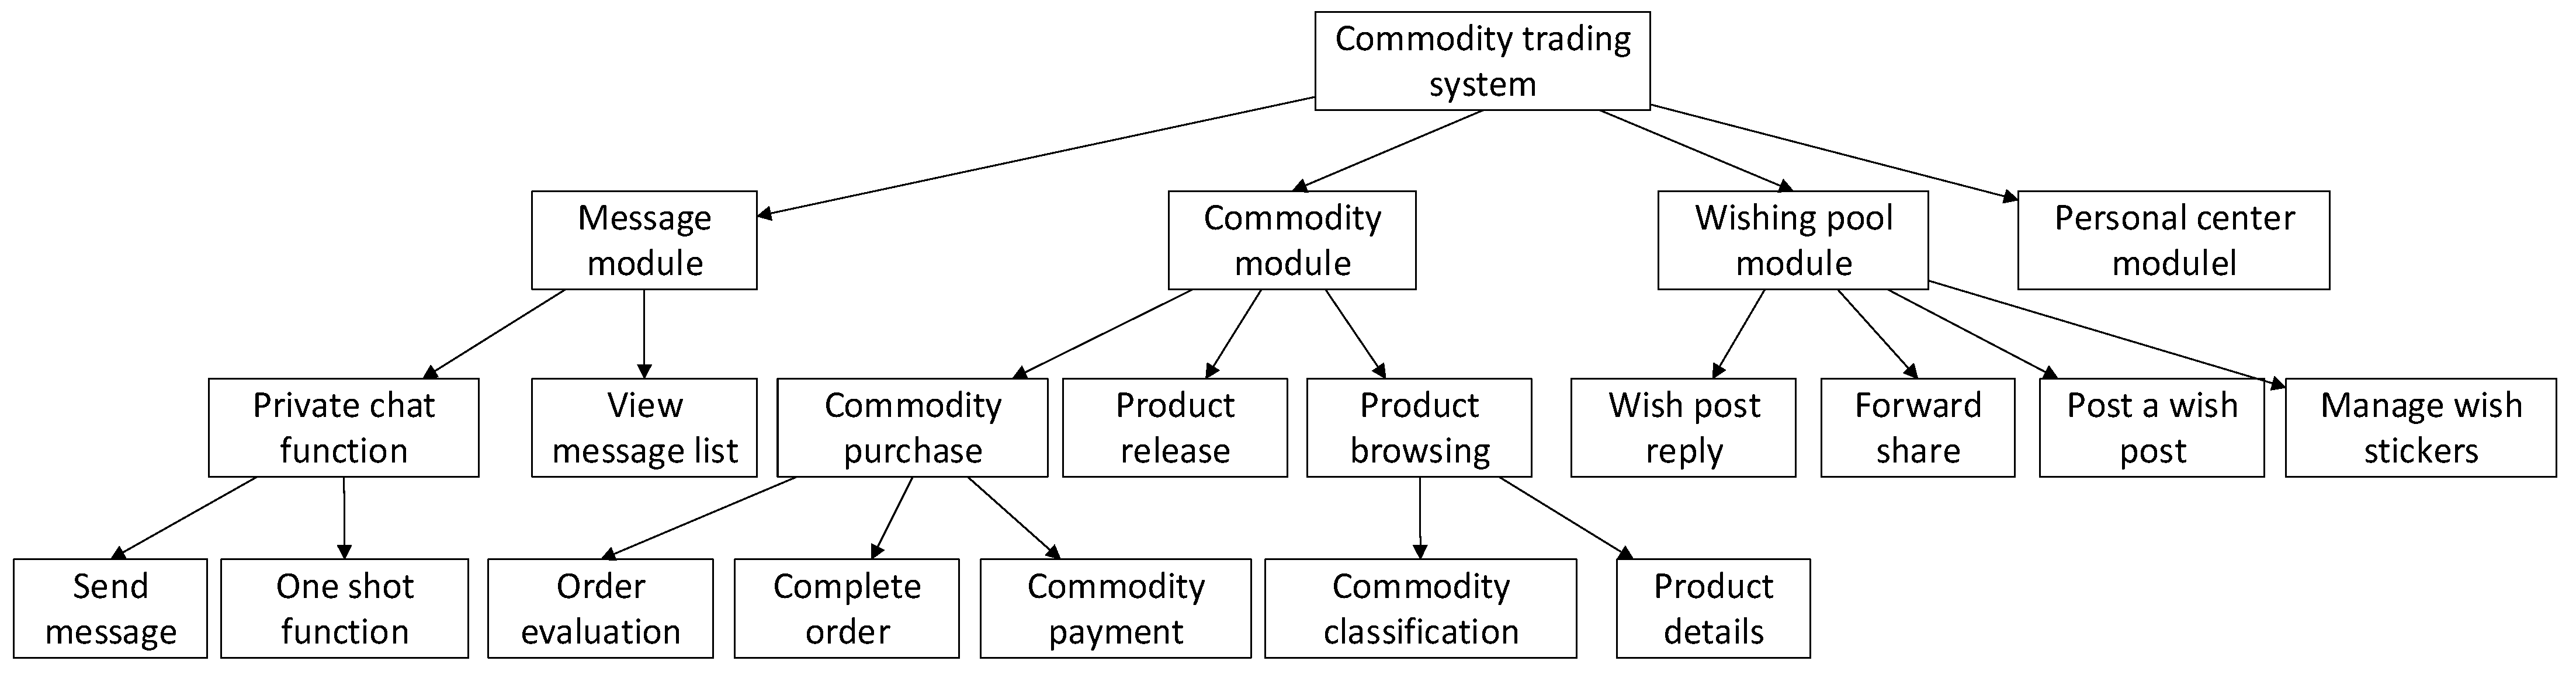
For a software system, its architecture can be built into a tree model, as shown in
Figure 2. Its root node is the whole software system, and the nth layer node corresponds to the N-1 function. Then, for the structural information between functional entities stored in the knowledge graph, breadth first can be adopted, that is, traverse the nodes first, then traverse the relationships, and finally determine the root node.
In order to mitigate the presence of multiple entities with similar functions in the diagram, the proposed approach employs a two-step process. Initially, during the generation of the software requirements specification map using the BiLSTM-CRF kg method, contextual relationships are leveraged to align functional entities, including pronouns and abbreviations, with the entity-relationship set. This facilitates the acquisition of latent relations between functional entities. Subsequently, in the subsequent phase of generating the UML diagram, a set data structure is employed to store the entities. The functions are then categorized and retained based on the name attribute of the functional entity within the knowledge graph, leading to the creation of function nodes within the graph. Connections between the nodes are subsequently established in the graph for each pair of triples stored in the graph database, thereby denoting the parent–child relationship between the functions. Lastly, the root node is identified through the detection of the node with a penetration of 0, serving as the foundation for the reconstruction of the entire tree structure.
The whole process is shown in Algorithm 1:
| Algorithm 1: Generation of Software Architecture Diagram |
| Input: |
Output:
1:
2:
3: |
4:
5:
6:
7:
8:
9:
10: |
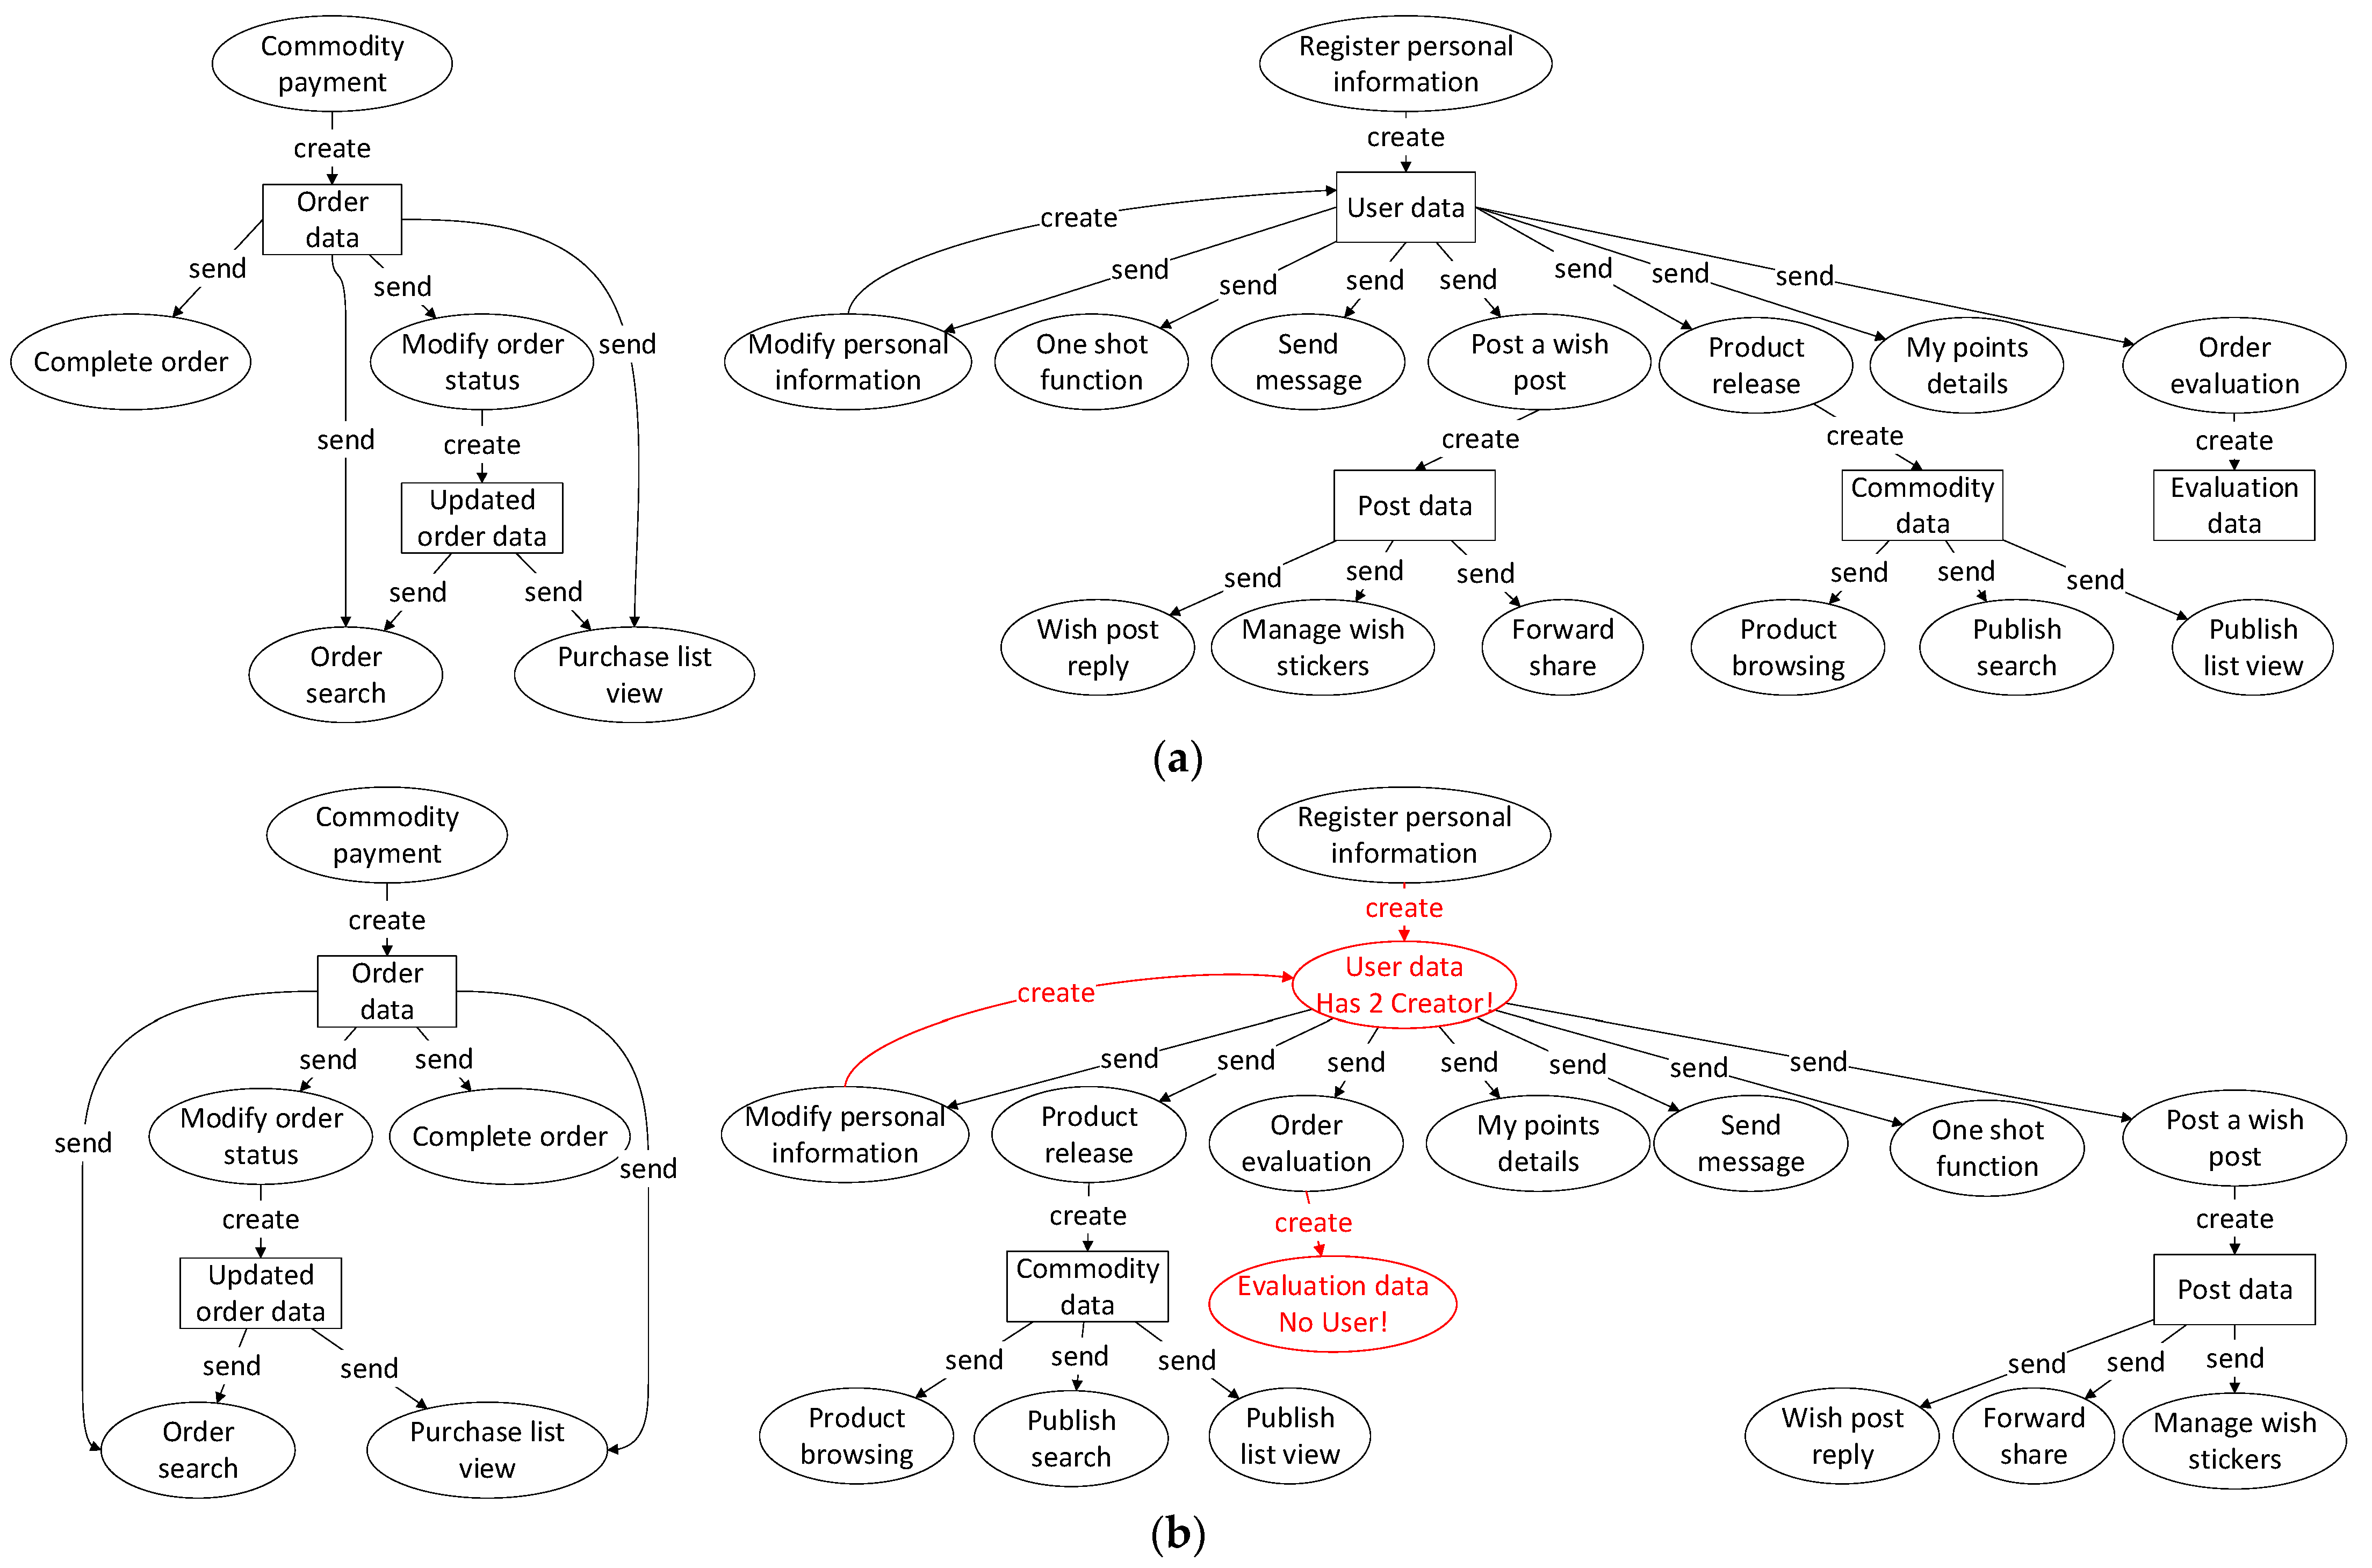
A data flow diagram (DFD) is a graphical tool to describe the data flow in the software system. It marks the logic input and logic output of a system, as well as the processing required to convert the logic input into logic output. In the requirements specification knowledge graph, there are two kinds of relationships between functional entities and data entities: creator and user. Therefore, we can start with the data entity and take the path from its generation to its utilization as the basis for constructing the data flow graph.
To avoid duplication of data entities in the data flow diagram, this study employs a set data structure similar to the software architecture diagram. The first step involves identifying data entities according to their name attribute in the knowledge graph, storing all the data, and generating data nodes in the data flow diagram. The second step is creating functional nodes for each triple pair with head nodes as functional entities and tail nodes as data entities stored in the graph database. Then, the nodes in the graph are connected and marked with the creator or user relationship at the connection.
The whole process is shown in Algorithm 2:
| Algorithm 2: Generation of Data Flow Diagram |
| Input: |
Output:
1:
2:
3: |
4:
5:
6:
7:
8:
9:
10:
11:
12:
13:
14:
15: |
3.3. Generation of Requirements Specification
According to the relationship between functional entities and between functional entities and data entities in the requirements specification knowledge map, the requirements specification is reconstructed to generate a more standardized requirements specification. At the same time, inserting the generated UML diagram into the document can effectively solve the ambiguity problem of the requirement document.
3.4. Improvement of Classical U/C Matrix
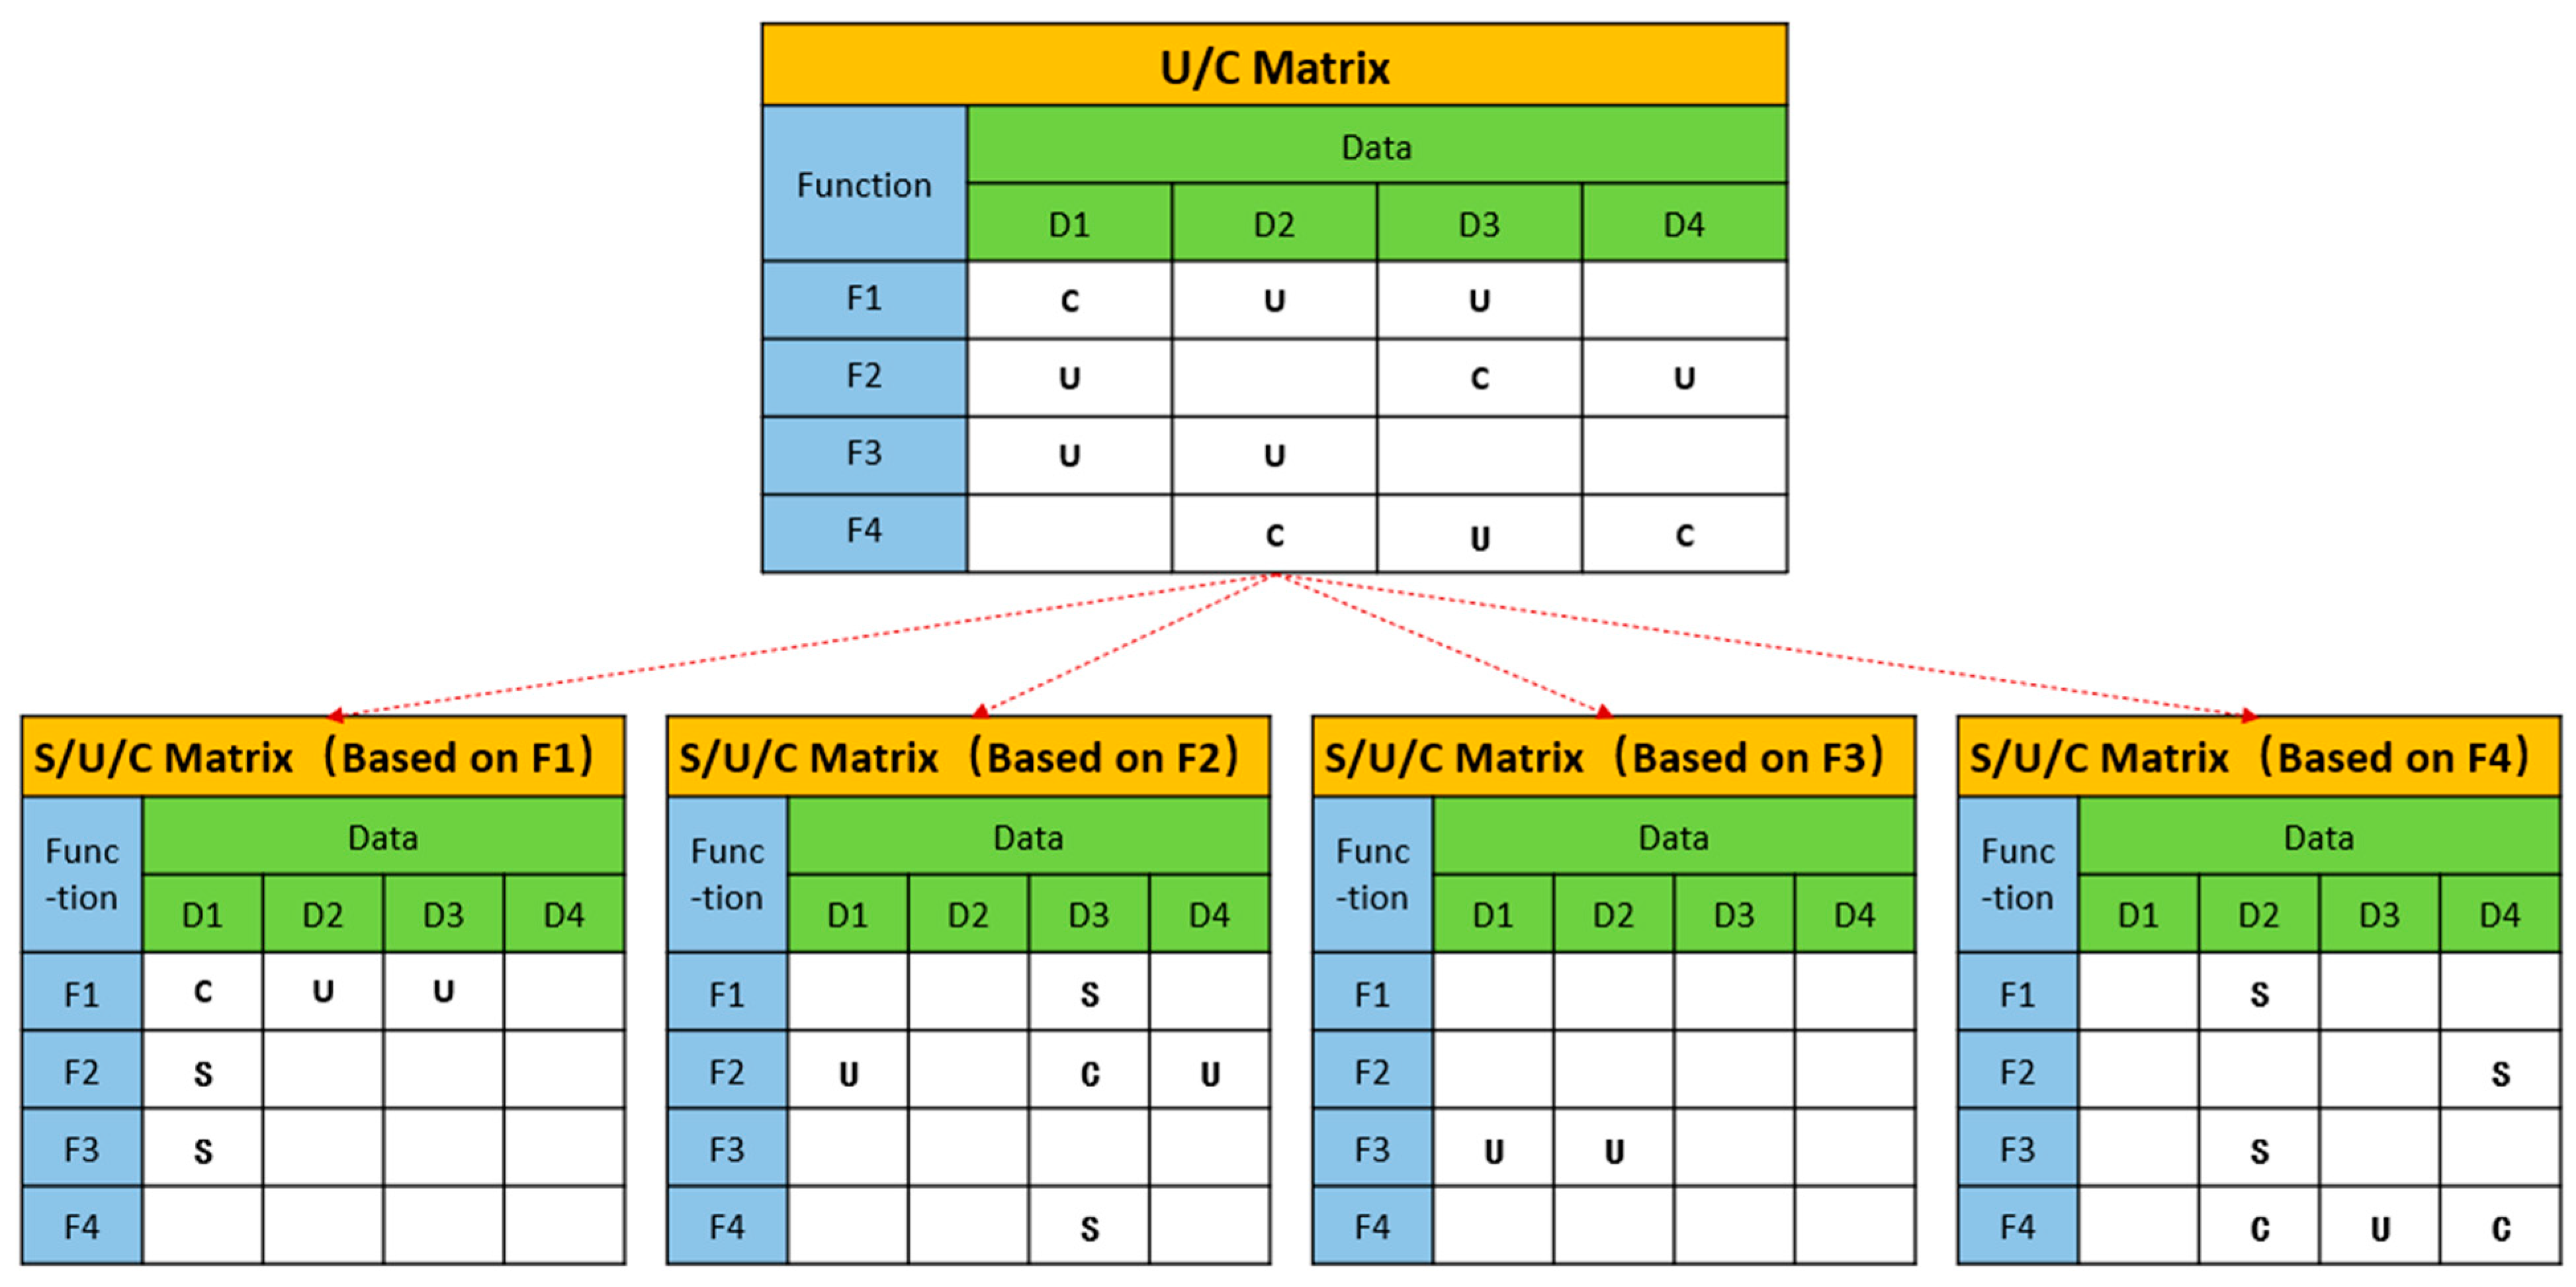
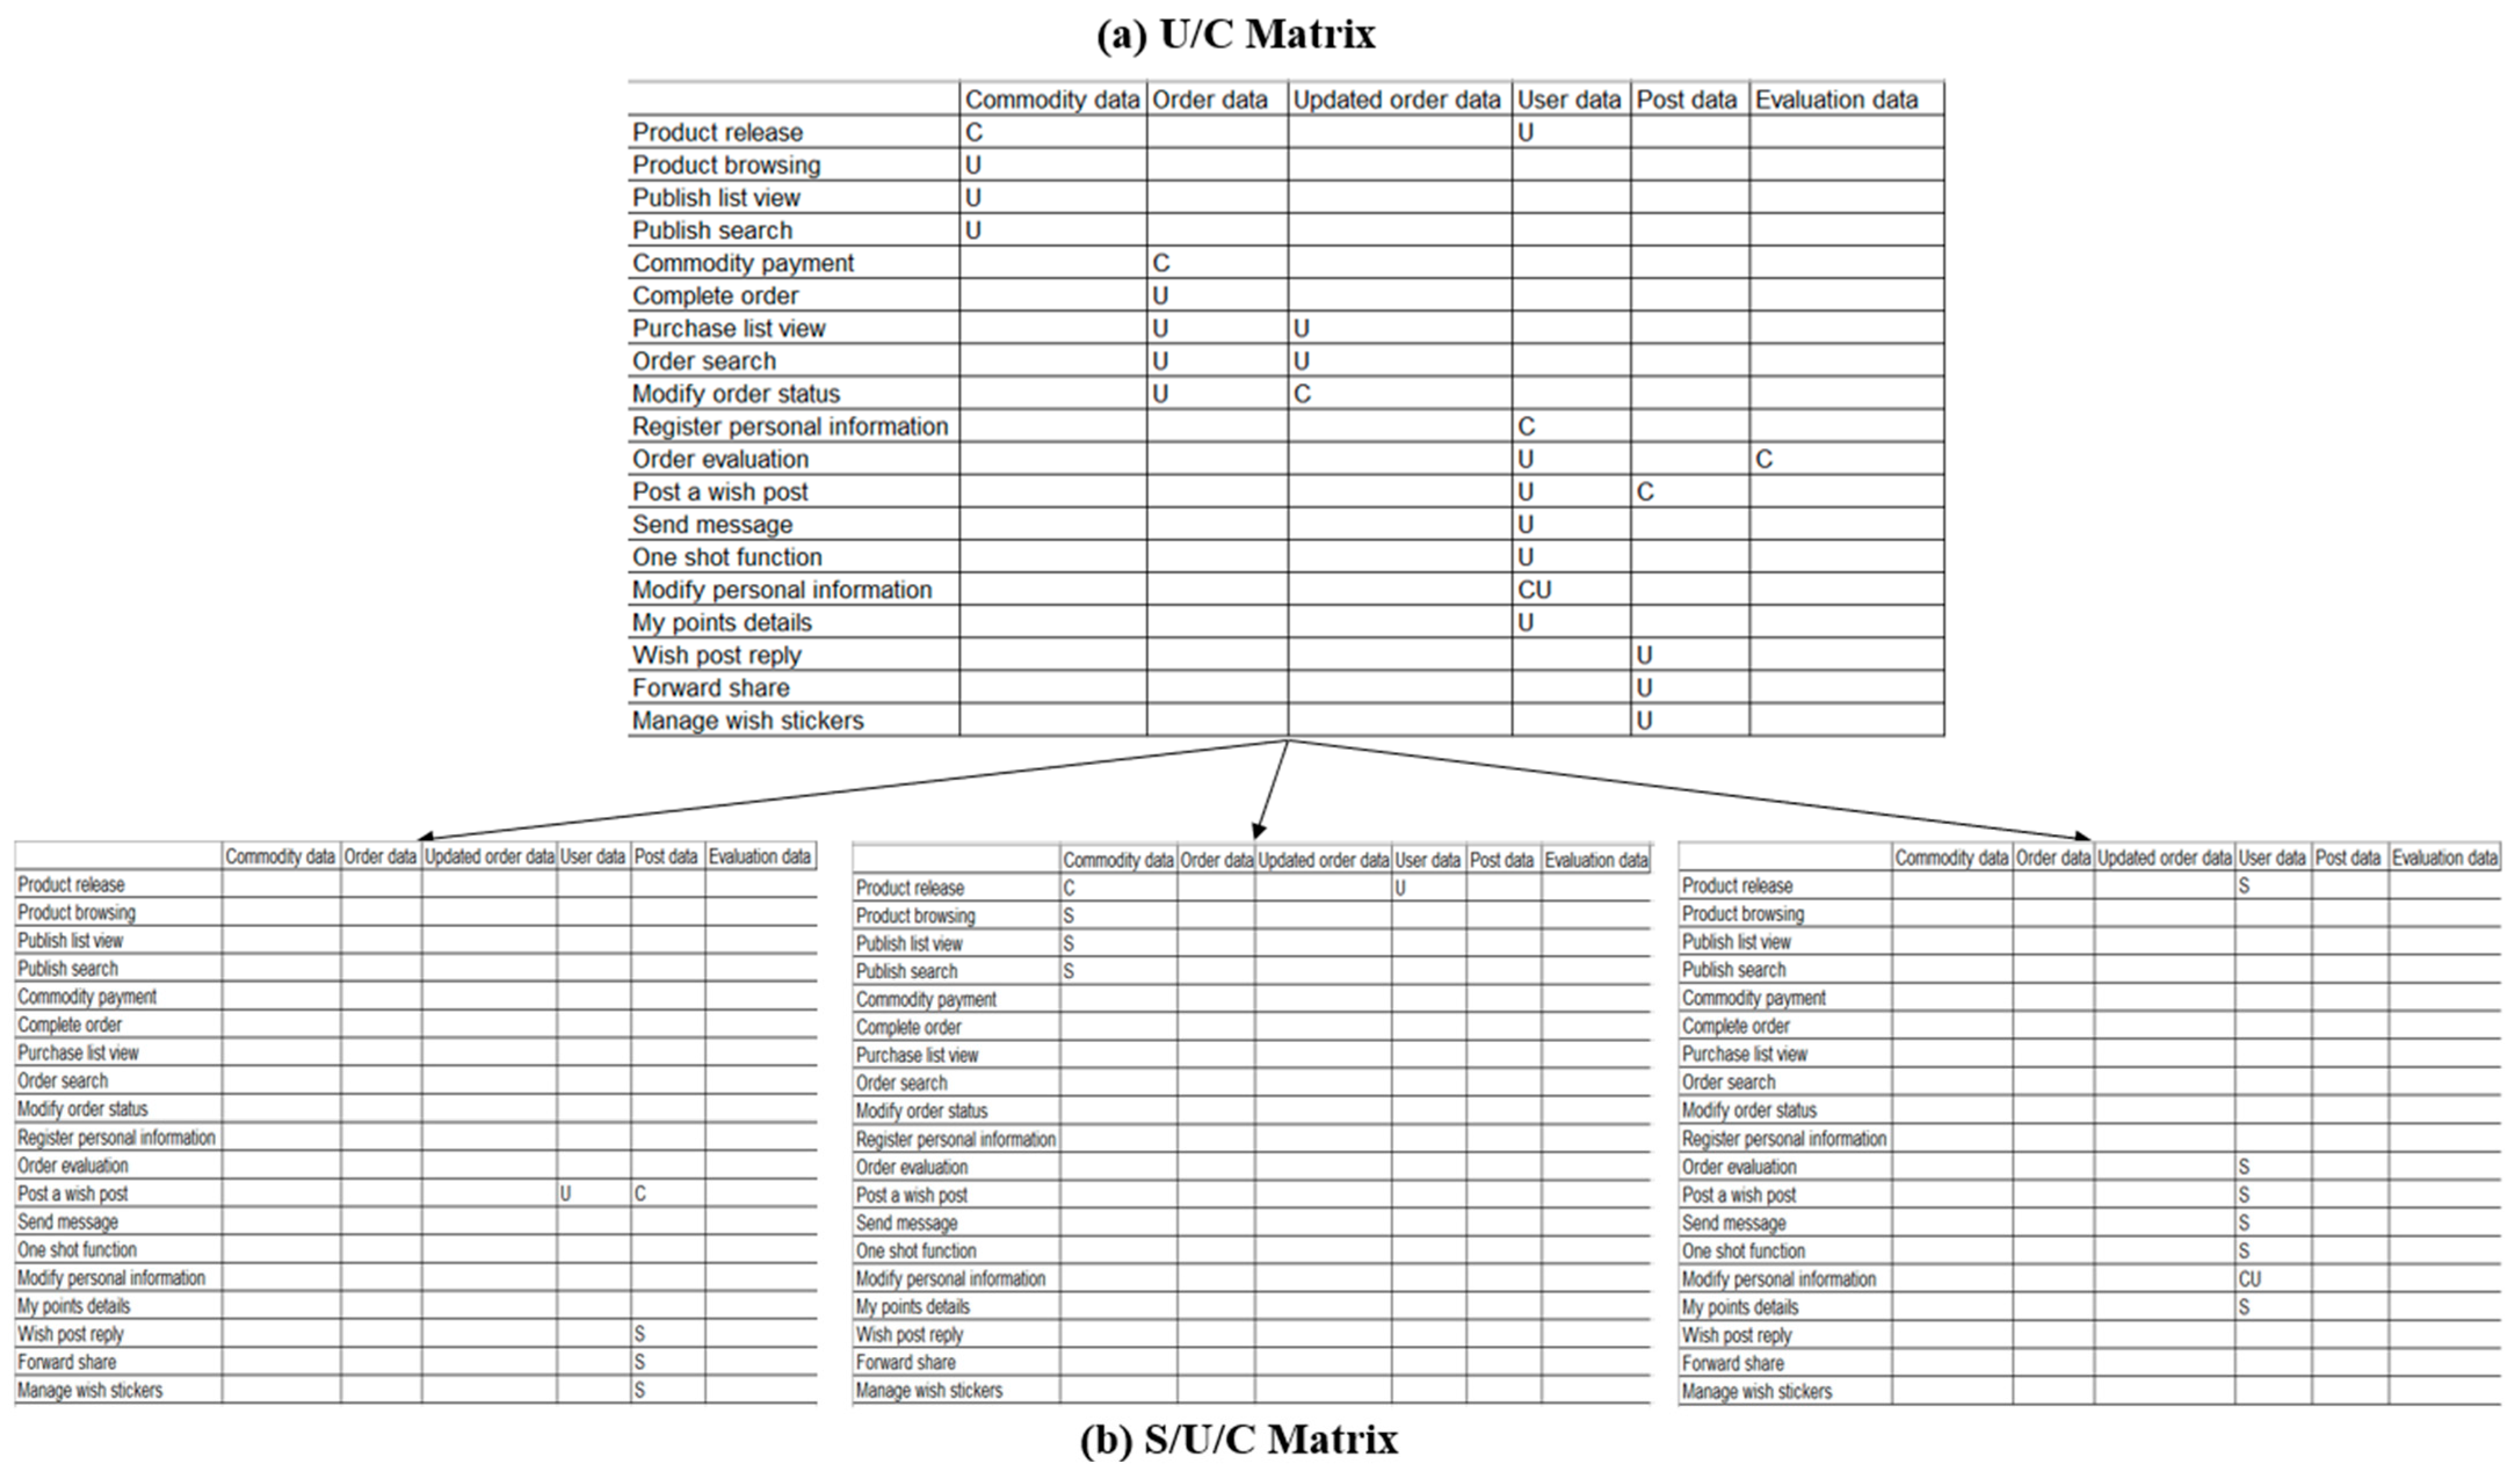
The U/C matrix is a crucial tool for analyzing data and functions systematically to divide subsystems. However, the traditional U/C matrix can only be documented in a single format, which does not allow for comparing local requirements across departments and individuals. To address this issue, this study divides the U/C matrix into several Send/Use/Create (S/U/C) matrices. The process involves using a functional entity as a reference point, maintaining only the entire row and data column information labeled with “C”, and converting all “U” in the column to “S”.
Figure 3 shows the primary steps of this process.
By traversing the triples of (function entity, relationship, data entity) in the knowledge graph, this paper generates a U/C matrix with data as rows and function as columns, and converts it into S/U/C matrix according to the above operations.
The whole process is shown in Algorithm 3. Specifically, the steps to optimize the U/C matrix to S/U/C matrix are as follows: for each functional entity, a matrix with the same specifications as the U/C matrix is established separately. For the data generated by this function, the corresponding position under this function dimension in the S/U/C matrix is recorded as “C”; for the data used by this function, the corresponding position under the functional dimension in the S/U/C matrix is recorded as “U” (if the corresponding position is already “C”, then “CU” is recorded at the corresponding position); for the data generated by this function and used by other functions, the corresponding position under this function dimension in the S/U/C matrix is recorded as “S”, thus forming a three-dimensional S/U/C matrix.
| Algorithm 3: Improvement of classical U/C matrix |
| Input: |
Output:
1:
2:
3:
4: |
5:
6:
7:
8:
9:
10:
11:
12:
13:
14:
15:
16:
17:
18:
19:
20:
21:
22:
23:
24:
25:
26:
27:
28:
29:
30:
31:
32:
33:
34:
35:
36:
37:
38:
39:
40: |
3.5. Automatic Detection of Requirements Specifications
After the generation of S/U/C matrix, this paper generates the inspection principle of S/U/C matrix according to the inspection principle of U/C matrix, so as to test the correctness, completeness and consistency of requirements specifications.
The correctness is checked with the following four rules:
- (1)
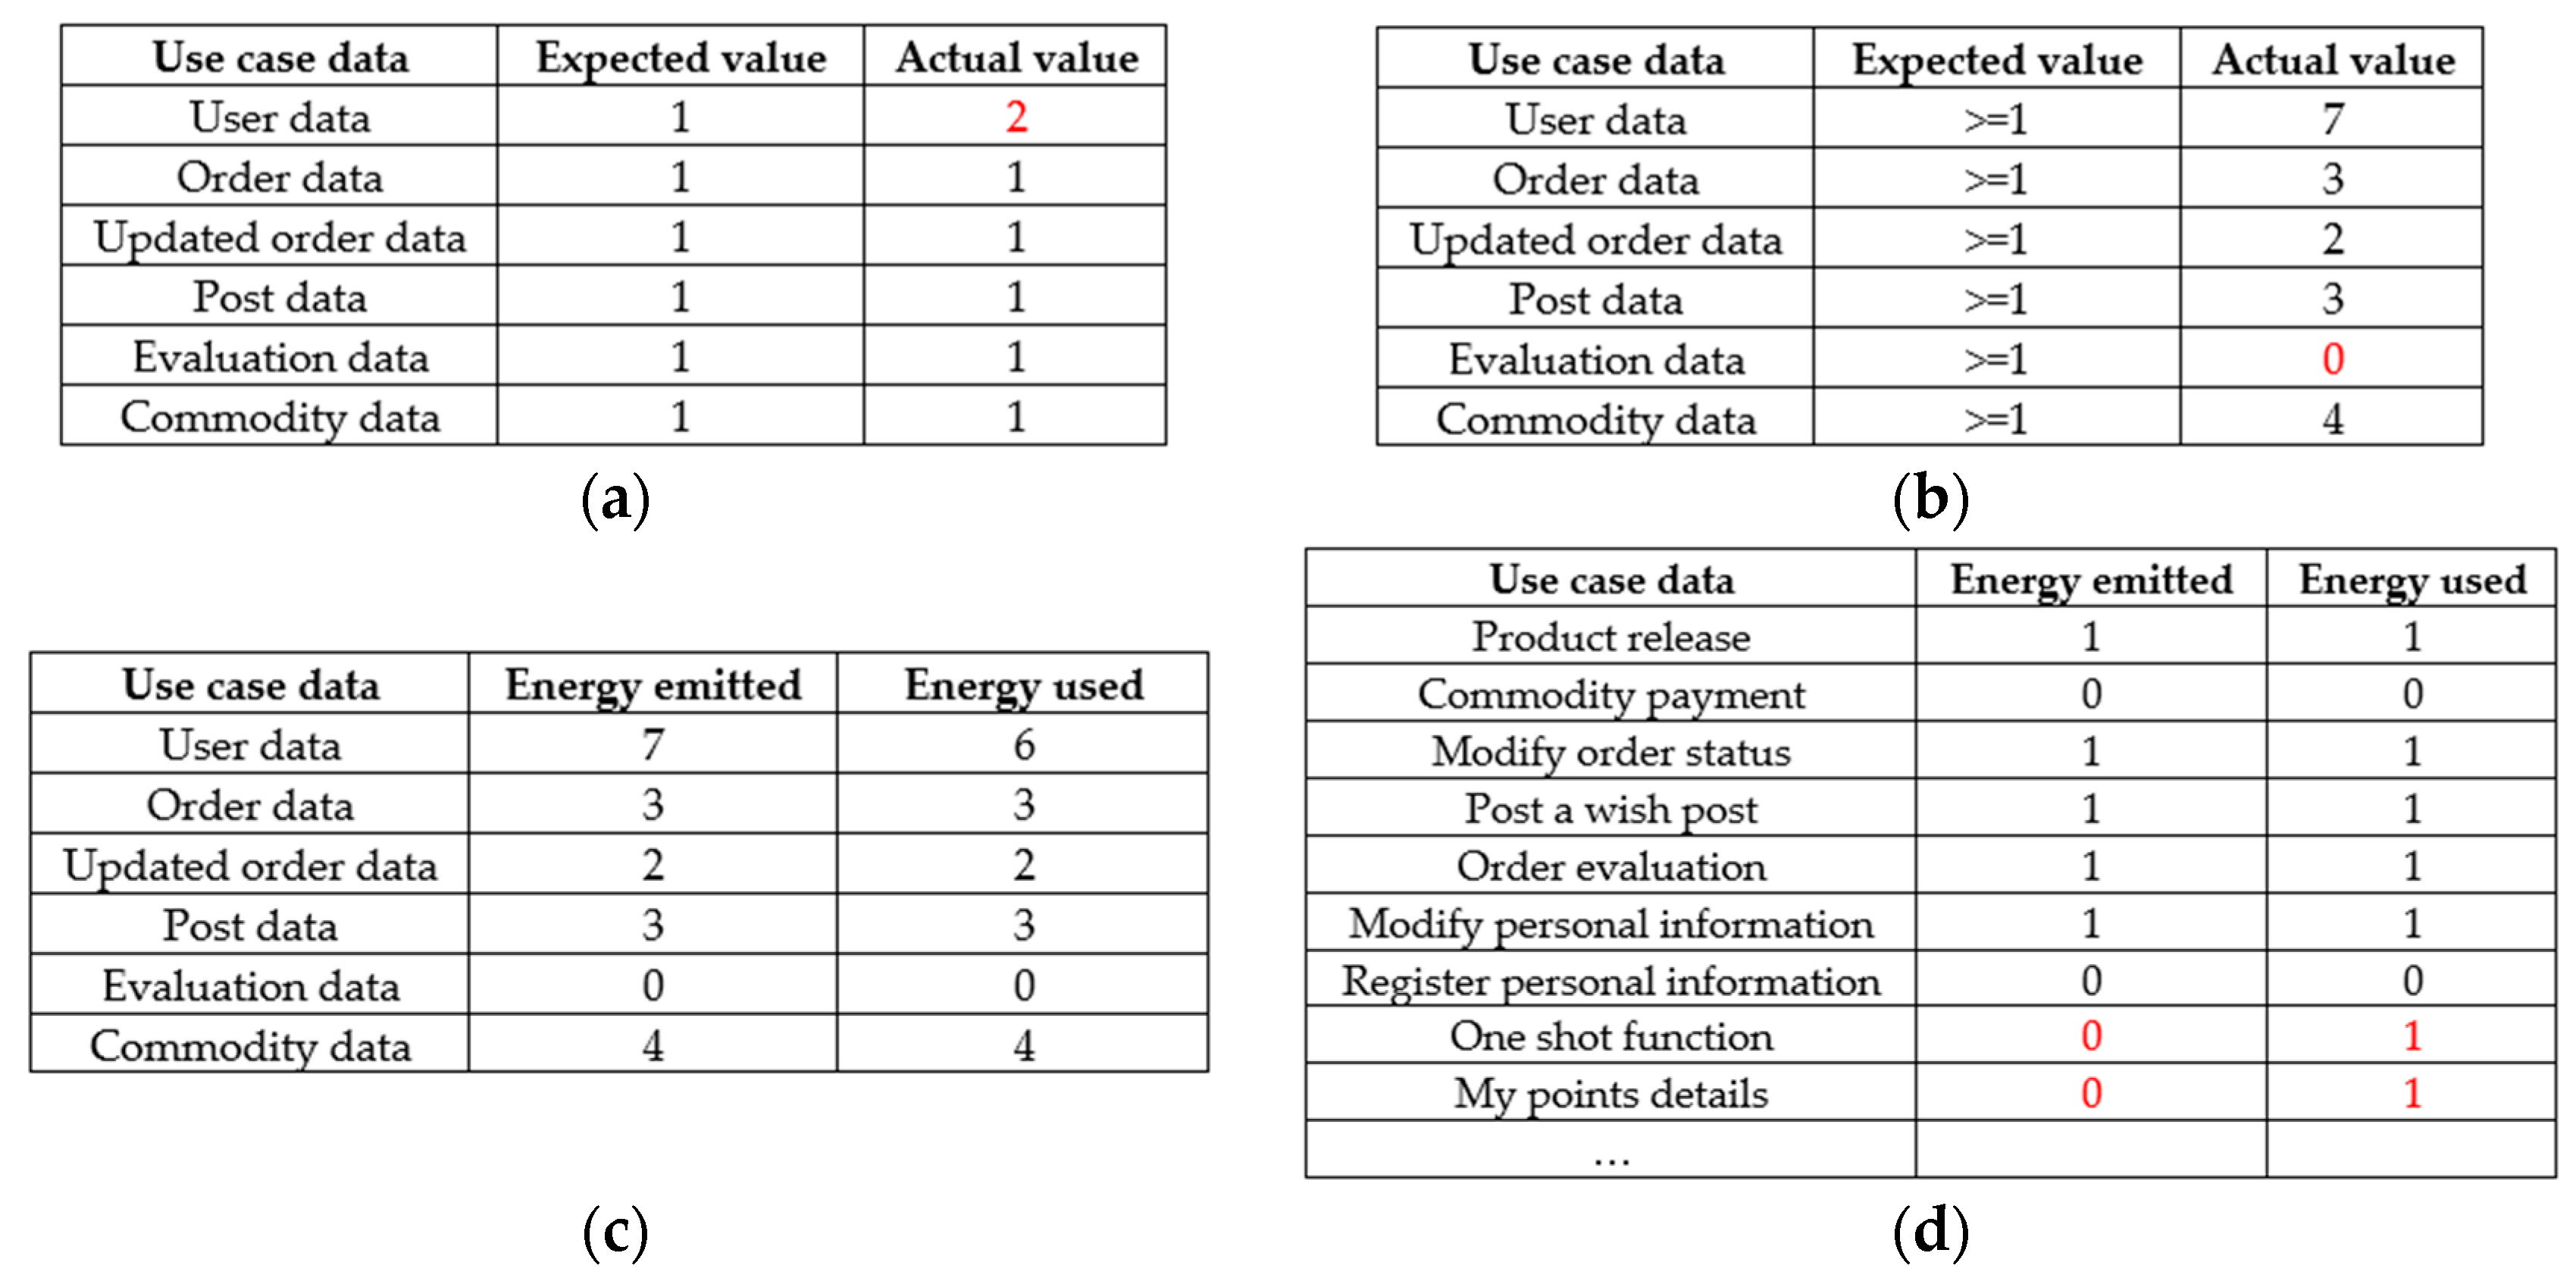
Sole produce rule of data entity (CTR-SPR): for any data table entity in the requirements specification map, it has and only has one Creator. Its mathematical definition is:
represents the processing of data entities.
- (2)
Multi-user rule of data entity (CTR-MUR): for any data table entity in the requirements specification graph, it has at least one user. Its mathematical definition is:
- (3)
Energy conservation rule of data entity (CTR-ECR): the schematic diagram of energy conservation of data entity is shown in
Figure 4.
In the process of demand research, many people often conduct research synchronously or need to investigate multiple business departments. Each researcher or each business department has different opinions on whether a specific data table is generated or used, and there is often negligence. This will result in the omission of functional requirements or the lack of data flow. From the perspective of data in the knowledge map, the generation and use of a certain type of data are corresponding. That is, for any data table entity, the number of the received results corresponds to the number of the sent results. If not, then something must have gone wrong in the data flow.
In order to solve this problem, the project defines that the energy emitted (Number of
) by any data table entity in the requirements specification map is opposite to the energy used (Number of
), and the quantity is equal. Its mathematical definition is:
- (4)
Energy keeping rule of functional entity (CTR-EKR): for any functional entity in the requirements specification graph, the sum of the absolute value of energy sent and received is greater than or equal to 1. If it is 0, it indicates that the function may have missing data transmission or be a single independent function (which is relatively rare). Its mathematical definition is:
represents the processing of data entities. Similarly, it is easy to draw the following conclusions:
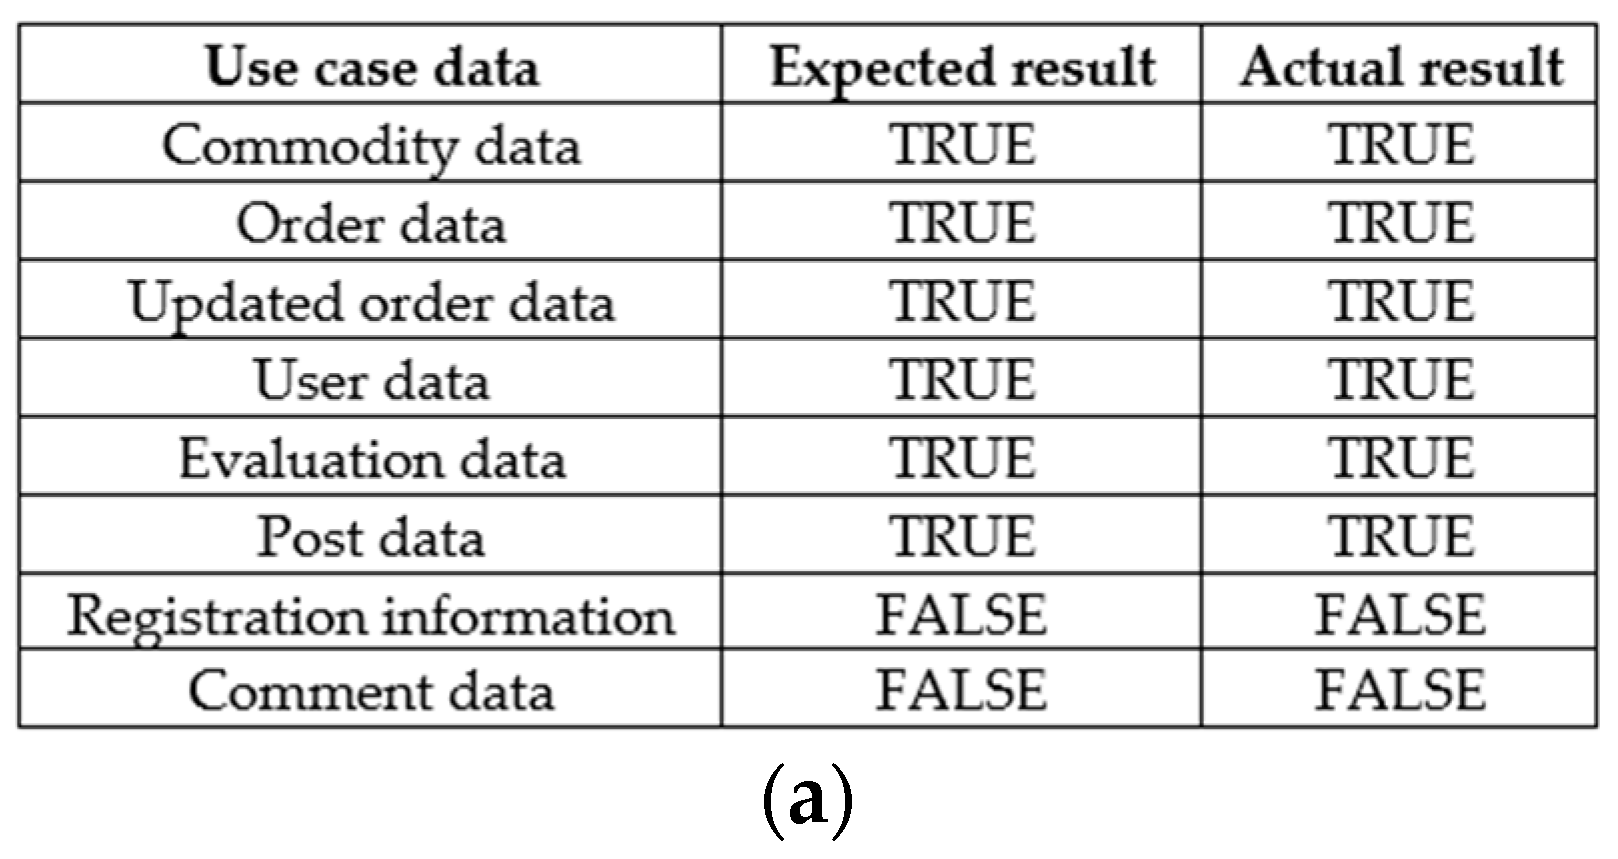
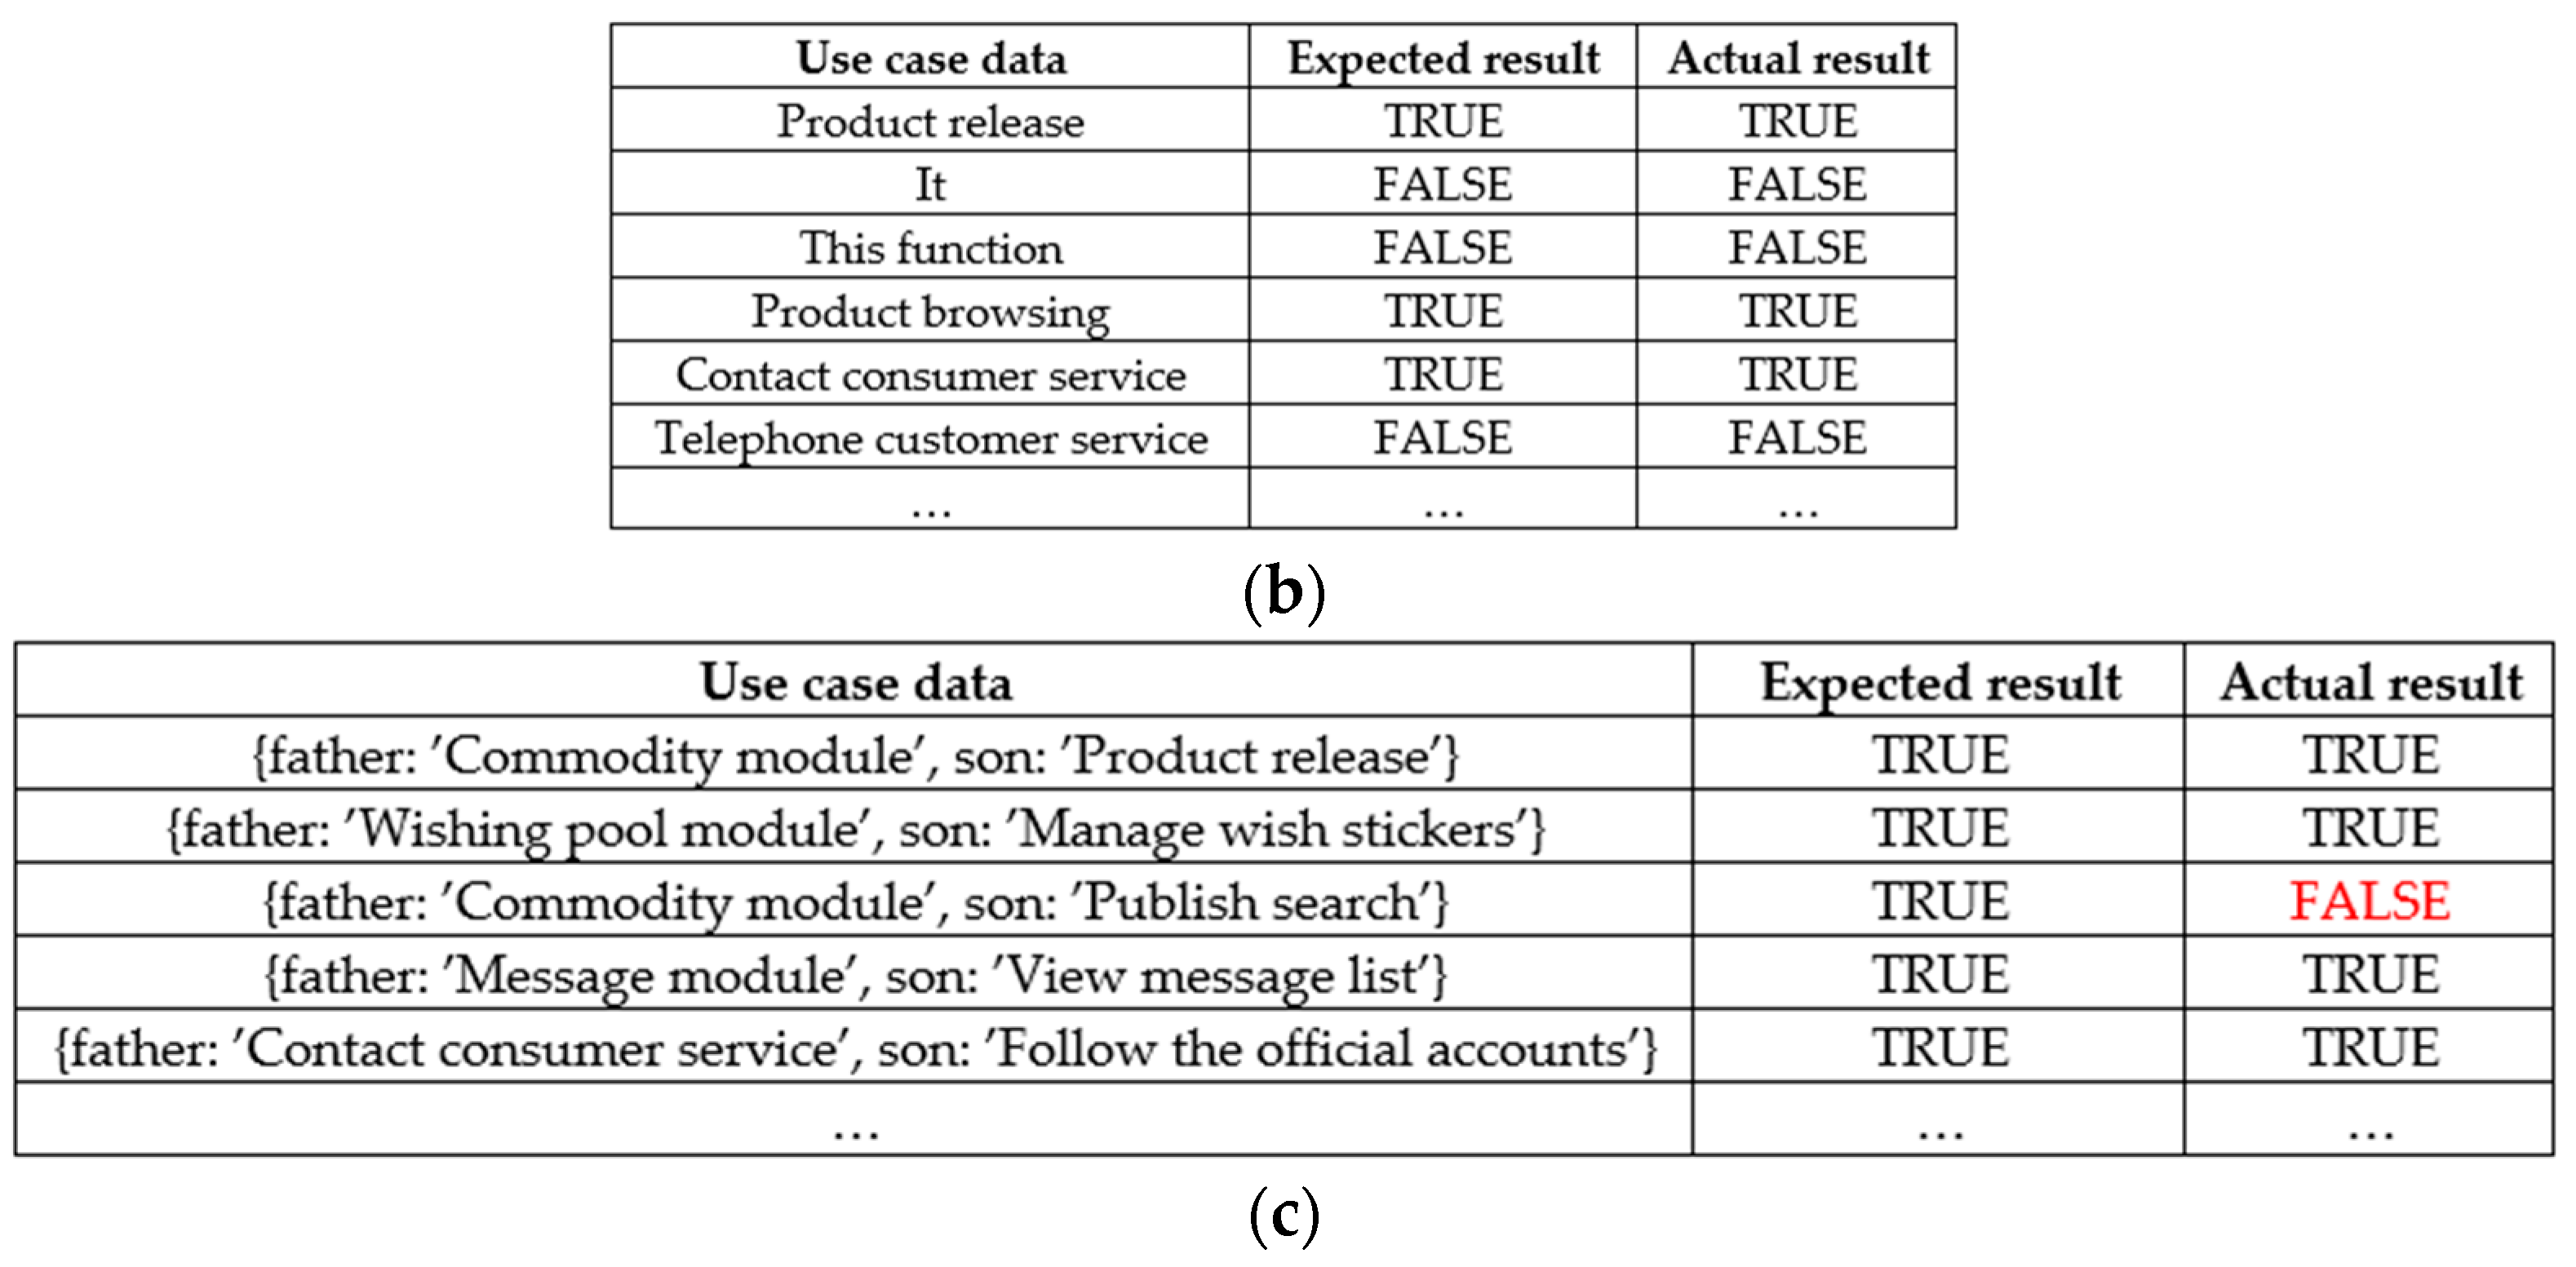
Correctness Perfect Rules (CPR) are used to check completeness of requirements specifications. The completeness test mainly includes three parts: function inspection test, data table inspection test and parent–child functional relationship inspection test. That is, the function test list FuncTestCaseList, the data test list DataTestCaseList and the parent–child functional relationship test list PFuncTestCaseList are added automatically and manually. These test cases are automatically queried in the generated requirements specification map to find out whether there are any omissions. Its mathematical definition is:
represents the requirements specification knowledge graph. indicates whether the search result in exists, if it exists, the test is determined to be successful, otherwise it is not successful and the completeness is lacking.
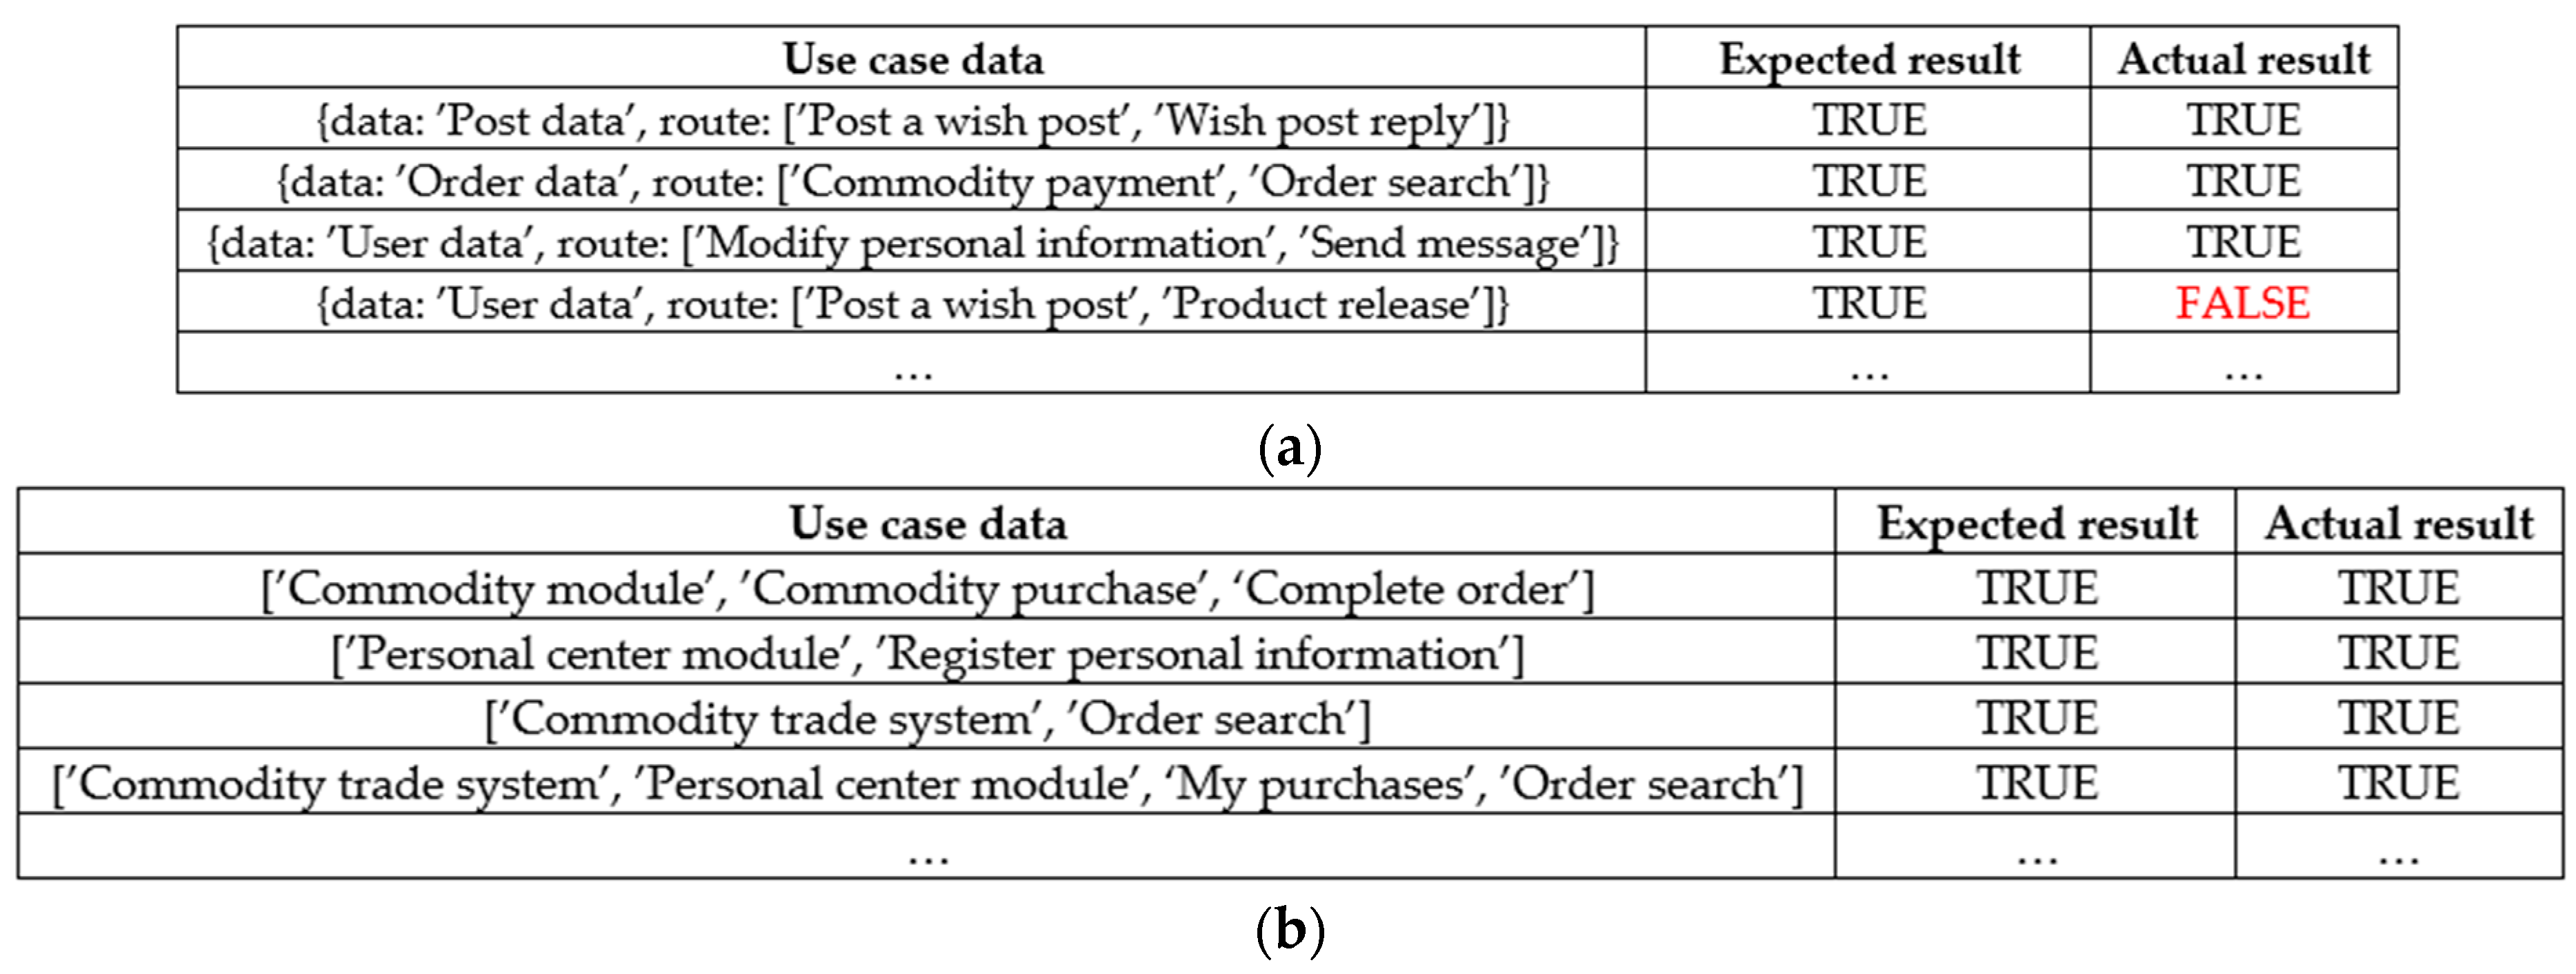
Consistency Test (CST) mainly includes two tests: the path attack test (main process test) from function A to function B and the automatic generation function deployment test of DFD. That is to determine whether the main process extracted by RKG is completely consistent with the core main process of the system, and whether the DFDs generated by extraction at all levels are consistent with the real business situation. By examining the judgment result, it can be determined if there are any discrepancies in .
5. Conclusions
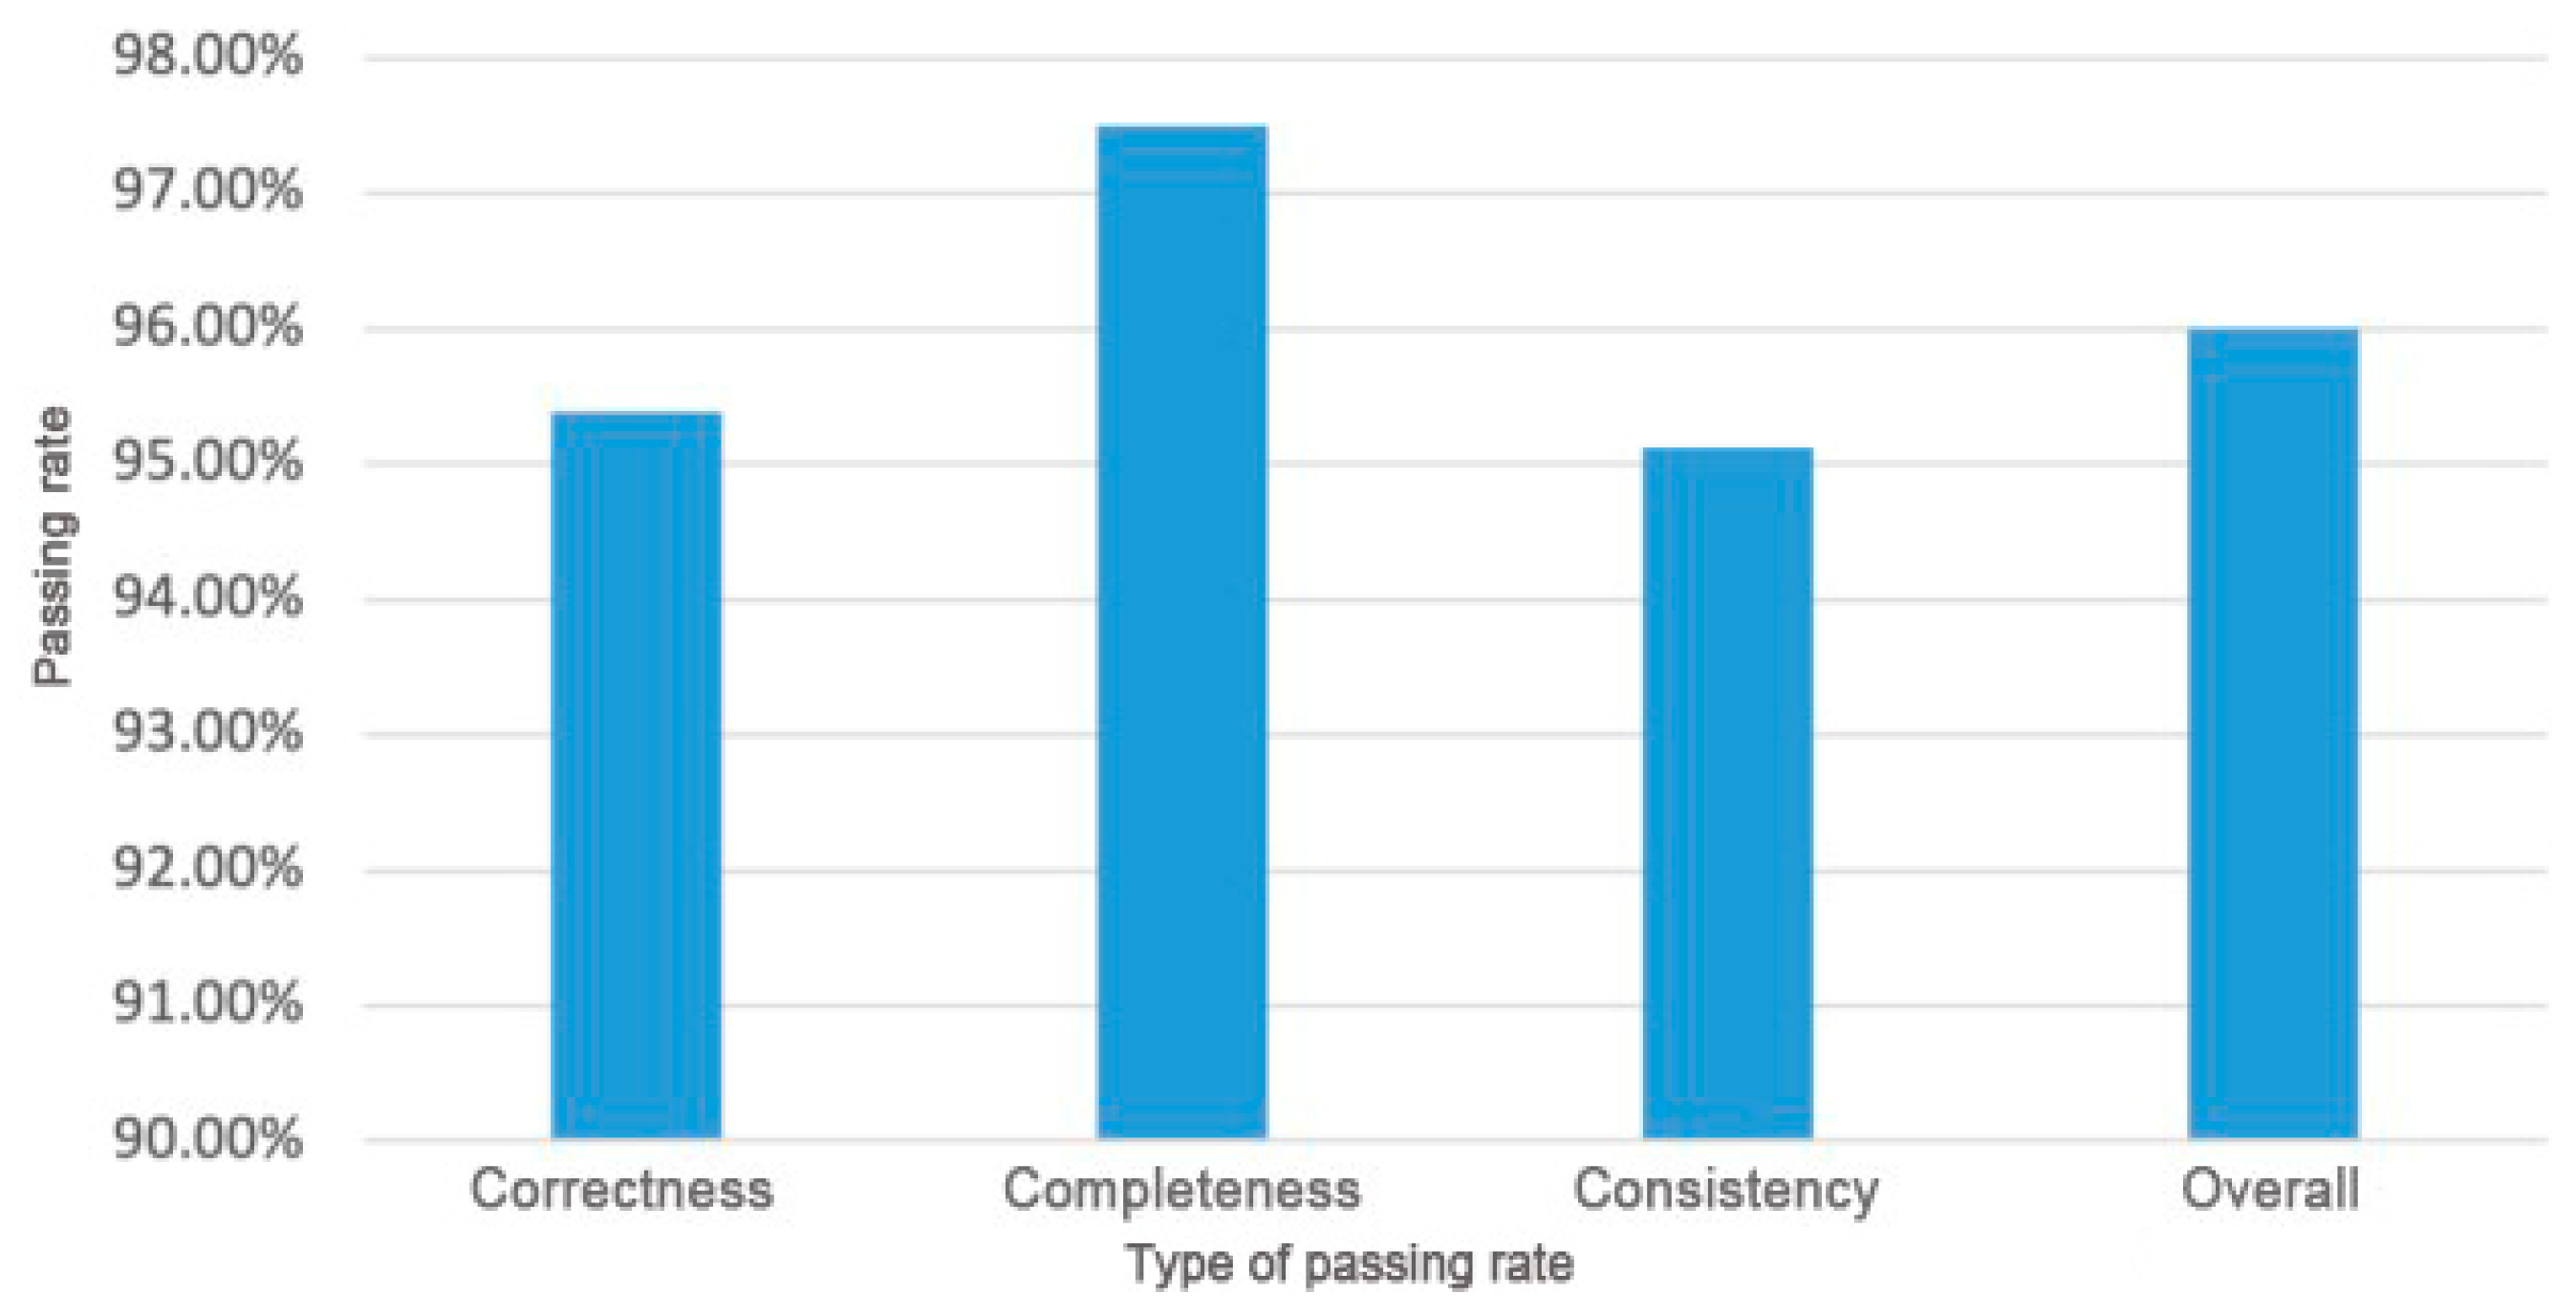
The purpose of this paper is to address the challenges associated with inconsistencies in business descriptions, low writing efficiency, and error-prone processes during manual software requirements specification compilation. To do so, we utilize the BiLSTM-CRF kg model to automatically create a software requirements specification map and generate the corresponding software requirements specification. Additionally, we enhance the U/C matrix used in system analysis by introducing the S/U/C matrix, which facilitates cross-departmental and individual comparisons of local demand survey results. To ensure the quality of the software requirements specification map, a quality inspection method is proposed that leverages the energy transfer relationships between entities in the map. This inspection method includes a series of test cases focusing on correctness, completeness, and consistency. By quickly locating and labeling errors on the DFD, this method allows for the timely resolution of issues that arise during the software requirement research and specification preparation process. The study randomly chose 15 out of 150 software requirements specification maps generated by the BiLSTM-CRF kg model for quality evaluation. The results indicate that the use case test of the requirements specification map has a passing rate of 96%, and the method presented in the paper is effective in generating and updating software requirements specifications.
Although this paper realizes the automatic generation and quality inspection of the software requirements specification, the quality of the software requirements specification map has not been fully evaluated by classification and quantification, and the severity of different errors cannot be distinguished, which requires further study. Additionally, the timing issue during the data flow process will be further considered in future work.


