Article

Study on a Low-Illumination Enhancement Method for Online Monitoring Images Considering Multiple-Exposure Image Sequence Fusion

1
Science and Technology on Electromechanical Dynamic Control Laboratory, Beijing Institute of Technology, Beijing 100081, China
2
School of Electrical and Electronic Engineering, Shandong University of Technology, Zibo 255000, China
3
Inspur Group Co., Ltd., Beijing 100193, China
*
Author to whom correspondence should be addressed.
Electronics 2023, 12(12), 2654; https://doi.org/10.3390/electronics12122654
Submission received: 8 May 2023 / Revised: 7 June 2023 / Accepted: 10 June 2023 / Published: 13 June 2023
(This article belongs to the Special Issue Recent Advances in Computer Vision: Technologies and Applications)

Abstract

:
In order to improve the problem of low image quality caused by insufficient illumination, a low-light image enhancement method with robustness is proposed, which can effectively handle extremely dark images while achieving good results for scenes with insufficient local illumination. First, we expose the images to different degrees to form a multi-exposure image sequence; then, we introduce global-based luminance weights and contrast-based gradient weights to fuse the multi-exposure image sequence; finally, we use a bootstrap filter to suppress the noise that may occur during the image processing. We employ pertinent assessment criteria, such as the Peak Signal to Noise Ratio (PSNR), Structural Similarity (SSIM), the Average Gradient (AG), and the Figure Definition (FD), to assess how well the method enhances. Experimental results show that PSNR (31.32) and SSIM (0.74) are the highest in pretty dark scenes compared to most conventional algorithms such as MF, BIMEF, LECARM, etc. Similarly, in processing uneven illumination such as “moonlit night” images, the AG (10.21) and the FD (14.54) are at maximum. In addition, other evaluation metrics such as Shannon (SH) are optimal in the above scenarios. In addition, we apply the algorithm in this paper to the online monitoring images of electric power equipment, which can improve the image lightness while recovering the detail information. The algorithm has strong robustness in extremely dark images and natural low-light images, and the enhanced images have minimal distortion and best appearance in different low-light scenes.

1. Introduction

Image processing has received a lot of attention from researchers as a result of the advancement of computer vision, and it has been used in a variety of industries, including artificial intelligence [1], smart cities [2], the power industry [3], and the military [4]. Image acquisition, on the other hand, is easily influenced by the environment, particularly in low-light situations such as darkness, overcast days, and obstructed light, when the overall visual impact is gloomy due to the lack of reflected light, and noise and color imbalance can develop [5]. In particular, the monitoring of the power industry is often due to the low-light of the images taken, and the problem of power accidents cannot be dealt with in time, endangering the safety of power equipment and related staff. As a result, the development and application of image enhancement technology has become critical to solving the image quality problem, as it not only provides people with a better visual experience, but also improves the vision system’s reliability and robustness, making it easier to extract and process image information. Scholars at home and abroad have conducted various studies on image enhancement algorithms in order to address the problem of poor image quality in low-light situations.
Retinex: In Retinex-based image enhancement theory, the observed image can be divided into two components, reflection and illumination, and then both are further enhanced before the reflection and illumination are blended to generate the final high-quality image, according to Retinex-based image enhancement theory [6]. Dong et al. [7] inverted low-illumination images to obtain similar fog maps and used a defogging algorithm to improve the image quality. Wang et al. [8] proposed an enhancement algorithm for non-uniform illumination images (NPE), the image is decomposed into reflection and illumination using the bright-pass filter, which determines the detail and naturalness of the image, respectively, under non-uniform illumination; this method can improve image detail while preserving the image’s naturalness, but noise problems will occur. In the method of Fu et al. [9], a new weighted variational model was proposed for better estimating reflectance and illumination a priori, preserving both in greater detail, and in particular suppressing noise to some extent. For the problem of image noise caused by Retinex model-based algorithms after augmentation, Li et al. [10] introduced a robust Retinex model (RRM), and a Lagrangian-based optimization scheme is used to preserve image edges. In summary, Retinex-based algorithms have the advantages of constant color, large-dynamic-range compression, and high color fidelity. However, because most of these algorithms lack the capacity to retain edges, they may generate a halo effect in some sharp edge regions or over-brighten the entire image.
Image fusion: Another low-illumination image enhancement research avenue is the image fusion strategy [11], which is also the topic of this work. The method based on image fusion first acquires images with various lighting at different times using the same sensor, or employs different methods to acquire images with different lighting for the same time and scene. Finally, as much image information as possible is retrieved from the images taken under various lighting conditions and fused into a single high-quality image, resulting in improved image quality and information usage. In our work, the image fusion technique based on a single image is the subject. Le et al. [12] combined the source image and its logarithmic version to get the enhanced image that has sharper details. Yamakawa et al. [13] fused the original image with the Retinex-processed image, which can provide a high-visibility image in both bright and dark areas. According to the illumination–reflection model and multiscale theory, Wang et al. [14] proposed a colored image correction method based on nonlinear functional transformation, then employed principal component analysis (PCA) to combine the original and processed images, in order to improve the self-adaptive capability of image enhancement for low-light images. Celebi et al. [15] generated over- and under-exposed images using a novel adaptive histogram separation scheme, then used a fuzzy-logic-based technique at the fusion stage, which effectively removed ghosting from motion images.
Above all, Fu et al. [16] adjusted the illumination with the sigmoid function and adaptive histogram equalization, and then employed a multi-scale strategy with varied weights in the fusion process to present a trade-off between detail and local. Guo et al. [17] proposed a simple and efficient algorithm, LIME, where the maximum value in the R, G, and B channels is used to estimate the illumination of each pixel, further refining the initial illumination map as the final illumination map; this algorithm is extremely efficient. Through overexposure of non-uniformly illuminated images after enhancement, Wang et al. [18] obtained a priori multi-layer lightness statistics from high-quality images, and incorporated these into the multi-layer enhancement model, which enhanced the contrast and overall lightness of non-uniformly light images while preserving as much naturalness as feasible. Ma et al. [19] decomposed an image patch into three independent components: signal strength, signal structure, and mean intensity, to produce accurate de-noise and de-ghosting effects, each component is processed separately using color and structure information. Then, Ma et al. [20] created MEF-SSIMc, a new MEF image quality model based on MEF-SSIM, and optimized MEF-SSIMc images by iterative search in the space of all images until convergence. The approach has improved quality on both visual perception and MEF-SSIMc, but the calculation time is slow. Ghosh et al. [21] proposed a variational-based Retinex model, and a bright-pass bilateral filtering (BPBF) Fourier approximation was presented to reduce filtering time (by an order) without sacrificing visual quality. In addition, camera response model (CRM)--based fusion algorithms have also attracted the attention of researchers. Ying et al. [22] designed a weight matrix for image fusion using the light estimation technique, and then introduced a camera response model (CRM) to synthesize multi-exposure images to identify the ideal exposure ratio. Ren et al. [23] proposed LECARM, a novel upgraded framework that combines the camera response model (CRM) and the classic Retinex model, which can effectively reduce color distortion and ultimately result in high quality images.
Deep learning: In addition, low-light image processing based on deep learning is attracting more and more attention. Wei et al. [24] collected a low-light dataset (LOL) containing low-/normal-light images, and proposed a deep reading Retinex-net trained on this dataset, which not only has good visual effects in terms of low light enhancement, but can also well represent image decomposition. Xu et al. [25] built a frequency-based low-light-level image decomposition and enhancement model to recover the low-frequency layer image content while suppressing noise. Atoum et al. [26] proposed a color-based LLIE attention network (CWAN) that selects the key color points in the dark image to be enhanced according to the color frequency in the image. Guo et al. [25] proposed a new zero-reference depth curve estimation method (Zero-DCE), and used it to train lightweight neural network DCE-net to adjust the dynamic range of images. Kwon et al. [27] proposed a new low-light image enhancement method, dark region-aware low-light image enhancement (DALE), which can accurately identify dark areas and enhance their lightness.
In short, when dealing with scenarios with uneven lighting, both Retinex-based and image-fusion-based algorithms produce good processing results. However, if we alter the scene to an extremely dark night, the previously mentioned method will exhibit several issues, including general underexposure, vignetting effect, color shift, and loss of detail, limiting the technique’s practical application. As a result, we propose a robust low-light image enhancement algorithm based on multi-exposure image fusion, aiming to extend the application of low-light image enhancement in different lighting scenarios. First, the input image is processed by logarithmic function and non-complex exponential function, and the two processed images are fused by principal component analysis (PCA) to ensure that the lightness of the bright areas is not over-enhanced while illuminating the dark areas, so that the details of the potential image can be properly revealed. Then, for the problem that the image lightness is still dark, the Sigmoid function is used to increase the overall lightness of the image, and the multi-exposure image is obtained by adjusting the parameters. Moreover, we utilize luminance and gradient weights to combine seven photos of varying exposures to create a high-quality image that considers both luminance and edges. Finally, the fast-guided-filter is applied to the augmented image to suppress any noise that may occur. Experiments demonstrate that our algorithm outperforms the compared algorithms in several metrics and has good robustness for effective application in uneven lighting and extreme darkness. The following three areas are where our work makes the most impact:
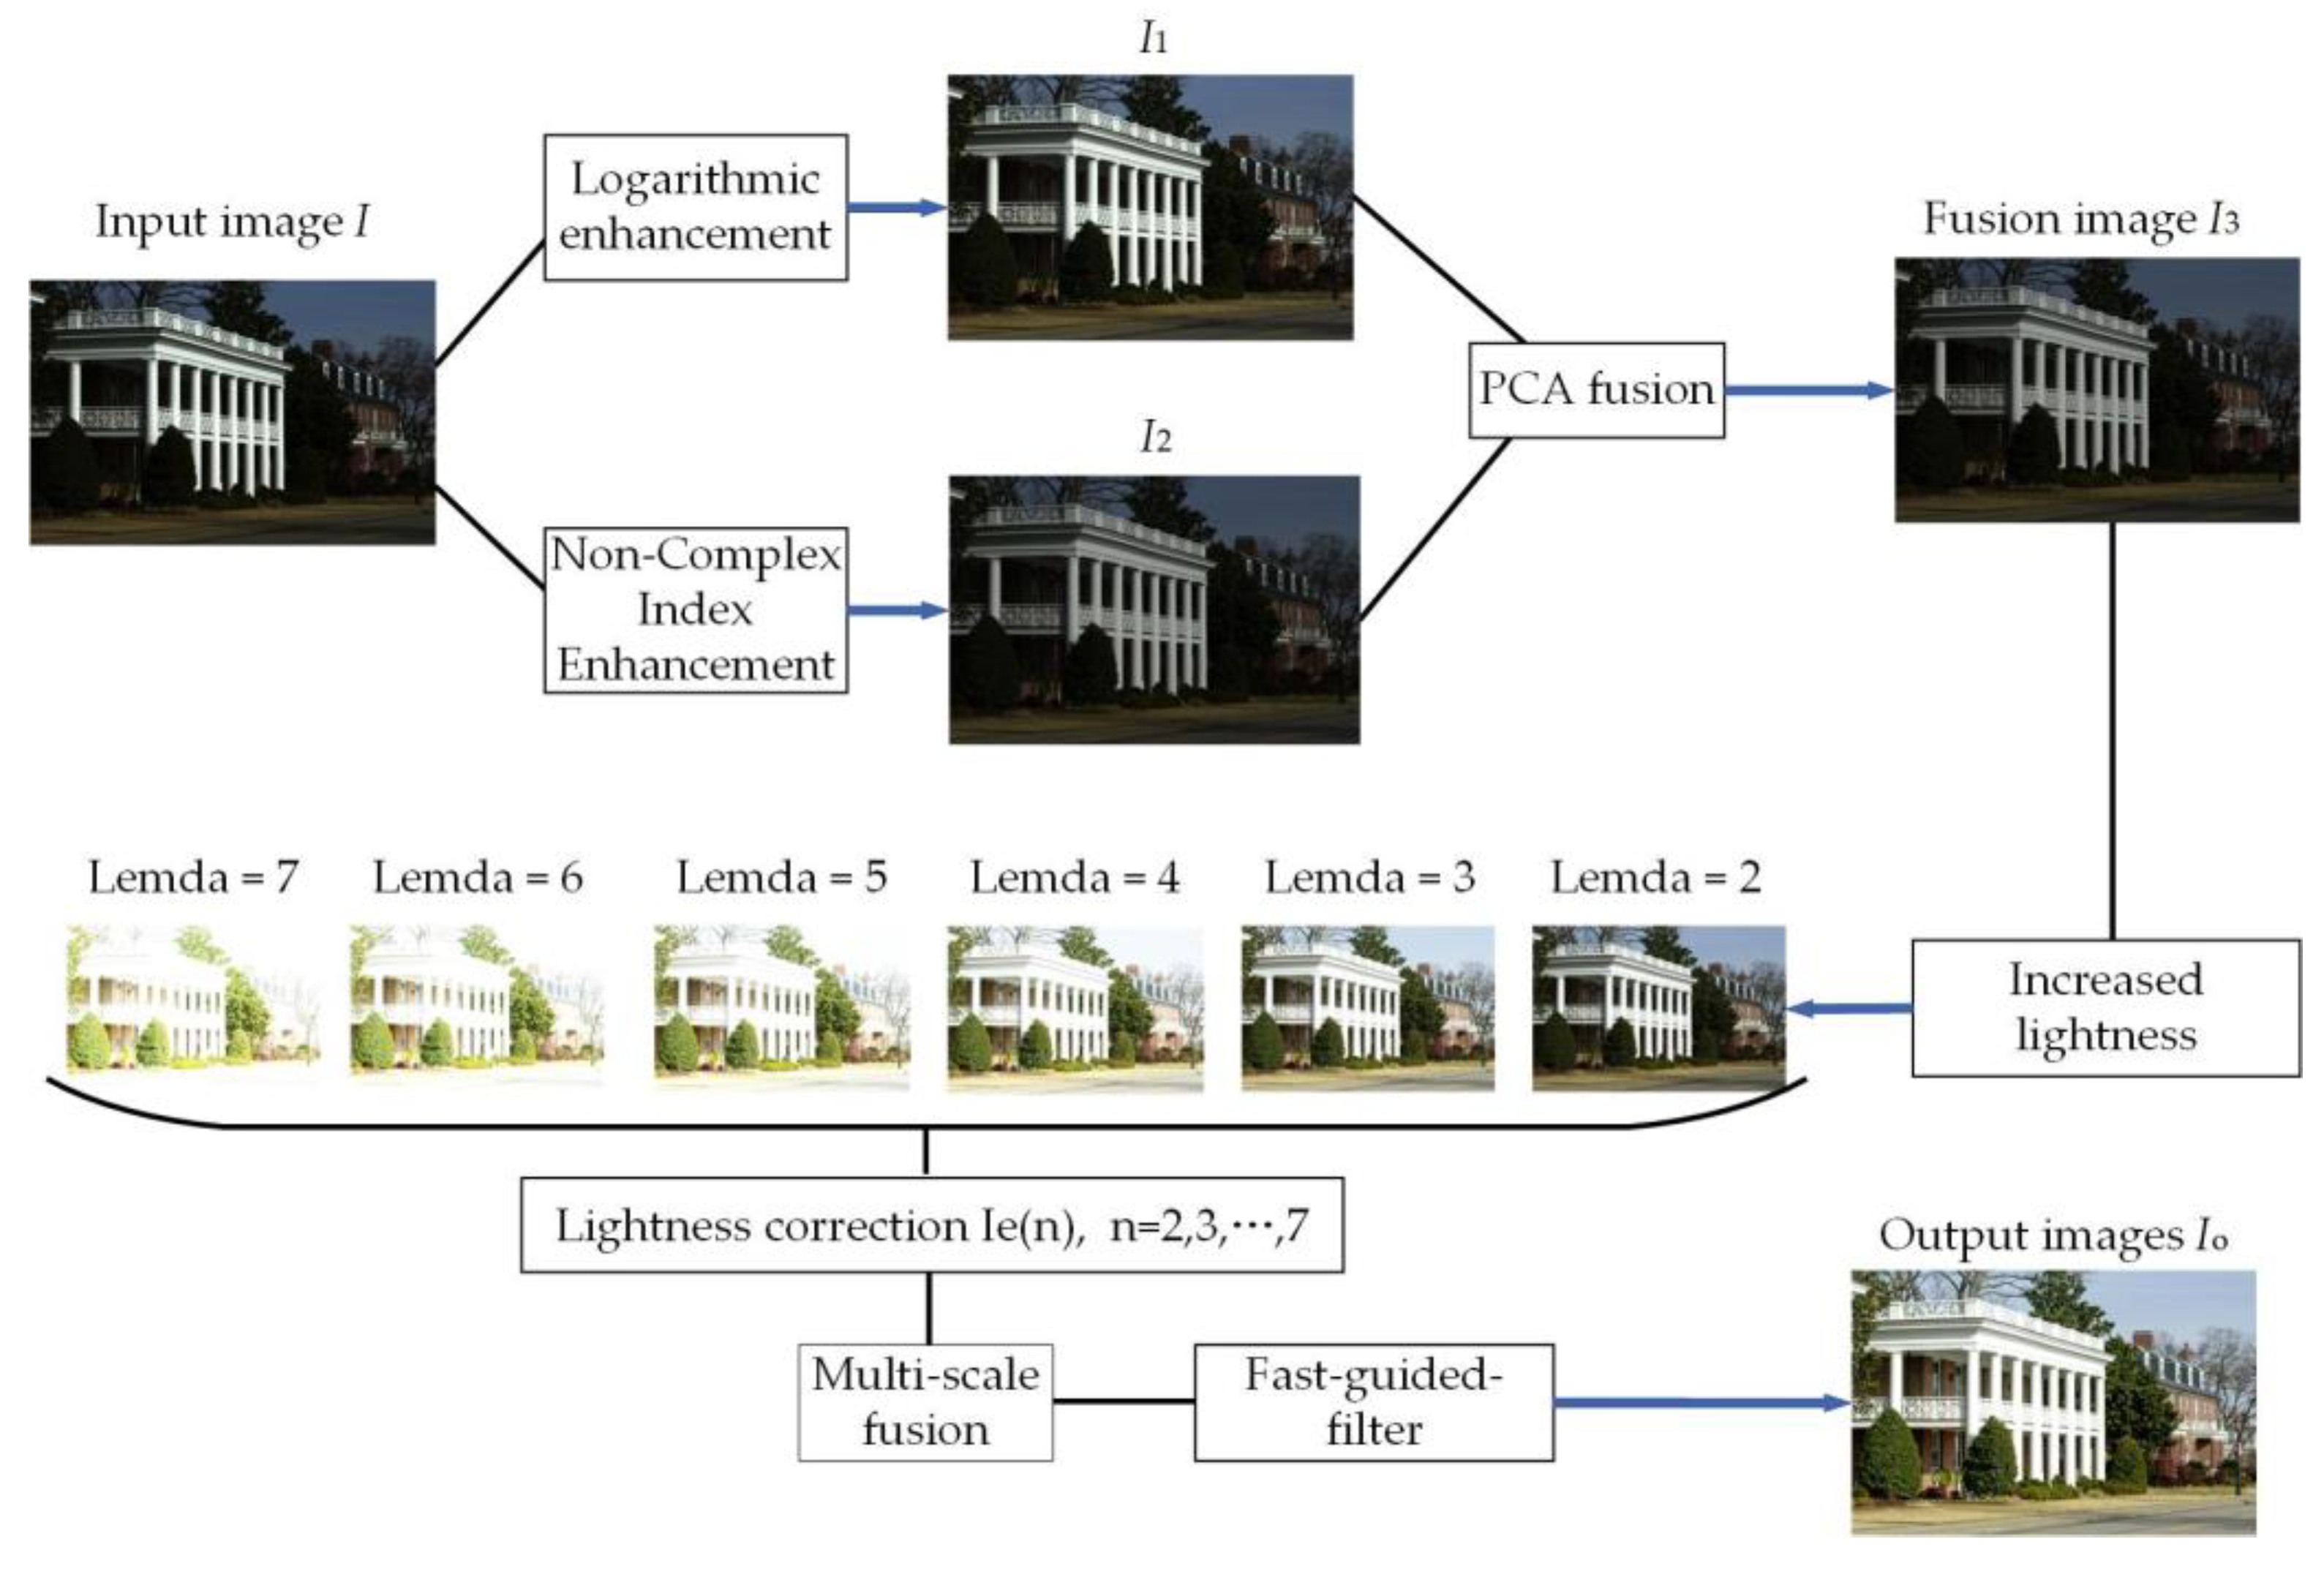
  • To begin, different from [11,12,13], principal component analysis (PCA) is used to fuse the images processed using logarithmic and non-complex exponential functions, because it can be found that PCA expands the unique features of both images while maintaining the features shared by both images, solving the problem of missing features caused by their direct weighting. A weight based on the image’s overall average lightness and gradients is used to increase the overall lightness while also boosting the local lightness and restoring the details of the source image.
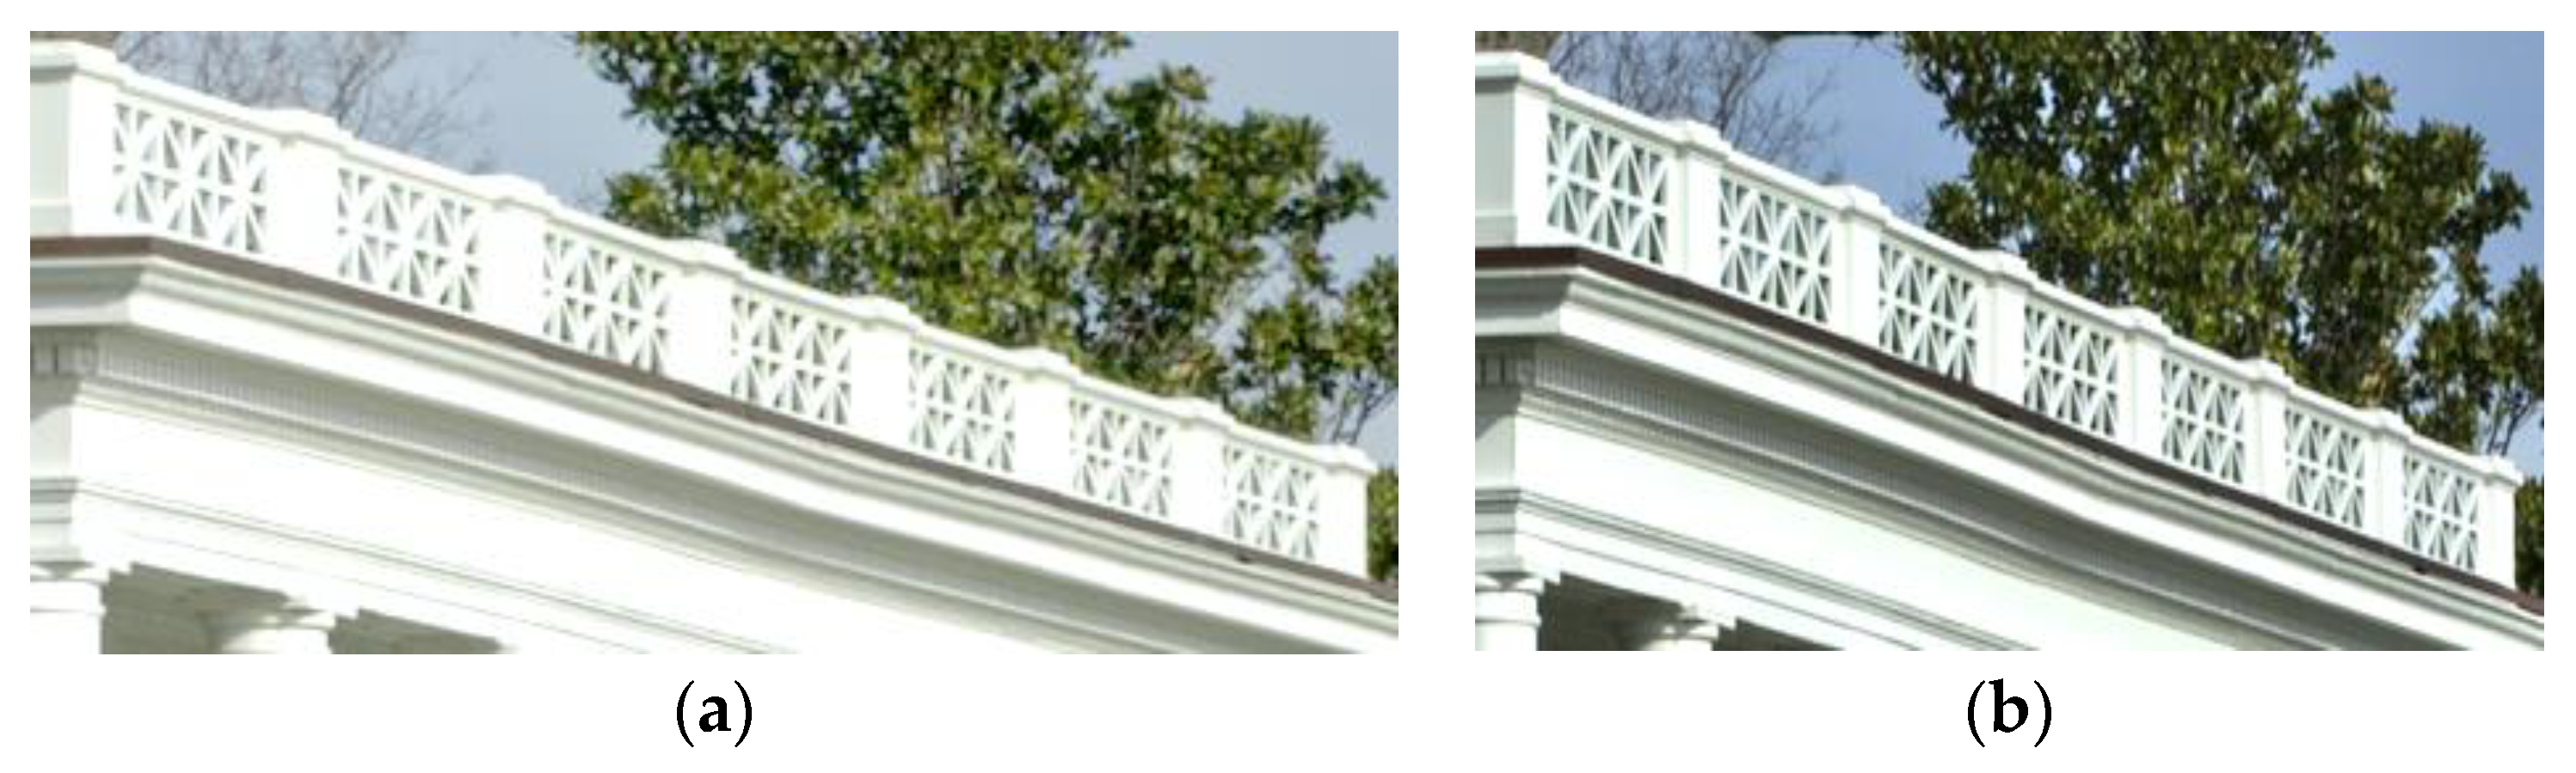
  • Secondly, different from [14,15], for the noise problem that appears in the processed image, a fast-guided-filter is used to suppress it and obtain a higher quality output image, because we find that the application of filter can effectively suppress the noise problem in the process of low illumination image processing.
  • Different from [16,17], our algorithm shows good robustness for extremely dark images and natural images with low light. It can effectively process extremely dark images and achieve good results in local scenes with insufficient illumination.
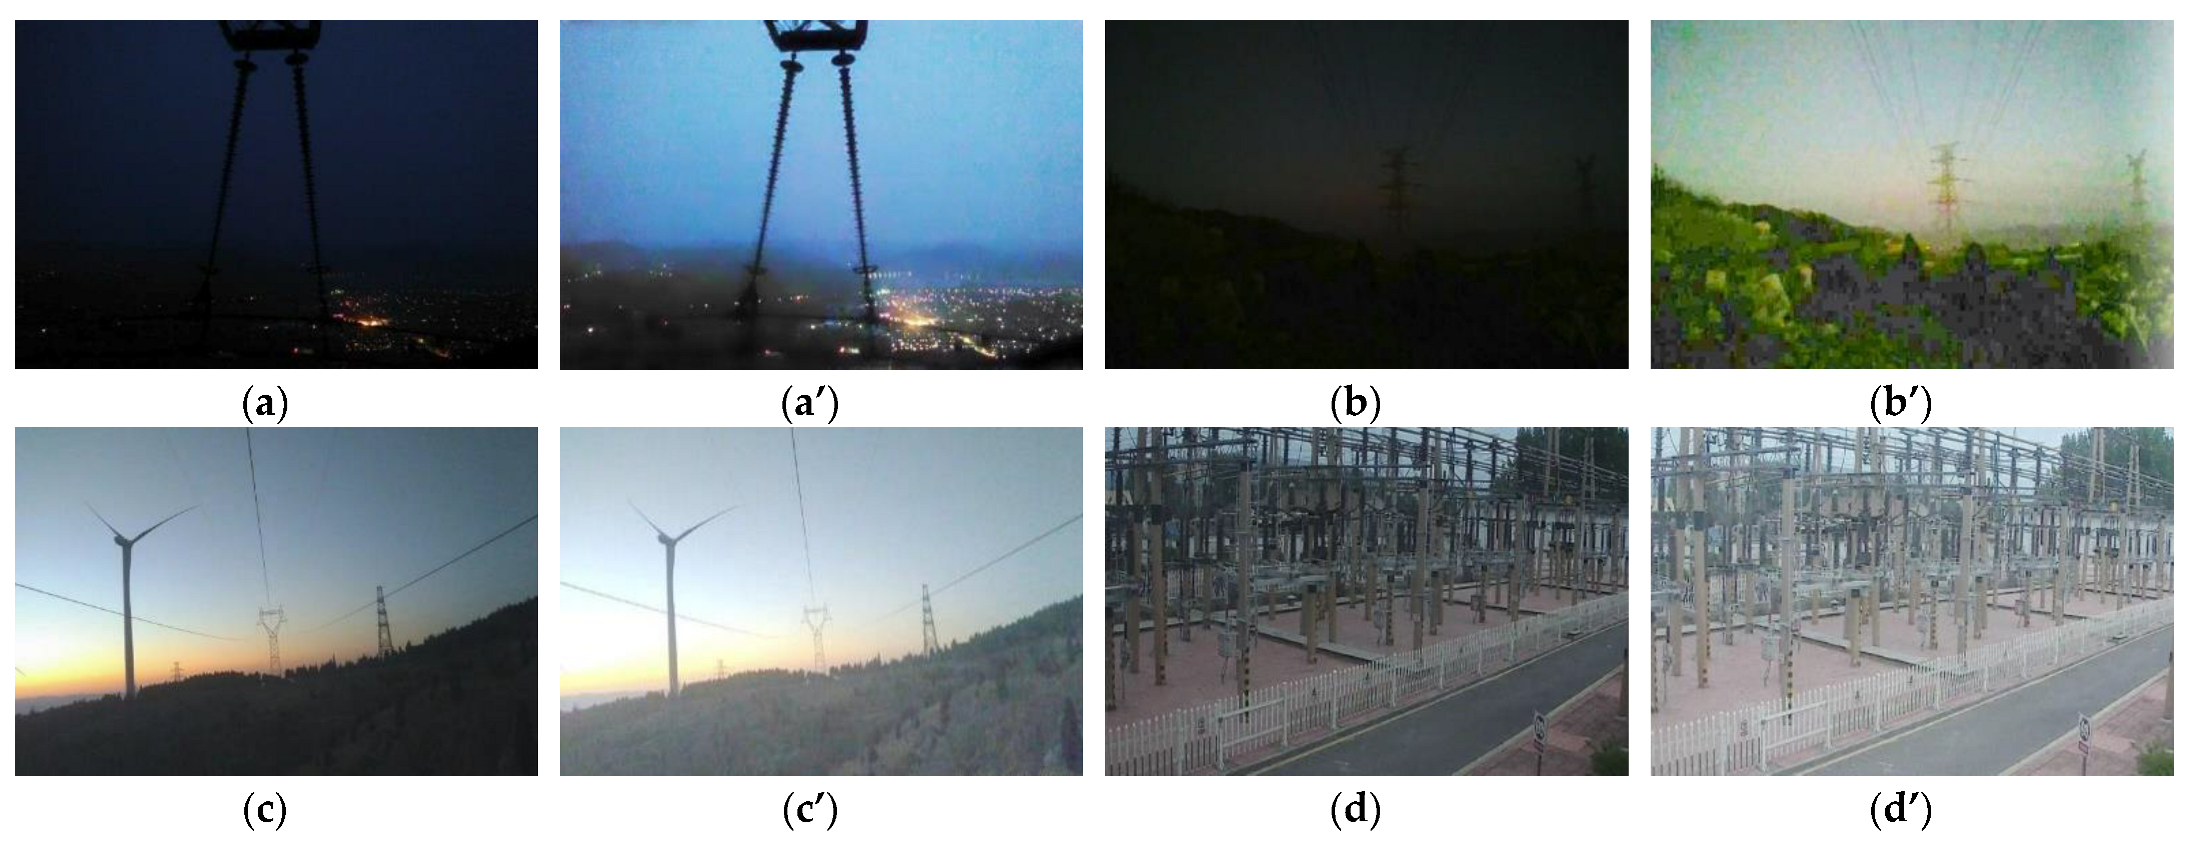
  • Finally, we apply the algorithm to the power industry monitoring, and get an effective processing result, can effectively improve the overall lightness of the image, so that the restored image has a certain degree of fidelity.

2. Materials and Methods

2.1. Proposed Framework

In this paper, from the perspective of image fusion, multiple exposures are performed on images under shimmering light conditions to obtain image sequences with different light intensities, respectively, and the exposed images are fused using weights based on light intensities as well as gradients, and finally the noise of the images is suppressed using fast guided filter to ultimately obtain high-quality images.
The specific algorithm flow is shown in Figure 1. First, the input image I is logarithmically enhanced and non-complex exponential function enhanced to obtain I 1 and I 2 respectively; then, I 1 and I 2 are fused based on PCA (principal component analysis) to obtain the fused image I 3 ; lightness enhancement and normalization are performed on I 3 to obtain the image sequence I e ( n ) with different lightness; then, the image sequence I e ( n ) is fused according to the weights W l and W g to obtain the fused image I f ; finally, the noise in the image is suppressed using the fast bootstrap filter, and finally the high-quality image I o is obtained.

2.2. Image Multi-Exposure

Most of the existing low-light image imaging models follow the Retinex theory [6], Retinex theory decomposes a given image S ( x , y ) into a luminance image L ( x , y ) and a reflection image R ( x , y ) , and follows the following equation:
S ( x , y ) = L ( x , y ) × R ( x , y )
Based on the above model of Retinex theory, low-illumination images are mostly characterized by uneven illumination and overall darkness. Of these, uneven illumination manifests in the varied light intensities of pixels in different regions, with the potential presence of low-, medium- and high-intensity pixels. To do this, the input image is first enhanced with a logarithmic function that enhances low- and medium-intensity pixels while avoiding over-enhancement of high-intensity pixels [23]:
I 1 = { max ( I ) + 1 } × log ( I + 1 )
where I is the input low-illumination image and I 1 is the logarithmically enhanced image. In addition, the input image I is processed using a non-complex exponential function [28] that modifies the local contrast while weakening high-intensity pixels in order to optimize the I 1 local contrast overpowering problem in the subsequent fusion process, as shown below:
I 2 = 1 exp ( I 1 )
where I 2 is the image after non-complex exponential enhancement. Since I 1 and I 2 have similar overall information, in our study, a principal component analysis (PCA)-based method is chosen for image fusion in order to expand their unique information while preserving their overall similarities in information [29]. By computing the feature vectors of the source images and the related feature values, the principal components of similar images are discovered, and the weights of the subimages to be fused are determined based on the principal components [14]. The process is shown in Figure 2.
For two source images, I 1 and I 2 , each image is regarded as an n-dimensional vector denoted as X m , where m = 1 , 2 . The specific PCA image fusion procedure is as follows:
1.
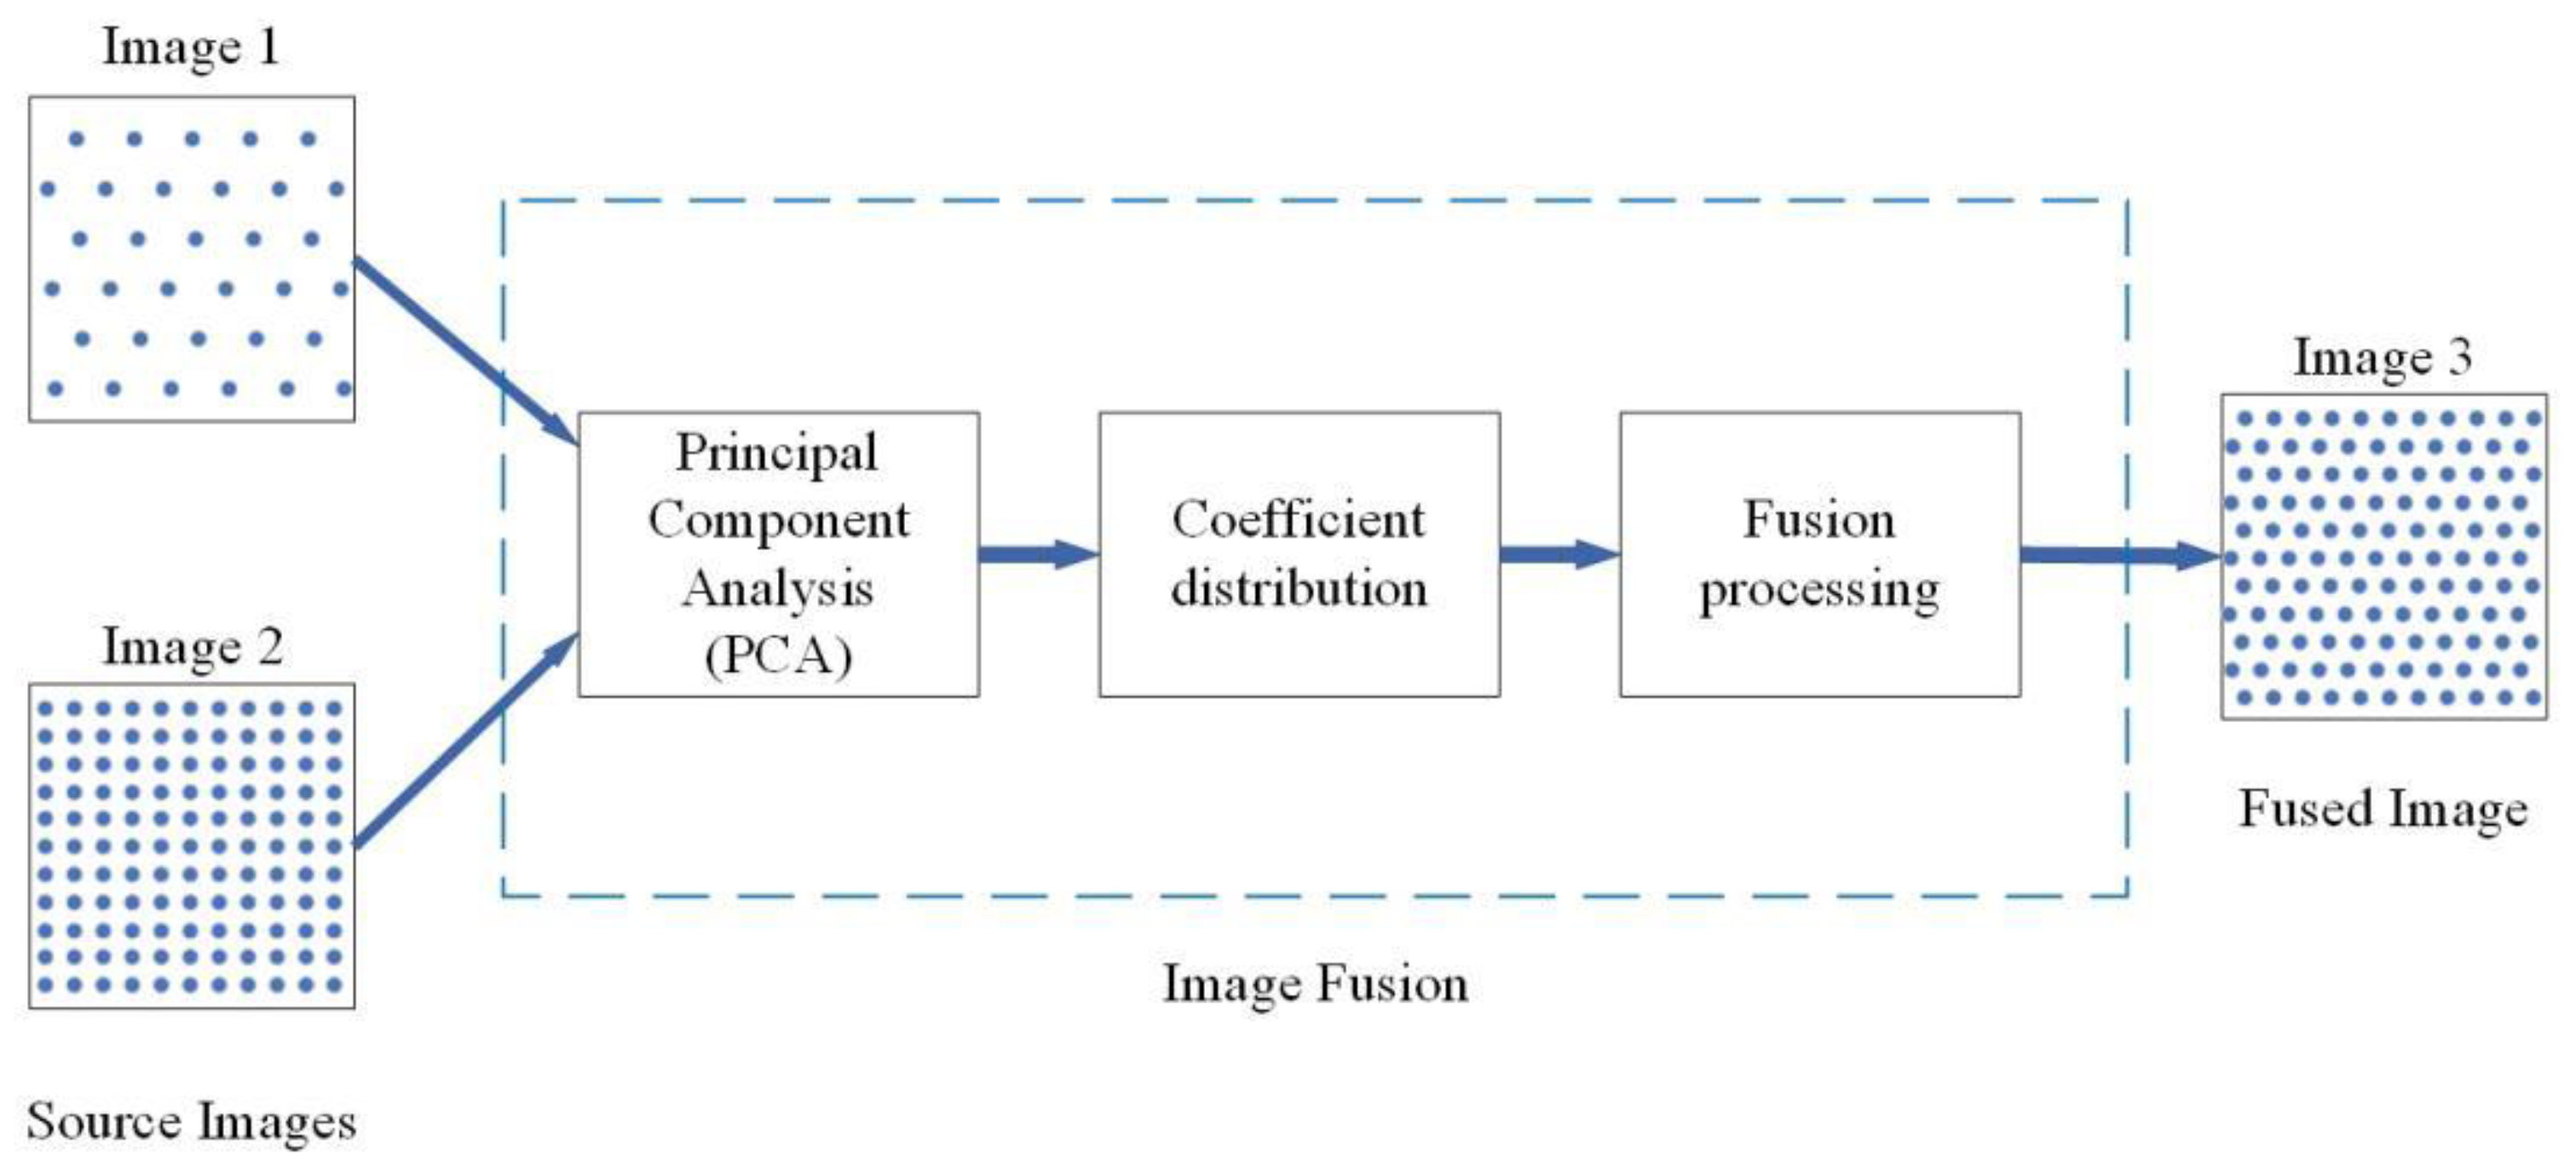
Construct n-dimensional vector matrix X using two source images.
X = ( X 11 X 21 X 12 X 22 X 1 n X 2 n )
2.
Calculate the covariance matrix C of the data matrix X .
C = ( σ 11 2 σ 12 2 σ 21 2 σ 22 2 )
In Equation (5), σ i j 2 is the covariance of the image, which satisfies:
σ i j 2 = 1 n k = 1 n ( x i , k x i ¯ ) ( x i , k x j ¯ )
where x i ¯ and x j ¯ are the average value of the i-th and j-th source image, respectively.
3.
Calculate the eigenvalues λ i of the covariance matrix C , and the corresponding eigenvectors ξ i = ( ξ i 1 ξ i 2 ) , where i = 1 , 2 .
4.
Select a large eigenvalue λ = max ( λ 1 , λ 2 ) , and calculate the weight coefficient using the feature vector corresponding to the largest eigenvalue.
W 1 = ξ i 1 / ( ξ i 1 + ξ i 2 ) ,   W 2 = ξ i 2 / ( ξ i 1 + ξ i 2 )
5.
Based on the above, we fuse the images I 1 and I 2 : I 3 = W 1 × I 1 + W 2 × I 2 . The fused image I 3 is obtained, which contains the features of images I 1 and I 2 while retaining the similarity between the two, solving the problem of missing features caused by direct weighting of the two images. However, the lightness of image I 3 after PCA fusion is still dark, and the lightness of the image needs to be enhanced.
To enhance the overall lightness of the PCA-fused image I 3 in order to display the majority of the image’s potential details, a modified cumulative distribution function of the β hyperbolic secant distribution (BHS) is employed [30].
F ( x ) = 2 arctan ( exp ( x ) ) π
The standard BHS function, a very common function in probability theory, can improve the overall lightness as well as enhance the contrast. In addition, to obtain exposure image sequences with varied luminance, a hyperparameter μ is introduced and the original BHS function is modified using the Sigmoid function as follows.
I 4 = erf [ μ × arctan ( exp ( I 3 ) 0 . 5 × I 3 ) ]
where I 4 is the image after I3’s lightness has been increased. To begin, the curve transformation of the BHS function is increased using the error function erf, which effectively improves the image lightness. Then, instead of 2/π, a hyperparameter μ is used to adjust the degree of lightness amplification, the greater the μ is, the brighter the output image is, and the range of μ is experimentally known as [2,7]. Furthermore, employing 0 . 5 × I 3 allows the image tones to be more similar to the tones of the scene as observed by the human eye. However, the image I 4 modified by Equation (9) has a huge dynamic range, causing the image to appear very white. To accomplish this, the image I 4 must be normalized in order to keep the dynamic range within the usual range.
I e ( n ) = I 4 I 4 min I 4 max I 4 min
where I e ( n ) , n = 2 , 3 , 5 , 6 , 7 is the normalized image sequence. Compared with I 4 , I e ( n ) has a more standard dynamic range and visually better results.

2.3. Image Fusion

Although adjusting the value of μ can achieve relatively satisfactory exposure images after using the above method to generate image sequences with varying exposure intensities, there are still issues such as insufficient detail, overexposure, and contrast imbalance, among others. For this reason, it is necessary to fuse the resulting multi-exposure image sequences. Most traditional multiple-exposure image fusion methods define a weighting function for multiple images, assign larger weights to the well-exposed regions, and define smaller weights in the poorly exposed regions to achieve global lightness enhancement by weighting, and the traditional image fusion methods are as follows:
I f u s ed d = n = 1 N W n × I n
where N is the number of images, I n is the pixel intensity of the nth image, and W n is the weight of the image I n . For multiple exposure images, in the traditional method, the same function is basically applied to define the weights.
Unlike traditional methods, in this paper, weights are defined separately using two different functions for multi-exposure image fusion. Specifically, weights W l characterize the relevance of pixel intensity at the measurement point in relation to the overall average luminance and the intensity of nearby pixels, while weights W g characterize the importance of pixels at smaller gradients. Finally, the multi-exposure images are fused using pyramids to obtain the image I f , the specific method of multi-exposure fusion is as follows.

2.3.1. Weight Design Based on the Average Luminance

The design of luminance weights is significant in multi-exposure image fusion, often providing more weight to pixels in darker regions and vice versa. Distinguishing between the luminance weights of 0 (underexposed) and 1 (overexposed) proposed in refs. [13,31] used a Gaussian function that allocated a weight to each pixel based on how near the lightness was to the reference value μ, as indicated in Equation (12).
f ( x , y ) = exp ( - [ I ( x , y ) - μ ] 2 2 σ 2 )
where I ( x , y ) is the luminance value of each pixel of the input image, μ is the mean (reference value) of the Gaussian function, and σ is the standard deviation of the Gaussian function; in ref. [13] the authors set values of μ = 0.5 and σ = 0.2. When the input pixel lightness is close to the reference value μ, the weight is increased; conversely, when the input pixel lightness is the principal reference value μ, the weight is decreased. However, in dark or bright regions far from 0.5, Equation (12) cannot assign a bigger weight to the pixel lightness; specifically, the weight in Equation (12) cannot highlight the dark regions of an image that is brighter overall or the bright regions of an image that is dark overall. To solve the above problem, a weight W l relative to the overall average image lightness I mean is introduced, and when I ( x , y ) is close to ( 1 I mean ) , a large weight is given to the pixel point.
W l ( x , y ) = ( 1 2 π σ ) exp ( [ I ( x , y ) ( 1 I mean ) ] 2 2 σ 2 )
Similarly, in Equation (13), we set the standard deviation σ of the Gaussian function to be 0.5. In order to explain the standard deviation σ, we performed a value experiment.
As can be seen from Figure 3, when σ = 0.1, the lightness of many shadow parts in the image is still too low; when σ = 1, the image has the problem of missing detail due to the increase in lightness. The lightness and detail problems caused by the value of σ are more obvious in the red rectangles.

2.3.2. Weight Design Based on the Global Gradient

In a poorly exposed image, the intensity of dark pixels is close to zero, while bright areas usually exhibit a high contrast (gradient) due to their high pixel intensity. Conversely, the contrast (gradient) in the darker areas is greater in the better-exposed images. The texture detail in the region with greater contrast (gradient) will acquire more weight as a result of the usage of Formula (13); nevertheless, the texture detail in well-exposed regions with little contrast (gradient) may be under-appreciated due to the lesser weight. To improve this problem, gradient weight W g is used to emphasize well-exposed areas without regard to their local contrast [32].
W g ( x , y ) = G r a d n ( I n ( x , y ) ) 1 n = 1 N G r a d n ( I n ( x , y ) ) 1 + ε
where ε is a very small positive value to prevent the denominator from becoming zero. G r a d n ( I n ( x , y ) ) 1 is the gradient at pixel intensity In(x, y). With this weight W g , the small gradients of the image can be well described and the information loss at the small gradients can be reduced.

2.3.3. Fusion Based on Pyramid

The final weight W f is calculated by combining the luminance weight W l and the gradient weight W g .
W f ( x , y ) = W l ( x , y ) γ 1 × W g ( x , y ) γ 2 n = 1 N W l ( x , y ) γ 1 × W g ( x , y ) γ 2 + ε
where γ 1 and γ 2 are used to measure the importance of the luminance and the gradient; both are set to 1 in this paper. Finally, using the weight W f , the multiple exposure image sequences are combined with Laplace pyramids to produce the output image I p [33]. The specific Laplace and Gaussian Pyramid fusion method is as follows.
The N weights are first normalized to have a sum of 1 at each pixel, i.e.,
W x y , n = W x y , n   n   = 1 N W x y ,   n   + ε
The input image is split into Laplace pyramids, with each layer comprising band-pass-filtered images at various scales, where each layer is then fused separately. The l-th level of the Laplace pyramid in the image sequence I e is defined as L { I e } x , y L and the lth level of the normalized weight W x y , n Gaussian pyramid is defined as G { W x y , n } x , y L . From this, the pixel intensity of each layer of the fused image can be defined.
L { I } x y n = n = 1 N L { I e } x y n × G { W } x y n
The nth layer of the Laplace pyramid is used as the original image pixel intensity, and the nth layer of the normalized-weight Gaussian pyramid is used as the weight. Finally, the Laplacian pyramid L { I e } x , y L of the fused image is recursively obtained as a high-quality image I p . For the different band features and details of different layers of the image Laplace pyramid, the corresponding weighted Gaussian pyramid is used, and the features and details are highlighted by fusion to finally obtain a high-quality fused image I p .
Finally, for the problem of noise in the fused image, a fast guided filter [34] is used to suppress the noise while maintaining the edges, yielding the output image I o . In addition, the whole process is summarized in Algorithm 1.
Algorithm 1
Input: input image I
Do   
1.
Obtain I1 and I2 respectively by logarithmic and non-complex exponential function enhancement using Equations (2) and (3);
2.
Obtain I3 by fussing images I1 and I2 based on the PCA;
3.
Multiple exposures for I3 to get sequences of images Ie (n) using Equations (9) and (10), where n = 2, 3, 4, 5, 6, 7;
4.
Fusing Ie (n) according to Wl and Wg;
5.
Suppress the noise using fast-guided-filter.
Output: enhanced image Io

3. Experimental Results and Analysis

3.1. Dataset and Experimental Environment

We used a computer with a Core i7, 3.40 GHz CPU and used the MATLAB 2020 simulation software to process the low-illumination image. The proposed algorithm is compared with the traditional algorithms Dong [7], NPE [8], SRIE [9], RRM [10], MF [16], BPBF [21], BIMEF [22], BIMEF [22], and LECARM [23]. The proposed algorithm was tested on the low-light paired dataset (LOL), which is the first dataset containing image pairs taken from real scenes for low-light enhancement, and contains 500 low-/normal-light image pairs, which were resized to 400 × 600.

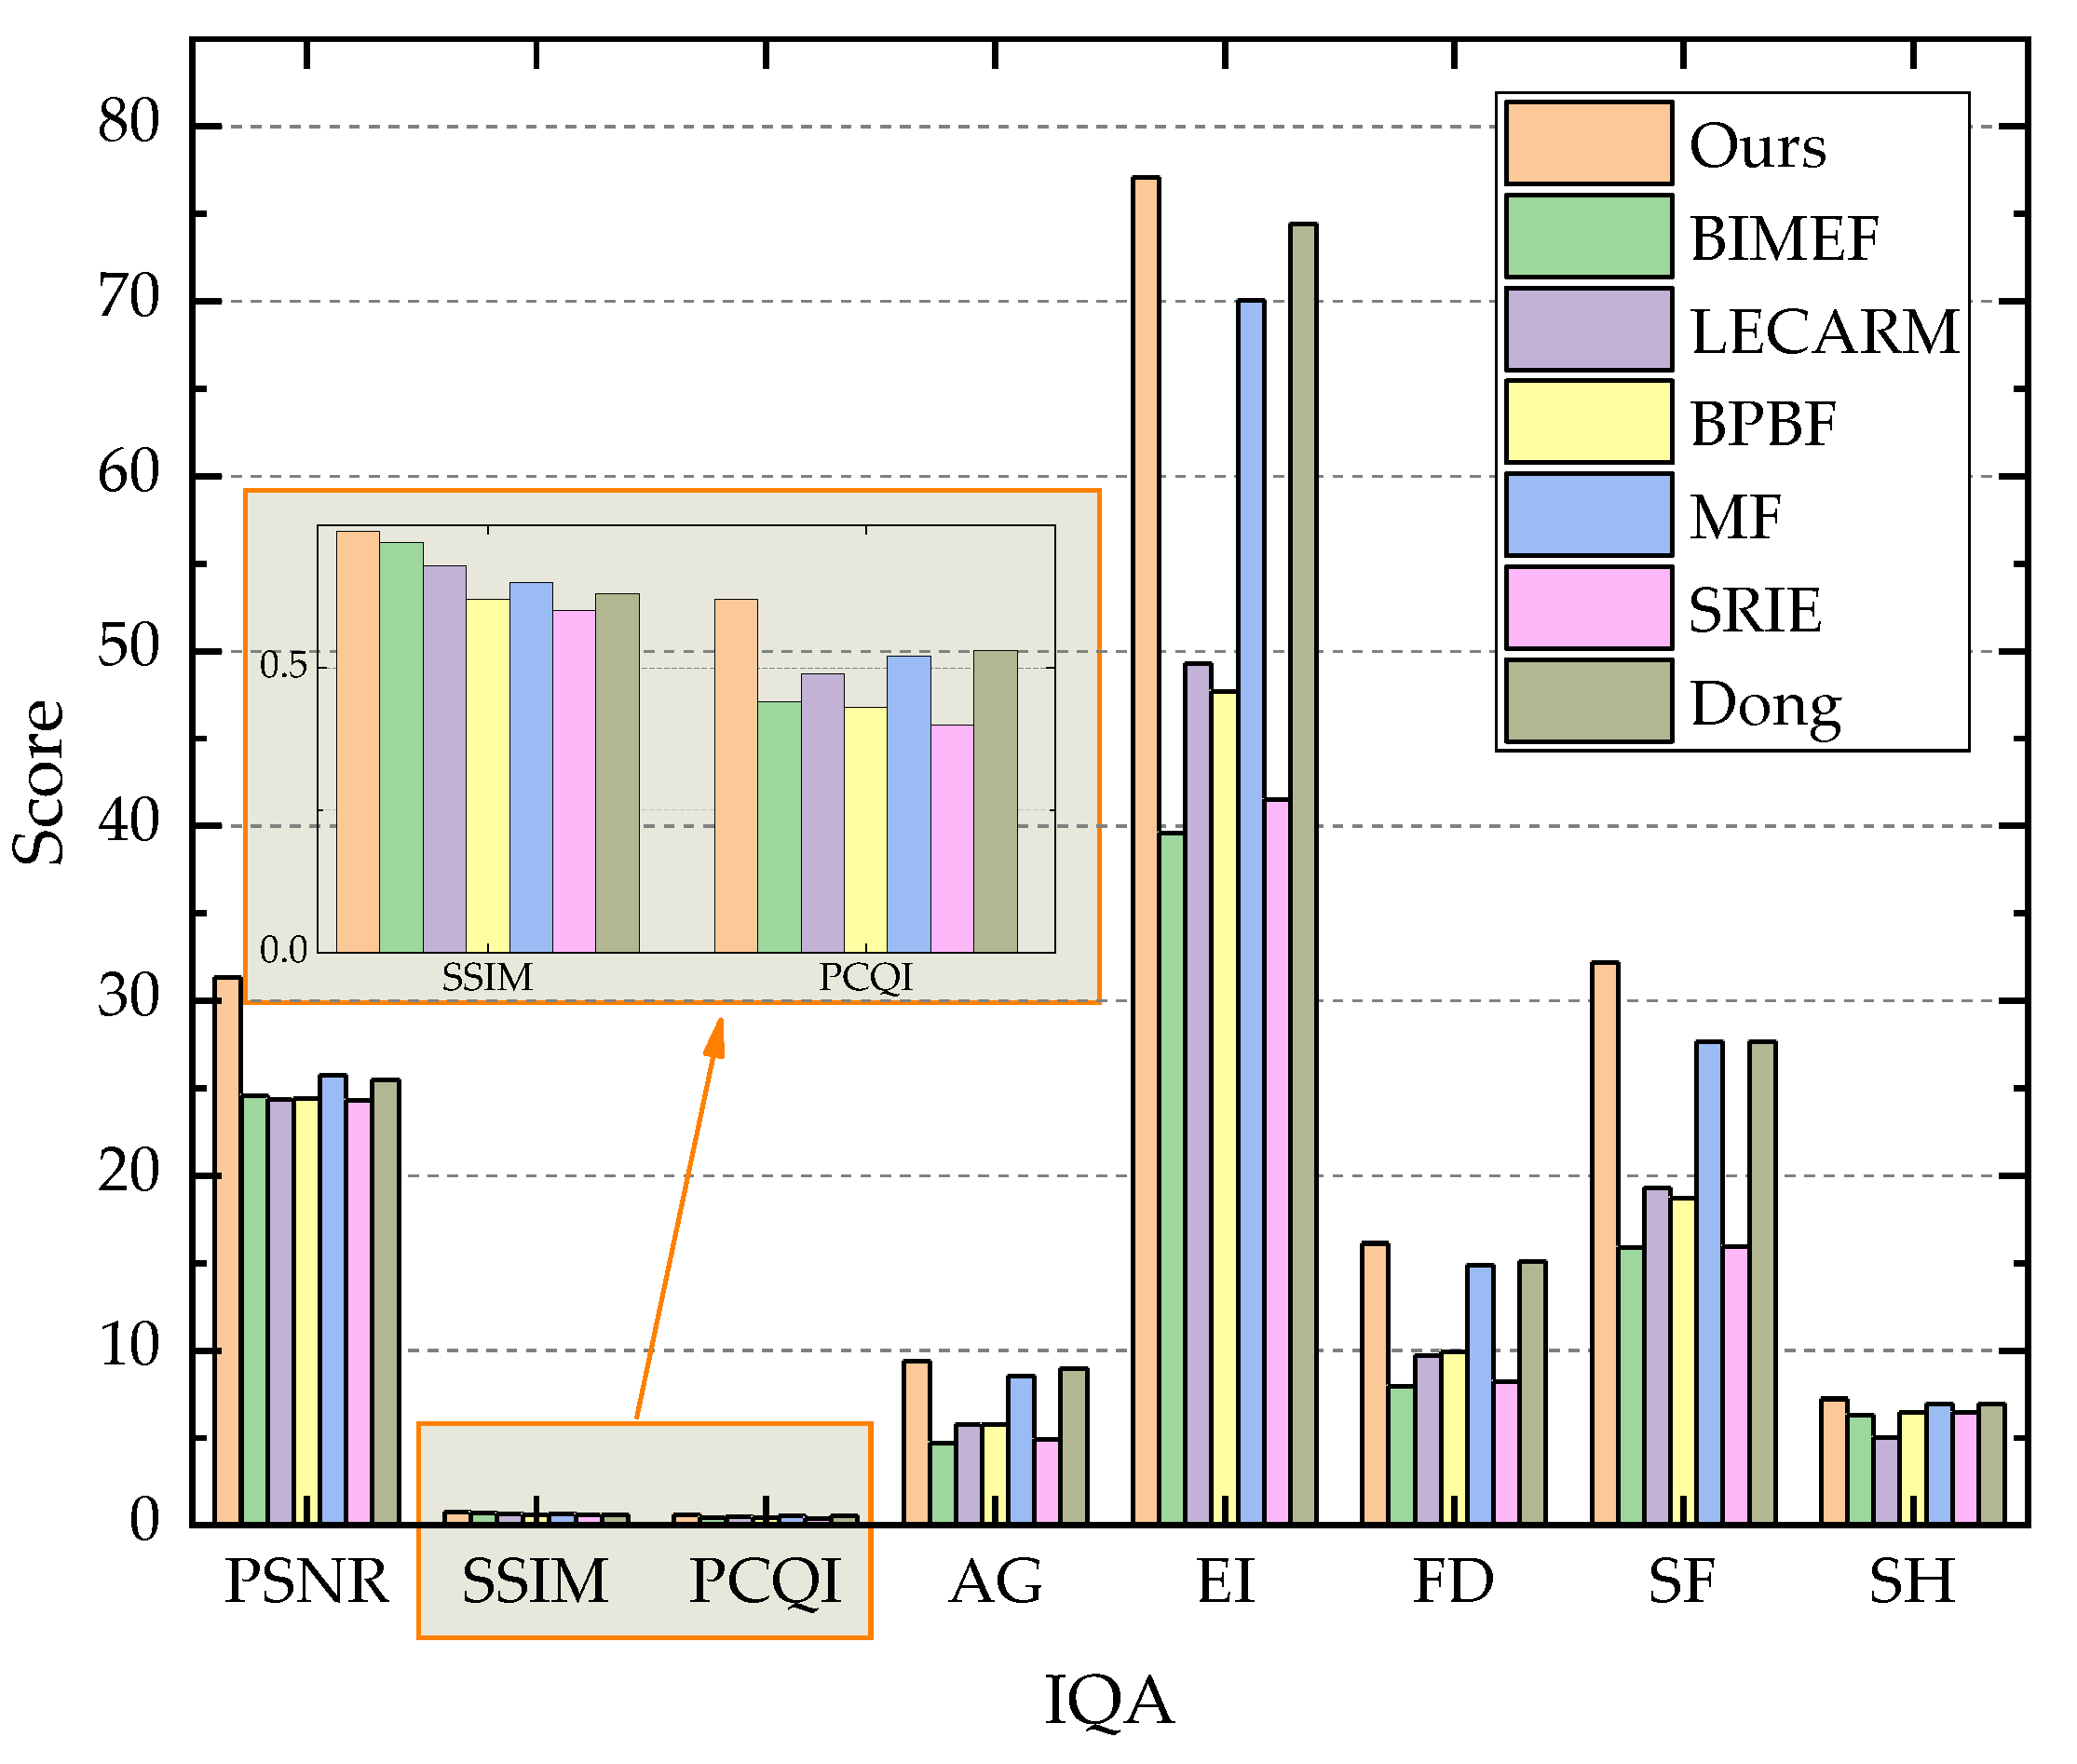
3.2. Comparison with Others

Firstly, the qualitative and quantitative analysis of very dark images on the basis of a standard reference is performed using different algorithms. In addition, to verify the robustness of the method, low-illumination images with different light intensities under natural light are selected for processing and compared with the reference-free evaluation index.

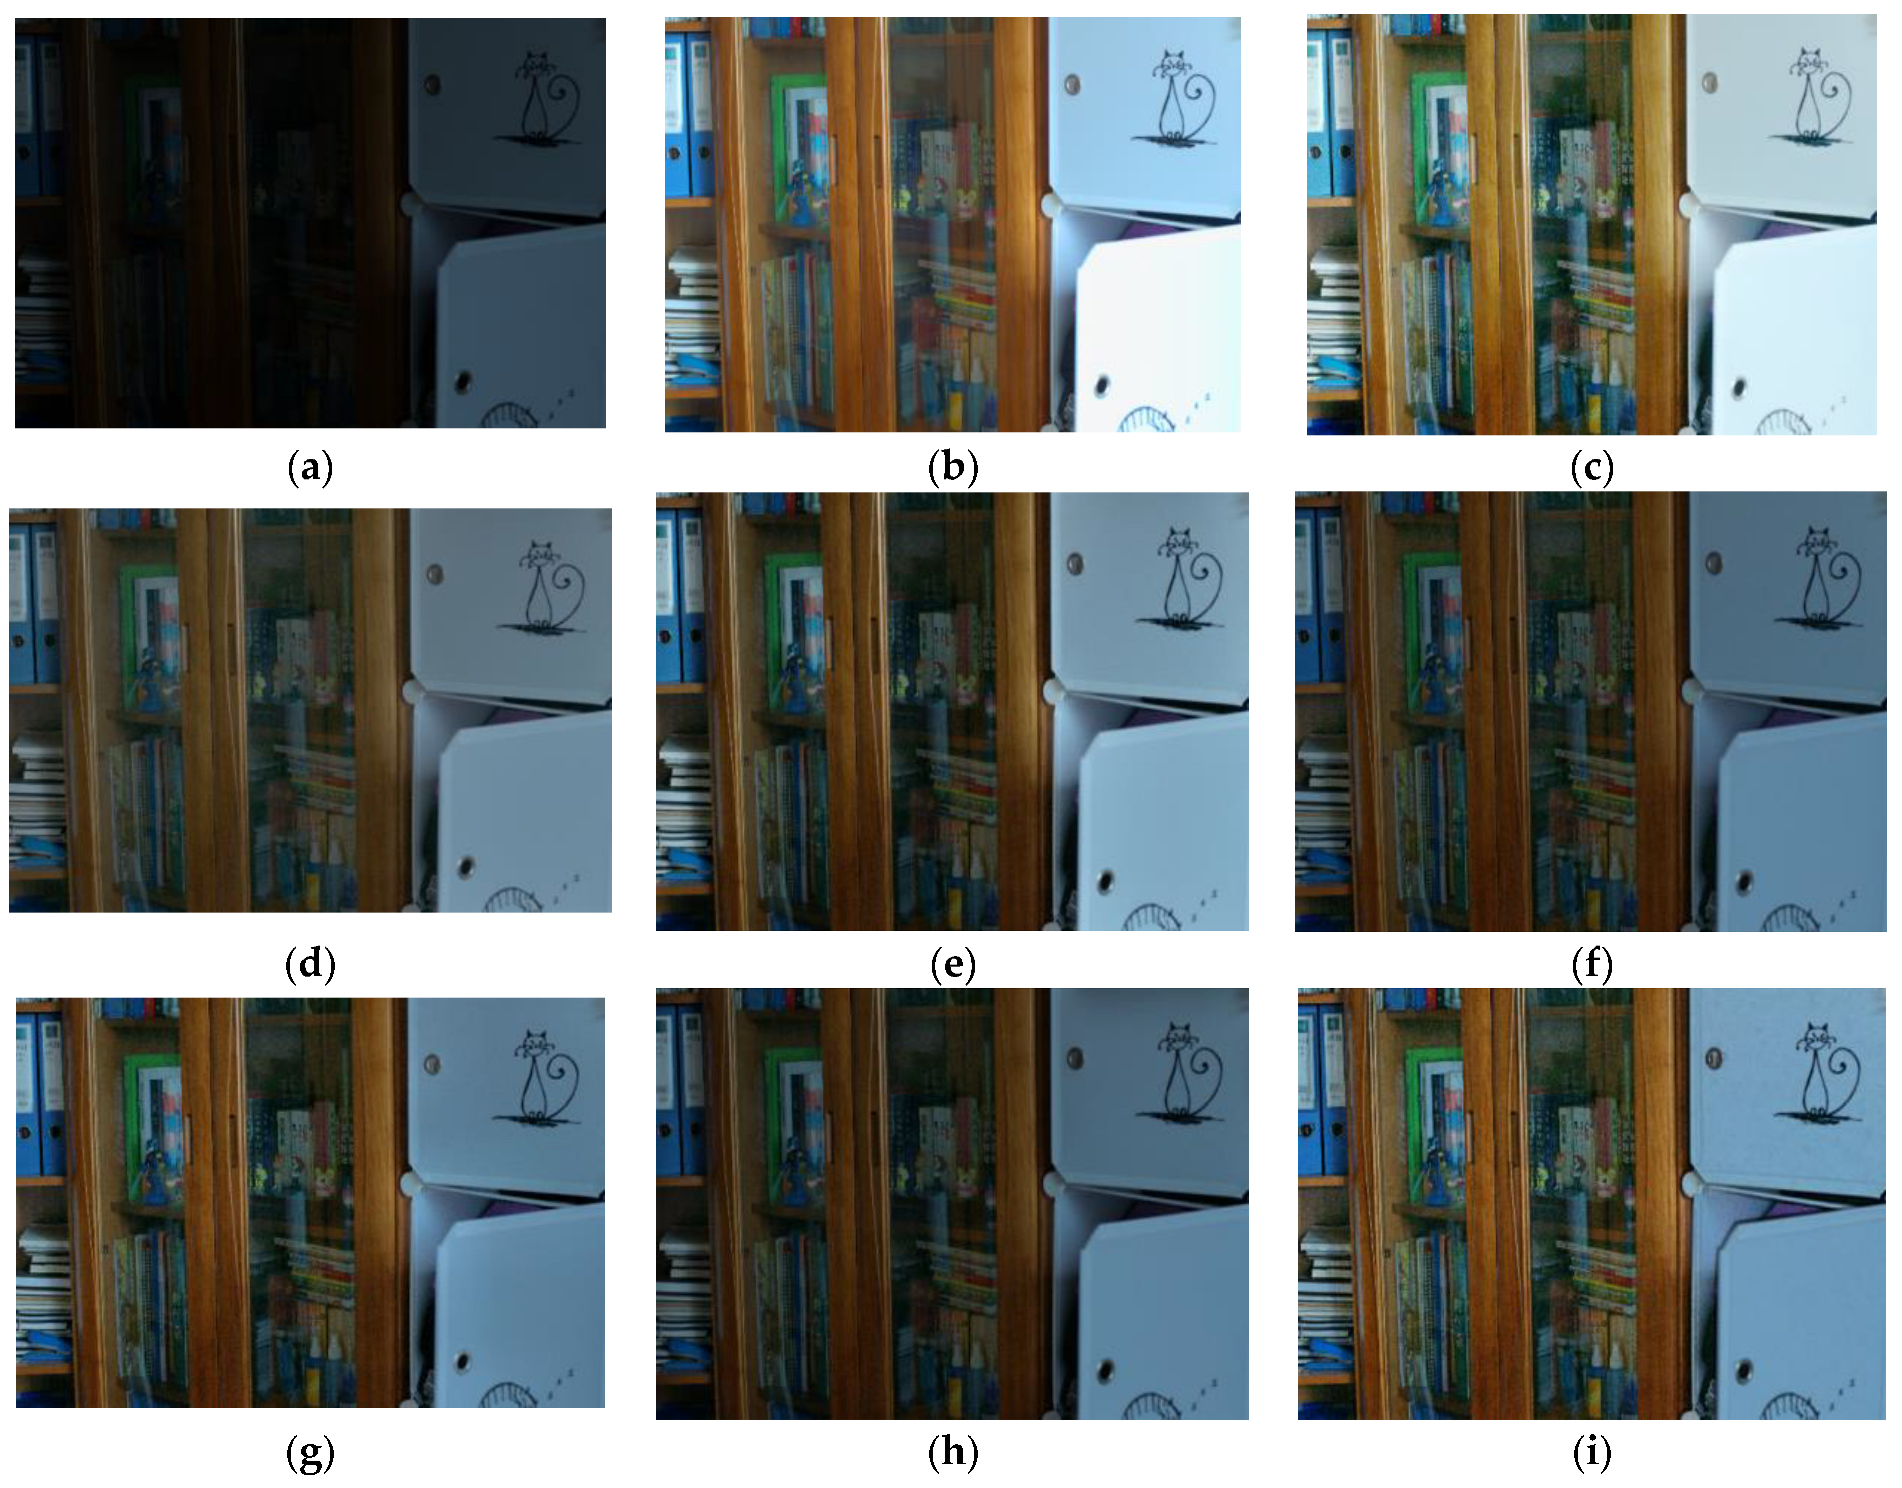
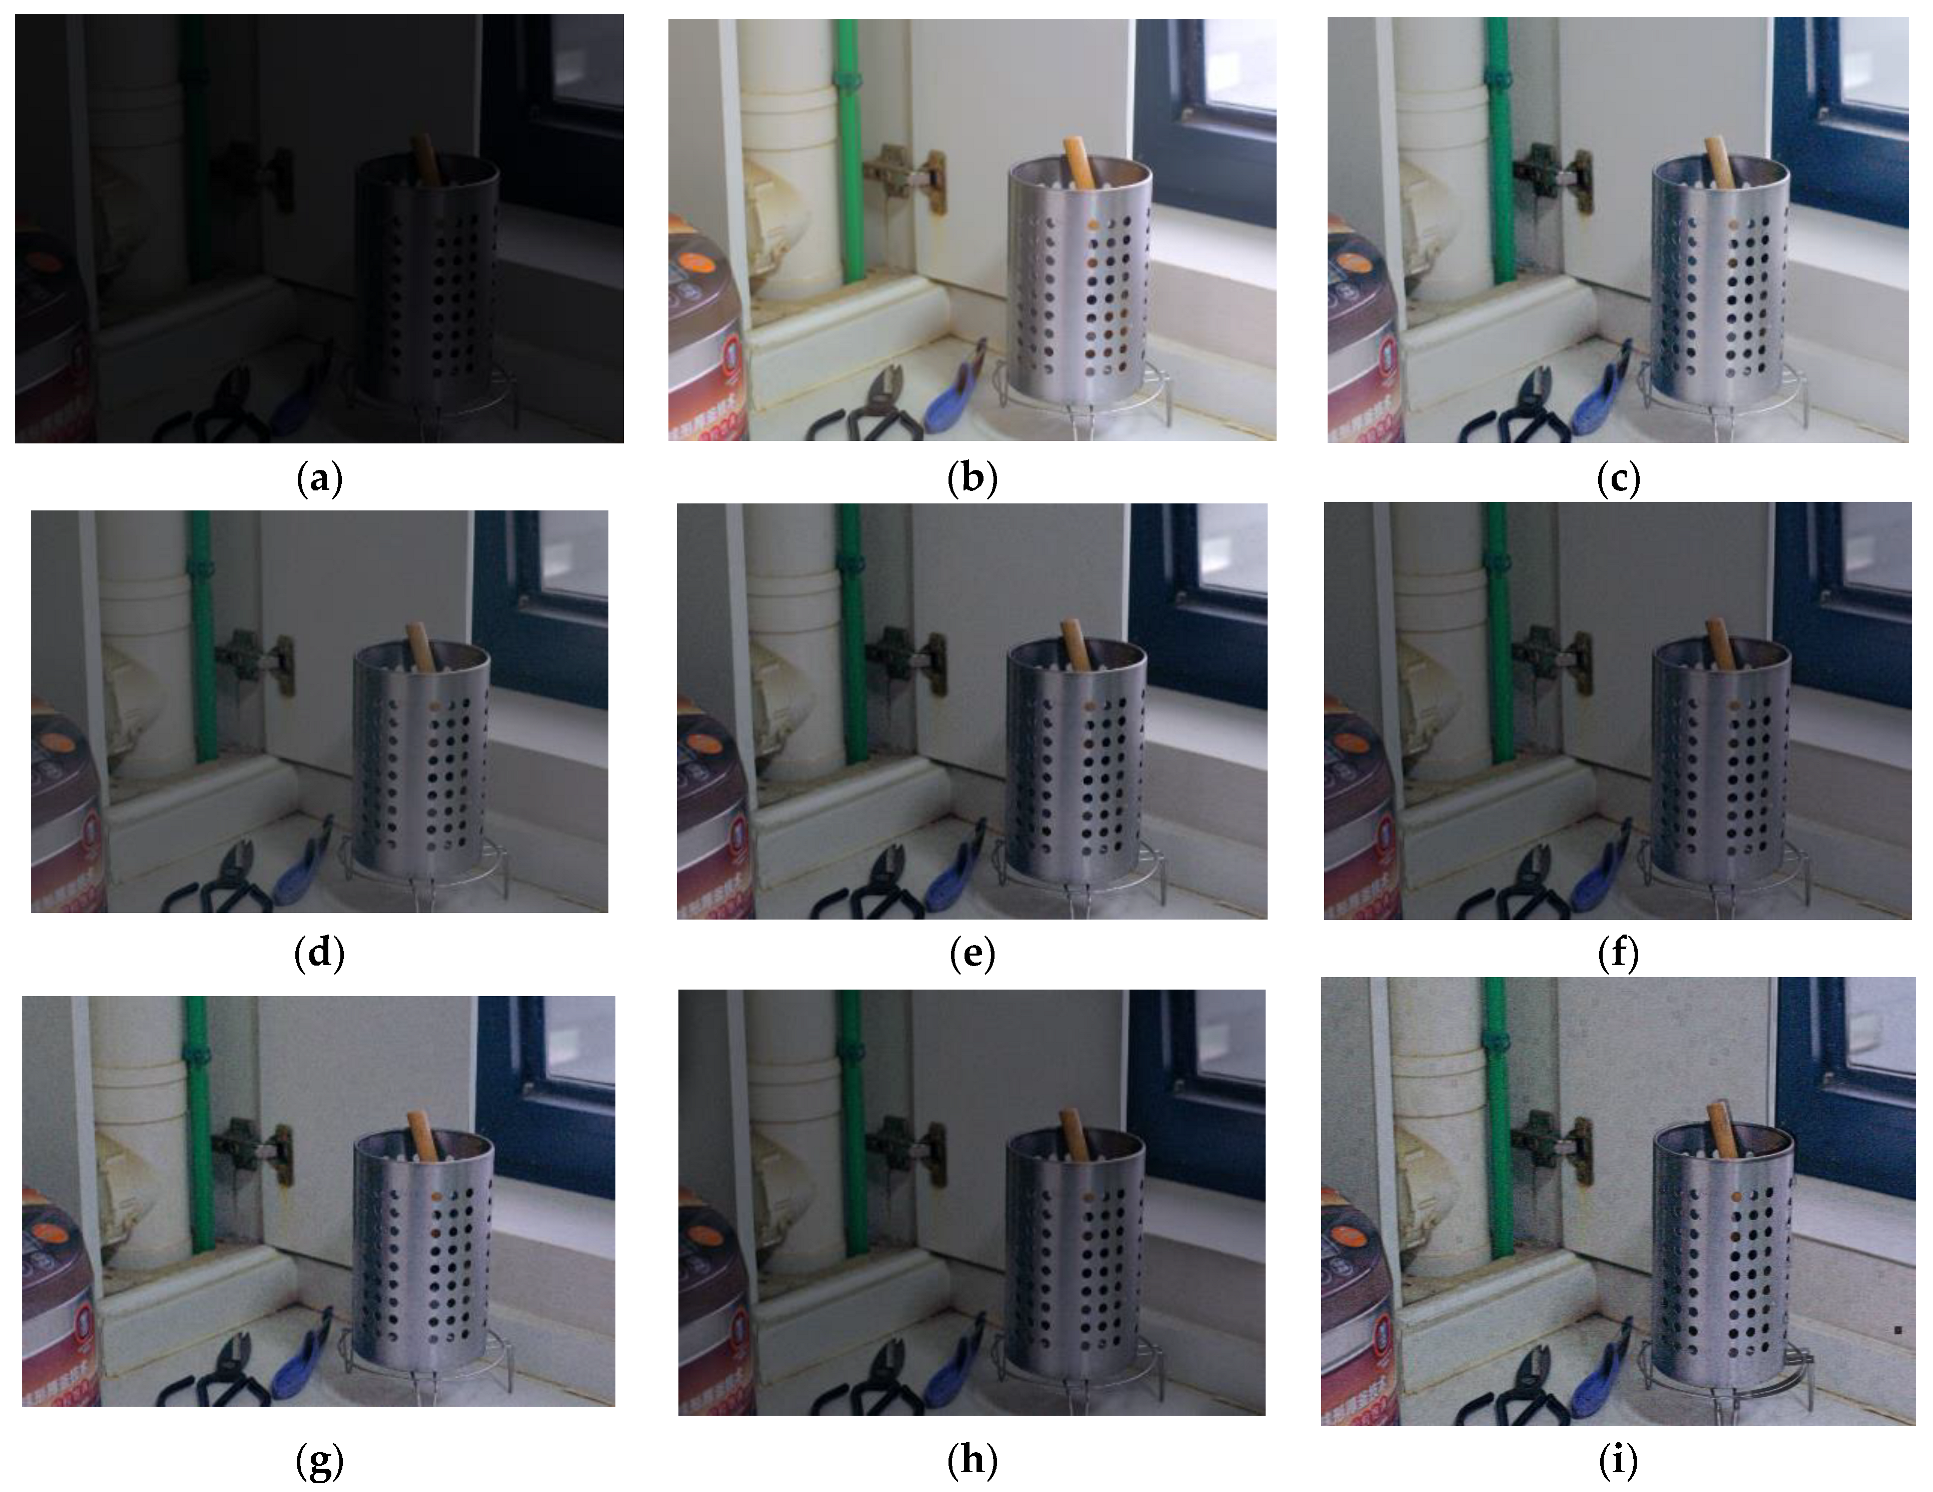
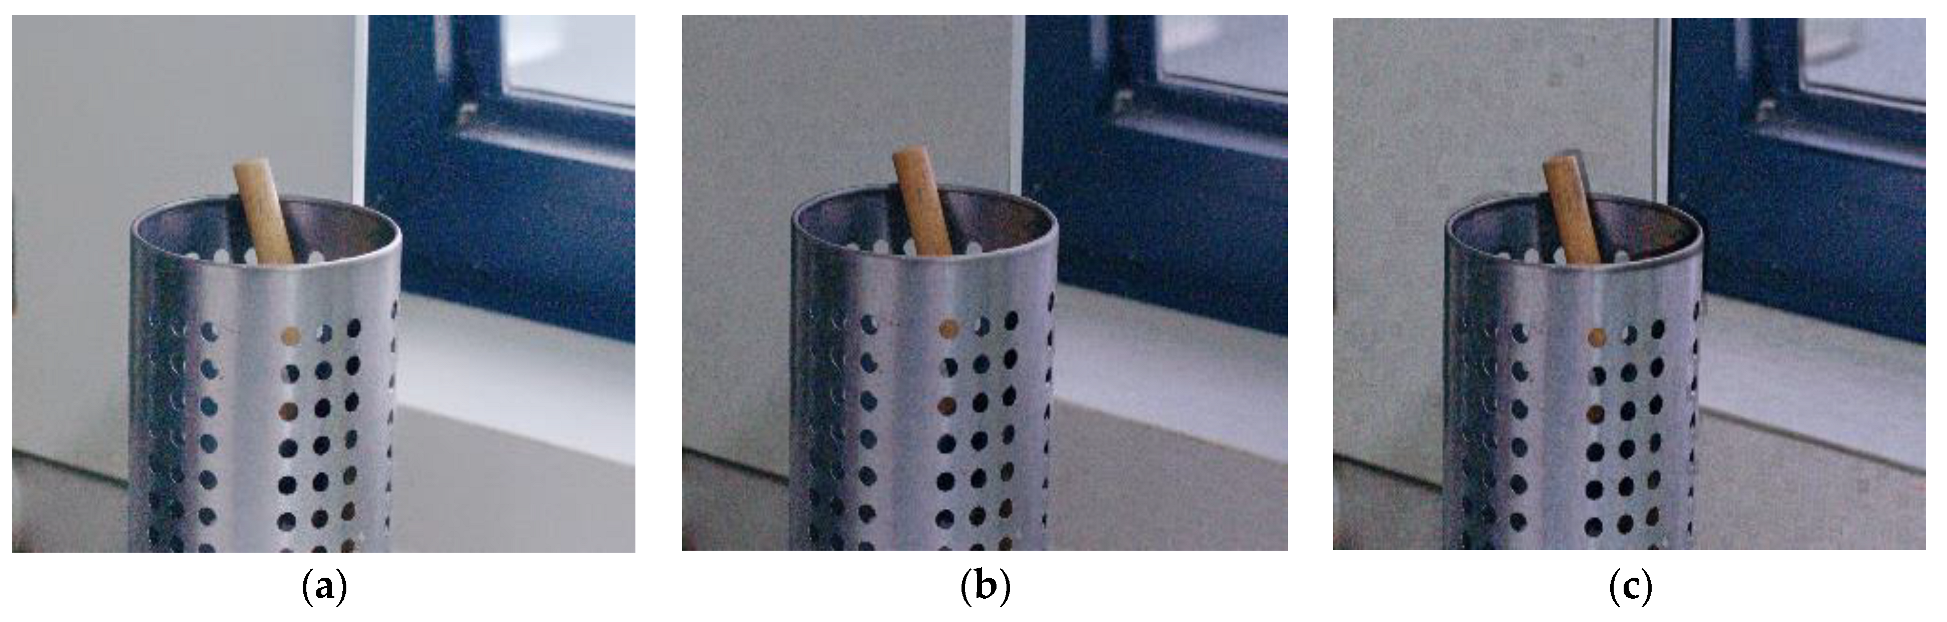
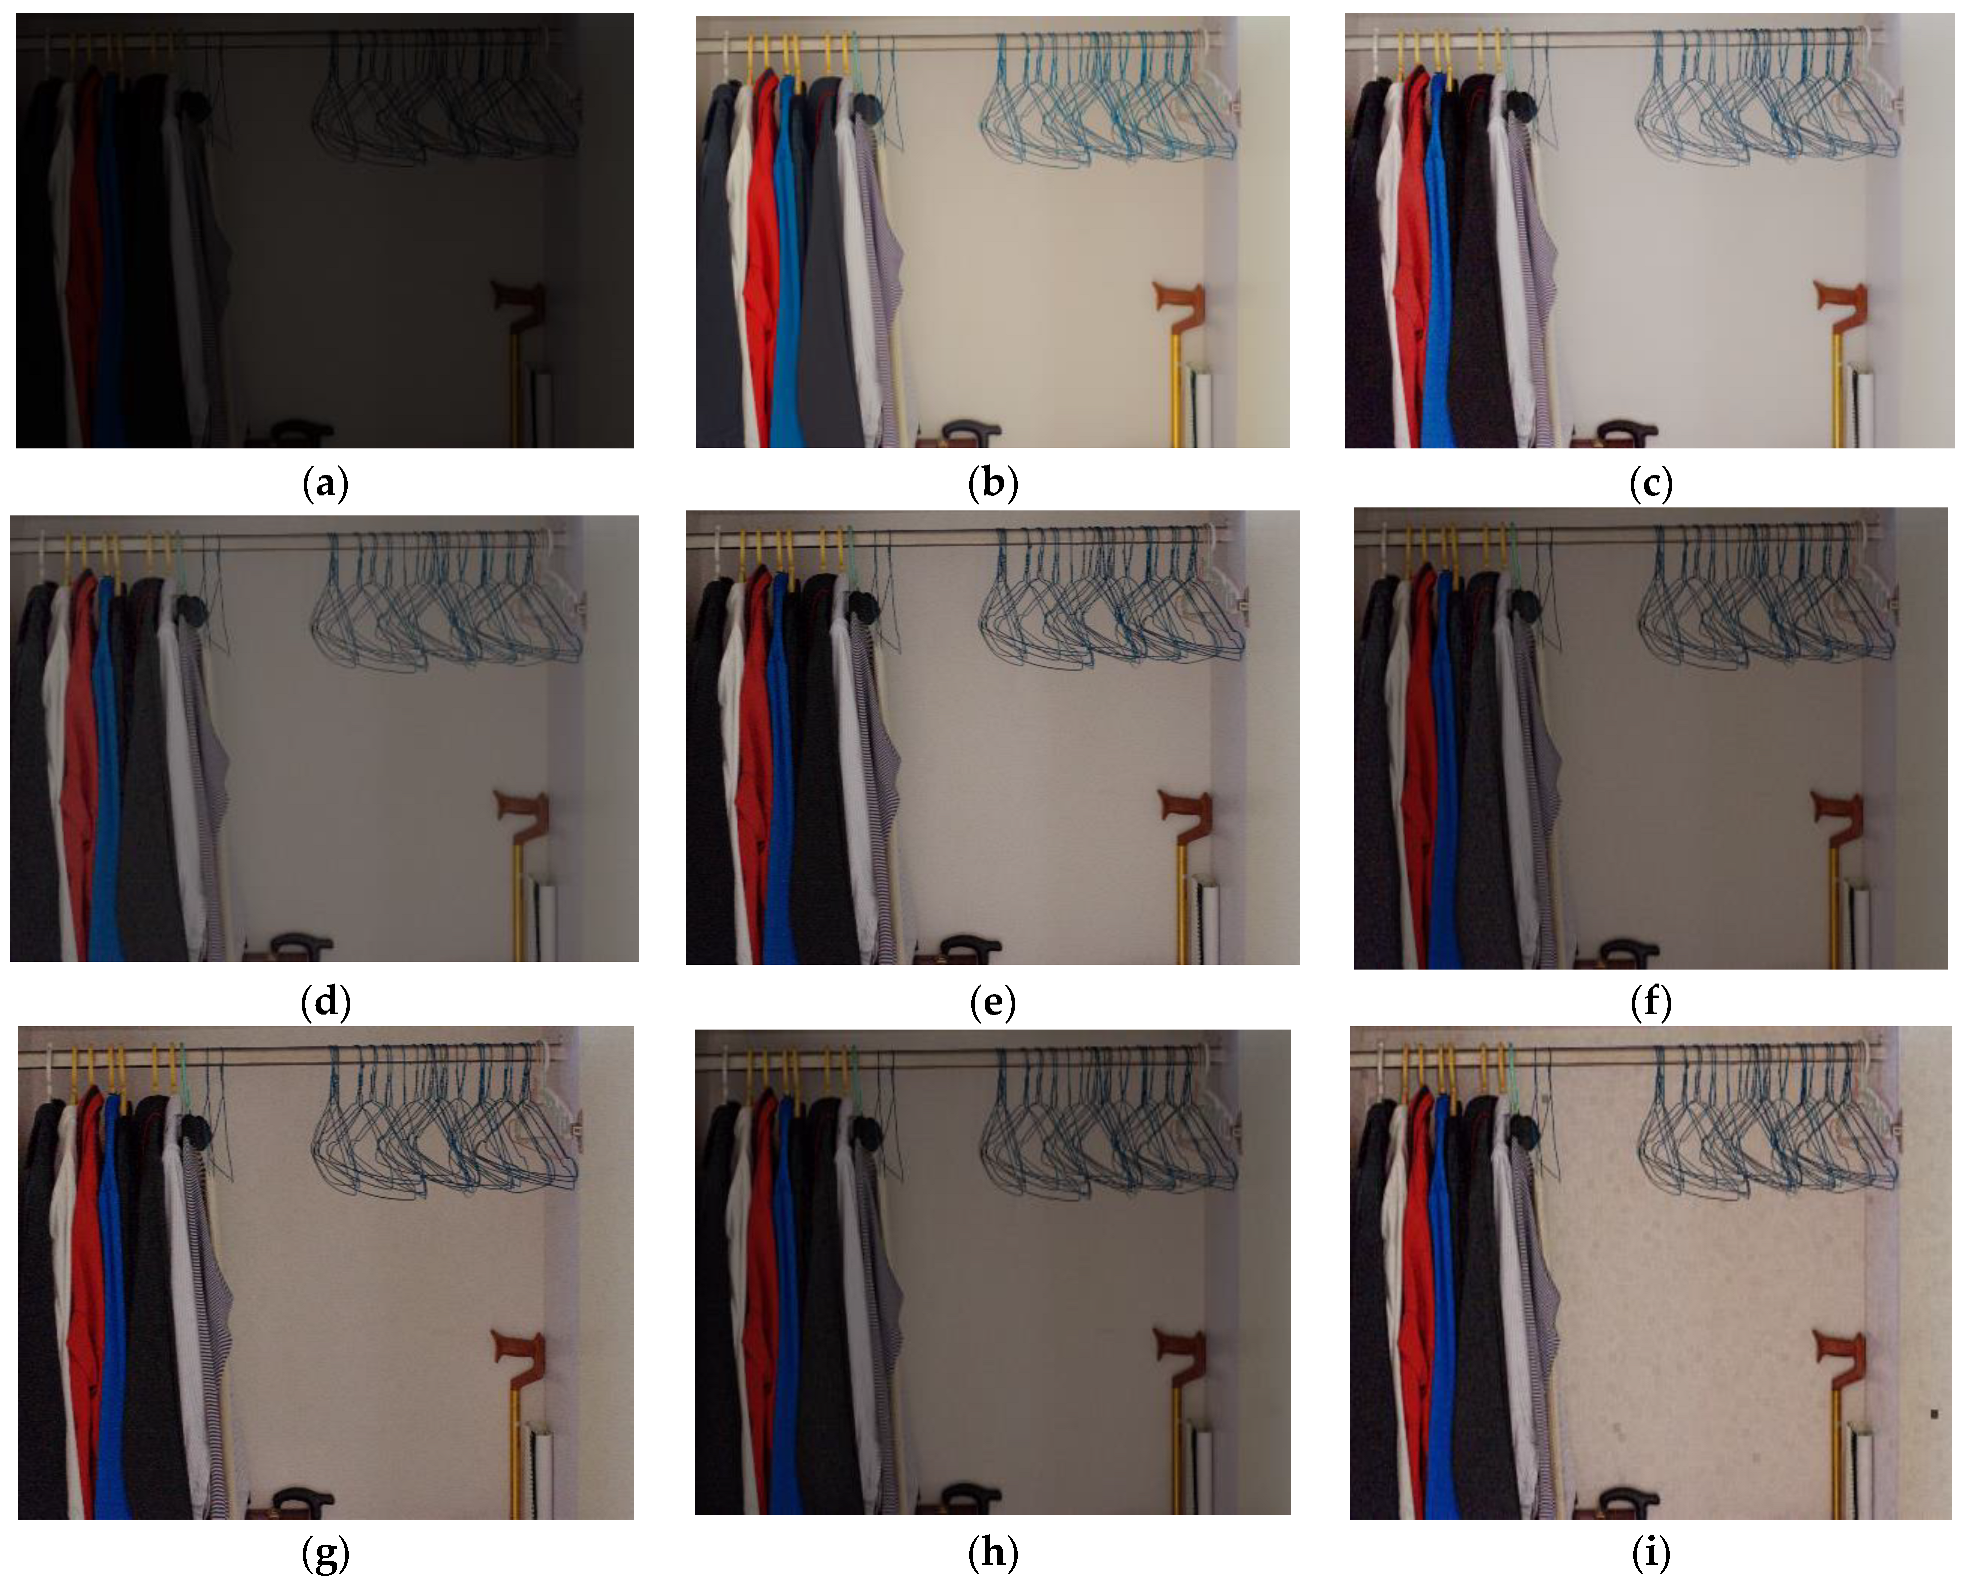
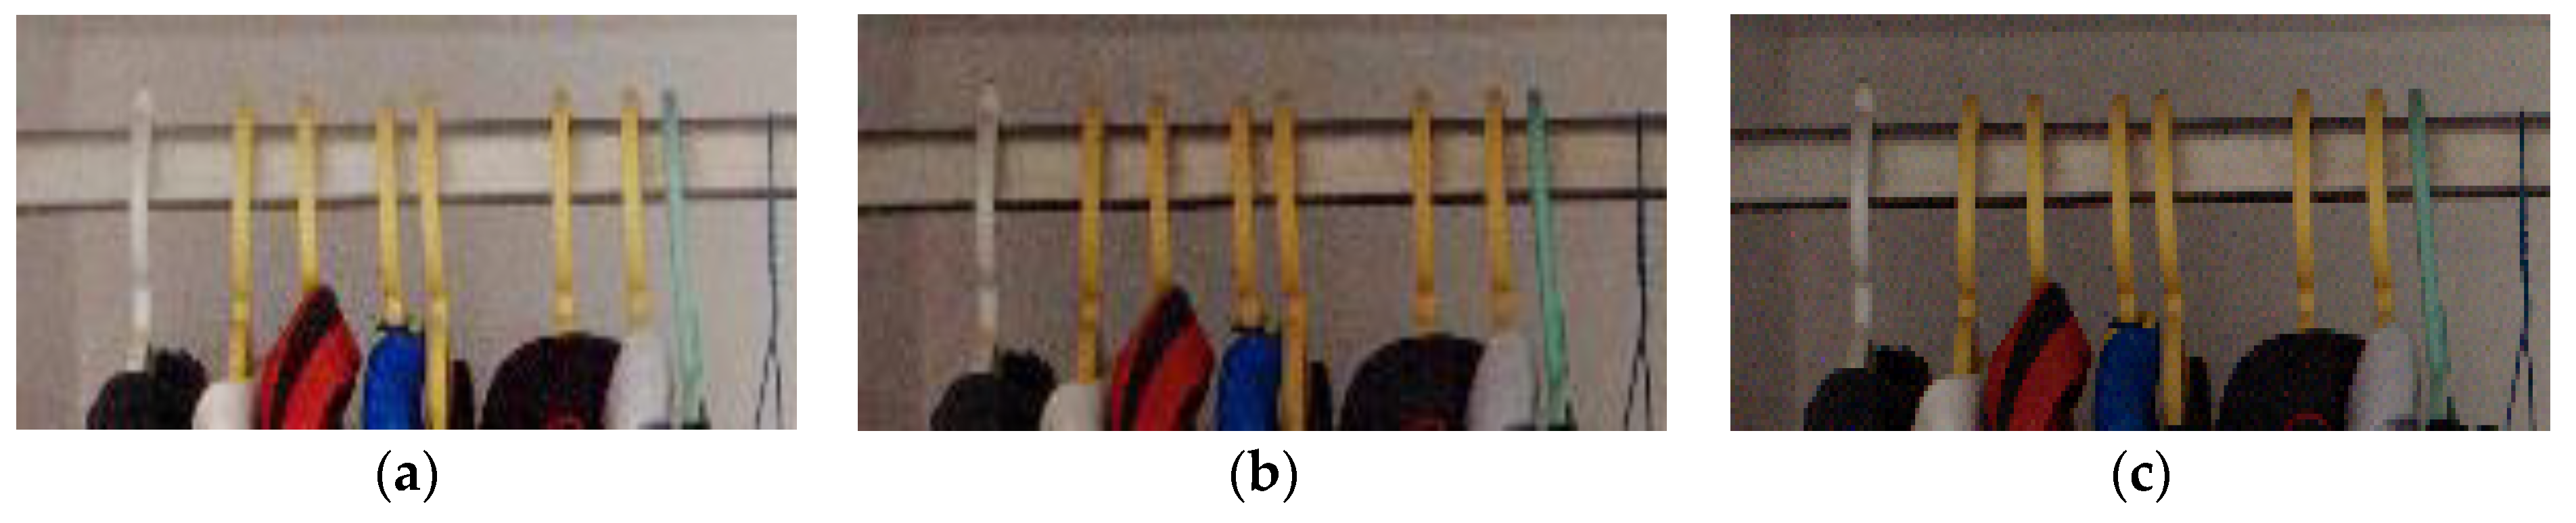
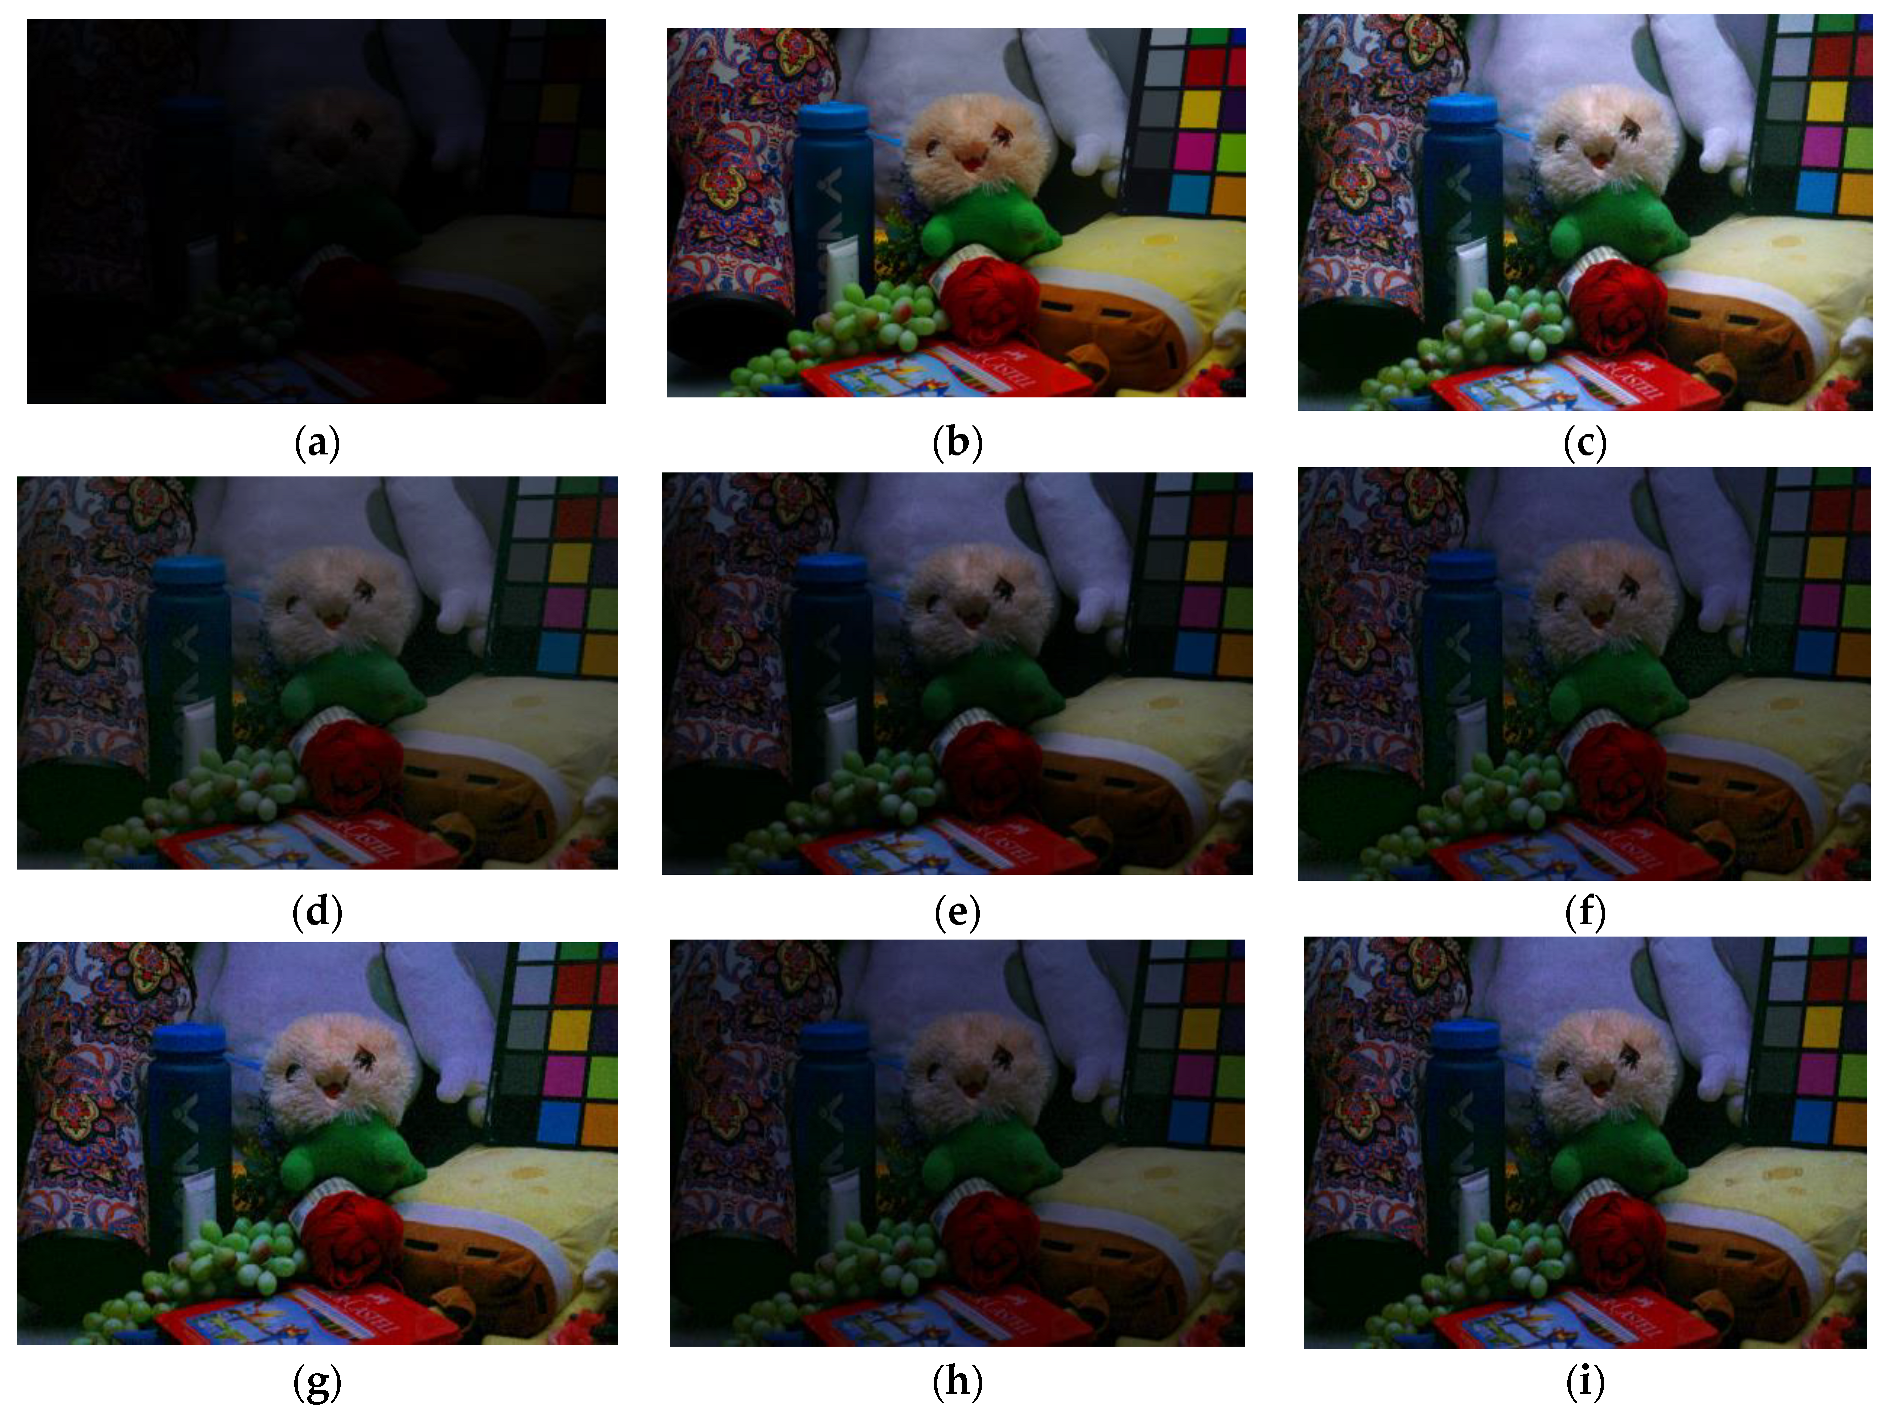
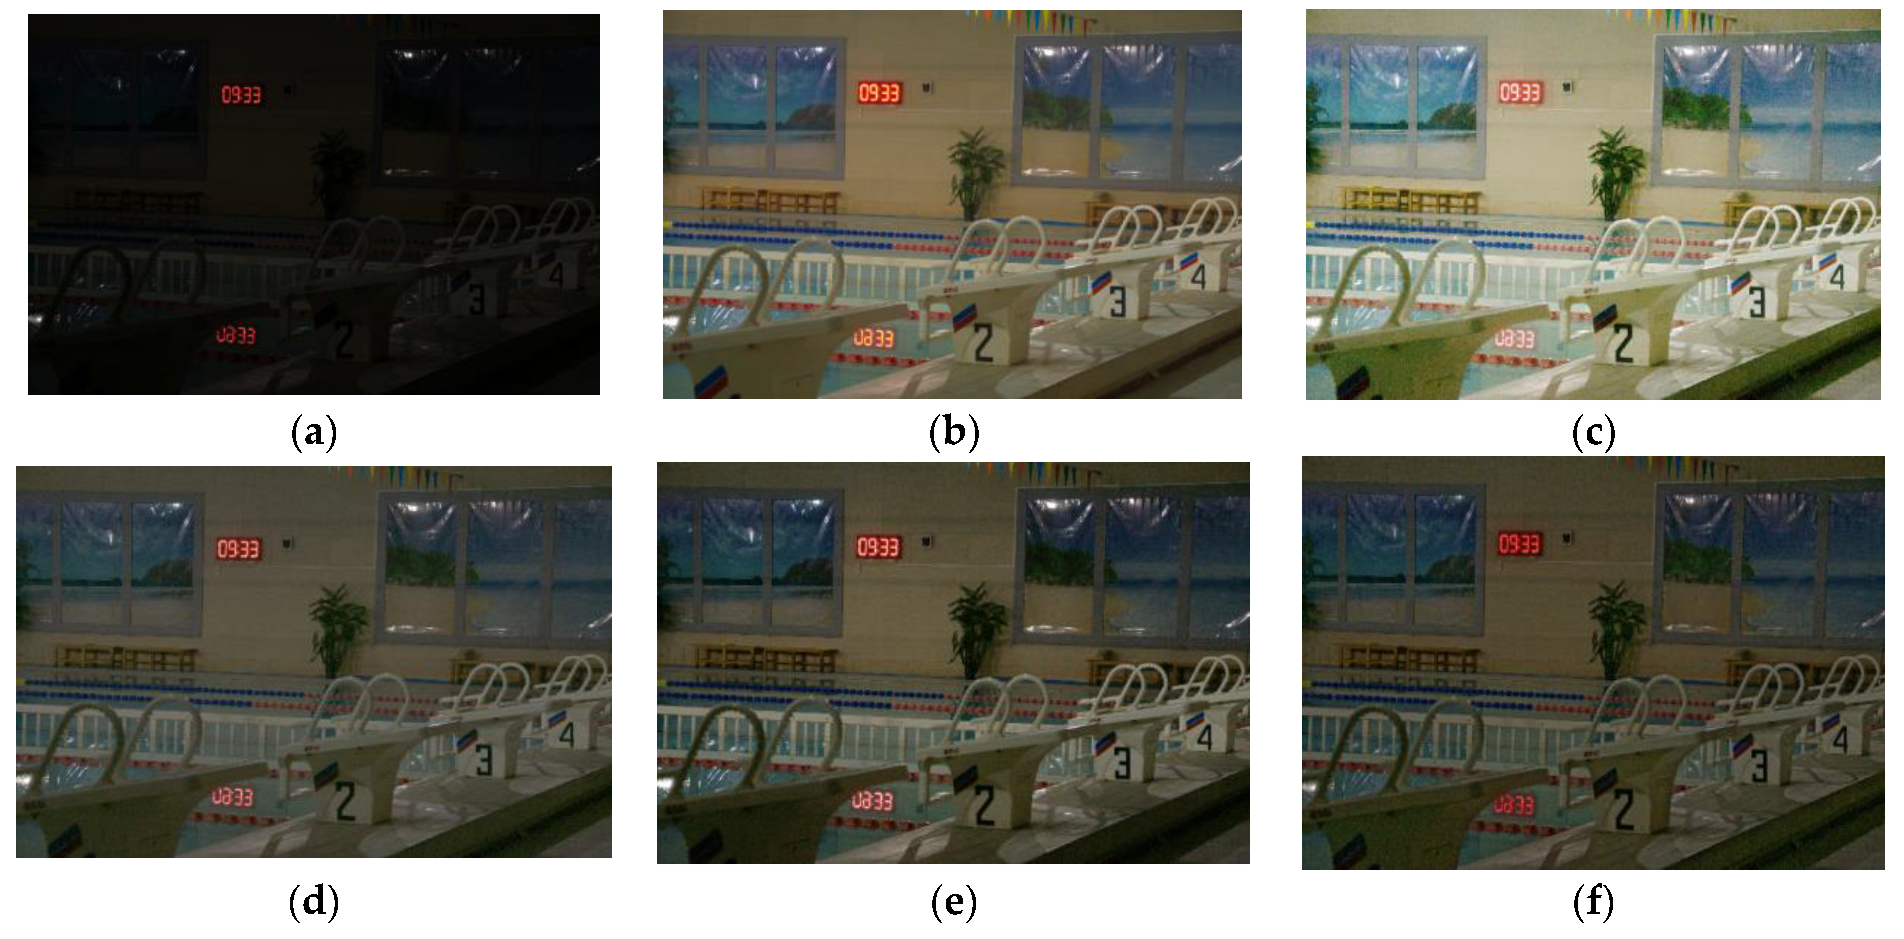
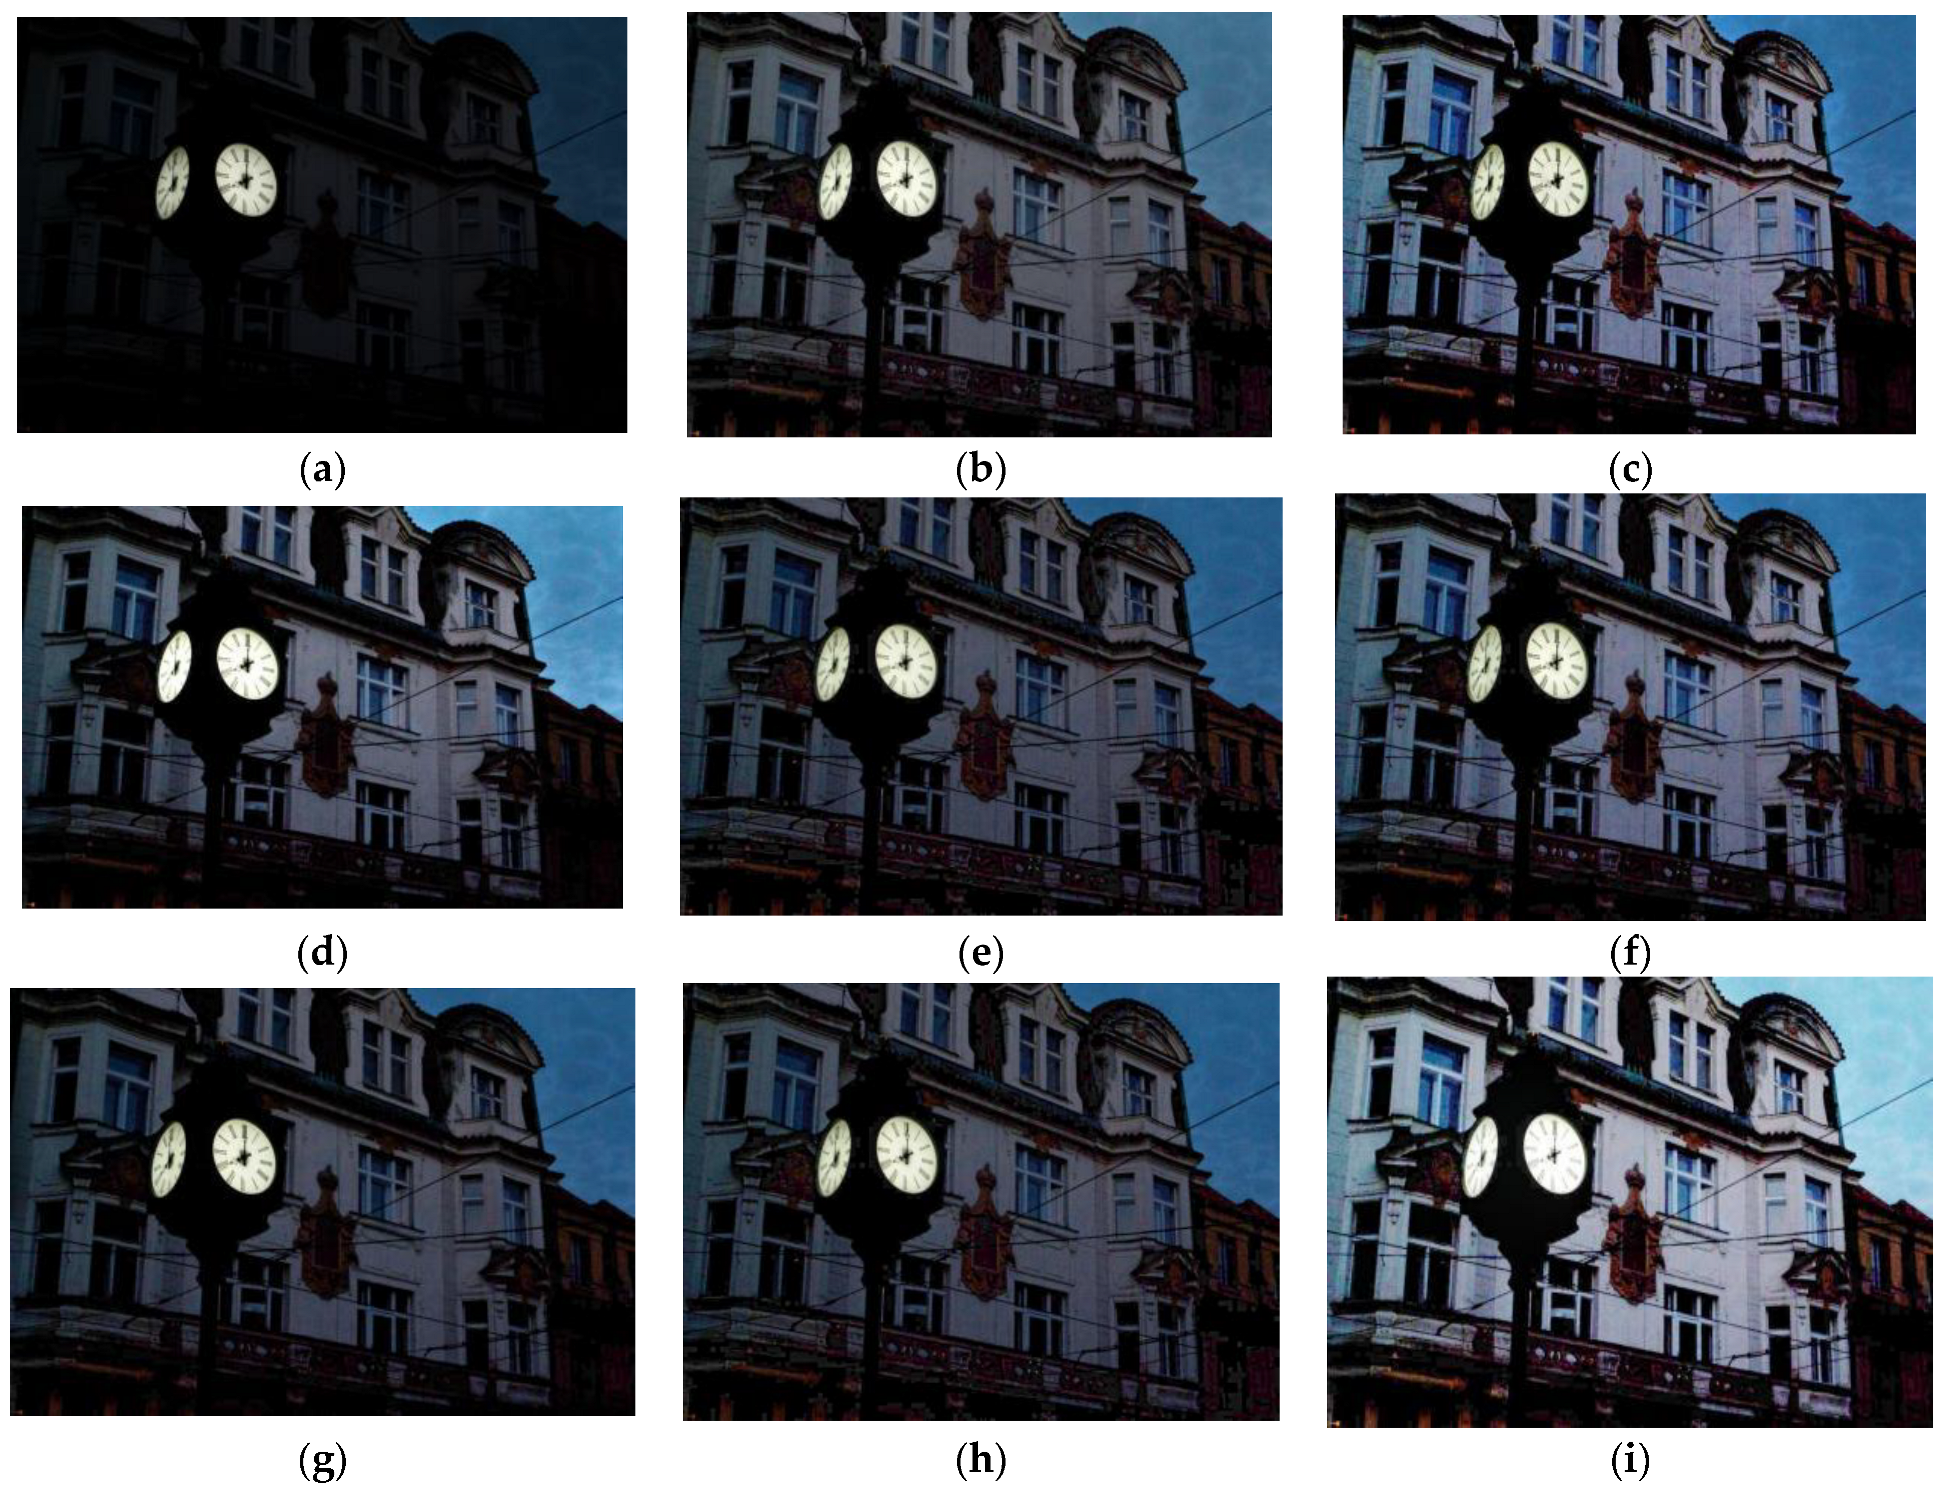
3.2.1. Processing Extremely Dark Images

The algorithm proposed in this paper focuses on very dark images. Firstly, a very dark image with a reference is selected for qualitative and quantitative analysis, and six other low-illumination image enhancement algorithms are compared: fusion-based low-light enhancement algorithms, including BIEMF [22] and MF [16]; the algorithm for the simultaneous use of reflection and illumination estimation—SRIE [9]; a camera response model (CRM)-based algorithm—LECARM [23]; an algorithm based on bright-pass bilateral filtering—BPBF [21]; and a fast and efficient low-light video enhancement method—Dong [7]. Figure 3, Figure 4, Figure 5, Figure 6, Figure 7, Figure 8, Figure 9 and Figure 10 show the results of the processing of the extremely dark images using different algorithms, including the input images as well as the standard reference images.
In Figure 4, the algorithms of BIMEF [22], LECARM [23], BPBF [21], MF [16], and SRIE [9] all fail to cause the image to be well exposed, while Dong’s algorithm [7] achieves a better exposure, but the processed image looks more like a painting. In contrast, the algorithm presented in this paper processes the image with good exposure, which is reflected especially in the white door that is open.
The same situation appears in Figure 5, where the image is darker overall, especially in the SRIE [9]-processed image (Figure 5h). Additionally, the details of the results of MF [16] (Figure 5g), Dong [7] (Figure 5i) and the algorithm presented in this paper (Figure 5c) are enlarged. As shown in Figure 6, the enlarged image details reflect the noise of the results of MF [16] and Dong [7], and the more satisfactory visual effect of the algorithm presented in this paper results in the removal of noise.
In addition to the same darker lightness and noise as the above figure, in Figure 8, we zoom in on the details of MF [16] results (Figure 8b) and the LECARM [23] result (Figure 8c) to compare them with the results obtained using the algorithm presented in this paper (Figure 8a). The zoomed-in detailed image reflects that the LECARM [23] and MF [16] result images have heavier shadows above the collar and blurring at the edge textures (e.g., green hanger), while this paper’s algorithm can significantly increase the local lightness of the image and keep the edges, and has better visual effects at that level of detail.
In Figure 9, the color distortion problem is illustrated by comparing the reference image (Figure 9b) with the color of the “white toy” after processing using the algorithm in Figure 9.
In addition to the small scenes above, we widened the scene range and processed Figure 10a using different algorithms. Compared to other methods, the algorithm proposed in this paper has better results at improving the overall and local lightness of the image, eliminating noise, maintaining edge details, and preventing excessive color distortion.
Since image evaluation is closely related to human visual perception, it is difficult to find a universal metric for quantifying the quality of enhanced images. In general, image quality assessment (IQA) can be divided into fully referenced and unreferenced. For quantitative evaluation of images with standard reference and real images, we use full reference IQA and no reference IQA in this research. For reference IQA, we employ peak signal-to-noise ratio (PSNR), structural similarity (SSIM) and the patch-based contrast quality index (PCQI) [35] to evaluate the quality of the enhanced image on the basis of the reference image. For the reference-free IQA, we employ average gradient (AG) [36], figure Definition (FD), spatial frequency (SF) [37], edge strength (EI) and Shannon (SH) as evaluation criteria.
For the extremely dark images with references, we selected ten to calculate their PSNR, SSIM, PCQI, AG, EI, FD, SF, and SH, and took the average of the evaluation indexes of these ten images. As shown in Figure 11, it can be seen that the algorithm proposed in this paper has the highest performance in all eight metrics, which indicates that the images enhanced using the algorithm proposed in this paper have the least distortion and the best appearance.

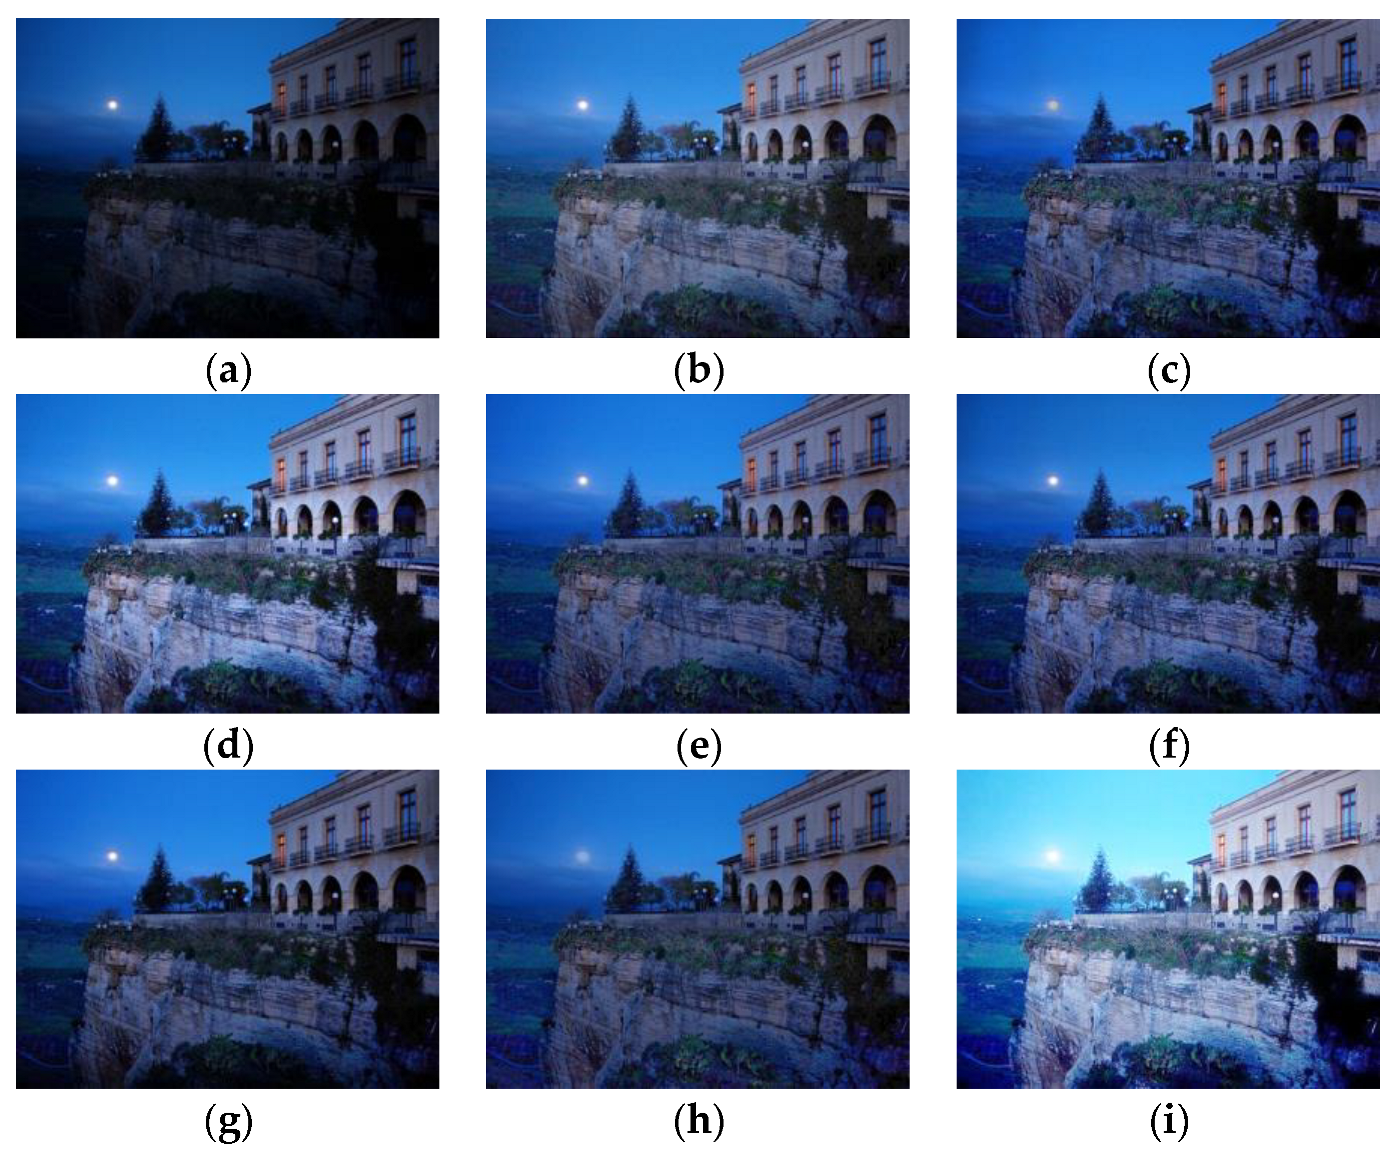
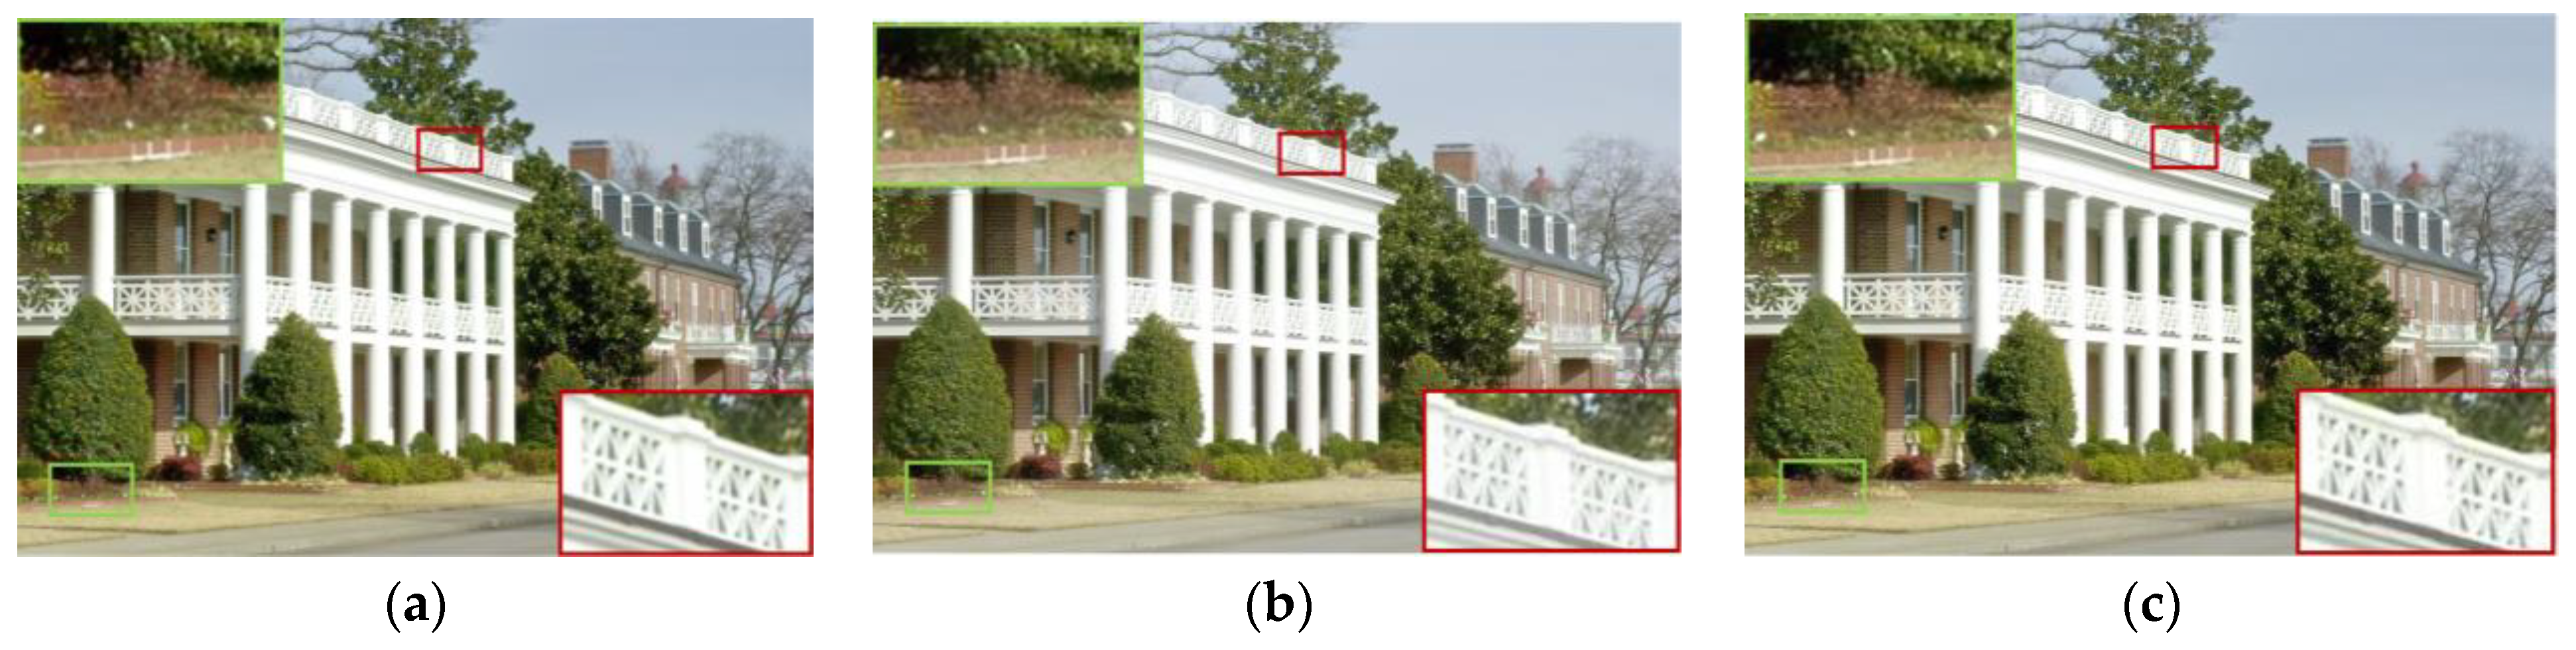
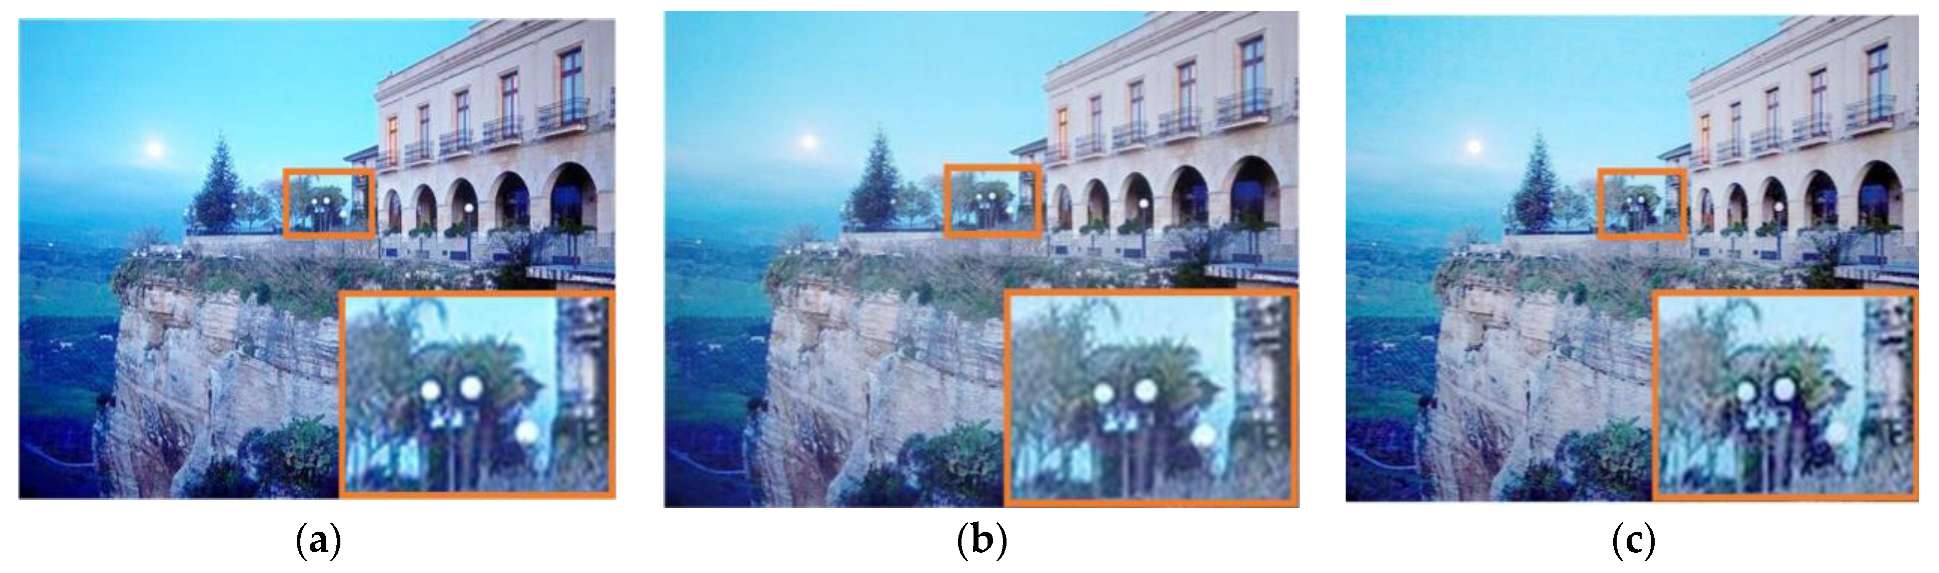
3.2.2. Processing Low-Light Natural Images

In this paper, in order to demonstrate the robustness of the algorithm when processing low-illumination images, we select three natural non-standard low-illumination images and process those three-low illumination images “moon night”, “house” and “clock” using different algorithms—BIMEF [22], MF [16], SRIE [9], LECARM [23]. BPBF [21], NPE [8] and RRM [10]; the processing results are shown in Figure 12, Figure 13, Figure 14 and Figure 15. Subjectively, it can be seen that the algorithm in this paper can result in the image receiving better exposure and the edge details being refined, which is an excellent result. Next, we analyze the images processed using different algorithms using no-reference IQA, thus obtaining Table 1, Table 2 and Table 3, for a more intuitive comparison of the IQA of each algorithm, the best values are bolded. As can be seen from Figure 12, Figure 13, Figure 14 and Figure 15, the algorithm in this paper can improve the image lightness effectively while preserving the details of the source image. As shown in the tables, when compared to other algorithms, this paper’s algorithm has higher values in the objective evaluation index, indicating that the enhanced image presented in this paper has the best appearance and less distortion, reflecting the algorithm’s strong robustness in processing low-illumination images with different degrees of illumination. In particular, however, the LECARM [23] algorithm achieved higher values for the edge intensity EI evaluation metric in the evaluation metric of the “house” image, as explained in Figure 14. The LECARM [23] algorithm is more detailed when it comes to edge processing than the algorithm presented in this paper, and this is something that needs to be enhanced in future research.

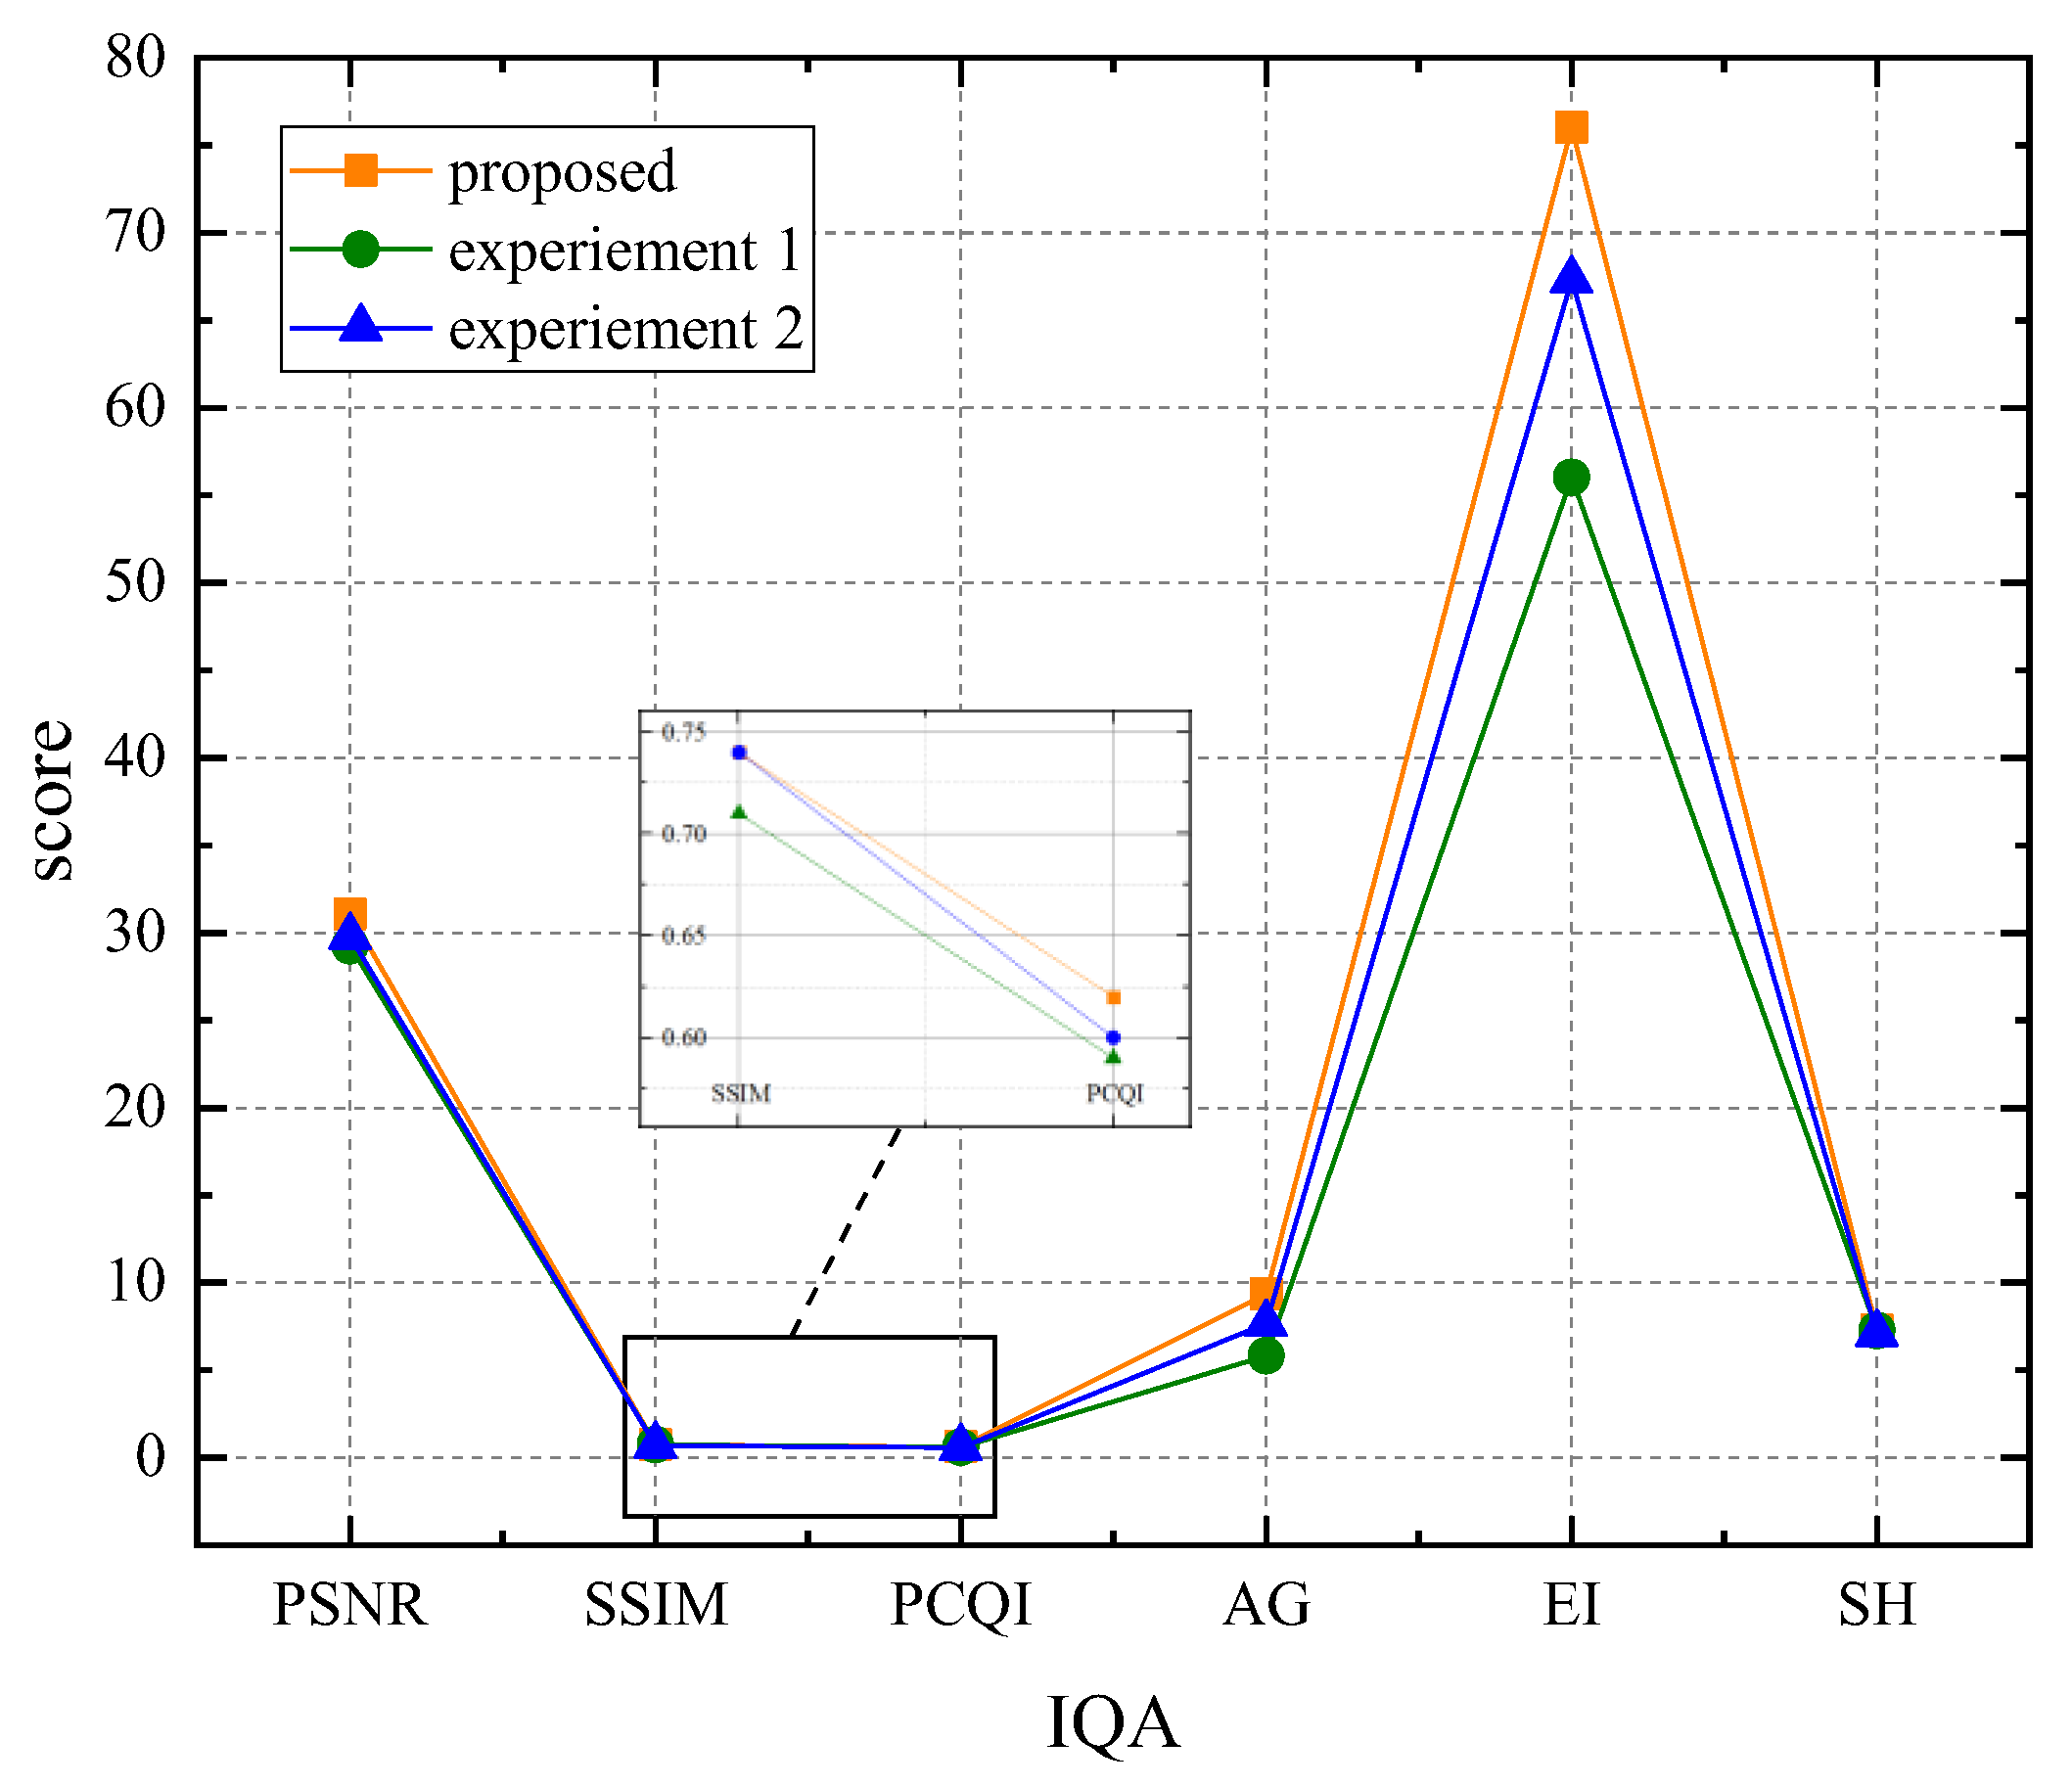
3.3. Ablation Experiment

In order to further verify the importance of introducing two weight functions Wl (luminance weight) and Wg (gradient weight), we select different luminance images for the ablation experiment and assess the importance of the two weights in the fusion process through subjective evaluation as well as objective evaluation. Ablation experiment I carries out image fusion using only the luminance weight Wl, while the ablation experiment II carries out image fusion using only the gradient weight Wg. The experimental results are shown in Figure 16 and Figure 17. In the “house” image with more textures, comparing Figure 16a,b, the blurring of the edge textures (in the red box) due to the loss of gradient weights Wl in Figure 16b can be clearly seen; in addition, comparing Figure 16a,c, in terms of contrast of luminance, the visual effect of weak local contrast (in the green box) due to the lack of luminance function can be observed in Figure 16c.
Since the changes in luminance and local contrast are not clearly shown in Figure 16, we employed Figure 17 to further illustrate the importance of luminance weighting (yellow box). It can be seen that the luminance of the streetlight in Figure 17c was significantly reduced, and is very similar to the color of the surrounding trees, reflecting the problem of low local contrast due to the lack of luminance weights Wl.
In the following, we quantify the importance of luminance weights Wl and gradient weights Wg by objective evaluation indexes. We use nine images and calculate the values of PSNR, SSIM, PCQI, EI, AG, and SH, and take the average value. As shown in Table 4 and Figure 18, Experiment I is better than Experiment II in terms of PCQI and SSIM, which contain indicators for evaluating image signal strength, objectively reflecting the effect of luminance weight Wl on the improvement of overall image lightness and local contrast enhancement. Conversely, Experiment II outperforms Experiment I in evaluating the AG and EI of the edge gradients, objectively reflecting the importance of the gradient weights Wg for edge detail processing.

3.4. Application in Electric Power Equipment

As the monitoring devices on power equipment such as lines and insulators are frequently affected by environmental factors such as rain, fog, darkness, and so on, the monitoring devices cannot alert the staff and equipment in time when the power equipment fails, which is especially common in dark environments. In this regard, we apply the algorithm proposed in this paper to the detection of power equipment such as transmission lines and insulators in dark and uneven lighting scenarios, and the processing results are shown in Figure 19.
As shown in Figure 19, when transmission lines, insulators, substations, and other power equipment are dark, as illustrated in Figure 19a,b, the technique in this study is able to successfully improve image lightness while recovering related detail information. Furthermore, as demonstrated in Figure 19c,d, the algorithm described in this research is also relevant to uneven illumination settings, demonstrating the program’s robustness in coping with dark conditions. The results in Figure 18 show that the method described in this paper is effective at processing electrical equipment maps under surveillance photography in dark conditions and recovering the related detailed information while improving the image lightness.

4. Conclusions

In this paper, we proposed a low-illumination image enhancement method for non-uniformly illuminated, extremely dark scenes. Compared with most Retinex algorithms and image fusion algorithms, the algorithm in this paper had better robustness under different illumination conditions, demonstrating practical engineering implications in computer vision applications. The algorithm in this paper used luminance weights and gradient weights based on the overall image lightness to fuse enhanced images with different exposures to illuminate dark areas while ensuring that the bright areas were not over-enhanced, and that the details of potential images were properly revealed. In addition, the experiments showed that the algorithm proposed in this paper outperformed most conventional low-illumination algorithms, probably because the algorithm in this paper is applicable to a wider range of scenes, and the enhanced image can both enhance the contrast and capture enough image information. Finally, we applied the algorithm to the online monitoring image of power equipment such as lines and insulators under dark conditions, and effectively recovered picture lightness as well as detail information.

Author Contributions

Conceptualization, W.Z. and Y.A.; methodology, X.Y.; software, C.J.; validation, W.Z. and C.J.; formal analysis, W.Z.; investigation, W.Z. and C.D.; resources, C.D.; data curation, W.Z.; writing—original draft preparation, W.Z.; writing—review and editing, Y.A.; visualization and supervision, X.Y.; project administration, W.Z.; funding acquisition, Y.A. All authors have read and agreed to the published version of the manuscript.

Funding

This research received no external funding.

Institutional Review Board Statement

Not applicable.

Informed Consent Statement

Not applicable.

Data Availability Statement

Not applicable.

Acknowledgments

The authors would like to express sincere thanks to their colleague from transmission line operation and maintenance, State Grid Shandong Electric Power Company ZiBo power supply company.

Conflicts of Interest

The authors declare no conflict of interest.

References

  1. Yudita, S.I.; Mantoro, T.; Ayu, M.A. Deep Face Recognition for Imperfect Human Face Images on Social Media using the CNN Method. In Proceedings of the 4th International Conference of Computer and Informatics Engineering, IC2IE, Beijing, China, 23–24 August 2021; pp. 412–417. [Google Scholar]
  2. Paiva, S.; Santos, D.; Rossetti, R.J.F. A Methodological Approach for Inferring Urban Indicators Through Computer Vision. In Proceedings of the 4th IEEE International Smart Cities Conference, ISC2, Kansas, MO, USA, 16–19 September 2018; pp. 1–7. [Google Scholar]
  3. Sun, Y.; Zhai, X.; He, Y.; Sun, Y.; Xing, Y.; Li, L. Research and Development of Integral Test System for Transformer Calibrator Based on Machine Vision and Servo Control. In Proceedings of the 2nd IEEE Conference on Energy Internet and Energy System Integration, EI2, Beijing, China, 21 October 2018; pp. 1–5. [Google Scholar]
  4. Sharma, M.; Sarma, K.K.; Mastorakis, N. AE and SAE Based Aircraft Image Denoising. In Proceedings of the 25th International Conference on Mathematics and Computers in Sciences and Industry, MCSI, Confu, Greece, 25–27 August 2018; pp. 81–85. [Google Scholar]
  5. Park, S.; Kim, K.; Yu, S.; Paik, J. Contrast Enhancement for Low-light Image Enhancement: A Survey. IEEE Trans. Smart Process. Comput. 2018, 13, 36–48. [Google Scholar] [CrossRef]
  6. Jobson, D.J.; Rahman, Z.; Woodell, G.A. A multiscale retinex for bridging the gap between color images and the human observation of scenes. IEEE Trans. Image Process. 1997, 6, 965–976. [Google Scholar] [CrossRef] [PubMed] [Green Version]
  7. Dong, X.; Wang, G.; Pang, Y.; Li, W.; Wen, J.; Meng, W.; Lu, Y. Fast Efficient Algorithm for Enhancement of Low Lighting Video. In Proceedings of the IEEE International Conference on Multimedia and Expo, Barcelona, Spain, 11–15 July 2011; pp. 1–6. [Google Scholar]
  8. Wang, S.; Zheng, J.; Hu, H.-M.; Li, B. Naturalness preserved enhancement algorithm for non-uniform illumination images. IEEE Trans. Image Process. 2013, 22, 3538–3548. [Google Scholar] [CrossRef] [PubMed]
  9. Fu, X.; Zeng, D.; Huang, Y.; Zhang, X.; Ding, X. A Weighted Variational Model for Simultaneous Reflectance and Illumination Estimation. In Proceedings of the 2016 IEEE Conference on Computer Vision and Pattern Recognition, CVPR, Las Vegas, NV, USA, 26–30 June 2016; pp. 2782–2790. [Google Scholar]
  10. Li, M.; Liu, J.; Yang, W.; Sun, X.; Guo, Z. Structure-Revealing Low-Light Image Enhancement Via Robust Retinex Model. IEEE Trans. Image Process. 2018, 27, 2828–2841. [Google Scholar] [CrossRef]
  11. Wang, L.; Fu, G.; Jiang, Z.; Ju, G.; Men, A. Low-Light Image Enhancement with Attention and Multi-Level Feature Fusion. In Proceedings of the 5th IEEE International Conference on Multimedia & Expo Workshops, ICMEW, Shanghai, China, 8–12 July 2019; pp. 276–281. [Google Scholar]
  12. Le, S.-H.; Li, H. Fused logarithmic transform for contrast enhancement. Electron. Lett. 2008, 44, 19–20. [Google Scholar] [CrossRef]
  13. Yamakawa, M.; Sugita, Y. Image enhancement using Retinex and image fusion techniques. Electron. Commun. Jpn. 2018, 8, 52–62. [Google Scholar] [CrossRef]
  14. Wang, W.; Chen, Z.; Yuan, X.; Wu, X. Adaptive image enhancement method for correcting low-illumination images. Inf. Sci. 2019, 496, 25–41. [Google Scholar] [CrossRef]
  15. Celebi, A.T.; Duvar, R.; Urhan, O. Fuzzy fusion based high dynamic range imaging using adaptive histogram separation. IEEE Trans. Consum. Electron. 2015, 61, 119–127. [Google Scholar] [CrossRef]
  16. Fu, X.; Zeng, D.; Huang, Y.; Liao, Y.; Ding, X.; Paisley, J. A fusionbased enhancing method for weakly illuminated images. Signal Process. 2016, 129, 82–96. [Google Scholar] [CrossRef]
  17. Guo, X.; Li, Y.; Ling, H. LIME: Low-Light Image Enhancement via Illumination Map Estimation. IEEE Trans. Image Process. 2017, 26, 982–993. [Google Scholar] [CrossRef]
  18. Wang, S.; Luo, G. Naturalness Preserved Image Enhancement Using a priori Multi-Layer Lightness Statistics. IEEE Trans. Image process. 2018, 27, 938–948. [Google Scholar] [CrossRef]
  19. Ma, K.; Li, H.; Yong, H.; Wang, Z.; Meng, D.; Zhang, L. Robust multi-exposure image fusion: A structural patch decomposition approach. IEEE Trans. Image Process. 2017, 26, 2519–2532. [Google Scholar] [CrossRef]
  20. Ma, K.; Duanmu, Z.; Yeganeh, H.; Wang, Z. Multi-Exposure Image Fusion by Optimizing A Structural Similarity Index. IEEE Trans. Comput. Imaging. 2018, 4, 60–72. [Google Scholar] [CrossRef]
  21. Ghosh, S.; Chaudhury, K.N. Fast Bright-Pass Bilateral Filtering for Low-Light Enhancement. In Proceedings of the 26th International Conference on Image Processing, ICIP, Taipei, Taiwan, China, 22–25 September 2019; pp. 205–209. [Google Scholar]
  22. Ying, Z.; Ge, L.; Wen, G. A Bio-Inspired Multi-Exposure Fusion Framework for Low-light Image Enhancement. arXiv 2017, arXiv:1711.00591. [Google Scholar]
  23. Ren, Y.; Ying, Z.; Li, T.; Li, G. LECARM: Low-Light Image Enhancement Using the Camera Response Model. IEEE Tran. Circuits Syst. Video 2019, 29, 968–981. [Google Scholar] [CrossRef]
  24. Wei, C.; Wang, W.; Yang, W.; Liu, J. Deep Retinex Decomposition for Low-Light Enhancement. arXiv 2018, arXiv:1808.04560. [Google Scholar]
  25. Xu, K.; Yang, X.; Yin, B.; Lau, R.W.H. Learning to Restore Low-Light Images via Decomposition-and-Enhancement. In Proceedings of the 2020 IEEE/CVF Conference on Computer Vision and Pattern Recognition (CVPR), IEEE, Seattle, WA, USA, 13–19 June 2020. [Google Scholar]
  26. Atoum, Y.; Ye, M.; Ren, L.; Tai, Y.; Liu, X. Color-wise Attention Network for Low-light Image Enhancement. arXiv 2019, arXiv:1911.08681. [Google Scholar]
  27. Kwon, D.; Kim, G.; Kwon, J. DALE: Dark Region-Aware Low-light Image Enhancement. arXiv 2020, arXiv:2008.12493. [Google Scholar]
  28. Łoza, A.; Bull, D.R.; Hill, P.R.; Achim, A.M. Automatic contrast enhancement of low-light images based on local statistics of wavelet coefficients. Digit. Signal Process. 2013, 23, 1856–1866. [Google Scholar] [CrossRef]
  29. Buchsbaum, G.; Gottschalk, A. Trichromacy, Opponent Colours Coding and Optimum Colour Information Transmission in the Retina. Proc. R. Soc. Lond. B 1983, 220, 89–113. [Google Scholar]
  30. Fischer, L.J.; Vaughan, D. The Beta-hyperbolic secant distribution. Aust. J. Stat. 2010, 3, 245–258. [Google Scholar] [CrossRef]
  31. Nilsson, M. SMQT-based Tone Mapping Operators for High Dynamic Range Images. In Proceedings of the International Conference on Computer Vision Theory and Applications (VISIGRAPP 2013)–Volume 1: VISAPP, Barcelona, Spain, 21–24 February 2013; pp. 61–68. [Google Scholar] [CrossRef] [Green Version]
  32. Lee, S.H.; Park, J.S.; Cho, N.I. A Multi-Exposure Image Fusion Based on the Adaptive Weights Reflecting the Relative Pixel Intensity and Global Gradient. In Proceedings of the 25th IEEE International Conference on Image Processing, ICIP, Athens, Greece, 7–10 October 2018. [Google Scholar]
  33. Mertens, T.; Kautz, J.; Van Reeth, F. Exposure Fusion: A Simple and Practical Alternative to High Dynamic Range Photography; Computer Graphics Forum; Wiley Online Library: Hoboken, NJ, USA, 28 September 2009; pp. 161–171. [Google Scholar]
  34. He, K.; Sun, J.; Tang, X. Single image haze removal using dark channel prior. IEEE Trans. Pattern Anal. Mach. Intell. 2011, 33, 2341–2353. [Google Scholar] [PubMed]
  35. Wang, S.; Ma, K.; Yeganeh, H.; Wang, Z.; Lin, W. A Patch-Structure Representation Method for Quality Assessment of Contrast Changed Images. IEEE Signal Process. Lett. 2015, 22, 2387–2390. [Google Scholar] [CrossRef]
  36. Cui, G.; Feng, H.; Xu, Z.; Li, Q.; Chen, Y. Detail preserved fusion of visible and infrared images using regional saliency extraction and multi-scale image decomposition. Opt. Commun. 2015, 341, 199–209. [Google Scholar] [CrossRef]
  37. Eskicioglu, A.M.; Fisher, P.S. Image quality measures and their performance. IEEE Trans. Commun. 1995, 43, 2959–2965. [Google Scholar] [CrossRef] [Green Version]
Figure 1. Flow chart of the proposed method.
Electronics 12 02654 g001
Figure 2. Image fusion process based on PCA transformation.
Electronics 12 02654 g002
Figure 3. Value of the standard deviation σ.
Electronics 12 02654 g003
Figure 4. Processing results of “bookcase” image. (a) Input image; (b) ground truth; (c) proposed; (d) BIMEF [22]; (e) LECARM [23]; (f) BPBF [21]; (g) MF [16]; (h) SRIE [9]; (i) Dong [7].
Electronics 12 02654 g004
Figure 5. Processing results of “kitchen” image. (a) Input image; (b) ground truth; (c) proposed; (d) BIMEF [22]; (e) LECARM [23]; (f) BPBF [21]; (g) MF [16]; (h) SRIE [9]; (i) Dong [7].
Electronics 12 02654 g005
Figure 6. Details of processing results for the “kitchen” image. (a) Proposed; (b) MF [16]; (c) Dong [7].
Electronics 12 02654 g006
Figure 7. Processing results of the “wardrobe” image. (a) Input image; (b) ground truth; (c) proposed; (d) BIMEF [22]; (e) LECARM [23]; (f) BPBF [21]; (g) MF [16]; (h) SRIE [9]; (i) Dong [7].
Electronics 12 02654 g007
Figure 8. Details of processing results for the “wardrobe” image. (a) Proposed; (b) MF [16]; (c) LECARM [23].
Electronics 12 02654 g008
Figure 9. Processing results of the “toy” image. (a) Input image; (b) ground truth; (c) proposed; (d) BIMEF [22]; (e) LECARM [23]; (f) BPBF [21]; (g) MF [16]; (h) SRIE [9]; (i) Dong [7].
Electronics 12 02654 g009
Figure 10. Processing result of the “pool” image. (a) Input image; (b) ground truth; (c) proposed; (d) BIMEF [22]; (e) LECARM [23]; (f) BPBF [21]; (g) MF [16]; (h) SRIE [9]; (i) Dong [7].
Electronics 12 02654 g010aElectronics 12 02654 g010b
Figure 11. Average evaluation index of images processed using different algorithms.
Electronics 12 02654 g011
Figure 12. Processing result of the “moon” image. (a) Input images; (b) BIMEF [22]; (c) RRM [10]; (d) LECARM [23]; (e) BPBF [21]; (f) MF [16]; (g) SRIE [9]; (h) NPE [8]; (i) ours.
Electronics 12 02654 g012
Figure 13. Processing result of the “house” image. (a) Input images; (b) BIMEF [22]; (c) RRM [10]; (d) LECARM [23]; (e) BPBF [21]; (f) MF [16]; (g) SRIE [9]; (h) NPE [8]; (i) ours.
Electronics 12 02654 g013
Figure 14. Details of processing results for the “house” image. (a) Ours; (b) LECARM [23].
Electronics 12 02654 g014
Figure 15. Processing result of the “clock” image. (a) Input images; (b) BIMEF [22]; (c) RRM [10]; (d) LECARM [23]; (e) BPBF [21]; (f) MF [16]; (g) SRIE [9]; (h) NPE [8]; (i) ours.
Electronics 12 02654 g015
Figure 16. Results of ablation experiments on “house” images. (a) Both lightness and gradient weights; (b) only the lightness weight; (c) only the gradient weight.
Electronics 12 02654 g016
Figure 17. Results of ablation experiments on “house” images. (a) Both lightness and gradient weights; (b) only the lightness weight; (c) only the gradient weight.
Electronics 12 02654 g017
Figure 18. Point plot of evaluation index of ablation experiment.
Electronics 12 02654 g018
Figure 19. The application of the proposed method for power equipment. (ad) image taken of the power system; (a’d’) images processed by our method.
Electronics 12 02654 g019
Table 1. Evaluation index of images processed using different algorithms for “moon”.
MethodAGEIFDSFSH
Ours10.2196.5114.5432.807.78
BIMEF6.9565.879.9221.177.48
RRM7.7673.8810.9822.687.53
LECARM9.1186.6012.9828.007.51
BPBF6.9765.989.9520.317.47
MF8.0876.0811.6224.467.58
SRIE6.0758.498.4918.897.38
NPE6.5762.349.3519.197.37
Table 2. Evaluation index of images processed using different algorithms for “house”.
MethodAGEIFDSFSH
Ours10.41105.5213.1928.227.78
BIMEF7.8080.619.6421.767.28
RRM8.3288.0310.8522.397.48
LECARM10.34106.3212.8728.067.43
BPBF8.3285.1310.4421.147.71
MF9.5797.8212.0325.347.82
SRIE7.8281.669.4422.367.62
NPE8.5787.6510.7922.537.59
Table 3. Evaluation index of images processed using different algorithms for “clock”.
MethodAGEIFDSFSH
Ours6.9974.368.2520.797.39
BIMEF4.1143.474.8811.886.48
RRM6.2666.487.3617.986.55
LECARM4.8943.604.7912.686.38
BPBF4.2244.774.9711.506.26
MF5.4958.086.5115.676.58
SRIE3.3335.473.8910.266.07
NPE5.5458.836.5415.506.51
Table 4. Comparison of mean evaluation indexes of images after two ablation experiments.
ExperimentOursEx_IEx_II
PSNR31.0929.2429.79
SSIM0.740.740.71
PCQI0.620.600.59
AG9.375.827.67
EI76.0356.0267.29
SH7.317.267.11
Disclaimer/Publisher’s Note: The statements, opinions and data contained in all publications are solely those of the individual author(s) and contributor(s) and not of MDPI and/or the editor(s). MDPI and/or the editor(s) disclaim responsibility for any injury to people or property resulting from any ideas, methods, instructions or products referred to in the content.

