Article

Towards Resilient and Secure Smart Grids against PMU Adversarial Attacks: A Deep Learning-Based Robust Data Engineering Approach

1
Laboratory of Automation and Manufacturing Engineering, University of Batna 2, Batna 05000, Algeria
2
Institut de Recherche Dupuy de Lôme (UMR CNRS 6027), University of Brest, 29238 Brest, France
3
Logistics Engineering College, Shanghai Maritime University, Shanghai 201306, China
4
ISEN Yncréa Ouest, L@bISEN, 29200 Brest, France
*
Author to whom correspondence should be addressed.
Electronics 2023, 12(12), 2554; https://doi.org/10.3390/electronics12122554
Submission received: 5 May 2023 / Revised: 1 June 2023 / Accepted: 5 June 2023 / Published: 6 June 2023

Abstract

:
In an attempt to provide reliable power distribution, smart grids integrate monitoring, communication, and control technologies for better energy consumption and management. As a result of such cyberphysical links, smart grids become vulnerable to cyberattacks, highlighting the significance of detecting and monitoring such attacks to uphold their security and dependability. Accordingly, the use of phasor measurement units (PMUs) enables real-time monitoring and control, providing informed-decisions data and making it possible to sense abnormal behavior indicative of cyberattacks. Similar to the ways it dominates other fields, deep learning has brought a lot of interest to the realm of cybersecurity. A common formulation for this issue is learning under data complexity, unavailability, and drift connected to increasing cardinality, imbalance brought on by data scarcity, and fast change in data characteristics, respectively. To address these challenges, this paper suggests a deep learning monitoring method based on robust feature engineering, using PMU data with greater accuracy, even within the presence of cyberattacks. The model is initially investigated using condition monitoring data to identify various disturbances in smart grids free from adversarial attacks. Then, a minimally disruptive experiment using adversarial attack injection with various reality-imitating techniques is conducted, inadvertently damaging the original data and using it to retrain the deep network, boosting its resistance to manipulations. Compared to previous studies, the proposed method demonstrated promising results and better accuracy, making it a potential option for smart grid condition monitoring. The full set of experimental scenarios performed in this study is available online.

1. Introduction

The use of smart grids entails two-way monitoring, communication, and control, boosting the efficiency and stability of the energy supply while enabling more flexibility and better control over energy consumption [1]. A more sustainable energy system and generation mix can potentially be implemented by means of a smart grid, which also enables the greater management of renewable energy sources [2]. However, owing to their heavy reliance on such technology, smart grid components are all vulnerable to cyberattacks, where cybercriminals can target them individually and manipulate data throughout the network [3]. With power generation and distribution systems being vulnerable to cyberattacks, the significance of cybersecurity safeguards has increased significantly. The efficient operation and security of these systems relies entirely on strong cybersecurity measures [4]. As a key component of the smart grid condition monitoring system, PMUs provide a reliable assessment throughout their operation [5]. As they provide vital information about voltage and current levels at various locations in the power grid, PMUs have become indispensable instruments for monitoring and managing power system operations. Due to their ability to collect power phasors with great precision using global poisoning system timestamps at coordinated universal times, power utilities are able to promptly identify and address any possible issues [6]. PMUs, however, can be exposed to cyberattacks that can cause extensive power outages, financial loss, and even put human lives in danger. There are several ways to initiate an attack on PMUs, including (i) triggering a physical attack by physically altering the device or even replacing it with a malicious one; (ii) using a malware attack to gain access to the device, manipulate data, and even take control of the grid; and (iii) insider attacks, which happen when a member of the organization intends to maliciously control the grid. However, in a more practical sense, (iv) such a cyberattack is a communication attack in which cybercriminals use communication channel flaws to intercept and manipulate data delivered by the device [7]. In this specific situation, different security measures must be implemented, taking into account various measures including encryption, authentication protocols, and physical access authentication, while firewalls, cyberattack detection, and mitigation systems can prevent cyberattacks [8]. Due to their crucial role in offering the robustness and security of smart grid condition monitoring, this study emphasizes the latter aspect of the design of cyberattack mitigation systems. In this context, by utilizing cutting-edge learning algorithms, deep learning is an efficient way to participate in mitigating the possible impacts of cyberattacks on PMUs [9]. Deep learning models are considered to be very effective in promptly sensing any signs of a cyberattack and evaluating enormous amounts of PMU data. To improve recognition, this may also be achieved by training the system on data that contain prior attack patterns. Additionally, defense tactics that may be employed to prevent or mitigate the risk can be automatically generated and updated using deep learning algorithms. Overall, the use of deep learning algorithms can be very helpful for enhancing the security of smart grids [10]. As a result, this section is devoted to reviewing and analyzing current publications on the topic of using deep learning in attack mitigation on PMUs while making sure that any ongoing research gaps and key contributions are then prominently shown. As a result, this section is broken down primarily into three sections: related works and research gaps analysis, contributions, and outlines.

1.1. Related Works and Research Gaps Analysis

Research papers in this study were gathered using a systematic methodology. Due to the widespread interest in this subject, there are several studies available. Due to the fact that the advancements in the selected topic have already been the subject of so many publications, it is challenging to bring attention to all of them. As a result, paper collection was restricted for the range of our search to only include works published in 2023. When using the Google Scholar search engine, the following keywords were considered: “PMUs, monitoring, smart grids, cyberattack, deep learning”. Similarly, the issue of dealing with a substantial volume of work arose, as approximately 450 papers have been published. To address this, we used a selection approach that involved excluding papers that did not mention the acquisition of data from PMUs. The procedure for collecting papers was consistently applied across all research pages in the search results, until no further relevant studies were found, resulting in a total of five papers specifically related to our topic of interest. It is important to note that our human-centered methodology may have overlooked a small number of papers, but we are confident that a sample size of five papers is adequate to draw a general conclusion with a reasonable level of confidence, which we consider sufficient for presenting our analysis.
The next stage was to review these works on the premise that their findings will help shed light on research gaps, hence demonstrating the necessity of our contributions to a current case study. As a result, a specific criterion was suggested for evaluating these papers. Data engineering techniques, data complexity, data unavailability (including imbalanced classes), data drift (i.e., dynamically changing data), the type of targeted cyberattack, deep learning tools, and employed datasets and/or simulation platforms were the main suggested elements.
For instance, in [11], to identify false data injection in the smart grid system, a hybrid convolutional neural network and a long short-term memory tuned with particle swarm optimization were employed. An open-source simulated power system made available by Mississippi State University was where the data for PMUs were collected [12]. The processing in this scenario involved the data of binary classes, three classes, and multiple classes of system faults, attacks, and normal situations. As a result, the processed dataset was relatively huge, imbalanced, and highly complicated and dynamic, with many features and samples. Deep learning tools were used to address data complexity, while adaptive long short-term memory features were used to address data drift. Despite the experiments being conducted on this dataset, the paper did not address how the dataset was processed, prepared for training, and balanced among the various classes. A long short-term memory network, proposed in [13], used observations from PMUs to identify abnormalities in smart grids. Additionally, it covered how to isolate compromised units. Reconstructing compromised unit data involved generative adversarial imputation networks. Then, to differentiate fault occurrences from other disturbances and monitor and secure the transmission lines, a random forest classifier was utilized. A digital simulator-based integrated cyber-physical testbed served as the basis for the WSCC 9-bus system [14] under study. In comparison to previous research, the technique produced great findings; nevertheless, additional information about data engineering and data unavailability was not fully revealed. In [15], a two-dimensional convolutional neural network classifier and reconstruction decoder for identifying and detecting dynamic load-altering attacks was developed using data from a monitored generator through PMUs. The accuracy of the provided technique was evaluated using simulations on the IEEE 14 and IEEE 39-bus systems [16,17] where results indicated that it outperformed a number of reference approaches. A convolutional network does not actually reflect dynamic data changes comparable to recurrent deep networks variants, since the learning system does not take data unavailability and drift into account while creating a model. Furthermore, while practical applications do not replicate these cases, data imbalance and feature engineering were not explored in this scenario. To estimate smart grid distribution system conditions and address the false data injection problem at the same time, a multi-layer perceptron was used in [18]. This was accomplished by using real data received from PMUs to solve a regression problem and binary classification. With the use of an IEEE 33-bus and an IEEE 69-bus system [19,20], the suggested technique was tested against two false data injection strategies. The suggested technique outperformed earlier works using weighted least squares methods in terms of performance and speed, even in the presence of corrupted data. However, this study did not address the issues of data imbalance and drift or feature engineering that arise in practical applications, which are not the case for complex and dynamic data. According to [21], one method for gathering spatiotemporal data from various sensors, including PMUs, is to employ a temporal convolutional denoising autoencoder augmented with an attention mechanism. This method located and eliminated deceptive inserted data using the newly decoded values. Simulations of the IEEE 13-bus and IEEE 37-bus distribution systems [22,23] were used to evaluate the robustness of the proposal. Reconstruction results and classification metrics from these simulations were supplied with more precision. However, the concept placed little emphasis on feature engineering, complexity, and data imbalance.
Table 1 provides a summary of conclusions drawn from the review analysis, which can be used to gain a more detailed understanding of the related works and research gaps. Crosses and tick marks respectively indicate the existence or non-existence of these aspects in the analysis criteria. Figure 1, which comprises multilayer donut graphic charts (i.e., each line from the donut legend refers to a specific level), further elucidates the findings presented in Table 1. Upon conducting a first-level analysis, it was discovered that the majority of projects only employ deep learning techniques to handle data complexity, with minimal attention given to data drift (10%). Additionally, there was no emphasis placed on feature engineering or handling data unavailability. At the second level, it was found that false data injections are often the targeted attacks. Lastly, the third level analysis indicated that convolutional neural networks are used more frequently than other techniques.

1.2. Contributions

Data drift, multiple feature engineering, and data imbalance issues that are present in the real world were highlighted in the analysis of the previous works. In this context, this paper aims to fill this gap by proposing the following methodology.
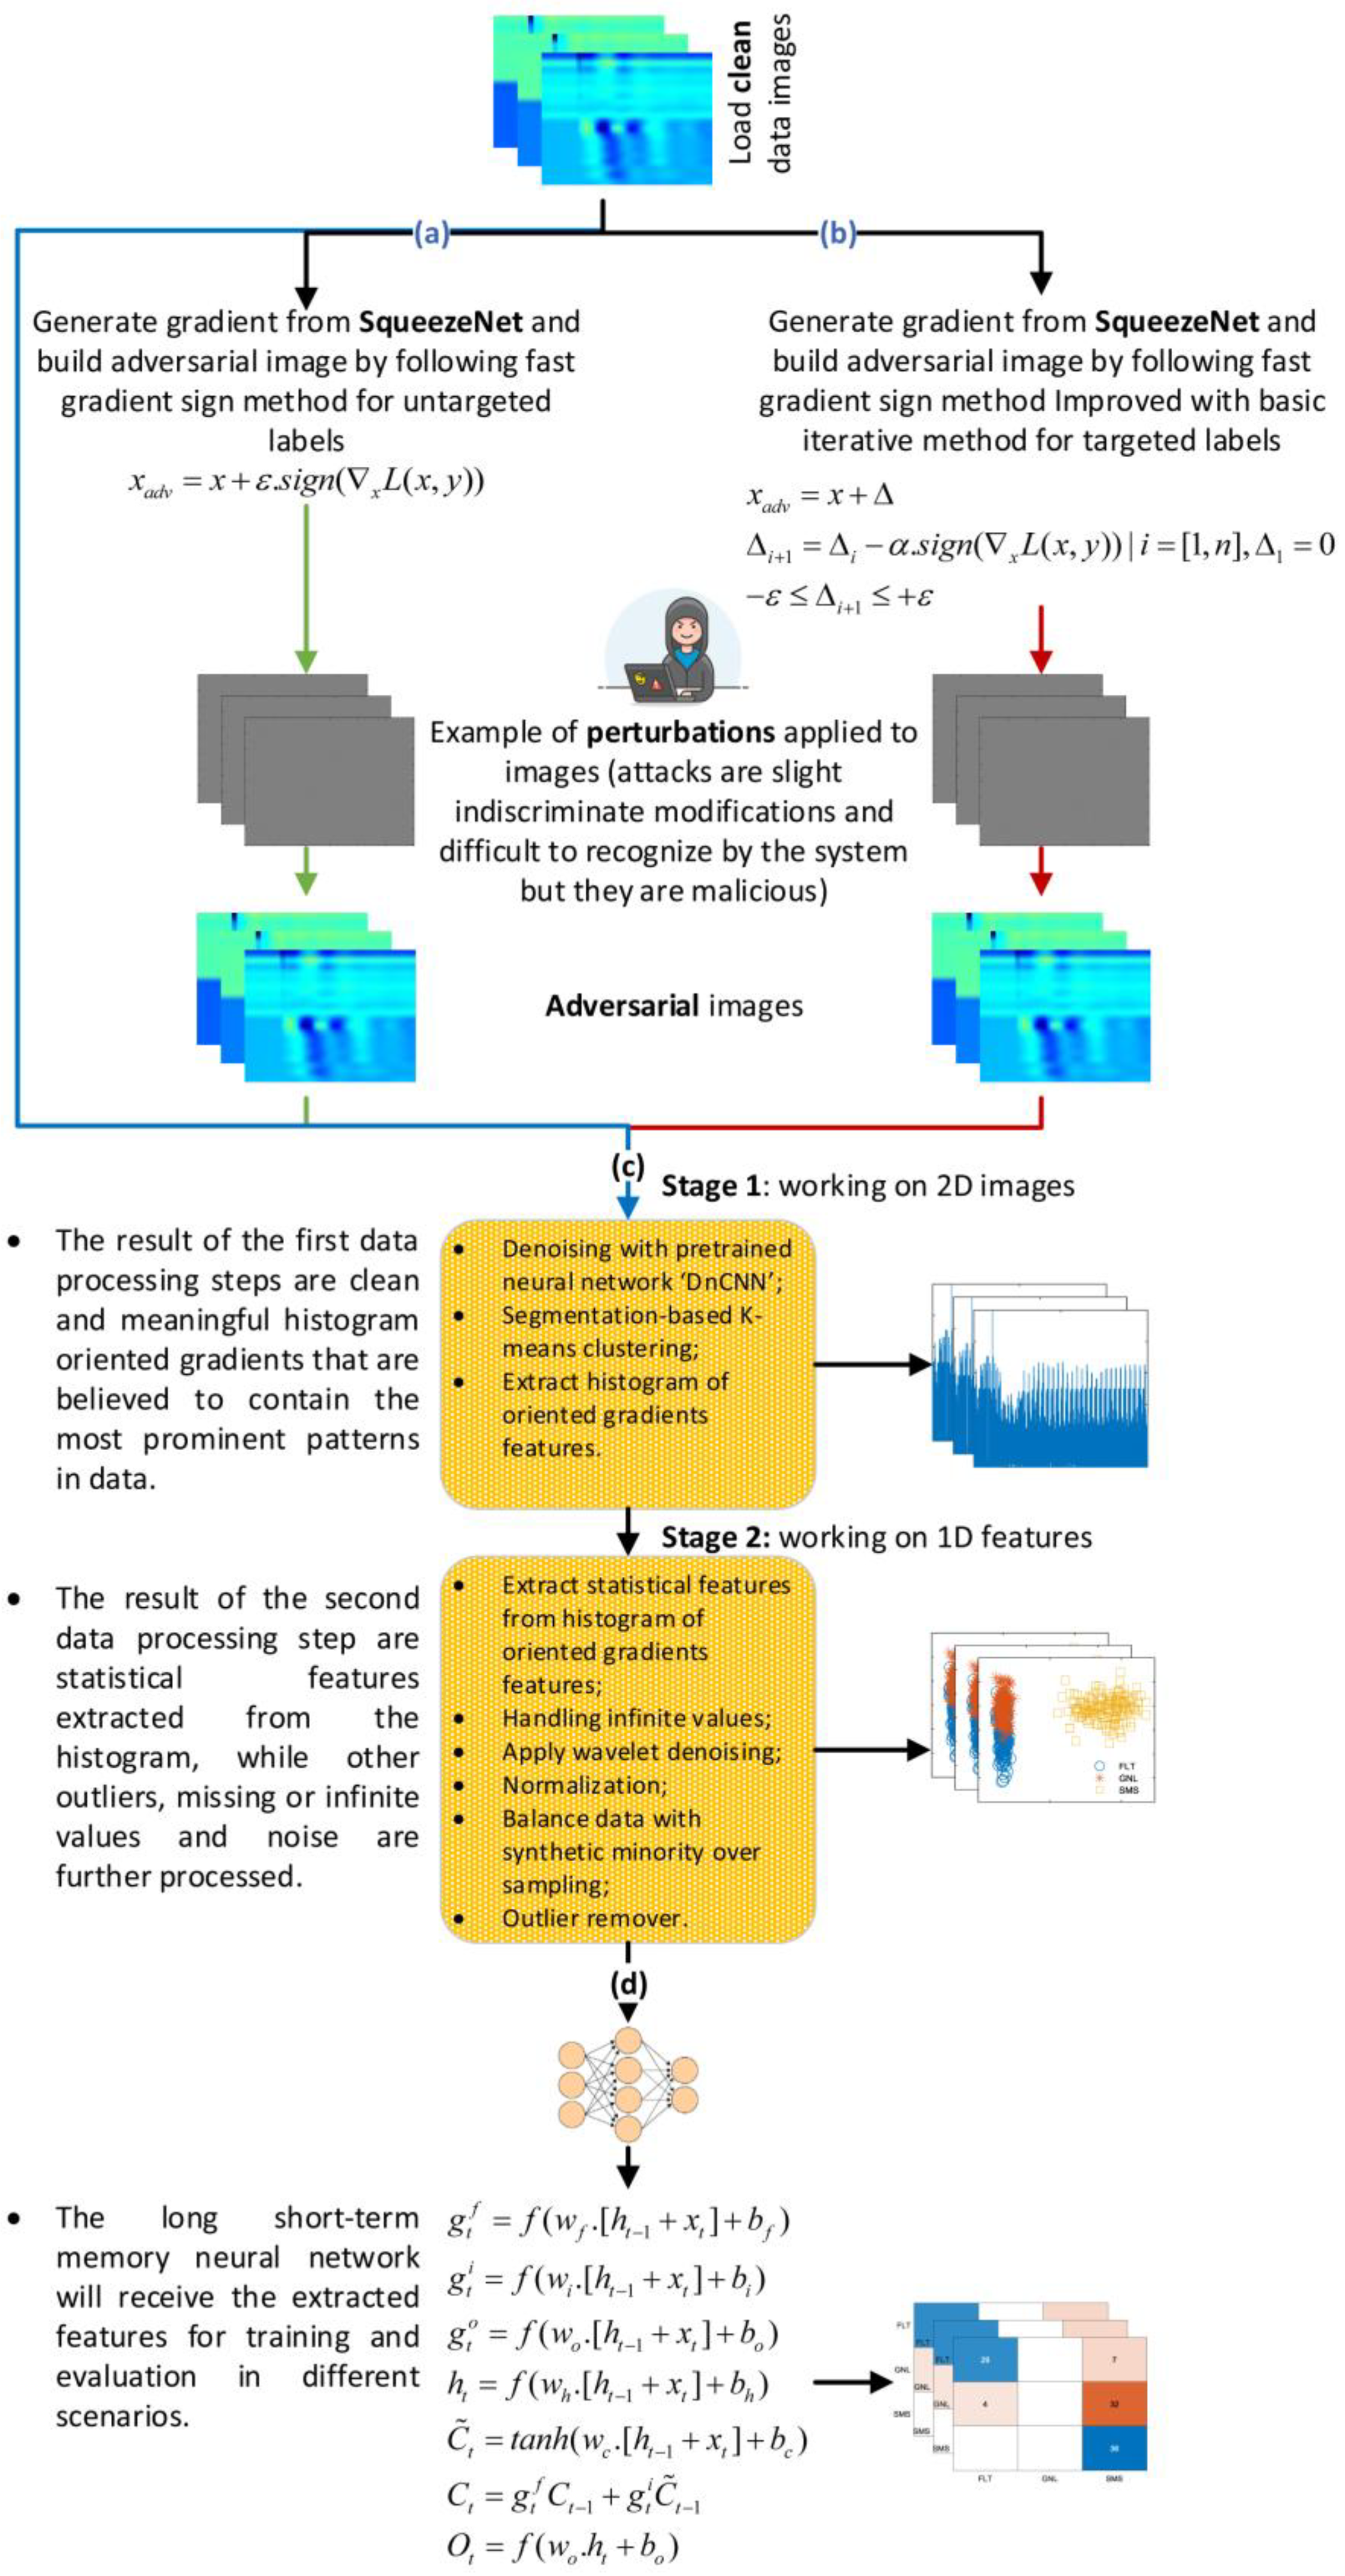
  • Feature engineering: this paper proposes robust data engineering based on two different stages of image segmentation and feature extraction from data created by transferring the measurements obtained from PMUs to pseudo-colored images. Both data engineering stages include a variety of data processing steps, ranging from different denoising algorithms to outlier removals, scaling, and extraction techniques. The final result of the feature engineering phase will be very relevant, meaningful, and clean data, ready to feed deep learning algorithms. By “robust” data engineering, we refer to the set of algorithmic steps followed to ensure the resilience of the monitoring system against highly dynamic data. In other words, environmental conditions, physical conditions, and adverse disturbances in the system can cause non-stationary noise, distortions, and masking patterns in the data. In this case, the “robustness” of the feature engineering pipeline is taken into account to mitigate/eliminate these outliers. Compared to previous work that depends on automatic deep learning processing, this work introduces additional a priori steps of data abstraction, which simplifies its processing by future learning models.
  • Data unavailability and drift: data employed in this case reflect the actual conditions of imbalance and scarcity of specific class patterns, and are also subject to huge data changes. A balancing approach based on the synthetic minority over-sampling technique and adaptive learning algorithms based on a long-term memory network is involved.
  • Data complexity: data complexity is first targeted by the designed robust feature engineering, then by the deep learning architecture of non-linear abstractions.
  • Attack mitigation experiments: multiple scenarios were built on data used to create similar attacks with different procedures, emulating real cases of false data injection where the model can be evaluated in both attack and non-attack scenarios.

1.3. Outlines

The study is divided into five sections, with the aim of ensuring that the contributions presented in each section are adequately explained and comprehensible to readers, thereby facilitating the replication of the experiments. In addition to the introduction, the second section includes a comprehensive description of the dataset utilized, the suggested feature engineering strategy, and the attack crafting process, along with the essential flowchart for easier understanding. The third section explains the deep learning techniques used in this study, as well as the application scenarios. Additionally, it will be used to present the findings, discuss them, and compare them with earlier research on the same topic. The fourth section will also present future prospects and bring this effort to a close.

2. Data Engineering and Attack Design

This section describes the utilized dataset in this study, the suggested mechanism for crafting attacks, and the feature engineering process. It should also be mentioned that all the experiments conducted in this study, from data preprocessing to application, relied on a computing power of a quad-core i7 microprocessor, 16 gigabytes of RAM, and 12 megabytes of cache memory. The latest versions of MATLAB r2023a toolkits were involved in this case in all steps. In addition, all the necessary files and codes to easily reproduce these experiments have been made available in [25].

2.1. Dataset Description

The dataset involved in this study was created using a simulation model replicating a group of PMUs (i.e., 299) connected to a regional phasor data concentrator in the Las Vegas area as a part of a real smart grid system [24,26]. Following that, data on a sufficient number of disturbances under time-varying working conditions were accordingly gathered. The Western Electricity Coordinating Council’s heavy summer 2008 load flow baseline scenario was used to generate simulated disturbances, namely, fault (FLT), loss of generation (GNL), and synchronous motor switching off (SMS), using the positive sequence load flow dynamic simulation tool [24]. In [24], it is stated that the data are generated from a well-known state-of-the-art simulation model provided by General Electric, while the grid operating conditions are collected from a real case scenario. Hence, the simulation model has already been validated and verified by this company, and the data are real and authentic. In conclusion, the generated data should logically be authentic, which certainly leads to authentic conclusions.
By merging measurements obtained from the 10 most strong signature PMUs, pseudo-color images were produced. Each image included 300 time points, 10 voltage measurements, 10 frequency measurements, and 3 fundamental color intensities with a dimension of [300 × 20 × 3] pixels. Each image showed a distinct distance incident. The pseudo-colored images were made from a two-dimensional data matrix of voltage and spatiotemporal frequencies, which were further normalized and quantized to 256 intensity levels for the red, green, and blue color sets. To develop an image that maps spatiotemporal PMU voltage and frequency data, pseudo-color images were combined with corresponding spatial coordinates. In the original paper related to this dataset [24], the reason for this transformation was not discussed; however, we believe it is closely related to the transfer learning networks used in this case, as they recommend two-dimensional matrices of this specific type of images. Accordingly, differences in grid disturbances and operation should generate different patterns in each image (i.e., red, green, and blue colored matrices), displaying specific and unique signatures of particular operating conditions. A total of 344 fault occurrences, 140 production loss incidents, and 21 synchronous motor switching events were included in the data collection. Figure 2 is an illustrative example showcasing some samples belonging to each event from the dataset. While the original introductory paper on these data in [24] doesn’t explain these colors, the variation in colors means variation in data patterns. Future space seemed to be dimensional, time-varying, and complicated based on the facts thus far presented in the dataset and results obtained based on training the very complex deep architecture of the convolutional neural network in [24]. Feature generation is therefore required to replace the feature space in a more straightforward yet relevant manner. Accordingly, the next subsections will deal with the topic in detail.

2.2. Adversarial Attack Design

PMU units are often targeted by false data injection attacks, which are commonly referred to as blackbox attacks. In such attacks, PMUs themselves are assumed to operate normally, but the data they produce are manipulated. Cybercriminals carrying out these attacks aim to subtly alter the original data in a way that avoids detection by the monitoring system. However, the modified data can mislead the system into making erroneous decisions that have serious consequences. In this context, there are two distinct cases of adversarial data injection. Either the cybercriminal tries to perform a specific deceptive attack, or a random attack disrupting the system. The first is a targeted decision where the data can be subjected to a specific type of disturbance, leading to a specific informed decision. On the other hand, the latter is a type of disturbance that misleads the informed decision of any potential response. In this study, we used a pretrained neural network named SqueezNet to create adversarial data from the used dataset [27]. SqueezNet is a convolutional neural network enhanced in training speed and accuracy and dedicated to solving classification problems through transfer learning from a wide range of image datasets. In this study, we used SqueezNet in two particular types of adversarial data generation: targeted and untargeted labels.

2.2.1. Untargeted Adversarial Attack Design

For the untargeted labels, we followed the fast gradient sign method [28], while adversarial images could be computed as in (1). x represents the original image; x a d v is devoted to describing adversarial images; ε is a parameter increasing the chance of misclassification; and x   refers to gradient determined by the loss function L ( x , y ) , while y is the label of the image. Here, the labels were randomly assigned to the generated adversarial versions.
x a d v = x + ε s i g n ( x L ( x , y ) )
Figure 3a is an example of clean images corrupted by an untargeted adversarial perturbation to mislead its classification.

2.2.2. Targeted Adversarial Attack Design

Generating targeted adversarial perturbations is a further complex operation and requires further improvements, as the label needs to be predicted. In this case, the basic iterative method proposed in [29] was used to enhance Formula (1)’s accuracy through iterative updates of adversarial perturbations. Formulas (2)–(4) are the new representations of Formula (1), where α is the step size of each iteration.
x a d v = Δ n + x
Δ i + 1 = Δ i + α s i g n ( x L ( x , y ) | i = [ 0 , 1 ,   2 , , n ] ,   Δ 0 = 0
ε Δ i + 1 + ε
Figure 3b is devoted to illustrating clean images corrupted by a targeted adversarial perturbation to mislead its classification.

2.3. Dataset Processing

In [24], the prior work on the same dataset used the images as-is and conducted experiments using a convolutional neural network without any preprocessing or addressing the data imbalance. In contrast, this study implemented a feature engineering process in two stages (illustrated in Figure 3c) to mitigate the impact of adversarial attacks and to simplify the problem at hand. Different colors of arrows in Figure 3 explain the different scenarios in this study.
The first stage consisted of dealing with the two-dimensional images, starting with denoising, segmentation, and histogram-oriented gradient extraction. A specific convolutional neural network was used and trained to eliminate Gaussian noise for the denoising process. This approach proved to be highly effective in mitigating the impact of adversarial attacks in our study. Further details and analysis about the used deep network can be found in [30]. Subsequently, a segmentation process based on k-means clustering was adopted, with k = 5 neighbors. This approach has been shown to be highly effective for colored images, as was the case in our study, and was used to detect and differentiate between various components within the images [31]. The histogram-oriented gradient was extracted to provide further meaningful features effective for the classification process [32]. Figure 4 shows results obtained at different steps of the first stage. When analyzing the denoising process results, it was evident that this step significantly mitigated the impact of noise that was present in the original images. This, in turn, helped to enhance the overall quality of the data. Similarly, the visualization obtained through clustering (shown in Figure 4c) assisted in distinguishing between different patterns present in the data. Furthermore, the segmentation process allowed for the identification of unique pattern locations, thus differentiating between various data patterns.
In the second stage, extracted histograms from treated segmented images were further exposed to statistical feature extraction and processing. Mainly, features including mean ( σ ), standard deviation ( δ ), skewness ( ρ ), kurtosis ( β ), peak to peak ( ϑ ), square root of the arithmetic mean ( α ), crest factor ( γ ), shape factor ( φ ), impulse factor ( θ ), margin factor ( τ ), and energy ( ϵ ), as introduced in Formulas (5)–(15), were exploited. x i refers to features of each observation, i.e., the complete histogram of each image, in this case.   N is the number of features in each observation.
σ = 1 N i = 1 N x i
δ = 1 N i = 1 N ( x i σ )
ρ = i = 1 N ( x i σ ) 3 ( N 1 ) ( δ ) 3
β = i = 1 N ( x i σ ) 4 ( i = 1 N ( x i σ ) 2 ) 2
ϑ = max ( x i )   min   ( x i )
α = 1 N i = 1 N ( x i ) 2
γ = ϑ / α
φ = α / | x ¯ |
θ = max ( | x i | ) 1 N i = 1 N | x i |
τ = max ( | x i | ) ( 1 N i = 1 N | x i | ) 2
ϵ = i = 1 N ( x i ) 2
To obtain more robust representations from the extracted features, these features were passed through an additional denoising process using empirical Bayesian wavelet transform. This approach used a Cauchy prior with a posterior median threshold rule to effectively reduce the impact of noise in the feature space [33,34]. Subsequently, the features of each disturbance event in the dataset were processed separately using an outlier remover. This separate approach of removing outliers was implemented to avoid falsely identifying other events as outlier patterns due to differences in data characteristics. Outlier removing was performed by default, using a moving median method [35]. Then, a synthetic minority over-sampling technique was used to balance the event instances [36]. Figure 5, in this case, is devoted to presenting an example of the obtained signal histogram along with the obtained features extracted from the first clean dataset without adversarial data.
Figure 5b–d already show that there was a visual difference in data patterns for different events expressing different behaviors in measurement amplitudes versus periodicity. This is a sign that the feature engineering process was appropriately carried out, making the feature space more meaningful for training. Another illustration brought by Figure 6 provides additional insight into the feature space of the three datasets used in this study after data engineering, namely the clean dataset, the dataset corrupted with untargeted adversarial attacks, and the dataset corrupted with targeted adversarial attacks. It is clearly visible that data classes coordinates were changed in the corrupted version (Figure 6b,c), despite the fact that the images appear visually unaffected by the perturbations. Such coordinate modifications can result in misclassification by deep learning models. Therefore, the objective in this scenario was to train the model on adversarial data to enhance its robustness and prevent it from being misled by such perturbations. This is the objective aim of this paper, and will be discussed in the next section.

3. Methods, Experiments, and Results Discussion

This section outlines the methods and experimental settings used in this study, along with the corresponding results. The first subsection will describe the long short-term memory network, hyperparameters, and architecture employed. The second subsection will introduce the experimental settings and assessment measures used in this study. The third subsection is dedicated to providing a comprehensive analysis of the results obtained.

3.1. Methods

The learning concepts of long short-term memory were applied in this study, as illustrated in Figure 3d. This particular type of deep neural network introduces a series of gates that govern the weight update process, allowing the dynamic adaptation of the learning model to data drift. Accordingly, the input gate g t i , the output gate g t o , and the forget gate g t f presented in Formulas (16)–(18) were implied containing the input x t , weights ( w f , w i , w o , w h , w c ), and biases ( b f , b i , b o , b h , b c ) . Formulas (19)–(21) were used to determine the network state, using the hidden state h t and cell state   C t . The output was determined, lastly, as in Formula (22), while the output weights W o h , the output bias vector b o h , and the activation function f were all included. { f , t a n h } are sigmoid and hyperbolic tangent functions, respectively.
g t f = f ( w f [ h t 1 + x t ] + b f )
g t i = f ( w i [ h t 1 + x t ] + b i )
g t o = f ( w o [ h t 1 + x t ] + b o )
h t = f ( w h [ h t 1 + x t ] + b h )
C ˜ t = t a n h ( w c [ h t 1 + x t ] + b c )
C t = g t f C t 1 + g t i C ˜ t 1 .
O t = f ( W o h h t + b o h )
The network hyperparameters in the study were tuned based on error and trial bases as follows: {maximum number of epochs = 500; mini-batch size = 20; number of layers = 1; number of neurons = 20; training algorithm optimizer = adam; initial learning rate = 0.1; Gradient threshold= 1; L2 regularization= 0.01}.

3.2. Experimental Scenarios

There are three primary scenarios in this study. The deep neural network is trained and tested using clean row data in the first scenario (i.e., Scenario I). The goal is to (i) monitor the real performance of the deep network and (ii) compare it with earlier research in order to gain a general understanding of how the proposed resilient feature engineering differs from earlier research. The same deep network will be tested on corrupted data in the second scenario (i.e., Scenario II), which will allow (i) more learning about how malicious data can thwart informed decision-making, and (ii) its use as a benchmark to determine the degree of progress of the deep network in the third scenario (i.e., Scenario III). In Scenario III, both corrupted and clean data will be used to train the deep network. In this case, we will be able to determine the effectiveness of the deep network in counteracting adversarial attacks. The original study conducted in [24] only considers the first and last scenarios and does not provide any information regarding the actual performance of the deep network trained on clean data in the event of an adversarial attack mitigation. The same data partitioning is used in this case (i.e., 90% for training and 10% for testing) to allow for a fair comparison with prior research. For the sake of experiment simplicity, random sampling is used in this instance rather than tenfold cross-validation (i.e., nine folds for training and one fold for testing). Since the methodology employs less precise partitioning techniques, the results obtained can be further improved with more complex partitioning and selection methods.

3.3. Results and Discussion

In contrast to the previous study described in [24], which solely relied on classification accuracy to demonstrate their model robustness, this study assessed algorithm performance using a variety of criteria to ensure the accuracy and reliability of the results. As a result, both numerical assessment and data visualization were used in the evaluation. Figure 7 presents a set of confusion matrices related to the test set findings for each of the three scenarios in terms of data visualization. In the smart grid condition monitoring dataset, it appeared that the proposed learning methodology could achieve 100% accuracy for all types of disturbances (Figure 7a). In this particular case, we identified two potential explanations for 100% achieved accuracy. The clean data may have been generated from a scenario that does not include a higher level of dynamism at some point. This means that the distortion would not be high enough to create a higher cardinality in the event classes. It is also possible that feature engineering could have somehow dug deeper into the actual models to provide an easily separable feature space. This could also be seen in the data dispersions in Figure 6b, which showed that there was a reasonable distance between data classes, with less distortion compared to other figures. Furthermore, the introduction of deep learning feature maps, specifically long short-term memory models, could potentially enhance this distance even further. Despite using a larger deep architecture and more layers and parameters, the model presented in previous works [24] failed to achieve maximum accuracy even with clean data, as compared to the results obtained in this study. Under adversarial attacks, as shown in Figure 7b, networks behave in an undesirable way, especially when there are disruptions in generation loss because each event is incorrectly classified. A potentially disastrous decision-making process with severe consequences is likely to ensue as a result. The deep network that was trained using both clean and adversarial data was tested in Figure 7c following the same set of testing as per Figure 7b. With the improvement in accuracy, the model was capable of exhibiting its resilience to adversarial attacks and achieving exceptional classification outcomes for all events. Only a minor number of misclassified events could potentially result in the shutdown of the synchronous motor.
Table 2 presents additional metrics and comparisons between the proposed methodology and state-of-the-art works. The evaluation was performed on test sets using metrics such as accuracy, recall, precision, and F1 score, which are defined in Formulas (23)–(26). These metrics are essential in classification tasks, and higher values indicate better performance. A detailed explanation of these metrics and their significance can be found in [37].
Accuracy = Correct   predictions number   of   predictions
Recall = True   positives False   positives   + False   negatives
Precision = True   positives True   positives   + False   positives
F 1   score = 2     Precision   x   Recall Precision + Recall
It should be emphasized that this study employed a range of evaluation criteria, unlike previous works that only focused on accuracy. Moreover, despite the training disruption caused by Scenario II, the proposed algorithm still performed well in Scenario III. This highlights the significant impact of the suggested data engineering approach. Benchmarking experiments also indicated that the proposed method outperformed the previous work, despite using a simpler deep network design compared to the complex one employed in [24].

4. Conclusions

This paper introduced robust feature engineering coupled with deep learning to mitigate the effects of adversarial attacks on the smart grid monitoring system and prevent ill-informed decision-making. A single-layer long short-term memory with a simple architecture and few parameters was able to exhibit its resilience against different types of attacks thanks to strong feature engineering. Targeted and untargeted attack experiments were performed to corrupt the original data recorded from phasor measurement images initially stored as pseudo-color ones. The data generation process involved pre-trained deep networks for image classification. Feature engineering involved a multi-stage process ranging from different denoising algorithms to techniques for outlier removal, scaling, and extraction. The results achieved through multiple criteria were satisfactory when compared to prior studies and indicate a promising new direction for future research. Considering the emerging importance of feature engineering, future efforts will likely focus on exploring the architecture of deep networks to further improve performance.

Author Contributions

Conceptualization, T.B. and M.B.; methodology, T.B.; software, T.B.; validation, T.B., M.B. and Y.A.; formal analysis, T.B., M.B. and Y.A.; investigation, T.B.; resources, T.B.; data curation, T.B.; writing—original draft preparation, T.B.; writing—review and editing, T.B., M.B. and Y.A. All authors have read and agreed to the published version of the manuscript.

Funding

This research received no external funding.

Data Availability Statement

The raw original data used in this study can be downloaded at: https://zenodo.org/record/4663239#.ZFDhU3bMJPZ (accessed on 5 June 2023). Generated adversarial data and all related experiments using codes discussed in this study can be downloaded at: https://doi.org/10.5281/zenodo.7886444 (accessed on 5 June 2023).

Acknowledgments

The authors thank Biswal, M., Misra, S. and Tayeen, A.S. for making their data publicly available, which provided the basis for our research in this study.

Conflicts of Interest

The authors declare no conflict of interest.

References

  1. Vahidi, S.; Ghafouri, M.; Au, M.; Kassouf, M.; Mohammadi, A.; Debbabi, M. Security of Wide-Area Monitoring, Protection, and Control (WAMPAC) Systems of the Smart Grid: A Survey on Challenges and Opportunities. IEEE Commun. Surv. Tutor. 2023, 25, 1294–1335. [Google Scholar] [CrossRef]
  2. Bu, S.; Meegahapola, L.G.; Wadduwage, D.P.; Foley, A.M. Stability and Dynamics of Active Distribution Networks (ADNs) with D-PMU Technology: A Review. IEEE Trans. Power Syst. 2022, 38, 2791–2804. [Google Scholar] [CrossRef]
  3. Berghout, T.; Benbouzid, M.; Muyeen, S.M. Machine Learning for Cybersecurity in Smart Grids: A Comprehensive Review-Based Study on Methods, Solutions, and Prospects. Int. J. Crit. Infrastruct. Prot. 2022, 38, 100547. [Google Scholar] [CrossRef]
  4. Inayat, U.; Zia, M.F.; Mahmood, S.; Berghout, T.; Benbouzid, M. Cybersecurity Enhancement of Smart Grid: Attacks, Methods, and Prospects. Electronics 2022, 11, 3854. [Google Scholar] [CrossRef]
  5. Baba, M.; Nor, N.B.M.; Sheikh, A.; Nowakowski, G.; Masood, F.; Rehman, M.; Irfan, M.; Arefin, A.A.; Kumar, R.; Momin, B. A Review of the Importance of Synchrophasor Technology, Smart Grid, and Applications. Bull. Pol. Acad. Sci. Tech. Sci. 2022, 70, e143826. [Google Scholar] [CrossRef]
  6. Paramo, G.; Bretas, A.; Meyn, S. Research Trends and Applications of PMUs. Energies 2022, 15, 5329. [Google Scholar] [CrossRef]
  7. Zhang, M.; Shen, C.; He, N.; Han, S.; Li, Q.; Wang, Q.; Guan, X. False Data Injection Attacks against Smart Gird State Estimation: Construction, Detection and Defense. Sci. China Technol. Sci. 2019, 62, 2077–2087. [Google Scholar] [CrossRef]
  8. Ravinder, M.; Kulkarni, V. A Review on Cyber Security and Anomaly Detection Perspectives of Smart Grid. In Proceedings of the 2023 5th International Conference on Smart Systems and Inventive Technology (ICSSIT), Tirunelveli, India, 23–25 January 2023; pp. 692–697. [Google Scholar] [CrossRef]
  9. Lal, M.D.; Varadarajan, R. A Review of Machine Learning Approaches in Synchrophasor Technology. IEEE Access 2023, 11, 33520–33541. [Google Scholar] [CrossRef]
  10. Zhang, Y.; Shi, X.; Zhang, H.; Cao, Y.; Terzija, V. Review on Deep Learning Applications in Frequency Analysis and Control of Modern Power System. Int. J. Electr. Power Energy Syst. 2022, 136, 107744. [Google Scholar] [CrossRef]
  11. Bitirgen, K.; Filik, Ü.B. A Hybrid Deep Learning Model for Discrimination of Physical Disturbance and Cyber-Attack Detection in Smart Grid. Int. J. Crit. Infrastruct. Prot. 2023, 40, 100582. [Google Scholar] [CrossRef]
  12. Mississippi State University Critical Infrastructure Protection Center, Industrial Control System Cyber Attack Dataset. Available online: https://sites.google.com/a/uah.edu/tommy-morris-uah/ics-data-sets (accessed on 24 April 2023).
  13. Chawla, A.; Agrawal, P.; Panigrahi, B.K.; Paul, K. Deep-Learning-Based Data-Manipulation Attack Resilient Supervisory Backup Protection of Transmission Lines. Neural Comput. Appl. 2023, 35, 4835–4854. [Google Scholar] [CrossRef]
  14. Al-Hinai, A.S. Voltage Collapse Prediction for Interconnected Power Systems. Master’s Thesis, West Virginia University, Morgantown, WV, USA, 2000. [Google Scholar]
  15. Jahangir, H.; Lakshminarayana, S.; Maple, C.; Epiphaniou, G. A Deep Learning-Based Solution for Securing the Power Grid against Load Altering Threats by IoT-Enabled Devices. IEEE Internet Things J. 2023, 10, 10687–10697. [Google Scholar] [CrossRef]
  16. IEEE 14-Bus System. Available online: https://icseg.iti.illinois.edu/ieee-14-bus-system/#:~:text=The (accessed on 5 May 2022).
  17. Pai, A. Energy Function Analysis for Power System Stability; Springer Science & Business Media: Berlin/Heidelberg, Germany, 1989. [Google Scholar]
  18. Radhoush, S.; Vannoy, T.; Liyanage, K.; Whitaker, B.M.; Nehrir, H. Distribution System State Estimation and False Data Injection Attack Detection with a Multi-Output Deep Neural Network. Energies 2023, 16, 2288. [Google Scholar] [CrossRef]
  19. Dolatabadi, S.H.; Ghorbanian, M.; Siano, P.; Hatziargyriou, N.D. An Enhanced IEEE 33 Bus Benchmark Test System for Distribution System Studies. IEEE Trans. Power Syst. 2021, 36, 2565–2572. [Google Scholar] [CrossRef]
  20. Lal, A. IEEE 69 Bus System. Available online: https://www.mathworks.com/matlabcentral/fileexchange/88111-ieee-69-bus-system (accessed on 25 April 2023).
  21. Raghuvamsi, Y.; Teeparthi, K. Detection and Reconstruction of Measurements against False Data Injection and DoS Attacks in Distribution System State Estimation: A Deep Learning Approach. Measurement 2023, 210, 112565. [Google Scholar] [CrossRef]
  22. Vaagensmith, B.; Ulrich, J.; Welch, J.; McJunkin, T.; Rieger, C. IEEE 13 Bus Benchmark Model for Real-Time Cyber-Physical Control and Power Systems Studies. In Proceedings of the 2019 Resilience Week (RWS), San Antonio, TX, USA, 4–7 November 2019; pp. 112–120. [Google Scholar]
  23. IEEE 37-Bus Test System. Available online: http://ewh.ieee.org/soc/pes/dsacom/testfeeders/ (accessed on 25 April 2023).
  24. Biswal, M.; Misra, S.; Tayeen, A.S. Black Box Attack on Machine Learning Assisted Wide Area Monitoring and Protection Systems. In Proceedings of the 2020 IEEE Power & Energy Society Innovative Smart Grid Technologies Conference (ISGT), Washington, DC, USA, 17–20 February 2020. [Google Scholar] [CrossRef]
  25. Berghout, T. Training a Deep Network for Adversarial Attacks Mitigation: The Case of Smart Grids. Zenodo 2023. [Google Scholar] [CrossRef]
  26. Biswal, M.; Misra, S.; Tayeen, A.S. Black Box Attack on Machine Learning Assisted Wide Area Monitoring and Protection Systems. Dryad 2021. [Google Scholar] [CrossRef]
  27. Iandola, F.N.; Han, S.; Moskewicz, M.W.; Ashraf, K.; Dally, W.J.; Keutzer, K. SqueezeNet: AlexNet-Level Accuracy with 50× Fewer Parameters and <0.5MB Model Size. In Proceedings of the ICLR 2017 Conference, Toulon, France, 24–26 April 2017. [Google Scholar]
  28. Goodfellow, I.J.; Shlens, J.; Szegedy, C. Explaining and Harnessing Adversarial Examples. arXiv 2014, arXiv:1412.6572. [Google Scholar]
  29. Kurakin, A.; Goodfellow, I.; Bengio, S. Adversarial Examples in the Physical World. arXiv 2016, arXiv:1607.02533v4. [Google Scholar]
  30. Murali, V.; Sudeep, P.V. Image Denoising Using DnCNN: An Exploration Study. In Advances in Communication Systems and Networks; Springer: Singapore, 2020; pp. 847–859. [Google Scholar]
  31. Dhanachandra, N.; Manglem, K.; Chanu, Y.J. Image Segmentation Using K -Means Clustering Algorithm and Subtractive Clustering Algorithm. Procedia Comput. Sci. 2015, 54, 764–771. [Google Scholar] [CrossRef] [Green Version]
  32. Dalal, N.; Triggs, B. Histograms of Oriented Gradients for Human Detection. In Proceedings of the 2005 IEEE Computer Society Conference on Computer Vision and Pattern Recognition (CVPR’05), San Diego, CA, USA, 20–25 June 2005; Volume 1, pp. 886–893. [Google Scholar]
  33. Donoho, D.L. De-Noising by Soft-Thresholding. IEEE Trans. Inf. Theory 1995, 41, 613–627. [Google Scholar] [CrossRef] [Green Version]
  34. Johnstone, I.M.; Silverman, B.W. Needles and Straw in Haystacks: Empirical Bayes Estimates of Possibly Sparse Sequences. Ann. Stat. 2004, 32, 1594–1649. [Google Scholar] [CrossRef] [Green Version]
  35. Blázquez-García, A.; Conde, A.; Mori, U.; Lozano, J.A. A Review on Outlier/Anomaly Detection in Time Series Data. arXiv 2020, arXiv:2002.04236v1. [Google Scholar] [CrossRef]
  36. Chawla, N.V.; Bowyer, K.W.; Hall, L.O.; Kegelmeyer, W.P. SMOTE: Synthetic Minority Over-Sampling Technique. J. Artif. Intell. Res. 2002, 16, 321–357. [Google Scholar] [CrossRef]
  37. Tharwat, A. Classification Assessment Methods. Appl. Comput. Inform. 2021, 17, 168–192. [Google Scholar] [CrossRef]
Figure 1. Multilevel donut chart summarizing outcomes from related works.
Electronics 12 02554 g001
Figure 2. Illustrating color maps of pseudo-color images from PMUs: (a) case of generator fault; (b) case of loss of generation; and (c) case of synchronous motor switching off.
Electronics 12 02554 g002
Figure 3. Methodology of proposed adversarial attacks’ design, data processing, and learning scheme: (a) generating untargeted adversarial attacks; (b) generating targeted adversarial attacks; (c) feature engineering stages; and (d) training and evaluation process based on deep learning models.
Electronics 12 02554 g003
Figure 4. Data processing first stage results of different steps: (a) original data; (b) denoising with the convolutional neural network; (c) k-means clustering; and (d) histogram-oriented gradient.
Electronics 12 02554 g004
Figure 5. Data processing second stage results of extracted features: (a) histogram-oriented gradient features; (b) extracted features of faults events; (c) extracted features of generation loss events; and (d) extracted features of synchronous motor switching off events.
Electronics 12 02554 g005
Figure 6. Scatters of processed data: (a) clean dataset; (b) corrupted dataset with untargeted adversarial attacks; and (c) corrupted dataset with targeted adversarial attacks.
Electronics 12 02554 g006
Figure 7. Resulted confusion matrices: (a) first scenario case; (b) second scenario case; and (c) third scenario case.
Electronics 12 02554 g007
Table 1. Works related to monitoring smart grids in the presence of cyberthreats using PMU data and deep learning.
Ref.Feature EngineeringComplexityUnavailability Drift AttackDataset/SystemTools
[11]
  • False data injection.
  • Power system datasets [12].
  • Long short-term memory;
  • Convolutional neural networks;
  • Particle swarm optimization.
[13]
  • False data injection.
  • WSCC 9-Bus system [14].
  • Long short-term memory;
  • Generative adversarial imputation networks;
  • Random forest.
[15]
  • Dynamic load-altering attacks.
  • IEEE 14 and IEEE-39 bus systems [16,17].
  • Two-dimensional convolutional neural network;
  • Reconstruction decoder.
[18]
  • False data injection.
  • IEEE 33-bus system and IEEE 69-bus system [19,20].
  • Multilayer perceptron.
[21]
  • False data injection and denial of service.
  • IEEE 13-bus and IEEE 37-bus system [22,23].
  • Temporal convolutional denoising autoencoder;
  • Attention mechanism.
This work
  • False data injection and denial of service.
  • Pseudo image dataset [24].
  • Long short-term memory.
Table 2. Final results from three application scenarios.
Accuracy (%)Recall (%)Precision (%)F1 Score (%)
Scenario IThis study100100100100
[24]98---
Scenario IIThis study60.1960.19--
[24]----
Scenario IIIThis study91.6791.6792.9493.33
[24]88.06---
Disclaimer/Publisher’s Note: The statements, opinions and data contained in all publications are solely those of the individual author(s) and contributor(s) and not of MDPI and/or the editor(s). MDPI and/or the editor(s) disclaim responsibility for any injury to people or property resulting from any ideas, methods, instructions or products referred to in the content.

