Article

Analyzing Accurate Egocentric Distance Estimates of University Students in Virtual Environments with a Desktop Display and Gear VR Display

1
Department of Information Technology and Its Applications, Faculty of Information Technology, University of Pannonia, Gasparich M. utca 18/A, 8900 Zalaegerszeg, Hungary
2
Department of Basic Technical Studies, Faculty of Engineering, University of Debrecen, Ótemető utca 2, 4028 Debrecen, Hungary
*
Author to whom correspondence should be addressed.
Electronics 2023, 12(10), 2253; https://doi.org/10.3390/electronics12102253
Submission received: 10 March 2023 / Revised: 12 May 2023 / Accepted: 12 May 2023 / Published: 15 May 2023

Abstract

:
The perception of distances is crucial in both the real world and virtual environments. However, distances can be incorrectly estimated in the latter one, and they can be affected by technological and human factors. We created a virtual environment to take a step toward understanding this phenomenon. We assessed the egocentric distance estimation skills of 239 university students at 10 various distances between 25 cm and 160 cm at 15 cm intervals. A desktop display was used by 157 students, while the Gear VR display was used by 72 students. The effects of the following factors were analyzed: gender, height, dominant arm, previous VR experience, gaming hours per week, whether the participants wore glasses, their field of study, and display device. Logistic regression analysis was performed to assess their influences on the probabilities of accurate distance estimates, while linear regression analysis was conducted to examine their effects on estimation times. The results show that except for the factors of whether the participants wore glasses and their field of study, the probabilities of accurate distance estimates can be affected along with estimation times themselves.

1. Introduction

Egocentric distance estimation can be defined as the distance from an observer to an object. This type of distance estimation is part of spatial perception, which, in turn, is one of the five components that comprise spatial intelligence [1]. Naturally, it is essential in the modern age since it is required for different fields of work [2,3] and several other tasks, such as reaching and grasping [4]. However, since spatial perception is a cognitive skill, it is possible to train it over time [5,6]. According to the literature, even simple tasks, such as exercise [7], sports [8,9], or playing video games [10,11], can improve this skill.
With the advent of virtual reality (VR), these skills can even be trained in virtual environments (VEs) [12]. This is possible since these virtual spaces can enhance certain cognitive functions [13,14]. Thus, visuospatial skills can be enhanced in them. Consequently, VR has several other advantages since it redefines human–computer interfaces [15,16,17,18,19,20,21]. In addition, VR is also popular in education [22,23,24], military [25], training [26,27,28], medical applications [29,30,31], and even entertainment [32,33]. Nonetheless, because human–computer interfaces are redefined, interaction can differ among VR applications [34]. Humans also play an important role in a VR system [35] and are equally important as other components, such as I/O devices and the VE’s composition [36,37,38]. Due to this fact, several factors should be considered when designing virtual spaces [39]. Focus should also be on humans during the design process [40]. It can also be said that cognition is an important part of VR systems [41,42].
Since a VR system is complex, technical, compositional, and human factors, as well as distances themselves, can affect egocentric distance estimation. However, distances are usually underestimated in virtual spaces [43,44]. This fact is quite important, as accuracy and precision are needed for several tasks. For example, estimation has to be precise when playing sports such as soccer or in healthcare when conducting remote surgery. Regarding display devices, several studies established the crucial importance of binocular disparity [45,46,47]. Composition is also an important factor since it can affect distance estimation, meaning that graphics, visual cues, textures, and even virtual avatars can influence distance estimation [48,49,50,51,52,53,54,55,56,57,58,59,60]. Distances themselves also have effects on estimates; for example, up to approximately 1 m, distances are usually overestimated [61,62,63]. Accurate estimates can even occur up to 55 cm [64].
In addition to these, some human factors play a role in influencing the egocentric distance estimation process. According to the study by Murgia and Sharkey [49], experience with Cave Automatic Virtual Environment (CAVE) systems had a marginally significant effect on distance-matching accuracy. These CAVE systems usually consist of a cube-shaped VR room or multiple projection screens. They also assessed the effect of participants’ height, but they did not find significant effects. Nevertheless, if the height of the virtual camera is manipulated, it could have an influence [65]. Age can also play a role in affecting distance estimation [66]: compared with adults and 12-year-old children, 10-year-old children produced significantly shorter imagined walking time estimates. Yet, according to Bian and Andersen, the distance estimates became more accurate as age increased [67]. Some studies indicated that gender did not seem to have significant effects on distance estimation [68,69,70]. However, according to the study by Foreman et al. [71], the distance underestimations of males were significantly lower than those of females at all distances. Coelho et al. concluded that gender had effects when estimating smaller distances [72]. Clearly, the effect of gender was not easily understandable. Regarding height, the previously referenced study also strengthened the fact that it did not affect estimating distances.
As can be observed, many factors have an effect on egocentric distance estimation. However, the effects of other certain human factors are not known. These include dominant arm; whether one wears glasses; what one studies at the university; the number of hours per week one plays video games; and previous experience with VR technologies. These factors can also be paired with immersion level. Even estimation time could be analyzed since there is a possibility that they can be influenced as well. Thus, to build upon the scientific literature, we investigated how these and other previously examined human factors influence egocentric distance estimation and its time at multiple distances. We also included immersion levels in the analyses due to the various display devices. To achieve this, we developed a VE which can be used with two types of display devices: a desktop display and a Gear VR display. Thus, the following two research questions (RQs) were formed:
  • RQ1: Are the probabilities of accurate egocentric distance estimates affected by human characteristics at different immersion levels?
  • RQ2: Are egocentric distance estimation times affected by human characteristics at different immersion levels?
Thus, the structure of the article is the following. The materials and methods used in this research are shown in Section 2; this includes the VE itself, data collection, and analysis, which are presented in detail. Section 3 shows the results of the investigation. These results are discussed in Section 4, and conclusions are drawn in Section 5.

2. Materials and Methods

Three subsections are presented in this section: the first presents the developed VE, the second one details data collection using the mentioned virtual space, and the third one shows the analysis of data.

2.1. The Virtual Environment

To answer our research questions, a VE was implemented using Unity (version 2018.4.36f1). By using this VE, it was possible to assess the participants’ egocentric distance estimation ability in VR. Two versions were developed regarding this VE: an immersive VR version (on Android) and a non-immersive desktop display version. In this paper, the latter is referred to as the PC version. It also runs on a Windows operating system, while the VR version uses the Gear VR head-mounted display. A Samsung Galaxy S6 Edge+ smartphone was placed inside it. This version can be controlled using the smartphone’s gyroscope by rotating the user’s head and tapping the touchpad on the right side of the head-mounted display, while the PC version can be controlled using a keyboard and mouse. The participants could not move in the VE, as their movements were not tracked. The immersion level and the controls of the two systems were different, which represented the only difference between them.
The VE consisted of a room that was 12 m wide on both the x and z axes. The participants were placed in the middle of the room, such that the egocentric distance to the walls was 6 m in each direction. This distance did not change during the tests. It should also be noted that the virtual camera was placed at the real height of the participants. Screenshots of the VE can be seen in Figure 1.
As can be observed in Figure 1, there was an object on the ground in front of the participants. This object could be either a cube, cylinder, or sphere, and it was placed between 25 cm and 160 cm away from the participants at 15 cm intervals. Therefore, 10 different distances had to be estimated, one per round. The order of object placements was randomized, and they had to be estimated twice at each distance. Thus, the egocentric tests consisted of 20 rounds. The first 10 estimates were without a scale on the ground, and the second 10 estimates occurred with a scale on the ground, as illustrated in Figure 1. There were 17 cubes on the scale, and the size of each was 10   cm × 10   cm × 10   cm , starting from the participant.

2.2. Data Collection

Data collection was performed in the fall of 2022. Two Hungarian universities participated in the data collection process, the University of Pannonia and the University of Debrecen. The participants at the University of Pannonia were IT students ( N = 72 , M a g e = 22.51 , S D a g e = 6.63 ), and they used the Gear VR version of the VE. The participants at the University of Debrecen were either civil engineering students ( N = 81 , M a g e = 19.72 , S D a g e = 2.32 ), mechanical engineering students ( N = 27 ,   M a g e = 20.18 , S D a g e = 2.45 ), or vehicle engineering students ( N = 49 , M a g e = 19.71 ,   S D a g e = 1.34 ). These various engineering students used the desktop display version. Therefore, the studies of the students and the display devices employed were different between the two universities. It is important to note that these participants determined the measurements of their own volition. We also received verbal consent from them before the measurement process started. No names were gathered during the process; only a number (in ascending order) was attached to each line of measurement in the dataset. The data that the participants had to enter in the main menu were the following: age, height, gender, dominant arm, whether they wore glasses, whether they had previous VR experience, their field of study, and how many hours per week of video games they played. Thus, the participants could not be identified from the collected dataset.
Upon entering the data, each participant was briefed on the procedure. We instructed them on how to look around the virtual room and how to estimate in the respective version of the VE. We also informed them of the room’s dimensions and scale’s dimensions. However, the investigated distances and the 15 cm intervals were not revealed to them. When they clicked on the start button, they were placed into the middle of the VE. To estimate egocentric distances, the participants had to write numbers in the input box for the PC version simply by pressing the corresponding keys on the keyboard; it was not necessary to click on it. Lastly, they had to look up at the ceiling and press enter. Then, the following round began with another object at another distance. The VR version was slightly different: there was no input box since it was difficult to write numbers while estimating distances. Thus, participants had to verbally estimate distances, and one of the researchers entered it into a file at the same moment. Thus, in each case, the estimates had to be typed during the measurements. If the participants completed the estimation process and the researcher typed the estimates, students still had to look up at the ceiling and press the touchpad on the right side of the Gear VR head-mounted display to advance to the next round. This is the point where the time of the estimation process was saved in each round, and it provided a basis for comparison. When all 20 rounds were completed, the egocentric distance estimation tests were finished.
When one round was completed, the application saved the data into a CSV file. Each line of data contained all factors regarding the respective round, i.e., the human factors, actual distances, estimates, estimation time, and other factors regarding the VE itself. In the case of the VR version, the estimates that the researchers wrote previously during the measurements were copied to this file.

2.3. Data Analysis

First, we had to determine whether an estimate was accurate; we considered estimates to be accurate if they were ± 10 % of the actual distance. Thus, in the entire dataset, 1529 estimates were accurate, while 3051 were not. The distributions of the data regarding accuracy were assessed with the Shapiro–Wilk normality test. The entire dataset did not follow a Gaussian distribution ( W = 0.595 ,   p < 0.001 ). The same can be observed when the dataset was grouped by display devices since neither the results on the desktop display ( W = 0.587 ,   p < 0.001 ) nor the Gear VR version ( W = 0.608 ,   p < 0.001 ) followed a Gaussian distribution.
Before starting the analyses, groups were created on the basis of heights and gaming hours per week. Eleven groups were created of the former and six of the latter. The minimum and maximum values of the heights were identified: 150 cm and 202 cm, respectively. Thus, the height groups were created between these values, at intervals of five centimeters (150–154 cm, 155–159 cm, and so on). The groups based on gaming hours per week were the following: 0 h, 1–2 h, 3–4 h, 5–10 h, 11–19 h, and 20 or more hours. These divisions were chosen on an empirical basis.
For the investigation, the entire dataset was used. Thus, the results with or without a scale were not distinguished from each other. We chose α = 0.05 for the significance level, i.e., the error of rejecting the null hypothesis when it was true. The process began with one-by-one analyses. First, the effects of the factors were examined at the mentioned distances. If a factor had no significant effects on the probability of accurately estimating distances, it was omitted from further analyses. Then, the investigation continued in pairs. Since we wanted to focus on the different display devices, we paired each factor with the investigated display devices. Afterward, the investigation continued in triplets and concluded in quartets. However, no significant effects were found in the case of quartets.
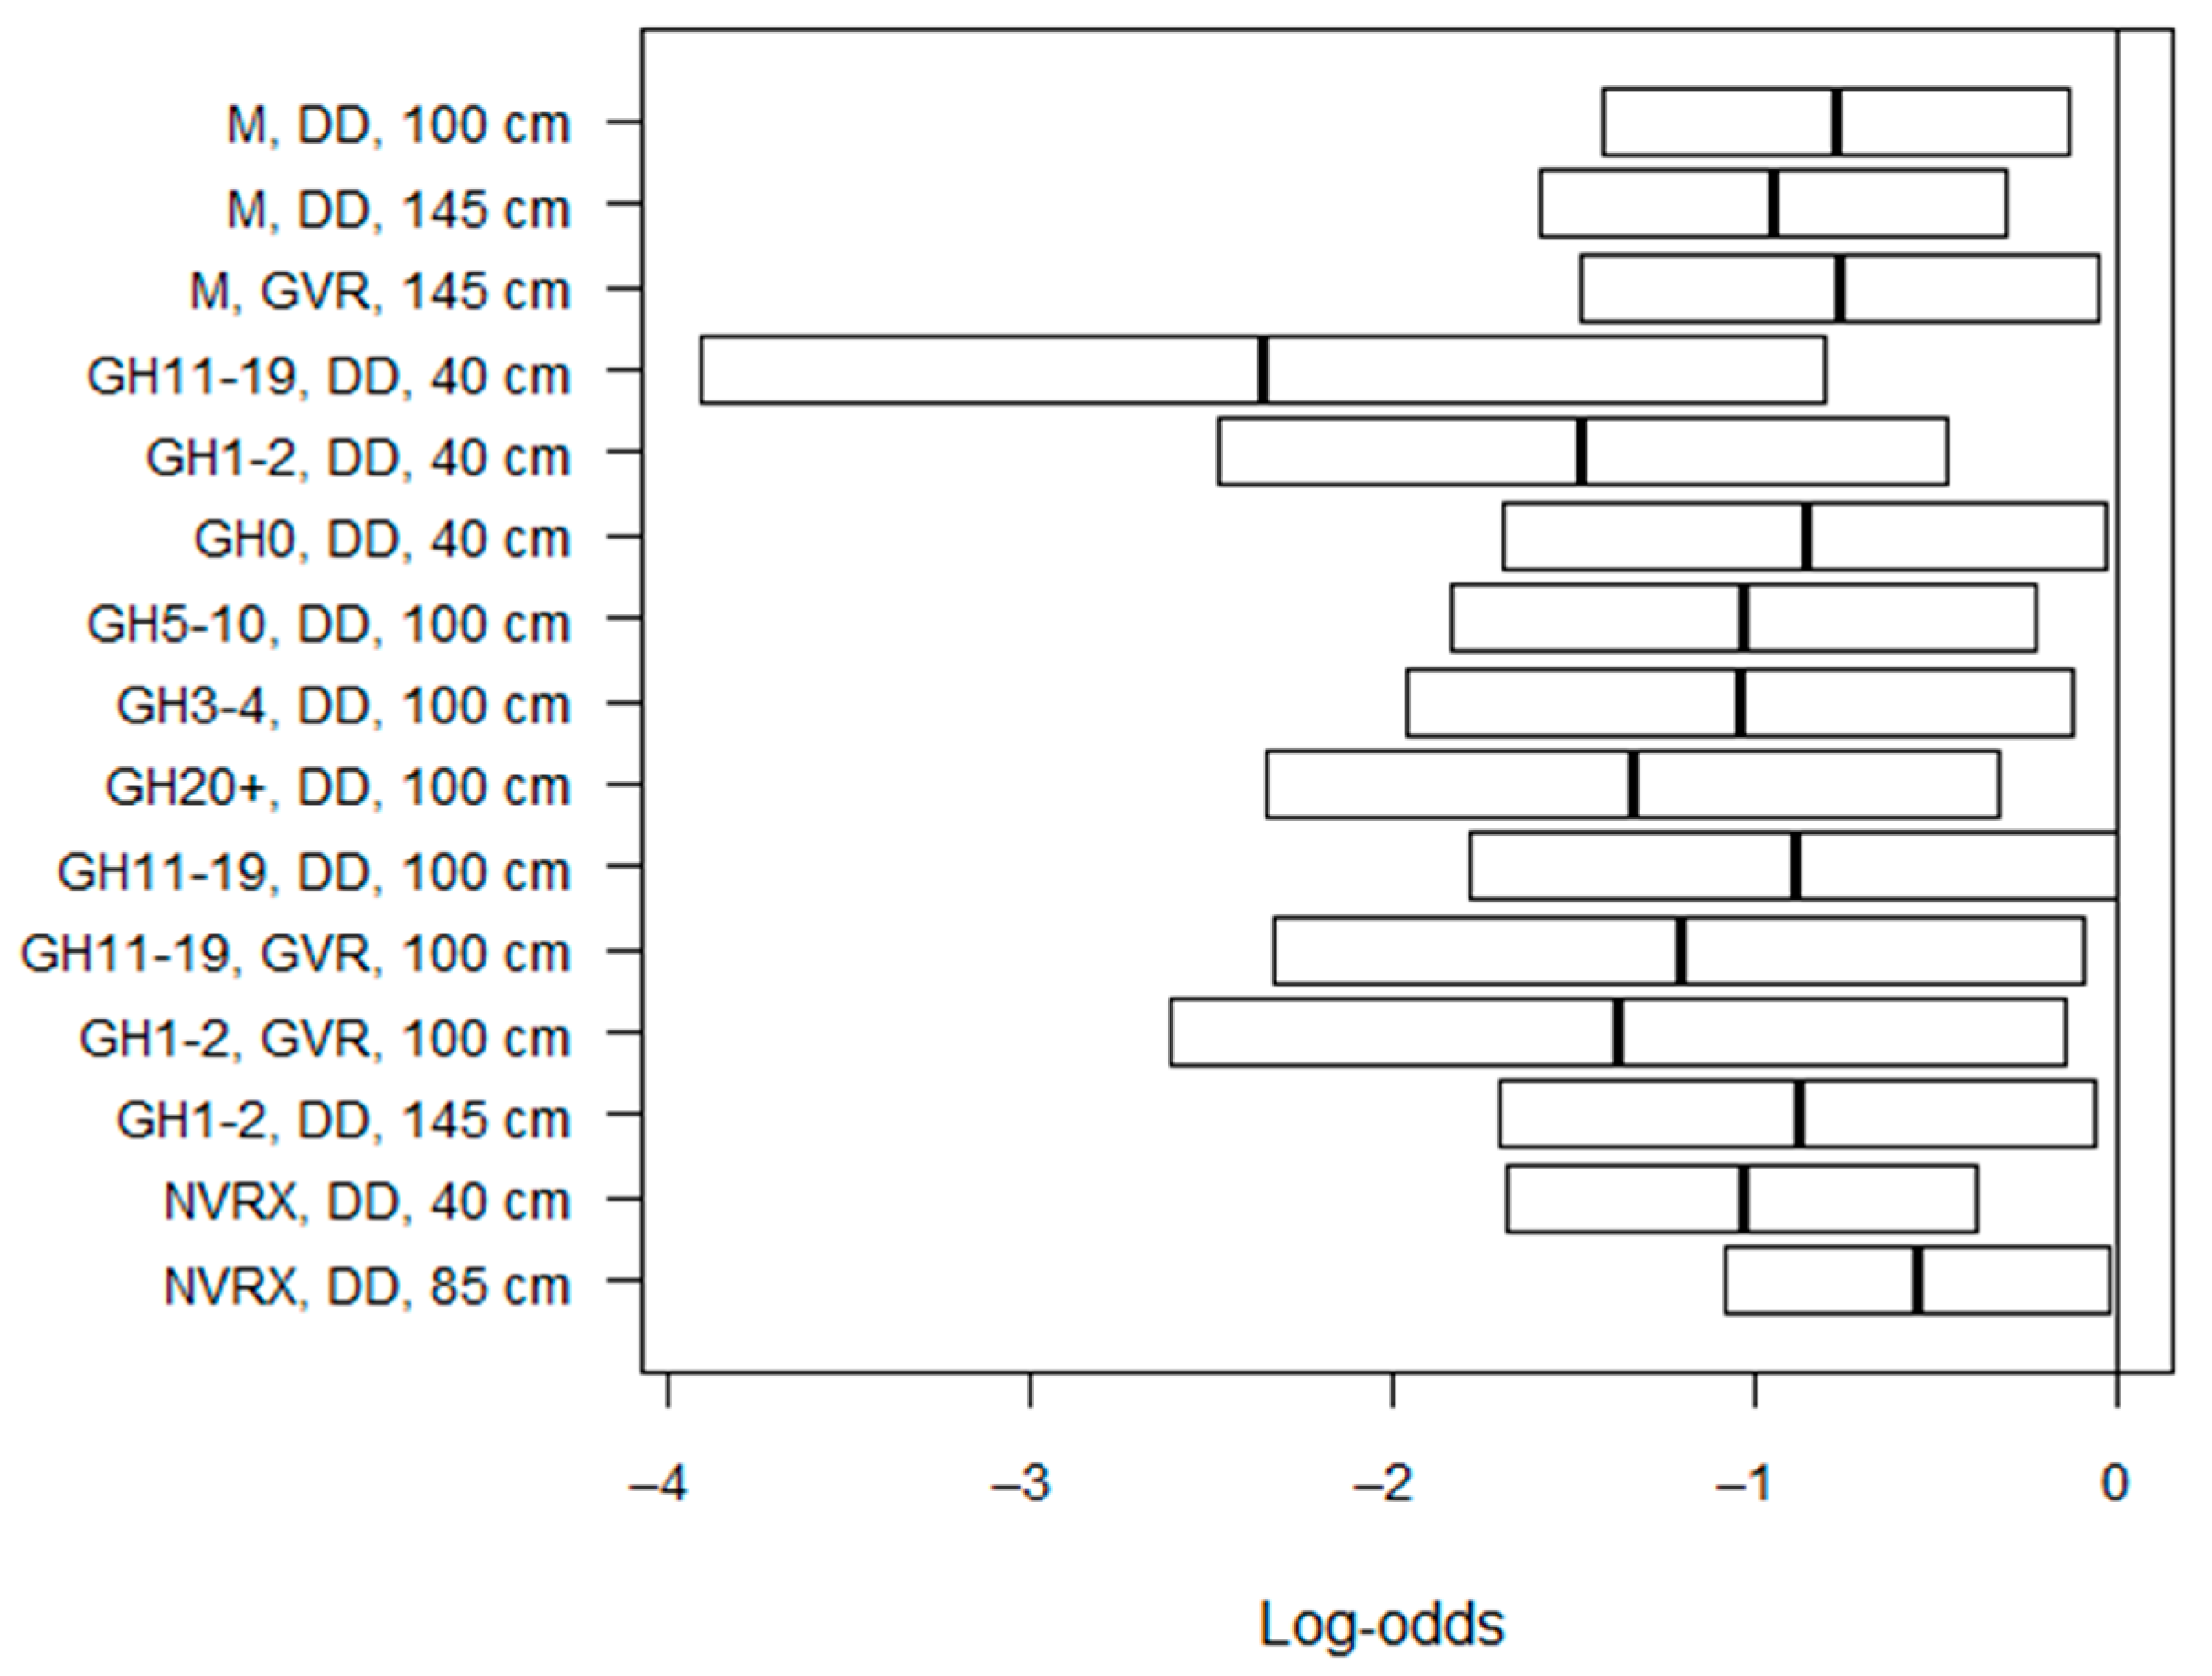
To examine the probability of accurate egocentric distance estimates, logistic regression analysis was used [73]. This method transforms the probabilities into the interval by a monotone increase and invertible transformation ( , + ). Consequently, linear regression models are fitted to the transformed values. The effects can be interpreted from the estimated coefficients: if they vary significantly from zero, an effect can be observed. Naturally, the sign of the coefficients reveals the direction of the effects. The log-odds returned by the logistic regression method can be converted to an odds ratio, which can further be converted to percentages with Equations (1) and (2):
O R = e L O
% = ( O R 1 ) 100 ,
where O R denotes odds ratio, and L O denotes log-odds. The former is used to express the relative change of an event in the case of two different conditions. The latter is the logarithm of the odds ratio, which provides a better range of values. Consequently, the greater the odds, the greater the log-odds, and vice versa. Logistic regression analysis was conducted separately at each investigated distance. The basis variables for these analyses were chosen automatically by R.
When analyzing the correlation between accurate distance estimates and estimation times, the Spearman rank correlation method was used.

3. Results

This section is divided into two subsections: the effects of human factors on the probabilities of accurate egocentric distance estimates are presented in the first one, while the effects of human factors on egocentric distance estimation times are shown in the second one. The results are shown using 95% confidence intervals (CIs). The descriptive statistics can be found in Table A1, Table A2, Table A3, Table A4, Table A5, Table A6, Table A7 and Table A8 and Figure A1, Figure A2, Figure A3, Figure A4, Figure A5, Figure A6, Figure A7 and Figure A8 in the Appendix A . To conserve space, the following abbreviations are used in the forthcoming figures:
  • M, male;
  • F, female;
  • LH, left-handed;
  • RH, right-handed;
  • DD, desktop display;
  • GVR, Gear VR display;
  • H, height (e.g., H150–154 denotes heights between 150 cm and 154 cm);
  • GH, gaming hours per week (e.g., GH3–4 denotes playing 3–4 h per week of video games);
  • VRX, VR experience;
  • NVRX, no VR experience.

3.1. Analysis of the Effects of Human Factors on the Probabilities of Accurate Distance Estimates

In this section, the results regarding the effects of human factors on the probabilities of accurate distance estimates are presented. The following subsubsections detail the results of the mentioned analyses.

3.1.1. One-by-One Analyses

First, the factors were investigated one-by-one at every distance. Only the significant results of this investigation are shown in Figure 2. As can be observed, four factors did not have significant effects on the probability of accurate estimates: dominant arm, height, whether the participants wore glasses, and their field of study. Thus, they were excluded from further analyses. Only the factors of gender, gaming hours per week, and whether one had previous VR experience had significant effects.
From the one-by-one analyses, it can be observed that significant effects occurred only at three distances: 40 cm, 100 cm, and 145 cm. Compared with females, males were 41.68% less likely to accurately estimate distances at 100 cm. At 145 cm, this percentage was 46.26%. The case was similar when the gaming hours of participants were assessed. Compared with the basis variable of zero hours per week, those who played 11–19 h per week were less likely to accurately estimate distances, by 65.94% at 40 cm. Similarly, those who played 1–2 h per week were less likely to accurately estimate distances, by 64.97% and 55.38% at distances of 40 cm and 145 cm, respectively. However, those who had previous experience with VR were more likely to be accurate at 40 cm, by 68.55%.

3.1.2. Analyses in Pairs

Afterward, the analyses examined pairs at every distance. Each factor was paired with the display device in every possible combination. The results of the examination can be found in Figure 3.
As can be observed, no factors had significant positive effects on accuracy. The significant ones decreased only the probability of accurate distance estimates. The largest decrease in probability was when those who played 11–19 h per week used a desktop display to estimate objects at 40 cm: they were less likely to estimate distances correctly, by 90.52%. The basis variable was the pair of zero hours of gaming per week and using the Gear VR device. The remaining significant effects were greater than 40%.

3.1.3. Analyses in Triplets

Triplets were the next to be investigated. As in the case of pairs, no triplet was found that significantly increased the probability of accurate egocentric distance estimation. As previously in the case of pairs, all possible combinations of triplets were investigated. To provide better readability, the analyses and figures are split into three parts. The first of these was the triplet of gender, gaming hours per week, and display device. The results of this first triplet can be seen in Figure 4.
The basis variable was the triplet of female, zero gaming hours, and desktop display at every distance. It can be seen that in almost all significant cases, males were less likely to answer correctly under certain conditions. The largest decrease in probabilities occurred when they played 11–19 h per week and used a desktop display for estimating objects at 40 cm. This provided a 91.57% decrease. The second largest decrease was in the case of females. Thus, females who played 1–2 h per week were less likely to accurately estimate distances at 145 cm, by 87.49%, when using a desktop display. However, all significant decreases were large. Even the smallest one was 64.84%, which was observed when males who played zero hours per week estimated distances at 85 with a desktop display.
The second triplet investigated was gender, previous VR experience, and display device. The results of the investigation can be observed in Figure 5.
The basis variable was the triplet of female, no VR experience, and Gear VR at every distance. According to the results, males who used a desktop display with no previous VR experience were the least likely to accurately estimate distances, by 70.60%, which was observed at 40 cm. Regarding the remaining triplets with significant effects, their percentages were similar to each other, falling between 57.49% and 59.93%.
Lastly, the third triplet investigated was the gaming hours, previous VR experience, and display device. The results showed that 16 triplets had significant effects on the probabilities of accurate estimates. These can be observed in Figure 6.
The basis variable was the triplet of zero gaming hours per week, no previous VR experience, and the Gear VR device. Compared with this basis variable, the following results were observed. Those who played 1–2 h per week were less likely to estimate distances at 55 cm, by 88.88%. This was the largest decrease in probabilities. The second largest decrease was when people played 11–19 h per week, had no previous VR experience, and used the Gear VR device. They were less likely to correctly estimate distances at 100 cm, by 84.85%. When these triplets of factors were examined, it could be observed that all percentages were quite large; even the smallest significant decrease was 62.49%.

3.1.4. Analyses in Quartets

Lastly, the investigation examined quartets of factors. All possible combinations of quartets were examined. However, no significant effects were found on the probabilities of accurate egocentric distance estimates.

3.2. Analyses of the Effects of Human Factors on Distance Estimation Time

This section presents the results of the analyses regarding the effects of human factors on distance estimation time. However, before assessing these mentioned effects, it was examined whether distance estimation time correlated with the probability of accurate distance estimates. According to the results of the correlation analysis, no correlation was found between them ( r s ( 4578 ) = 0.067 , p < 0.001 ). When similar investigations were carried out grouped by display devices, the results were quite similar. No correlation was found in the PC version ( r s ( 3138 ) = 0.075 , p < 0.001 ). As can be seen, while the p-value was significant, the strength of the correlation was very weak. Similarly, in the VR version, no correlation was found ( r s ( 1438 ) = 0.000 , p = 0.989 ) between these variables. Thus, there was no correlation between completion times and accurate distance estimates.

3.2.1. One-by-One Analyses

Similar to the previous examination type, the analyses began by investigating only one factor at a time. The results showed that the gender of participants and whether they wore glasses did not have a significant effect on distance estimation time. Thus, these factors were omitted from further analyses. In addition, it should be noted that IT students and the display device had effects at every distance. Only IT students used Gear VR, and no significant effects could be observed among those three types of engineering students who used the desktop display; thus, the factor regarding studies was also omitted. The results of this investigation can be observed in Figure 7.
It can be observed in Figure 7 that right-handed students were significantly faster at two distances (70 cm and 100 cm), and those who had previous VR experience were significantly faster when estimating distances at 25 cm. All others were significantly slower. However, it can be quickly noticed that the desktop display had a significant effect on time. Those who estimated distances with it were significantly slower compared with those who used Gear VR.

3.2.2. Analyses in Pairs

Afterward, the investigation examined the pairs of factors. Similarly, when analyzing the probabilities of accurate egocentric distance estimates, all factors were combined with each desktop display to create the pairs. The results can be observed in Figure 8.
It can be noticed easily from Figure 8 that each significant pair contained the desktop display. By using this display device, estimation times were significantly increased. The two largest increases included the heights of participants between 155 cm and 159 cm. This could also be observed when only one factor was investigated.

3.2.3. Analyses in Triplets

The following step was to analyze triplets of factors. The first two factors were combined in every possible combination, while the display device was always the fixed third factor. By using this method, 97 triplets were found that had a significant effect on distance estimation time. These factors can be seen in Figure 9.
As can be observed in Figure 9, the desktop display still had a significant effect, and each of them increased the distance estimation times. However, the three significant ones can be found with the Gear VR device when analyzing triplets of factors. All three decreased estimation times, and all could be observed at 55 cm.

3.2.4. Analyses in Quartets

The following step was the analysis of quartets. We found 128 quartets that had significant effects on estimation times, as can be seen in Figure 10. It should be noted that due to the large number of quartets as well as quintets, many of them contained small sample sizes ( 20 ). Due to this fact, the results presented in this and the next subsubsection should be interpreted with caution.
The effect of the display device on estimation times was still clear, and the desktop display still increased the times significantly. There were eight cases where the times were significantly decreased when using the desktop display. In all of these cases, the participants played video games for at least one hour per week. All of these mentioned effects occurred when estimating objects at 40 cm.

3.2.5. Analyses in Quintets

Lastly, the effects of quintets of factors were investigated on egocentric distance estimation times. Similar to the previous results, the display device was still a fixed factor in each combination of quintets. The results showed that 76 quintets had significant effects on these times. These are shown in Figure 11.
The results in Figure 11 are quite similar to those presented in Figure 10. The desktop display still significantly increased estimation times, except for 12 cases, and the significant decreases occurred only at 40 cm. No other relation or rule could be found regarding the decreases when the desktop display was used.

4. Discussion

As was mentioned in the introductory section, several types of factors can affect egocentric distance estimation. These factors include compositional, technical, and human factors. We investigated the effects of the combination of technical and human factors in this article. On the basis of the results, our research questions were answered.
The first human factor that we discussed was gender. According to some studies, it did not have a significant influence on distance estimation [68,69,70]. On the other hand, according to Foreman et al. [71], distance underestimations of males were significantly lower than those of females at all distances. Coelho et al. stated that gender had effects when estimating smaller distances [
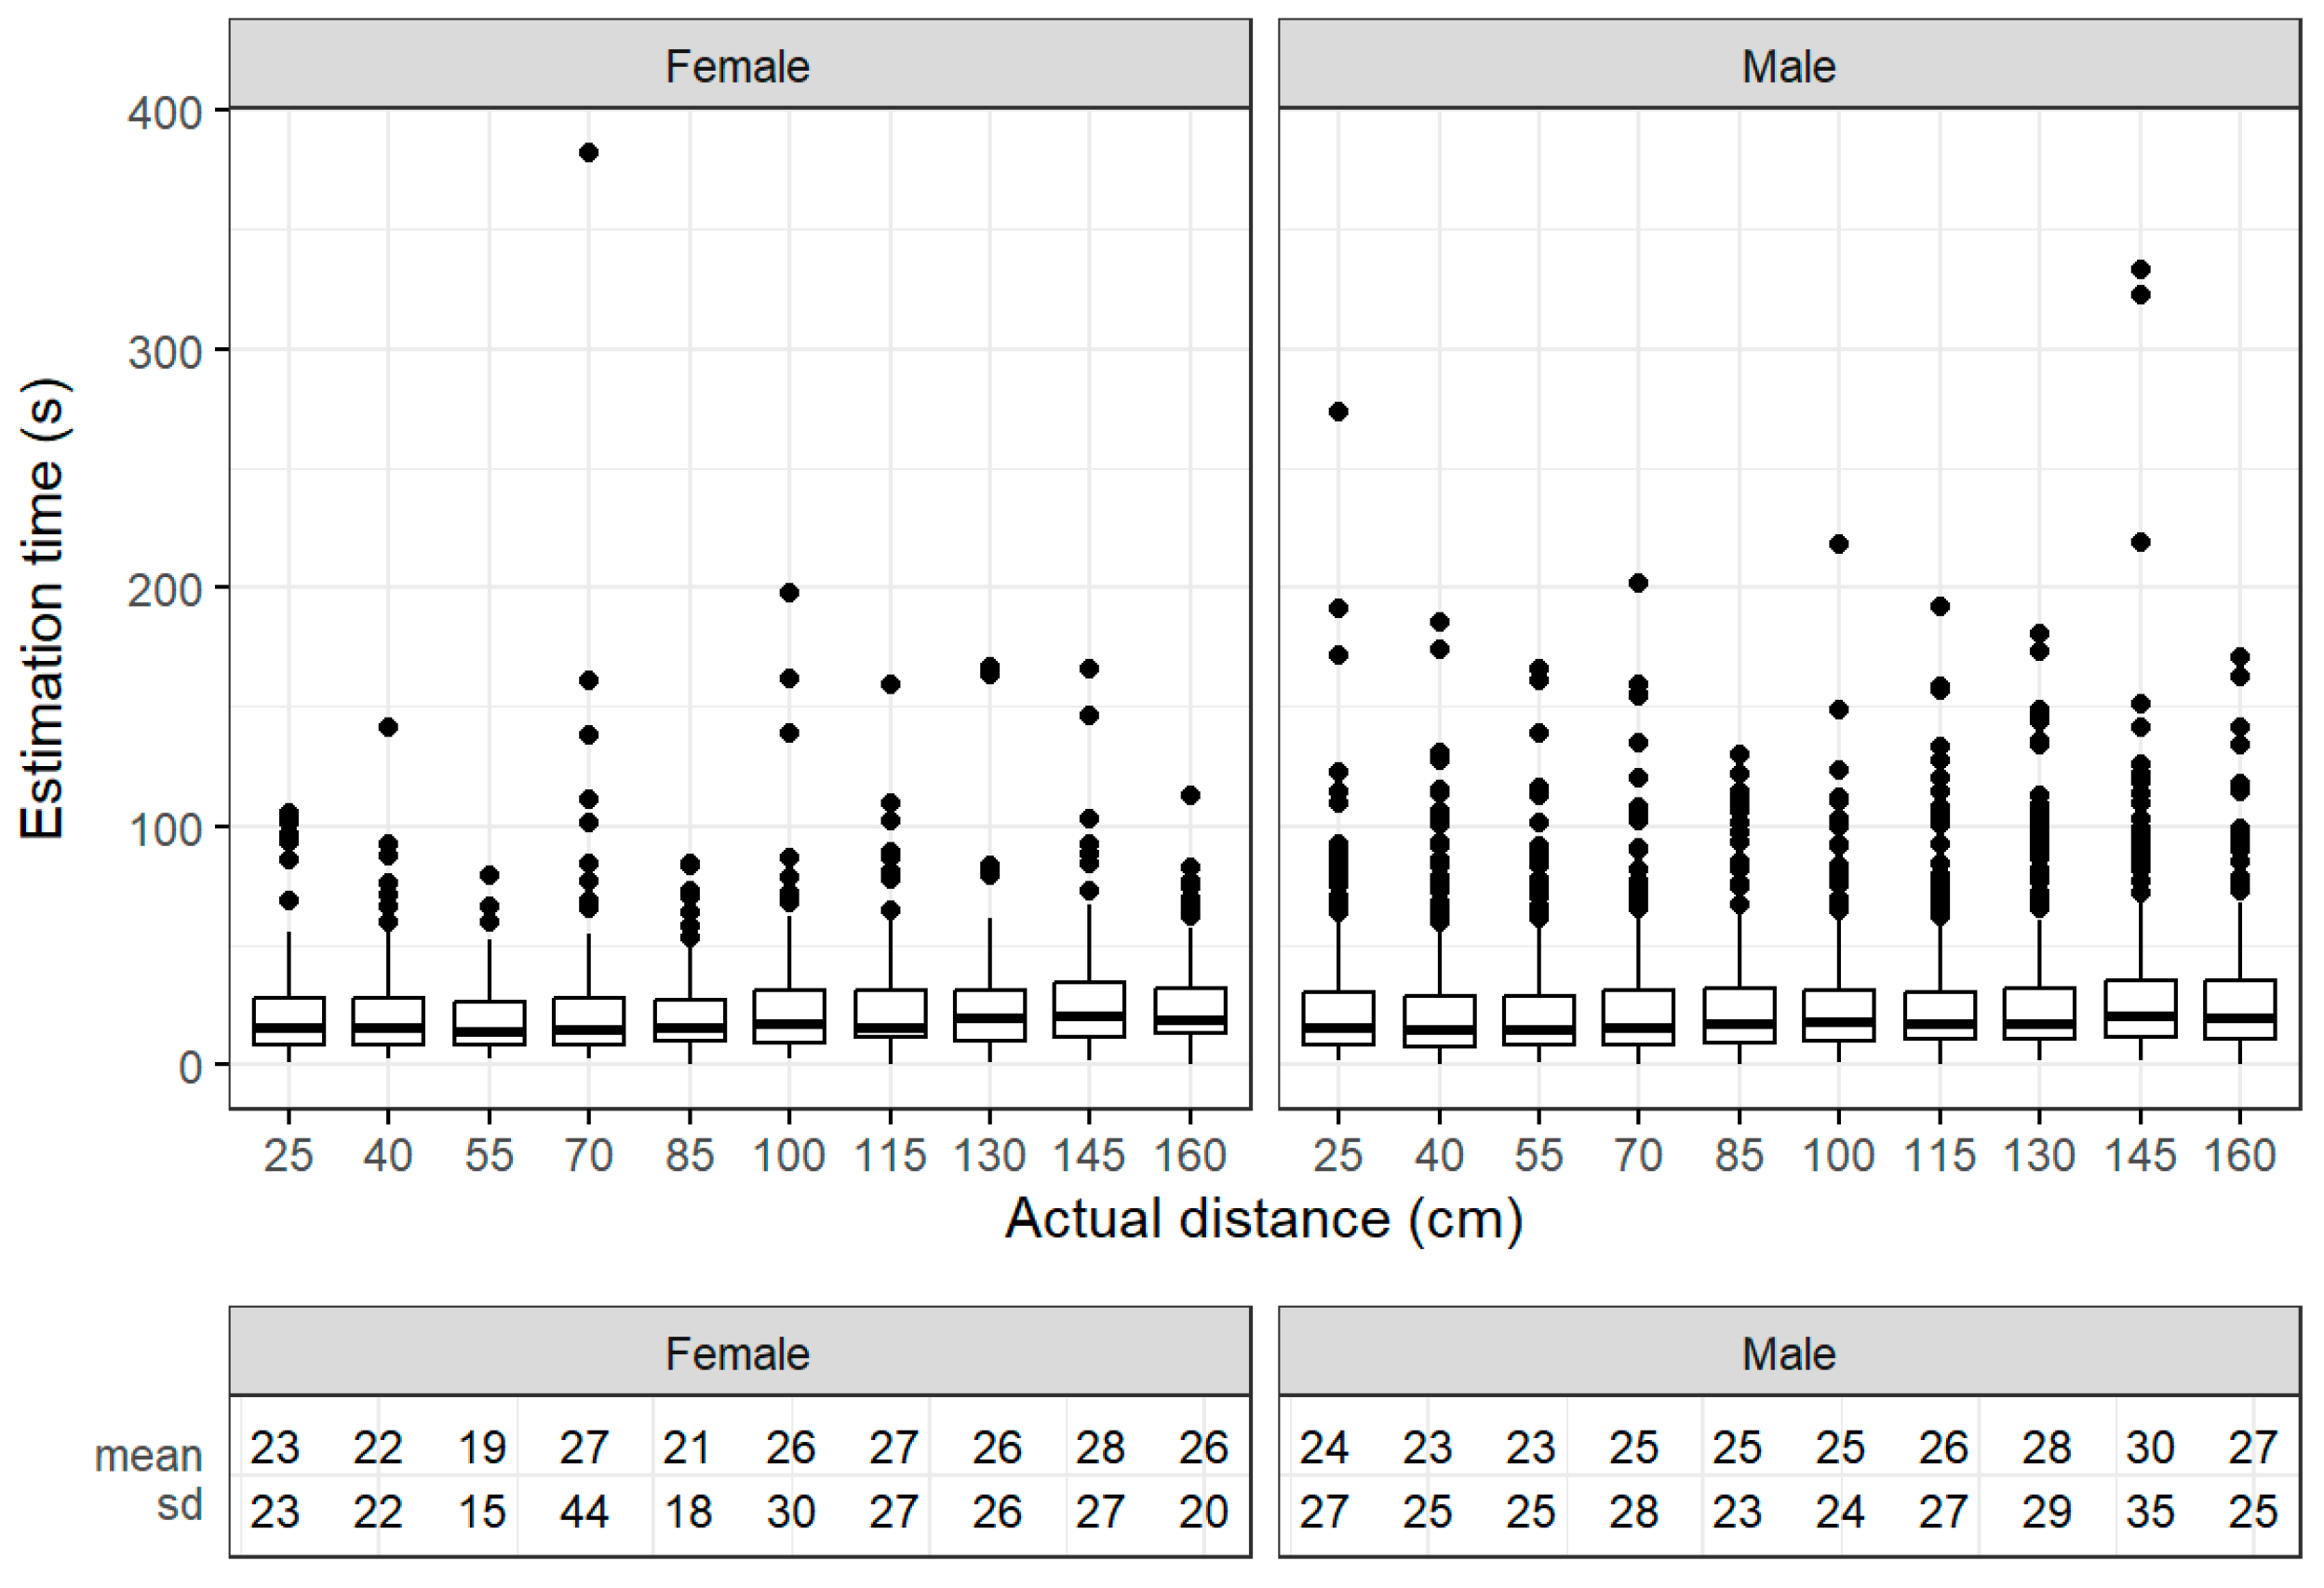
72]. Since we investigated the probabilities of accurate estimates, we can conclude the following: males were less likely to accurately estimate distances at 100 cm and 145 cm. When we combined the factor of gender with that of display devices, this effect occurred with a desktop display and the Gear VR display. When we added a third factor, the distances at which males were less likely to accurately estimate distances were 40 cm, 85 cm, 100 cm, 130 cm, and 145 cm. The distance of 100 cm presented the most cases of this phenomenon. It should also be noted that gender did not have significant effects on egocentric distance estimation times.
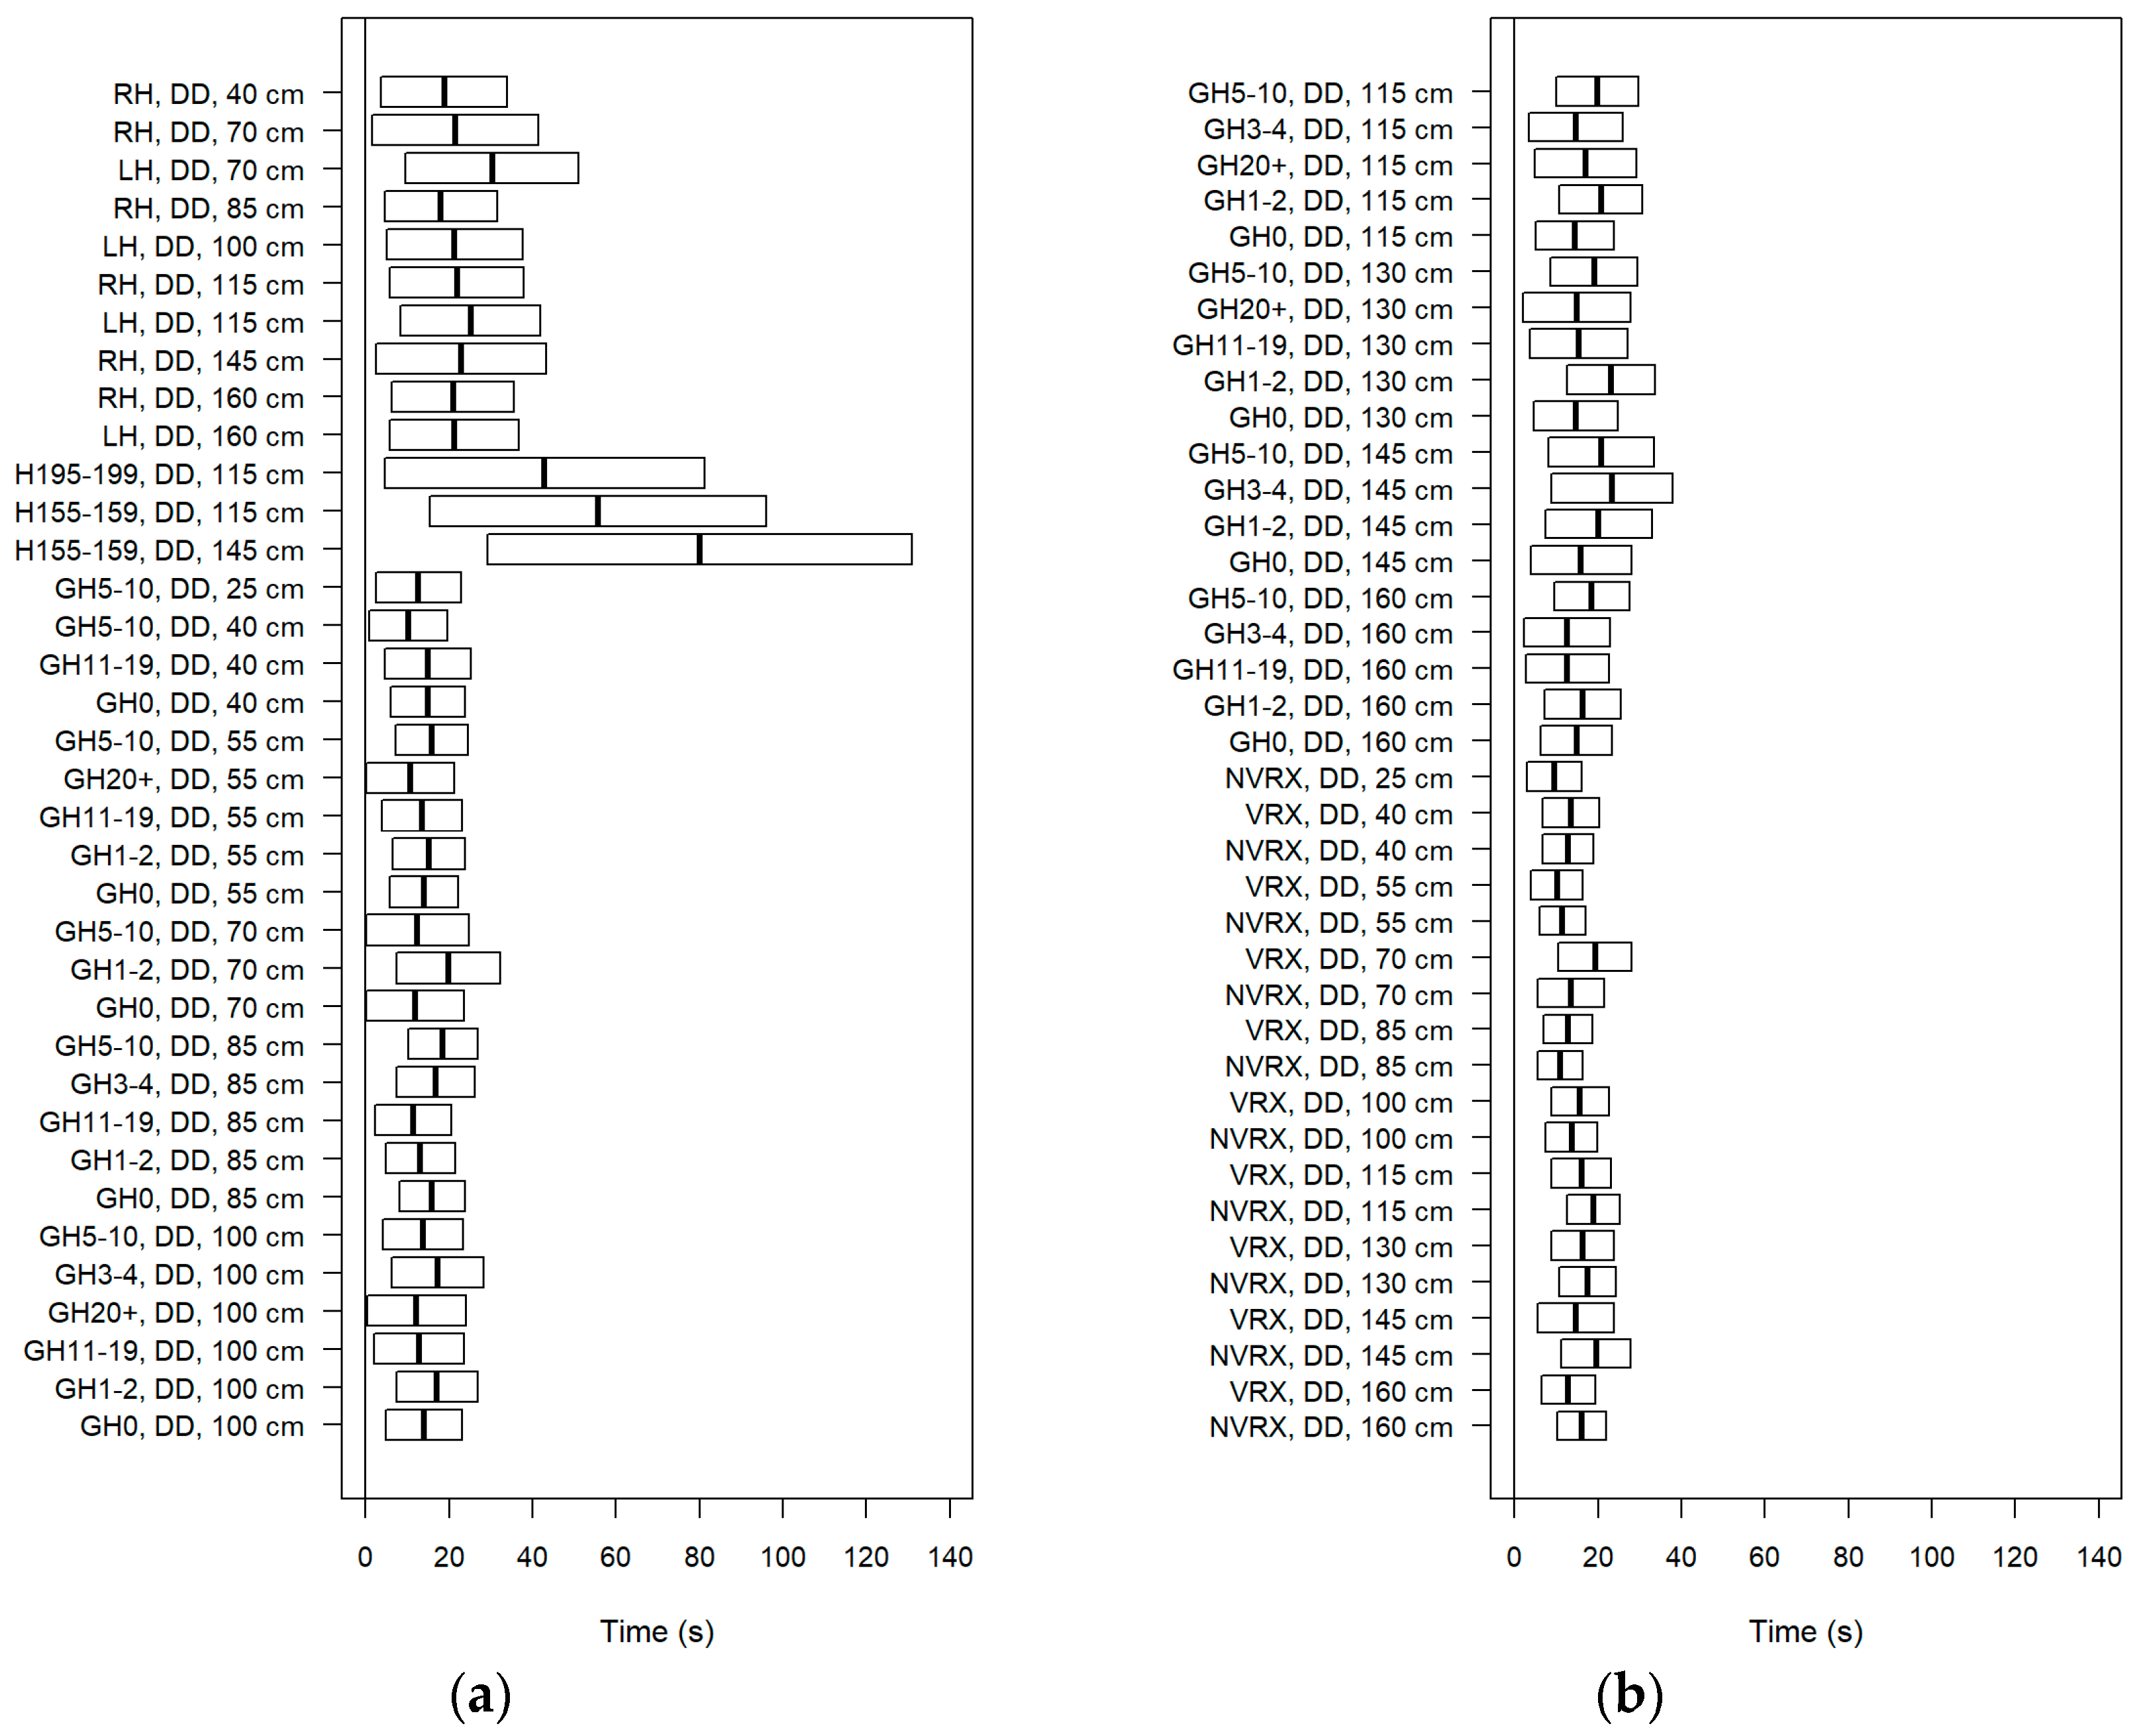
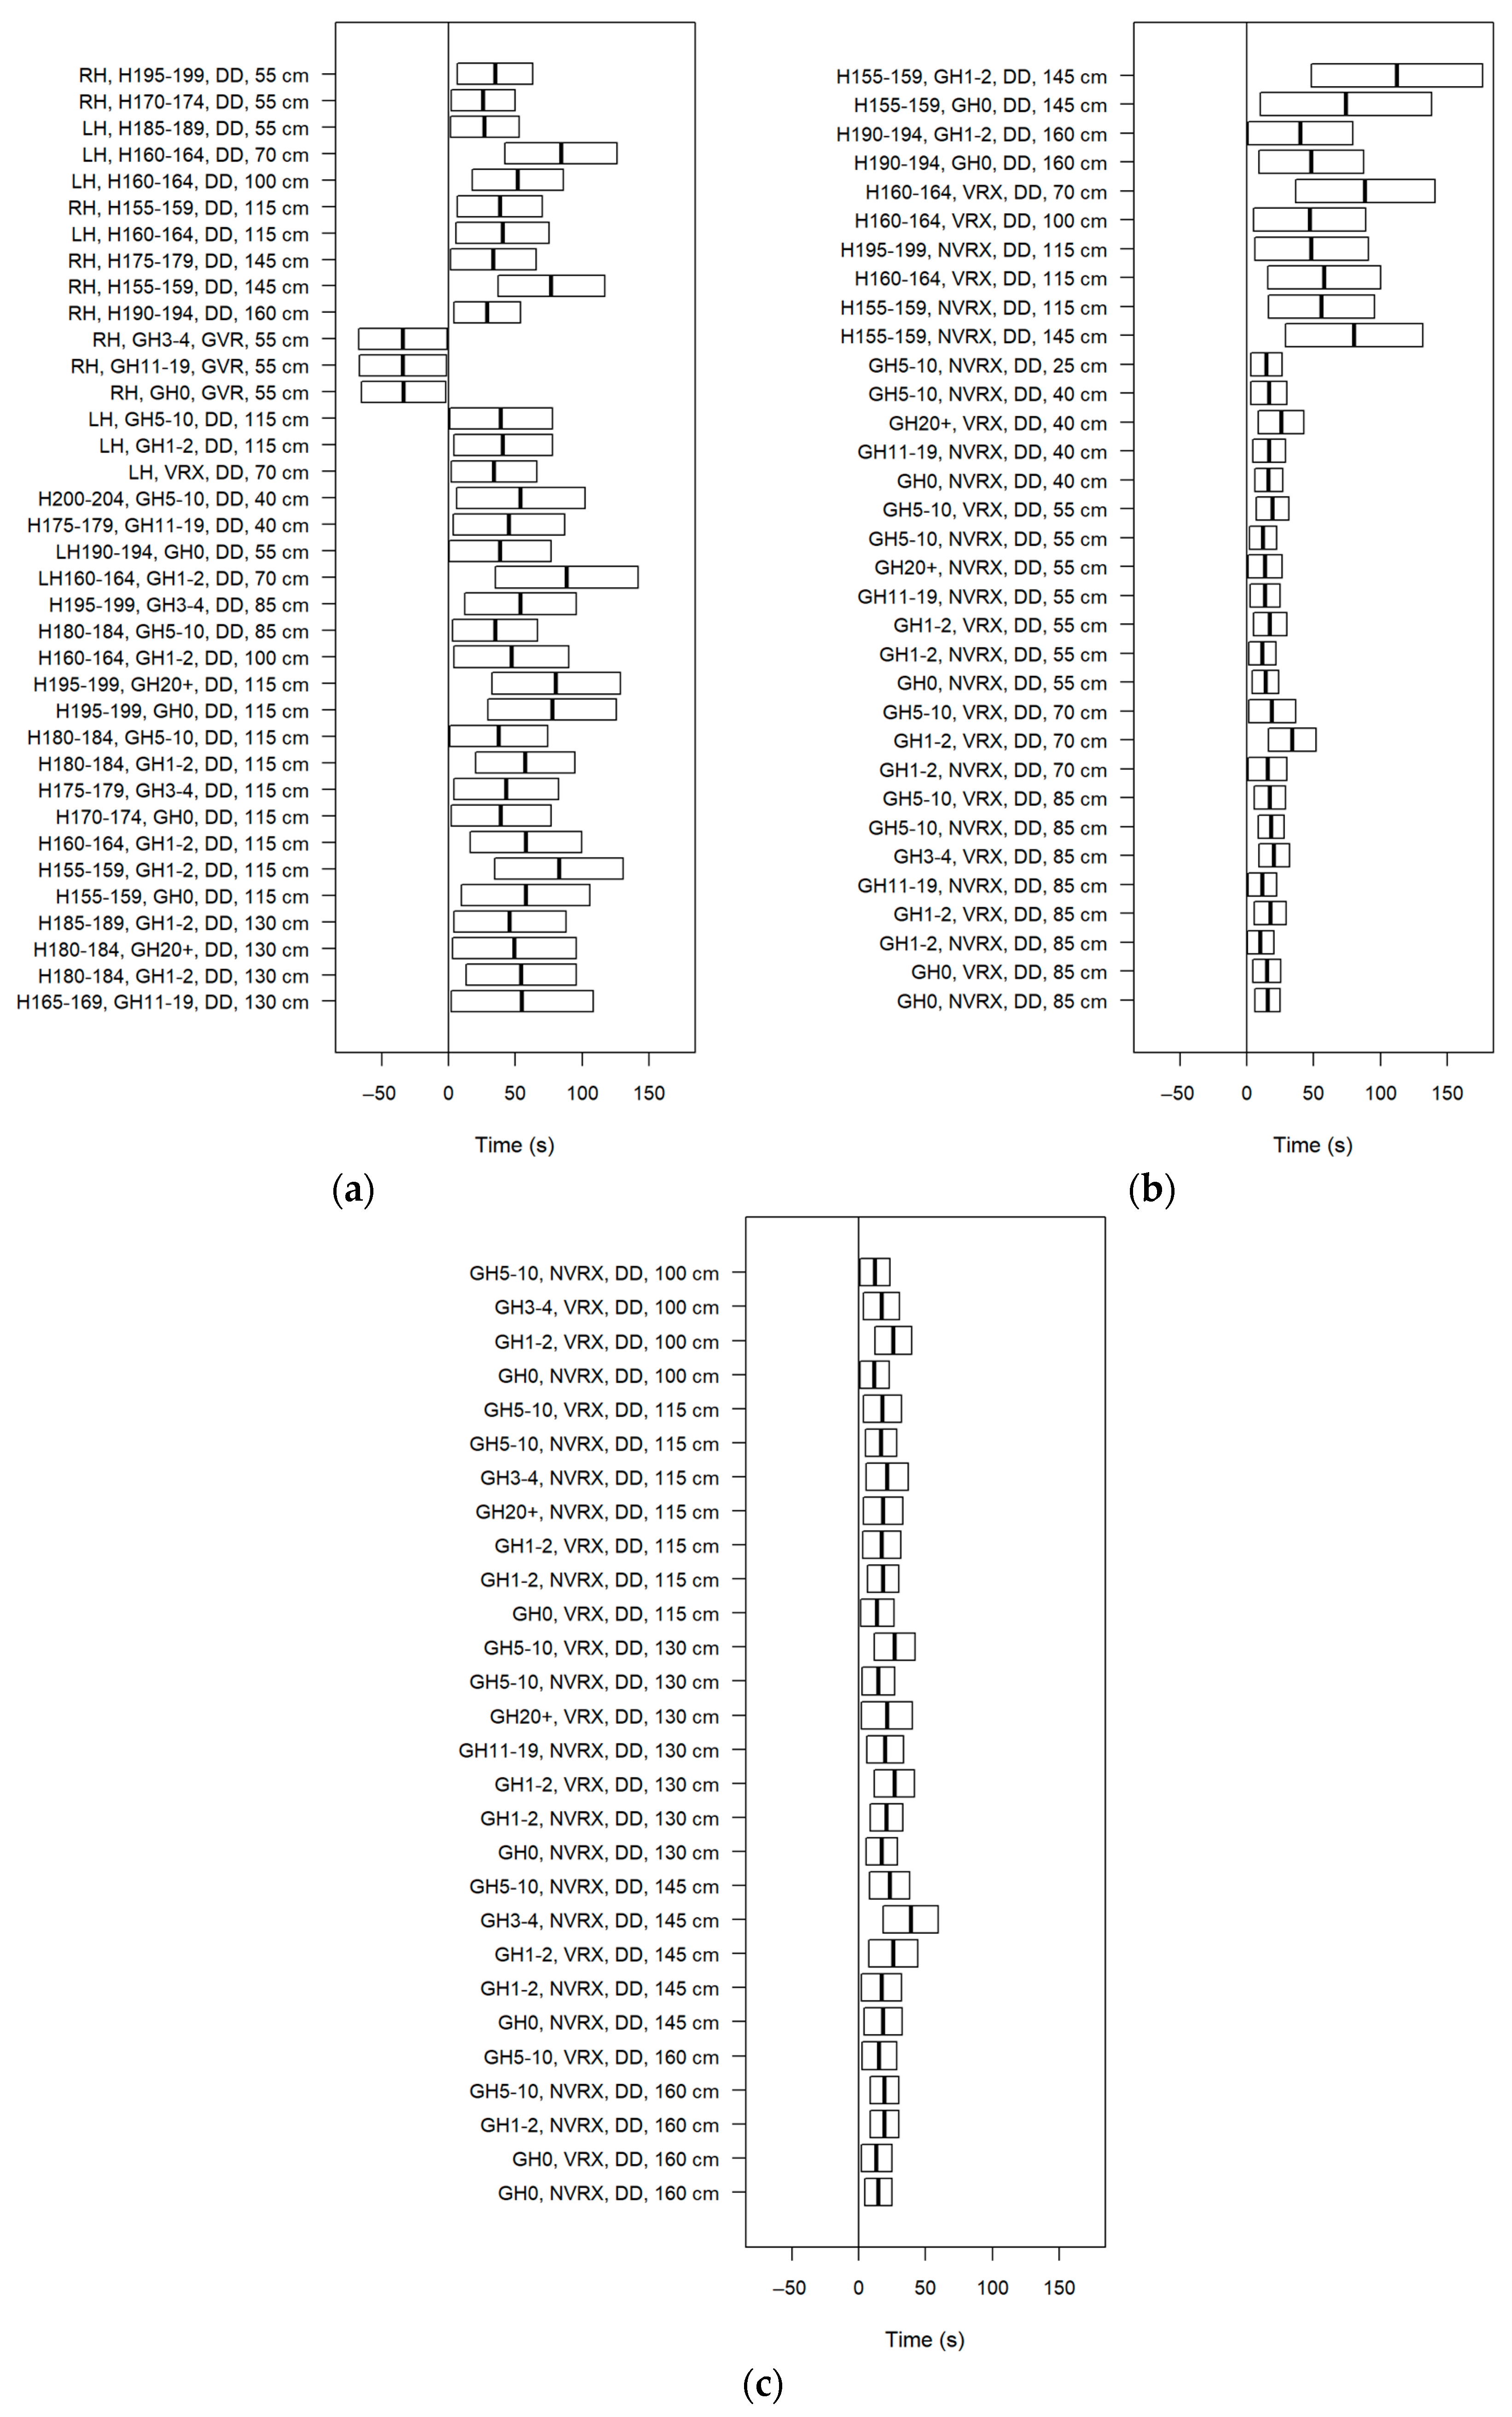
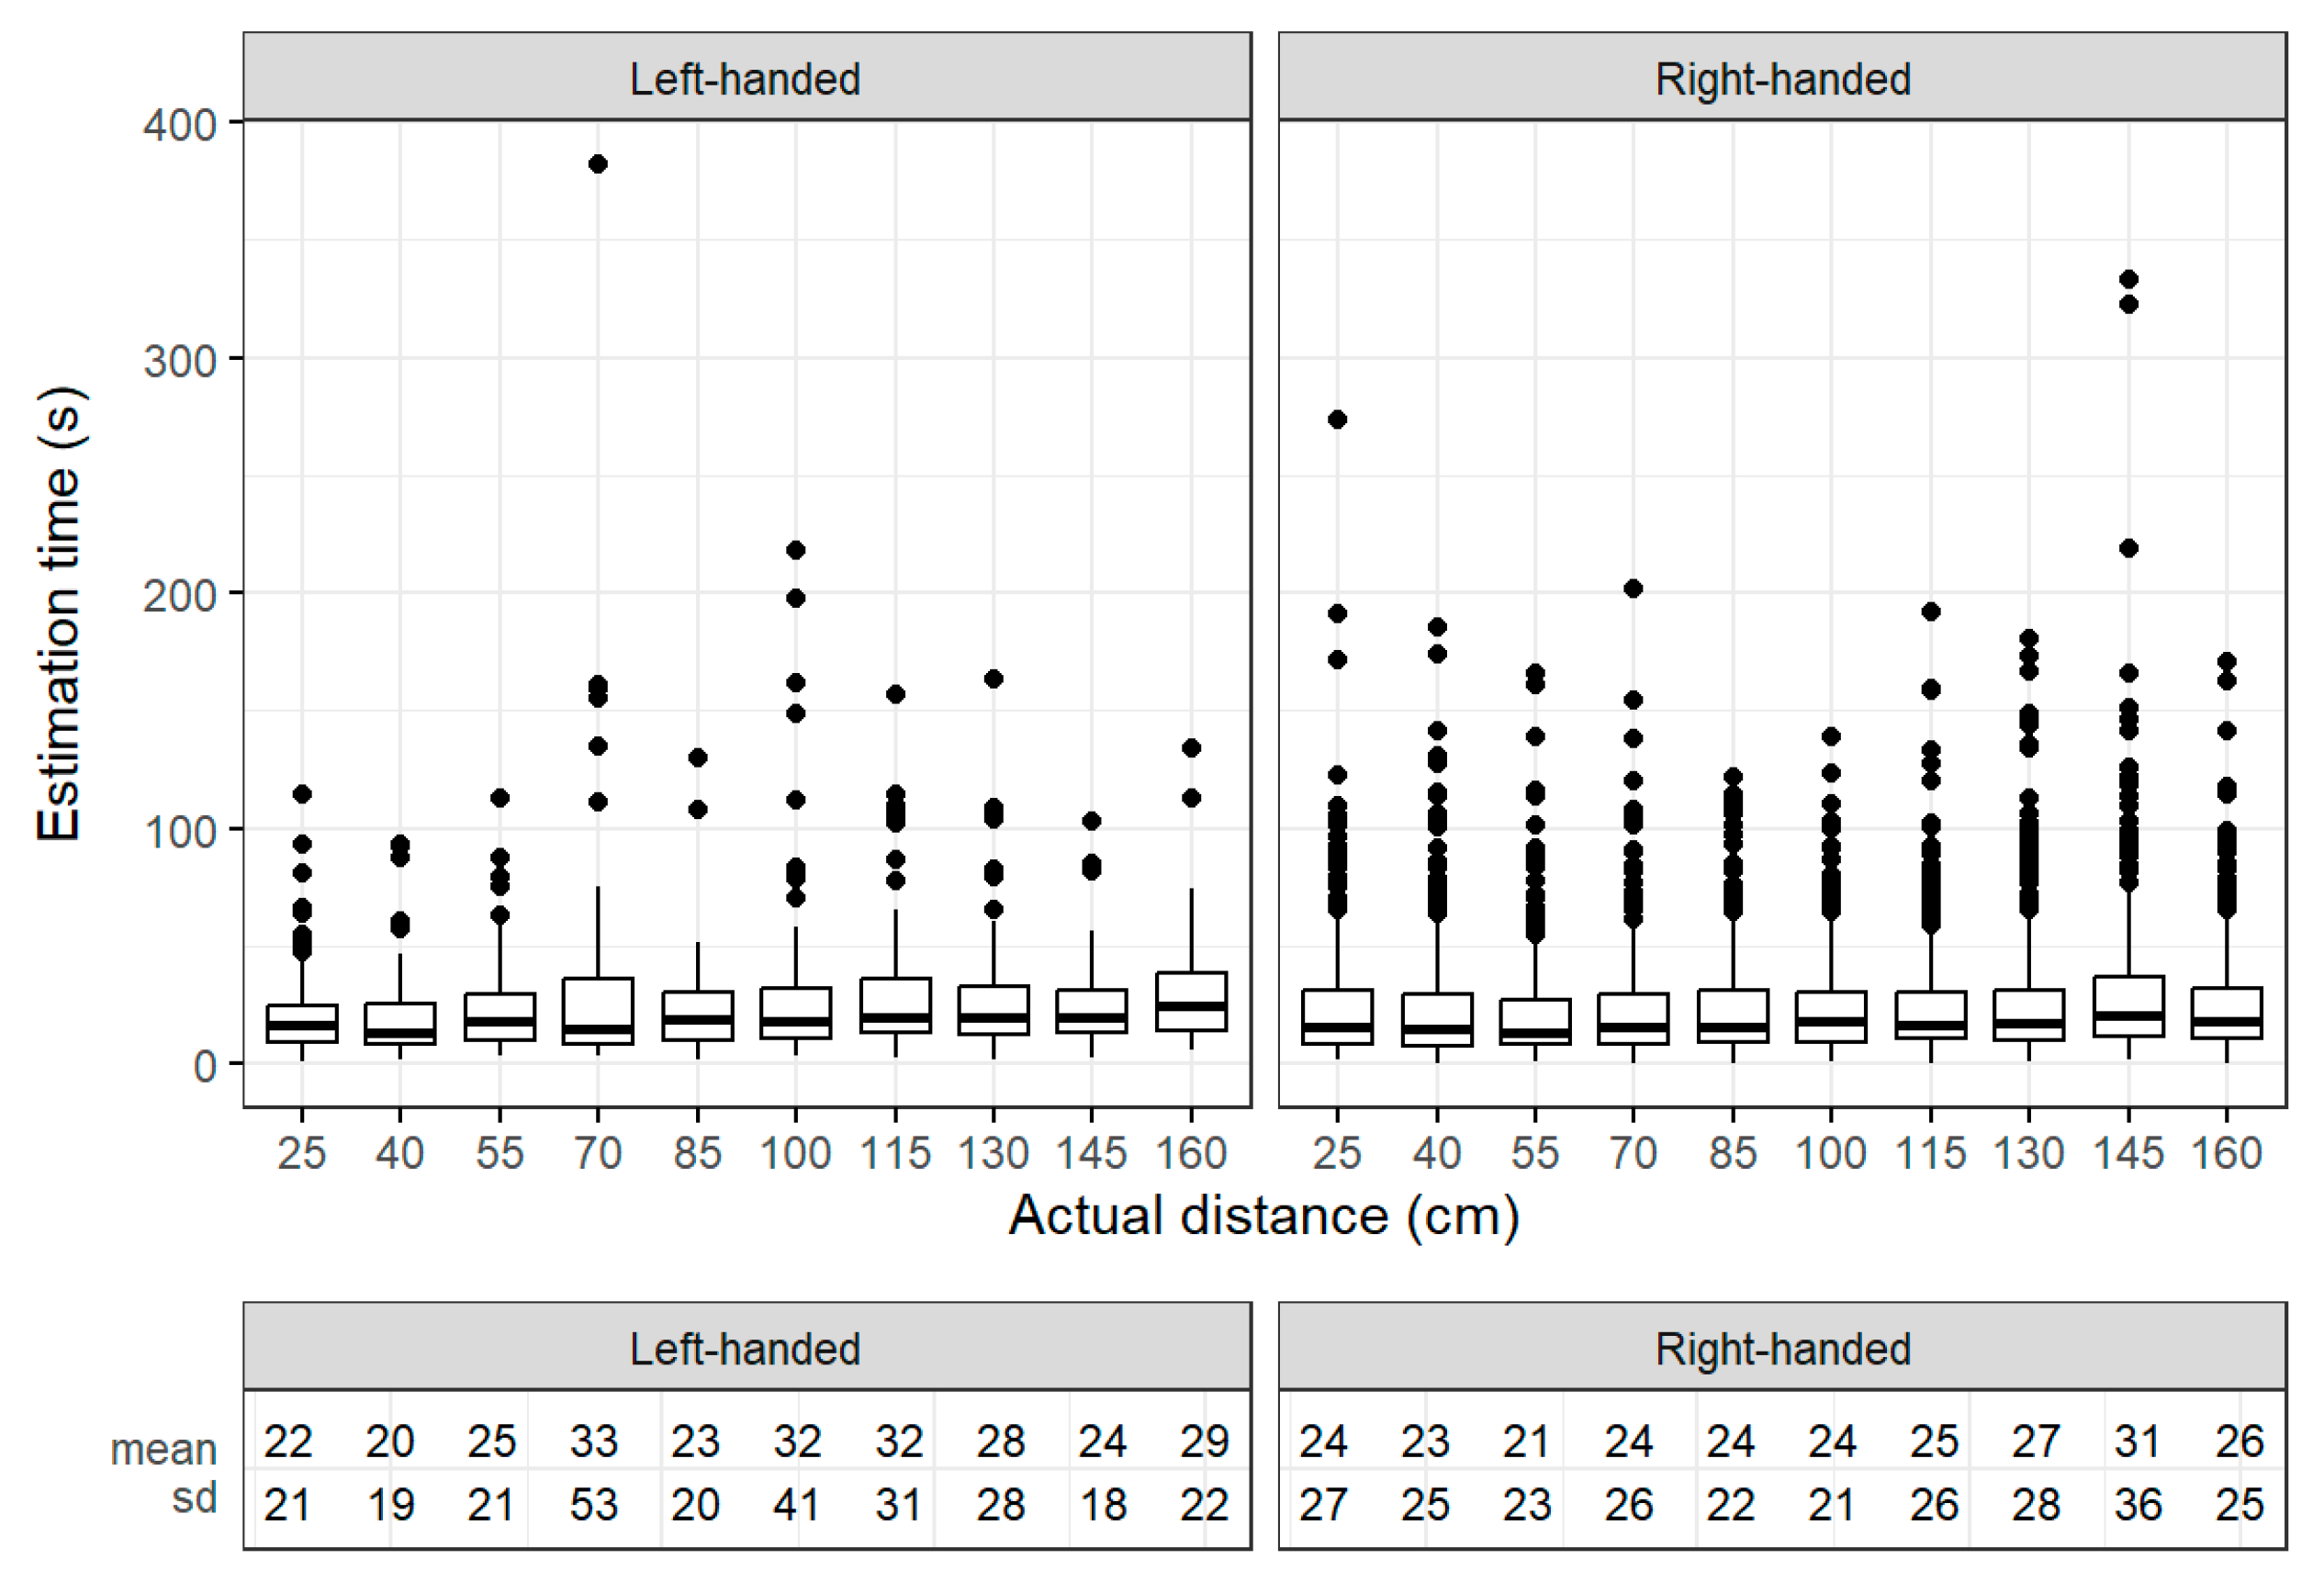
Dominant arm did not influence the probabilities of accurate distance estimates. Nonetheless, it had a few significant effects on estimation times. By itself, it significantly decreased estimation times at 70 cm and 100 cm. When grouped with a display device, it either significantly decreased or increased estimation times. However, this phenomenon occurred due to the display devices themselves.
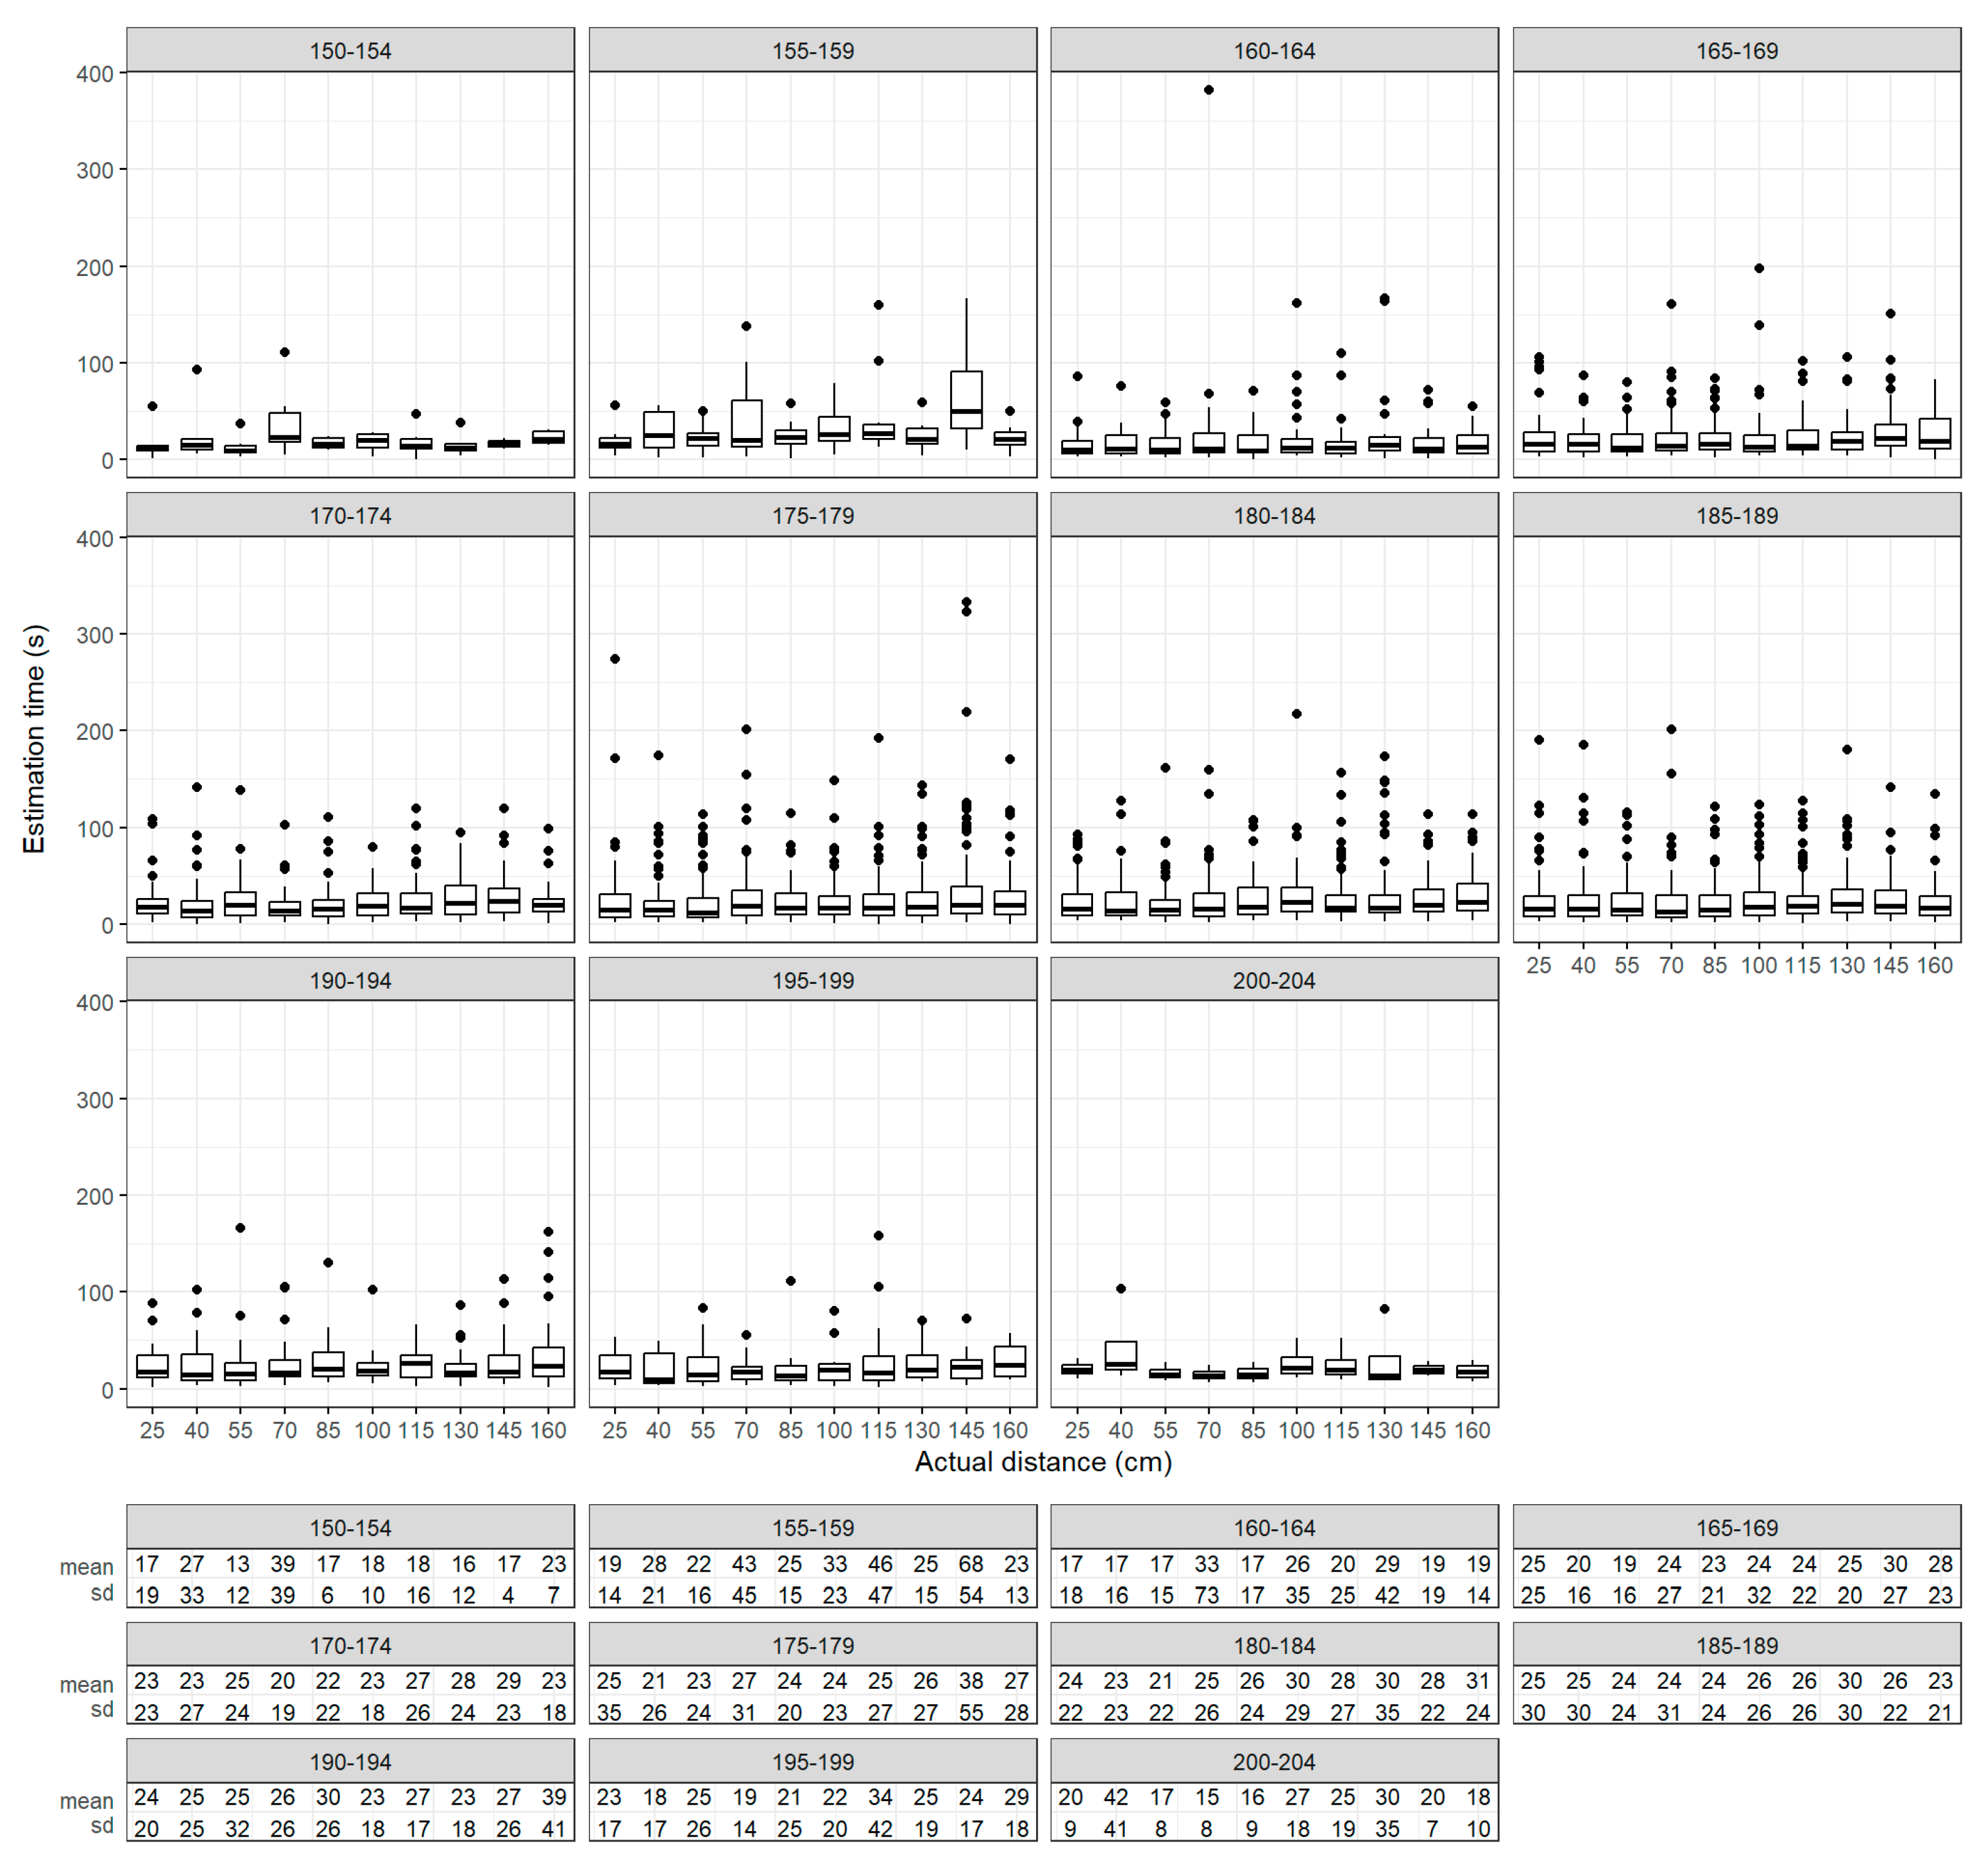
According to the literature, height does not affect distance estimation [49,72]. Similarly, we concluded that it did not affect the probabilities of accurate distance estimates. However, by itself, the heights between 155 cm and 159 cm had an effect on estimation times. This may have been due to the small sample size, as can be seen in the Appendix A. Consequently, these times were increased. When combined with the display devices, their effects strengthened in both directions.
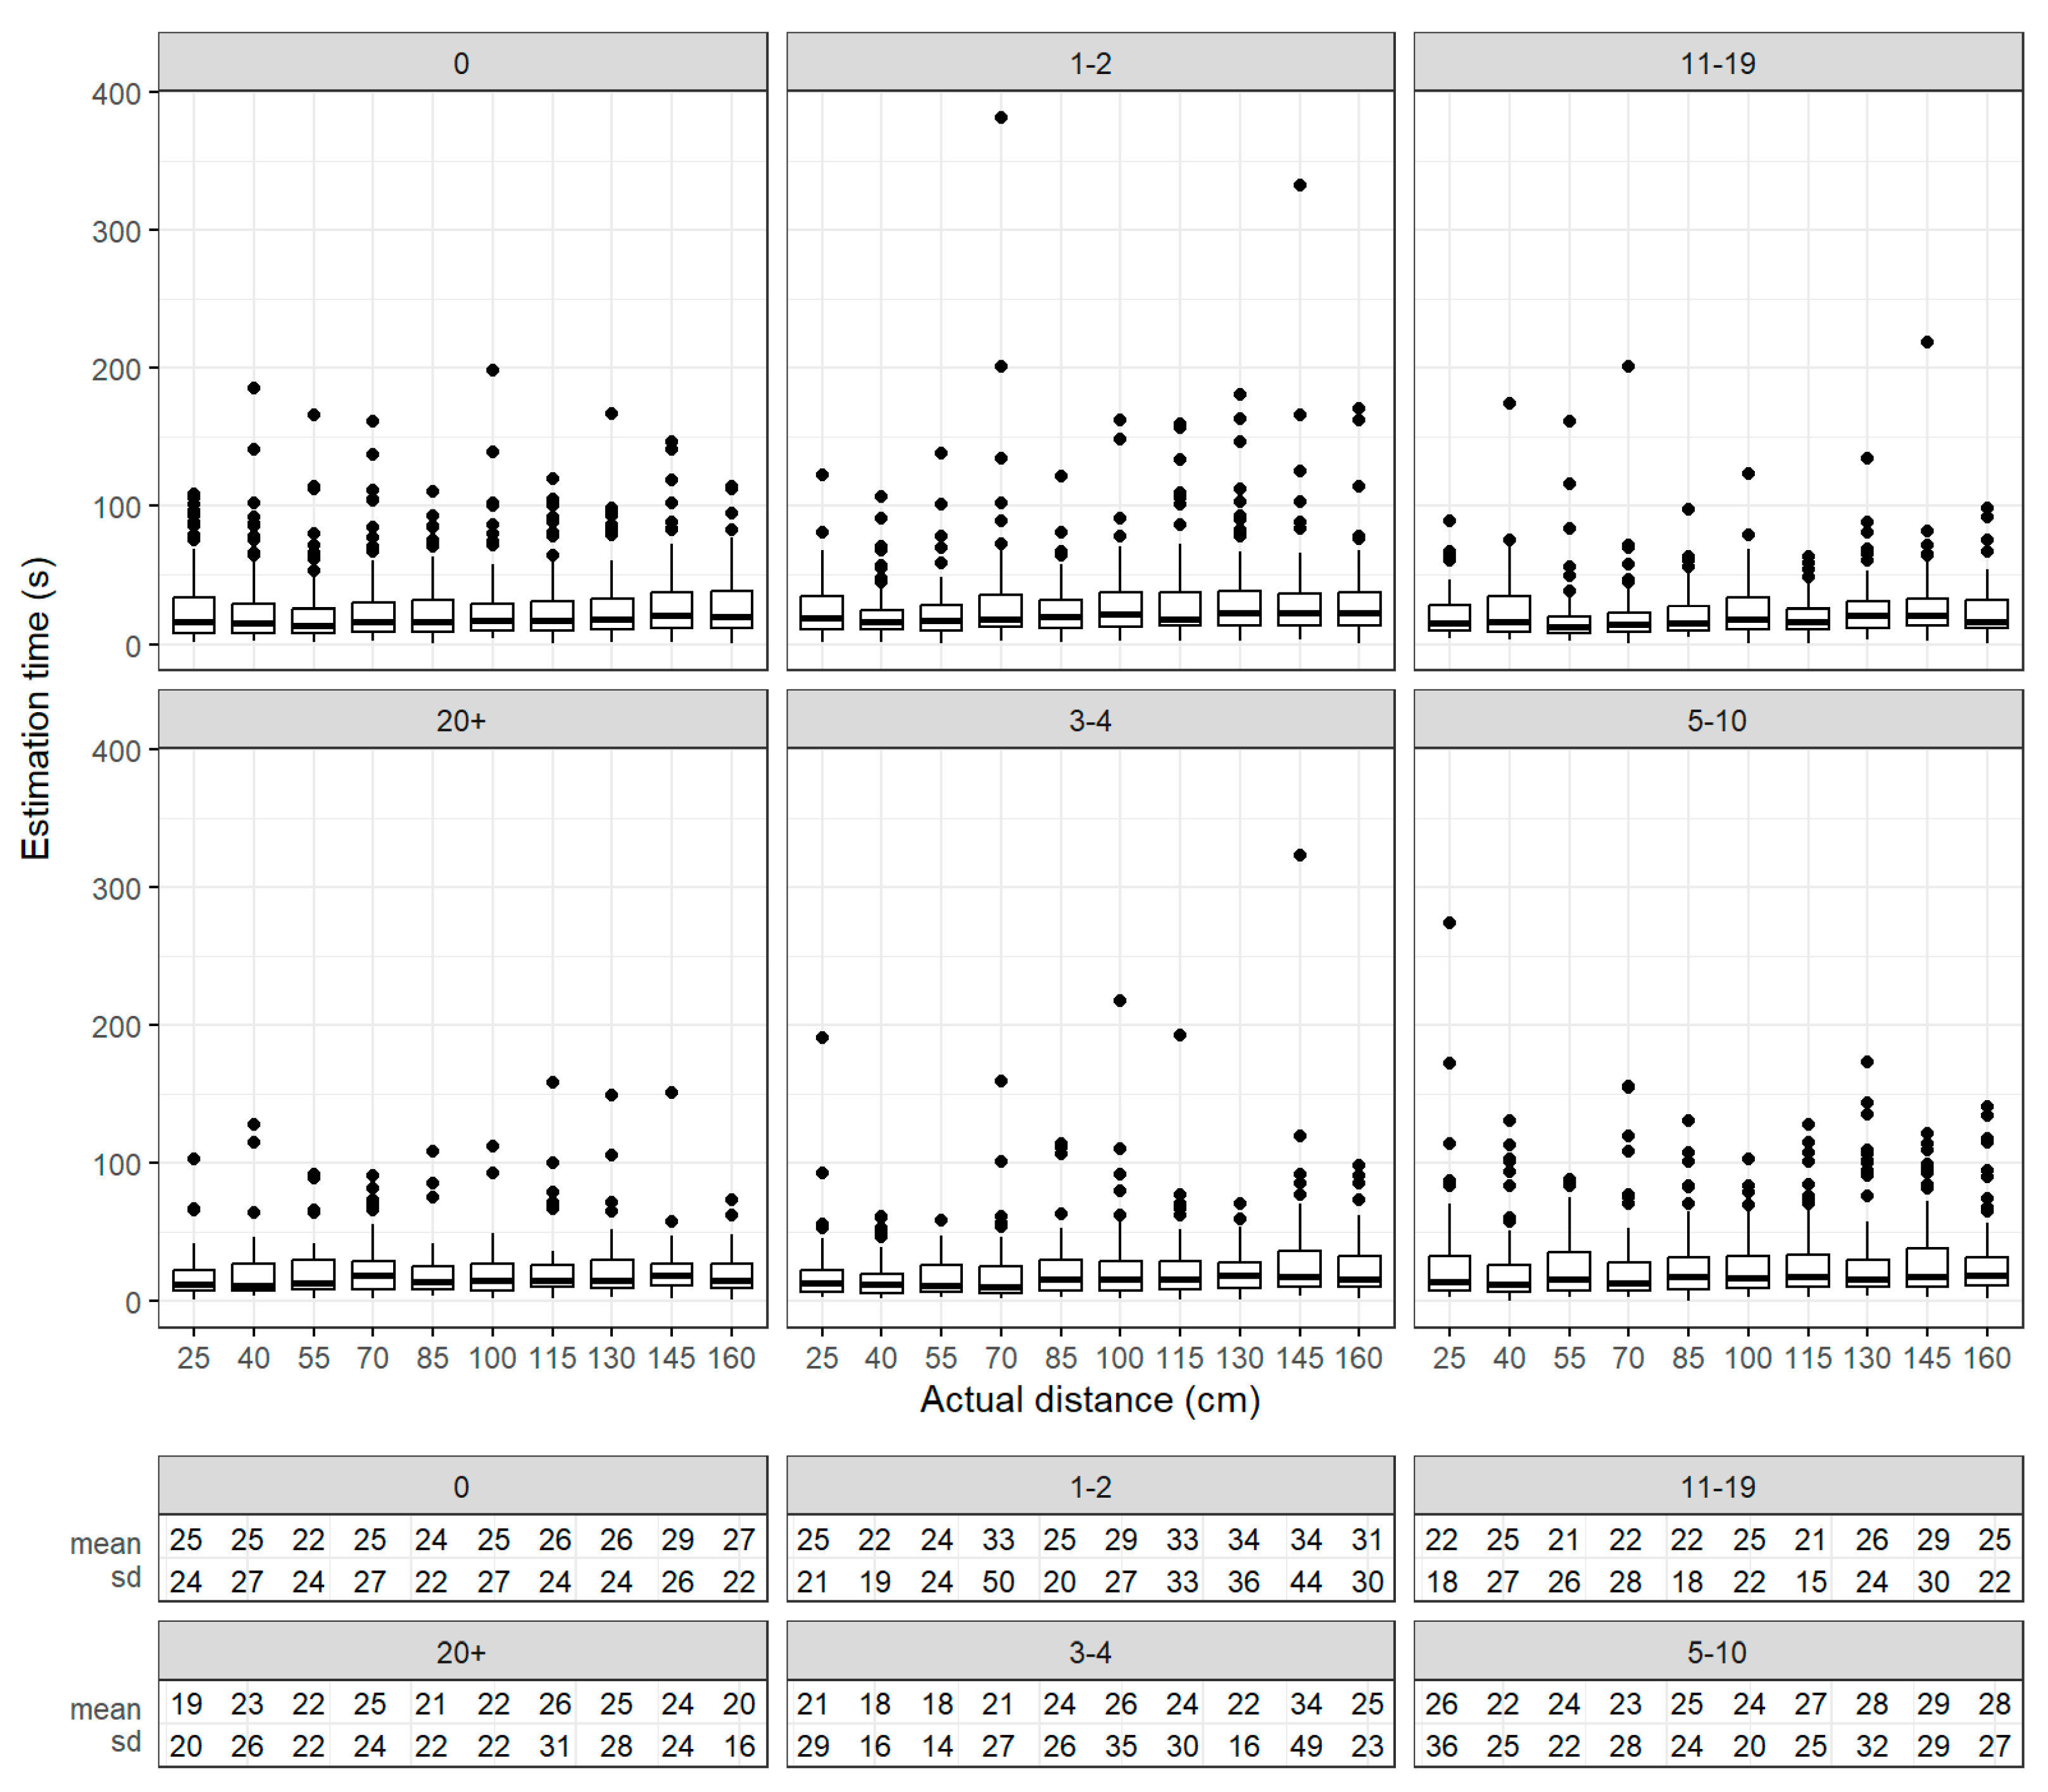
The effect of gaming hours per week was also assessed. By itself, this factor significantly decreased the probabilities of accurate distance estimates at 40 cm and 145 cm. This decrease occurred in the case of those who played 1 or 2 h per week or between 11 and 19 h per week. When grouped with the display devices, these effects could also be observed at 85 cm, 100 cm, and 130 cm alongside the other levels of this factor. Regarding estimation times, it had only one effect by itself but showed several more significant effects when grouped with the display device factor.
The previous VR experience was also assessed. By itself, it had only one significant effect on the probabilities of accurate distance estimates, significantly increasing them. However, when grouped with other factors, it significantly decreased the probabilities. By itself, it significantly decreased estimation times at 25 cm. It was also grouped with other factors, although it only retained the significant effects when combined with the display device.
Regarding display devices, they did not have significant effects on the probabilities of accurate distance estimates by themselves. Their effects arose only when they were combined with other factors. Still, both decreased the mentioned probabilities, but the number of significant effects was larger with the desktop display. This may be due to the fact there was no binocular disparity provided. Regarding the estimates, it was considered important [45,46,47]. In addition, the desktop display significantly increased estimation times, while they were decreased by using the Gear VR display.
The remaining investigated factors were whether the participants wore glasses and their field of study. However, these factors affected neither the probabilities of accurate distance estimates nor their estimation times.
Naturally, this study also had limitations. First, all data were analyzed together, as we did not differentiate between the results of participants on the basis of whether they used the scale. However, regarding the accuracy of those participants who did not use a scale, no significant difference was found between the two display versions ( W = 570,775   p = 0.529 ). Thus, when the scale was not present, the accuracy of participants was similar between the two display devices. However, when the scale was present, a significant difference arose between the results of the two versions ( W = 511,230   p < 0.001 ). Compared with the PC version, the results were more accurate, by 19.24%, in the VR version. Second, different display devices were used at each university, and the students differed on the basis of their studies. If both were similar at the two universities, the results regarding accuracy and time might change. These facts require further investigation.

5. Conclusions

We developed a VE to examine the effects of technical and human factors on the egocentric distance estimation process. These factors were gender, height, dominant arm, previous VR experience, gaming hours per week, whether the participants wore glasses, their field of study, and display device. Before analysis, the distance estimation skills of 239 students were measured. Logistic regression and linear regression analysis methods were used for the investigation.
The results showed that the factors of whether the participants wore glasses and field of study did not affect accurate distance estimates and their estimation times. Gender, heights between 155 cm and 159, 1–2 and 11–19 h of gaming per week, previous VR experience, and display devices were able to affect accurate distance estimates and estimation times. The latter could also be affected by the dominant arm, other heights, and gaming hours per week. Their strengths increased when combined with a display device. Consequently, estimation times may be affected due to only the influence of the display devices, as they had the largest effect.
In conclusion, while human factors can have an effect, that of the display devices is stronger. Since both humans and display devices are integral parts of a VR system, they can interact with each other as the results show. This should be considered by developers when creating new VEs in the future. Furthermore, when speed is more important in the said VE, a head-mounted display should be used for interaction.

Author Contributions

Conceptualization, T.G.; methodology, T.G., J.S. and E.P.; software, T.G.; validation, T.G., J.S. and E.P.; formal analysis, T.G.; investigation, T.G.; resources, T.G. and E.P.; data curation, T.G., J.S. and E.P.; writing—original draft preparation, T.G., J.S. and E.P.; writing—review and editing, T.G.; visualization, T.G.; supervision, T.G.; project administration, T.G. All authors have read and agreed to the published version of the manuscript.

Funding

This research received no external funding.

Data Availability Statement

The data presented in this study are available on request from the corresponding author.

Acknowledgments

Supported by the ÚNKP-22-4 New National Excellence Program of the Ministry for Culture and Innovation from the source of the National Research, Development and Innovation Fund. We would also like to thank Cecília Sik-Lányi, Mónika Márkus, István Joó, Tibor Holczinger, and Tamás Schné for inviting participants to the study.

Conflicts of Interest

The authors declare no conflict of interest.

Appendix A

Table A1. The average rates of accurate distance estimates and their standard deviations, grouped by gender.
Factor25 cm40 cm55 cm70 cm85 cm100 cm115 cm130 cm145 cm160 cm
Male M = 0.10 S D = 0.30 M = 0.18 S D = 0.39 M = 0.37 S D = 0.48 M = 0.27 S D = 0.44 M = 0.30 S D = 0.45 M = 0.42 S D = 0.49 M = 0.34 S D = 0.47 M = 0.39 S D = 0.49 M = 0.36 S D = 0.48 M = 0.46 S D = 0.50
Female M = 0.07 S D = 0.26 M = 0.21 S D = 0.41 M = 0.35 S D = 0.48 M = 0.26 S D = 0.44 M = 0.34 S D = 0.47 M = 0.55 S D = 0.50 M = 0.41 S D = 0.49 M = 0.48 S D = 0.50 M = 0.52 S D = 0.50 M = 0.49 S D = 0.50
Table A2. The average rates of accurate distance estimates and their standard deviations, grouped by dominant hand.
Factor25 cm40 cm55 cm70 cm85 cm100 cm115 cm130 cm145 cm160 cm
Left-handed M = 0.05 S D = 0.22 M = 0.18 S D = 0.39 M = 0.37 S D = 0.48 M = 0.22 S D = 0.42 M = 0.31 S D = 0.46 M = 0.50 S D = 0.50 M = 0.34 S D = 0.47 M = 0.35 S D = 0.47 M = 0.35 S D = 0.47 M = 0.51 S D = 0.50
Right-handed M = 0.11 S D = 0.31 M = 0.19 S D = 0.39 M = 0.37 S D = 0.48 M = 0.28 S D = 0.45 M = 0.31 S D = 0.46 M = 0.44 S D = 0.50 M = 0.36 S D = 0.48 M = 0.42 S D = 0.49 M = 0.41 S D = 0.49 M = 0.45 S D = 0.50
Table A3. The average rates of accurate distance estimates and their standard deviations, grouped by whether the participants wore glasses.
Factor25 cm40 cm55 cm70 cm85 cm100 cm115 cm130 cm145 cm160 cm
Glasses M = 0.12 S D = 0.32 M = 0.21 S D = 0.41 M = 0.39 S D = 0.49 M = 0.29 S D = 0.45 M = 0.36 S D = 0.48 M = 0.46 S D = 0.50 M = 0.36 S D = 0.48 M = 0.46 S D = 0.50 M = 0.44 S D = 0.50 M = 0.51 S D = 0.50
No glasses M = 0.08 S D = 0.28 M = 0.18 S D = 0.38 M = 0.36 S D = 0.48 M = 0.26 S D = 0.44 M = 0.28 S D = 0.45 M = 0.45 S D = 0.50 M = 0.36 S D = 0.48 M = 0.37 S D = 0.48 M = 0.37 S D = 0.48 M = 0.44 S D = 0.50
Table A4. The average rates of accurate distance estimates and their standard deviations, grouped by whether the participants had previous VR experience.
Factor25 cm40 cm55 cm70 cm85 cm100 cm115 cm130 cm145 cm160 cm
VR experience M = 0.09 S D = 0.29 M = 0.24 S D = 0.43 M = 0.41 S D = 0.49 M = 0.27 S D = 0.45 M = 0.31 S D = 0.47 M = 0.49 S D = 0.50 M = 0.32 S D = 0.47 M = 0.49 S D = 0.49 M = 0.38 S D = 0.49 M = 0.43 S D = 0.50
No VR experience M = 0.10 S D = 0.30 M = 0.16 S D = 0.37 M = 0.35 S D = 0.48 M = 0.27 S D = 0.44 M = 0.31 S D = 0.46 M = 0.43 S D = 0.50 M = 0.38 S D = 0.49 M = 0.43 S D = 0.50 M = 0.41 S D = 0.49 M = 0.49 S D = 0.50
Table A5. The average rates of accurate distance estimates and their standard deviations, grouped by the participants’ field of study.
Factor25 cm40 cm55 cm70 cm85 cm100 cm115 cm130 cm145 cm160 cm
Civil engineering M = 0.09 S D = 0.29 M = 0.15 S D = 0.36 M = 0.38 S D = 0.49 M = 0.23 S D = 0.43 M = 0.27 S D = 0.45 M = 0.43 S D = 0.50 M = 0.38 S D = 0.49 M = 0.41 S D = 0.49 M = 0.40 S D = 0.49 M = 0.49 S D = 0.50
Mechanical engineering M = 0.02 S D = 0.14 M = 0.11 S D = 0.32 M = 0.28 S D = 0.45 M = 0.20 S D = 0.41 M = 0.31 S D = 0.47 M = 0.41 S D = 0.50 M = 0.33 S D = 0.48 M = 0.36 S D = 0.48 M = 0.28 S D = 0.45 M = 0.35 S D = 0.48
Vehicle engineering M = 0.09 S D = 0.29 M = 0.23 S D = 0.43 M = 0.39 S D = 0.49 M = 0.31 S D = 0.46 M = 0.31 S D = 0.46 M = 0.47 S D = 0.50 M = 0.33 S D = 0.47 M = 0.43 S D = 0.50 M = 0.39 S D = 0.49 M = 0.51 S D = 0.50
IT M = 0.14 S D = 0.35 M = 0.24 S D = 0.43 M = 0.39 S D = 0.49 M = 0.31 S D = 0.47 M = 0.36 S D = 0.48 M = 0.49 S D = 0.50 M = 0.35 S D = 0.48 M = 0.43 S D = 0.50 M = 0.46 S D = 0.50 M = 0.46 S D = 0.50
Table A6. The average rates of accurate distance estimates and their standard deviations, grouped by heights of the participants (cm).
Factor25 cm40 cm55 cm70 cm85 cm100 cm115 cm130 cm145 cm160 cm
150–154 M = 0.17 S D = 0.41 M = 0.17 S D = 0.41 M = 0.33 S D = 0.52 M = 0.33 S D = 0.52 M = 0.50 S D = 0.55 M = 0.50 S D = 0.55 M = 0.17 S D = 0.41 M = 0.50 S D = 0.55 M = 0.33 S D = 0.52 M = 0.33 S D = 0.52
155–159 M = 0.00 S D = 0.00 M = 0.00 S D = 0.00 M = 0.30 S D = 0.48 M = 0.30 S D = 0.48 M = 0.20 S D = 0.42 M = 0.20 S D = 0.42 M = 0.40 S D = 0.52 M = 0.30 S D = 0.48 M = 0.40 S D = 0.52 M = 0.50 S D = 0.53
160–164 M = 0.12 S D = 0.33 M = 0.19 S D = 0.40 M = 0.31 S D = 0.47 M = 0.27 S D = 0.45 M = 0.27 S D = 0.45 M = 0.62 S D = 0.50 M = 0.38 S D = 0.50 M = 0.62 S D = 0.50 M = 0.62 S D = 0.50 M = 0.50 S D = 0.51
165–169 M = 0.07 S D = 0.26 M = 0.22 S D = 0.42 M = 0.40 S D = 0.49 M = 0.22 S D = 0.42 M = 0.31 S D = 0.47 M = 0.48 S D = 0.50 M = 0.34 S D = 0.48 M = 0.40 S D = 0.49 M = 0.47 S D = 0.50 M = 0.52 S D = 0.50
170–174 M = 0.04 S D = 0.21 M = 0.15 S D = 0.36 M = 0.26 S D = 0.44 M = 0.26 S D = 0.44 M = 0.33 S D = 0.47 M = 0.43 S D = 0.50 M = 0.33 S D = 0.47 M = 0.33 S D = 0.47 M = 0.30 S D = 0.47 M = 0.46 S D = 0.50
175–179 M = 0.06 S D = 0.25 M = 0.15 S D = 0.36 M = 0.35 S D = 0.48 M = 0.28 S D = 0.45 M = 0.22 S D = 0.42 M = 0.40 S D = 0.49 M = 0.36 S D = 0.48 M = 0.40 S D = 0.49 M = 0.33 S D = 0.47 M = 0.46 S D = 0.50
180–184 M = 0.11 S D = 0.31 M = 0.20 S D = 0.40 M = 0.37 S D = 0.49 M = 0.21 S D = 0.41 M = 0.33 S D = 0.47 M = 0.45 S D = 0.50 M = 0.36 S D = 0.48 M = 0.35 S D = 0.48 M = 0.43 S D = 0.50 M = 0.40 S D = 0.49
185–189 M = 0.19 S D = 0.39 M = 0.20 S D = 0.40 M = 0.42 S D = 0.50 M = 0.35 S D = 0.48 M = 0.35 S D = 0.48 M = 0.48 S D = 0.50 M = 0.38 S D = 0.49 M = 0.44 S D = 0.50 M = 0.47 S D = 0.50 M = 0.50 S D = 0.50
190–194 M = 0.04 S D = 0.19 M = 0.21 S D = 0.42 M = 0.50 S D = 0.51 M = 0.18 S D = 0.39 M = 0.32 S D = 0.48 M = 0.36 S D = 0.49 M = 0.29 S D = 0.46 M = 0.43 S D = 0.50 M = 0.29 S D = 0.46 M = 0.40 S D = 0.50
195–199 M = 0.13 S D = 0.34 M = 0.44 S D = 0.51 M = 0.44 S D = 0.51 M = 0.38 S D = 0.50 M = 0.44 S D = 0.51 M = 0.56 S D = 0.51 M = 0.50 S D = 0.52 M = 0.50 S D = 0.52 M = 0.31 S D = 0.48 M = 0.63 S D = 0.50
200–204 M = 0.25 S D = 0.50 M = 0.25 S D = 0.50 M = 0.25 S D = 0.50 M = 0.50 S D = 0.58 M = 0.75 S D = 0.50 M = 0.75 S D = 0.50 M = 0.25 S D = 0.50 M = 1.00 S D = 0.00 M = 0.25 S D = 0.50 M = 0.50 S D = 0.58
Table A7. The average rates of accurate distance estimates and their standard deviations, grouped by the number of hours per week the participants played video games.
Factor25 cm40 cm55 cm70 cm85 cm100 cm115 cm130 cm145 cm160 cm
0 M = 0.10 S D = 0.31 M = 0.25 S D = 0.43 M = 0.41 S D = 0.49 M = 0.24 S D = 0.43 M = 0.29 S D = 0.46 M = 0.53 S D = 0.50 M = 0.38 S D = 0.49 M = 0.47 S D = 0.50 M = 0.47 S D = 0.50 M = 0.48 S D = 0.50
1–2 M = 0.05 S D = 0.22 M = 0.10 S D = 0.31 M = 0.35 S D = 0.48 M = 0.24 S D = 0.43 M = 0.26 S D = 0.44 M = 0.47 S D = 0.50 M = 0.33 S D = 0.47 M = 0.40 S D = 0.49 M = 0.28 S D = 0.45 M = 0.46 S D = 0.50
3–4 M = 0.13 S D = 0.34 M = 0.27 S D = 0.45 M = 0.31 S D = 0.47 M = 0.27 S D = 0.45 M = 0.37 S D = 0.49 M = 0.42 S D = 0.50 M = 0.35 S D = 0.48 M = 0.44 S D = 0.50 M = 0.42 S D = 0.50 M = 0.58 S D = 0.50
5–10 M = 0.12 S D = 0.33 M = 0.22 S D = 0.42 M = 0.36 S D = 0.48 M = 0.28 S D = 0.45 M = 0.33 S D = 0.47 M = 0.40 S D = 0.49 M = 0.40 S D = 0.49 M = 0.39 S D = 0.49 M = 0.39 S D = 0.49 M = 0.42 S D = 0.50
11–19 M = 0.10 S D = 0.30 M = 0.10 S D = 0.30 M = 0.38 S D = 0.49 M = 0.37 S D = 0.49 M = 0.30 S D = 0.46 M = 0.40 S D = 0.49 M = 0.30 S D = 0.46 M = 0.38 S D = 0.49 M = 0.43 S D = 0.50 M = 0.45 S D = 0.50
20+ M = 0.07 S D = 0.26 M = 0.17 S D = 0.38 M = 0.38 S D = 0.49 M = 0.26 S D = 0.45 M = 0.38 S D = 0.49 M = 0.40 S D = 0.50 M = 0.33 S D = 0.48 M = 0.33 S D = 0.48 M = 0.38 S D = 0.49 M = 0.43 S D = 0.50
Table A8. The average rates of accurate distance estimates and their standard deviations, grouped by display device.
Factor25 cm40 cm55 cm70 cm85 cm100 cm115 cm130 cm145 cm160 cm
Desktop display M = 0.08 S D = 0.27 M = 0.17 S D = 0.38 M = 0.36 S D = 0.48 M = 0.25 S D = 0.43 M = 0.29 S D = 0.45 M = 0.44 S D = 0.49 M = 0.36 S D = 0.48 M = 0.40 S D = 0.49 M = 0.38 S D = 0.48 M = 0.47 S D = 0.50
Gear VR M = 0.14 S D = 0.35 M = 0.27 S D = 0.43 M = 0.39 S D = 0.49 M = 0.31 S D = 0.47 M = 0.36 S D = 0.48 M = 0.49 S D = 0.50 M = 0.35 S D = 0.48 M = 0.43 S D = 0.50 M = 0.46 S D = 0.50 M = 0.46 S D = 0.50
Figure A1. Estimation times, grouped by gender.
Electronics 12 02253 g0a1
Figure A2. Estimation times, grouped by dominant hand.
Electronics 12 02253 g0a2
Figure A3. Estimation times, grouped by whether the participants wore glasses.
Electronics 12 02253 g0a3
Figure A4. Estimation times, grouped by whether the participants had previous VR experience.
Electronics 12 02253 g0a4
Figure A5. Estimation times, grouped by the participants’ field of study.
Electronics 12 02253 g0a5
Figure A6. Estimation times, grouped by the heights of participants.
Electronics 12 02253 g0a6
Figure A7. Estimation times, grouped by the number of hours per week the participants played video games.
Electronics 12 02253 g0a7
Figure A8. Estimation times, grouped by display device.
Electronics 12 02253 g0a8

References

  1. Miller, C.L. Enhancing Visual Literacy of Engineering Students through the Use of Real and Computer Generated Models. Eng. Des. Graph. J. 1992, 56, 27–38. [Google Scholar]
  2. Miller, C.L.; Bertoline, G.R. Spatial Visualization Research and Theories: Their Importance in the Development of an Engineering and Technical Design Graphics Curriculum Model. Eng. Des. Graph. J. 1991, 55, 5–14. [Google Scholar]
  3. Cao, C.G.L.; Zhou, M.; Jones, D.B.; Schwaitzberg, S.D. Can Surgeons Think and Operate with Haptics at the Same Time? J. Gastrointest. Surg. 2007, 11, 1564–1569. [Google Scholar] [CrossRef]
  4. Loftin, R.B.; Scerbo, M.W.; McKenzie, F.D.; Catanzaro, J.M. Training in Peacekeeping Operations Using Virtual Environments. IEEE Comput. Graph. Appl. 2004, 24, 18–21. [Google Scholar] [CrossRef]
  5. Bingham, G.P. Calibration of Distance and Size Does Not Calibrate Shape Information: Comparison of Dynamic Monocular and Static and Dynamic Binocular Vision. Ecol. Psychol. 2005, 17, 55–74. [Google Scholar] [CrossRef]
  6. Mazyn, L.I.N.; Lenoir, M.; Montagne, G.; Delaey, C.; Savelsbergh, G.J.P. Stereo Vision Enhances the Learning of a Catching Skill. Exp. Brain Res. 2007, 179, 723–726. [Google Scholar] [CrossRef] [PubMed]
  7. Jarraya, M.; Chtourou, H.; Megdich, K.; Chaouachi, A.; Souissi, N.; Chamari, K. Effect of a Moderate-Intensity Aerobic Exercise on Estimates of Egocentric Distance. Percept. Mot. Ski. 2013, 116, 658–670. [Google Scholar] [CrossRef]
  8. Romeas, T.; Faubert, J. Assessment of Sport Specific and Nonspecific Biological Motion Perception in Soccer Athletes Shows a Fundamental Perceptual Ability Advantage over Non-Athletes for Reorganizing Body Kinematics. J. Vis. 2015, 15, 504. [Google Scholar] [CrossRef]
  9. Hijazi, M.M.K. Attention, Visual Perception and Their Relationship to Sport Performance in Fencing. J. Hum. Kinet. 2013, 39, 195–201. [Google Scholar] [CrossRef]
  10. Wu, S.; Spence, I. Playing Shooter and Driving Videogames Improves Top-down Guidance in Visual Search. Atten. Percept. Psychophys. 2013, 75, 673–686. [Google Scholar] [CrossRef]
  11. Latham, A.J.; Patston, L.L.M.; Tippett, L.J. The Virtual Brain: 30 Years of Video-Game Play and Cognitive Abilities. Front. Psychol. 2013, 4, 629. [Google Scholar] [CrossRef] [PubMed]
  12. Korecko, S.; Hudak, M.; Sobota, B.; Marko, M.; Cimrova, B.; Farkas, I.; Rosipal, R. Assessment and Training of Visuospatial Cognitive Functions in Virtual Reality: Proposal and Perspective. In Proceedings of the 2018 9th IEEE International Conference on Cognitive Infocommunications (CogInfoCom), Budapest, Hungary, 22–24 August 2018; IEEE: New York, NY, USA, 2018. [Google Scholar] [CrossRef]
  13. Mohler, B.J.; Creem-Regehr, S.H.; Thompson, W.B. The Influence of Feedback on Egocentric Distance Judgments in Real and Virtual Environments. In Proceedings of the 3rd Symposium on Applied Perception in Graphics and Visualization, Boston, MA, USA, 28–29 July 2006; ACM: New York, NY, USA, 2006. [Google Scholar] [CrossRef]
  14. Kövecses-Gősi, V. Cooperative Learning in VR Environment. Acta Polytech. Hung. 2018, 15, 205–224. [Google Scholar] [CrossRef]
  15. Capanema, I.F.; Santos Garcia, F.L.; Tissiani, G. Implications of Virtual Reality in Education. In Virtual Reality in Education: Online Survey; 2001; Available online: http://www.informatik.umu.se/~dfallman/projects/vrie (accessed on 11 May 2023).
  16. Katona, J.; Ujbanyi, T.; Sziladi, G.; Kovari, A. Examine the Effect of Different Web-Based Media on Human Brain Waves. In Proceedings of the 2017 8th IEEE International Conference on Cognitive Infocommunications (CogInfoCom), Debrecen, Hungary, 11–14 September 2017; IEEE: New York, NY, USA, 2017; pp. 000407–000412. [Google Scholar] [CrossRef]
  17. Sziladi, G.; Ujbanyi, T.; Katona, J.; Kovari, A. The Analysis of Hand Gesture Based Cursor Position Control during Solve an IT Related Task. In Proceedings of the 2017 8th IEEE International Conference on Cognitive Infocommunications (CogInfoCom), Debrecen, Hungary, 11–14 September 2017; IEEE: New York, NY, USA, 2017. [Google Scholar] [CrossRef]
  18. Katona, J. Clean and Dirty Code Comprehension by Eye-Tracking Based Evaluation Using GP3 Eye Tracker. Acta Polytech. Hung. 2021, 18, 79–99. [Google Scholar] [CrossRef]
  19. Csapo, A.B.; Nagy, H.; Kristjansson, A.; Wersenyi, G. Evaluation of Human-Myo Gesture Control Capabilities in Continuous Search and Select Operations. In Proceedings of the 2016 7th IEEE International Conference on Cognitive Infocommunications (CogInfoCom), Wroclaw, Poland, 16–18 October 2016; IEEE: New York, NY, USA, 2016. [Google Scholar] [CrossRef]
  20. Katona, J. Measuring Cognition Load Using Eye-Tracking Parameters Based on Algorithm Description Tools. Sensors 2022, 22, 912. [Google Scholar] [CrossRef]
  21. Katona, J.; Kovari, A.; Heldal, I.; Costescu, C.; Rosan, A.; Demeter, R.; Thill, S.; Stefanut, T. Using Eye-Tracking to Examine Query Syntax and Method Syntax Comprehension in LINQ. In Proceedings of the 2020 11th IEEE International Conference on Cognitive Infocommunications (CogInfoCom), Mariehamn, Finland, 23–25 September 2020; IEEE: New York, NY, USA, 2020; pp. 437–444. [Google Scholar] [CrossRef]
  22. Psotka, J. Immersive Training Systems: Virtual Reality and Education and Training. Instr. Sci. 1995, 23, 405–431. [Google Scholar] [CrossRef]
  23. Falah, J.; Khan, S.; Alfalah, T.; Alfalah, S.F.M.; Chan, W.; Harrison, D.K.; Charissis, V. Virtual Reality Medical Training System for Anatomy Education. In Proceedings of the 2014 Science and Information Conference, London, UK, 27–29 August 2014; IEEE: New York, NY, USA, 2014. [Google Scholar]
  24. Freina, L.; Ott, M. A Literature Review on Immersive Virtual Reality in Education: State of the Art and Perspectives. Int. Sci. Conf. Elearning Softw. Educ. 2015, 1, 10–18. [Google Scholar]
  25. Lele, A. Virtual Reality and Its Military Utility. J. Ambient Intell. Humaniz. Comput. 2013, 4, 17–26. [Google Scholar] [CrossRef]
  26. Seymour, N.E.; Gallagher, A.G.; Roman, S.A.; O’Brien, M.K.; Bansal, V.K.; Andersen, D.K.; Satava, R.M. Virtual Reality Training Improves Operating Room Performance: Results of a Randomized, Double-Blinded Study. Ann. Surg. 2002, 236, 458–463. [Google Scholar] [CrossRef] [PubMed]
  27. Ahlberg, G.; Enochsson, L.; Gallagher, A.G.; Hedman, L.; Hogman, C.; McClusky, D.A., 3rd; Ramel, S.; Smith, C.D.; Arvidsson, D. Proficiency-Based Virtual Reality Training Significantly Reduces the Error Rate for Residents during Their First 10 Laparoscopic Cholecystectomies. Am. J. Surg. 2007, 193, 797–804. [Google Scholar] [CrossRef]
  28. Dugdale, J.; Pavard, B.; Pallamin, N.; El Jed, M.; Maugan, C.L. Emergency Fire Incident Training in a Virtual World. In Proceedings of the ISCRAM, Brussels, Belgium, 3–4 May 2004; Volume 167, pp. 167–172. [Google Scholar]
  29. Satava, R.M. Medical Applications of Virtual Reality. J. Med. Syst. 1995, 19, 275–280. [Google Scholar] [CrossRef]
  30. Willem, I.M.; Willaert, R.; Aggarwal, I.; Van Herzeele, N.J.; Cheshire, F.E. Recent Advancements in Medical Simulation: Patient-Specific Virtual Reality Simulation. World J. Surg. 2012, 36, 1703–1712. [Google Scholar]
  31. Lee, H.-S.; Lim, J.-H.; Jeon, B.-H.; Song, C.-S. Non-Immersive Virtual Reality Rehabilitation Applied to a Task-Oriented Approach for Stroke Patients: A Randomized Controlled Trial. Restor. Neurol. Neurosci. 2020, 38, 165–172. [Google Scholar] [CrossRef]
  32. Bates, J. Virtual Reality, Art, and Entertainment. Presence 1992, 1, 133–138. [Google Scholar] [CrossRef]
  33. Zyda, M. From Visual Simulation to Virtual Reality to Games. Computer 2005, 38, 25–32. [Google Scholar] [CrossRef]
  34. Kortum, P. HCI Beyond the GUI: Design for Haptic, Speech, Olfactory, and Other Nontraditional Interfaces; Morgan Kaufmann: Oxford, UK, 2008; ISBN 9780123740175. [Google Scholar]
  35. Burdea, G.C.; Coiffet, P. Virtual Reality Technology, 2nd ed.; John Wiley & Sons: Nashville, TN, USA, 2003; ISBN 9780471360896. [Google Scholar]
  36. Schroeder, R.; Heldal, I.; Tromp, J. The Usability of Collaborative Virtual Environments and Methods for the Analysis of Interaction. Presence 2006, 15, 655–667. [Google Scholar] [CrossRef]
  37. Kovari, A. CogInfoCom Supported Education: A Review of CogInfoCom Based Conference Papers. In Proceedings of the 2018 9th IEEE International Conference on Cognitive Infocommunications (CogInfoCom), Budapest, Hungary, 22–24 August 2018; IEEE: New York, NY, USA, 2018. [Google Scholar] [CrossRef]
  38. Horvath, I. Innovative Engineering Education in the Cooperative VR Environment. In Proceedings of the 2016 7th IEEE International Conference on Cognitive Infocommunications (CogInfoCom), Wroclaw, Poland, 16–18 October 2016; IEEE: New York, NY, USA, 2016. [Google Scholar] [CrossRef]
  39. Sutcliffe, A.G.; Poullis, C.; Gregoriades, A.; Katsouri, I.; Tzanavari, A.; Herakleous, K. Reflecting on the Design Process for Virtual Reality Applications. Int. J. Hum. Comput. Interact. 2019, 35, 168–179. [Google Scholar] [CrossRef]
  40. Drettakis, G.; Roussou, M.; Reche, A.; Tsingos, N. Design and Evaluation of a Real-World Virtual Environment for Architecture and Urban Planning. Presence 2007, 16, 318–332. [Google Scholar] [CrossRef]
  41. Baranyi, P.; Csapo, A.; Sallai, G. Cognitive Infocommunications (CogInfoCom); Springer: Berlin/Heidelberg, Germany, 2015. [Google Scholar]
  42. Katona, J. A Review of Human–Computer Interaction and Virtual Reality Research Fields in Cognitive InfoCommunications. Appl. Sci. 2021, 11, 2646. [Google Scholar] [CrossRef]
  43. Willemsen, P.; Gooch, A.A. Perceived Egocentric Distances in Real, Image-Based, and Traditional Virtual Environments. In Proceedings of the IEEE Virtual Reality, Orlando, FL, USA, 24–28 March 2002; IEEE Computer Society: New York, NY, USA, 2003. [Google Scholar] [CrossRef]
  44. Kenyon, R.V.; Phenany, M.; Sandin, D.; Defanti, T. Accommodation and Size-Constancy of Virtual Objects. Ann. Biomed. Eng. 2008, 36, 342–348. [Google Scholar] [CrossRef]
  45. Cutting, J.E.; Vishton, P.M. Perceiving Layout and Knowing Distances. In Perception of Space and Motion; Elsevier: Amsterdam, The Netherlands, 1995; pp. 69–117. ISBN 9780122405303. [Google Scholar] [CrossRef]
  46. Renner, R.S.; Velichkovsky, B.M.; Helmert, J.R. The Perception of Egocentric Distances in Virtual Environments—A Review. ACM Comput. Surv. 2013, 46, 1–40. [Google Scholar] [CrossRef]
  47. Luo, X.; Kenyon, R.V.; Kamper, D.G.; Sandin, D.J.; DeFanti, T.A. On the Determinants of Size-Constancy in a Virtual Environment. Int. J. Virtual Real. 2009, 8, 43–51. [Google Scholar] [CrossRef]
  48. Naceri, A.; Chellali, R.; Hoinville, T. Depth perception within peripersonal space using head-mounted display. Presence 2011, 20, 254–272. [Google Scholar] [CrossRef]
  49. Murgia, A.; Sharkey, P.M. Estimation of Distances in Virtual Environments Using Size Constancy. Int. J. Virtual Real. 2009, 8, 67–74. [Google Scholar] [CrossRef]
  50. Ries, B.; Interrante, V.; Kaeding, M.; Phillips, L. Analyzing the Effect of a Virtual Avatar’s Geometric and Motion Fidelity on Ego-Centric Spatial Perception in Immersive Virtual Environments. In Proceedings of the 16th ACM Symposium on Virtual Reality Software and Technology, Kyoto, Japan, 18–20 November 2009; ACM: New York, NY, USA, 2009. [Google Scholar] [CrossRef]
  51. Thomas, G.; Goldberg, J.H.; Cannon, D.J.; Hillis, S.L. Surface Textures Improve the Robustness of Stereoscopic Depth Cues. Hum. Factors 2002, 44, 157–170. [Google Scholar] [CrossRef]
  52. Lappin, J.S.; Shelton, A.L.; Rieser, J.J. Environmental Context Influences Visually Perceived Distance. Percept. Psychophys. 2006, 68, 571–581. [Google Scholar] [CrossRef]
  53. Vaziri, K.; Liu, P.; Aseeri, S.; Interrante, V. Impact of Visual and Experiential Realism on Distance Perception in VR Using a Custom Video See-through System. In Proceedings of the ACM Symposium on Applied Perception, Cottbus, Germany, 16–17 September 2017; ACM: New York, NY, USA, 2017. [Google Scholar] [CrossRef]
  54. Kunz, B.R.; Wouters, L.; Smith, D.; Thompson, W.B.; Creem-Regehr, S.H. Revisiting the Effect of Quality of Graphics on Distance Judgments in Virtual Environments: A Comparison of Verbal Reports and Blind Walking. Atten. Percept. Psychophys. 2009, 71, 1284–1293. [Google Scholar] [CrossRef] [PubMed]
  55. Mohler, B.J.; Creem-Regehr, S.H.; Thompson, W.B.; Bülthoff, H.H. The Effect of Viewing a Self-Avatar on Distance Judgments in an HMD-Based Virtual Environment. Presence 2010, 19, 230–242. [Google Scholar] [CrossRef]
  56. Landy, M.S.; Maloney, L.T.; Johnston, E.B.; Young, M. Measurement and Modeling of Depth Cue Combination: In Defense of Weak Fusion. Vision Res. 1995, 35, 389–412. [Google Scholar] [CrossRef] [PubMed]
  57. Tai, N.-C. Daylighting and Its Impact on Depth Perception in a Daylit Space. J. Light Vis. Environ. 2012, 36, 16–22. [Google Scholar] [CrossRef]
  58. Wu, B.; Ooi, T.L.; He, Z.J. Perceiving Distance Accurately by a Directional Process of Integrating Ground Information. Nature 2004, 428, 73–77. [Google Scholar] [CrossRef]
  59. Sinai, M.J.; Ooi, T.L.; He, Z.J. Terrain Influences the Accurate Judgement of Distance. Nature 1998, 395, 497–500. [Google Scholar] [CrossRef] [PubMed]
  60. Mohler, B.J.; Bülthoff, H.H.; Thompson, W.B.; Creem-Regehr, S.H. A Full-Body Avatar Improves Egocentric Distance Judgments in an Immersive Virtual Environment. In Proceedings of the 5th Symposium on Applied Perception in Graphics and Visualization, Los Angeles, CA, USA, 9–10 August 2008; ACM: New York, NY, USA, 2008. [Google Scholar] [CrossRef]
  61. Bingham, G.P.; Zaal, F.; Robin, D.; Shull, J.A. Distortions in Definite Distance and Shape Perception as Measured by Reaching without and with Haptic Feedback. J. Exp. Psychol. Hum. Percept. Perform. 2000, 26, 1436–1460. [Google Scholar] [CrossRef] [PubMed]
  62. Armbrüster, C.; Wolter, M.; Kuhlen, T.; Spijkers, W.; Fimm, B. Depth Perception in Virtual Reality: Distance Estimations in Peri- and Extrapersonal Space. Cyberpsychol. Behav. 2008, 11, 9–15. [Google Scholar] [CrossRef]
  63. Rolland, J.P.; Gibson, W.; Ariely, D. Towards Quantifying Depth and Size Perception in Virtual Environments. Presence 1995, 4, 24–49. [Google Scholar] [CrossRef]
  64. Viguier, A.; Clément, G.; Trotter, Y. Distance Perception within near Visual Space. Perception 2001, 30, 115–124. [Google Scholar] [CrossRef]
  65. Leyrer, M.; Linkenauger, S.A.; Bülthoff, H.H.; Kloos, U.; Mohler, B. The Influence of Eye Height and Avatars on Egocentric Distance Estimates in Immersive Virtual Environments. In Proceedings of the ACM SIGGRAPH Symposium on Applied Perception in Graphics and Visualization, Toulouse, France, 27–28 August 2011; ACM: New York, NY, USA, 2011. [Google Scholar] [CrossRef]
  66. Plumert, J.M.; Kearney, J.K.; Cremer, J.F.; Recker, K. Distance Perception in Real and Virtual Environments. ACM Trans. Appl. Percept. 2005, 2, 216–233. [Google Scholar] [CrossRef]
  67. Bian, Z.; Andersen, G.J. Aging and the Perception of Egocentric Distance. Psychol. Aging 2013, 28, 813–825. [Google Scholar] [CrossRef]
  68. Creem-Regehr, S.H.; Willemsen, P.; Gooch, A.A.; Thompson, W.B. The Influence of Restricted Viewing Conditions on Egocentric Distance Perception: Implications for Real and Virtual Indoor Environments. Perception 2005, 34, 191–204. [Google Scholar] [CrossRef]
  69. Interrante, V.; Ries, B.; Anderson, L. Distance Perception in Immersive Virtual Environments, Revisited. In Proceedings of the IEEE Virtual Reality Conference (VR 2006), Alexandria, VA, USA, 25–29 March 2006; IEEE: New York, NY, USA, 2006. [Google Scholar] [CrossRef]
  70. Naceri, A.; Chellali, R. The Effect of Isolated Disparity on Depth Perception in Real and Virtual Environments. In Proceedings of the 2012 IEEE Virtual Reality (VR), Costa Mesa, CA, USA, 4–8 March 2012; IEEE: New York, NY, USA, 2012. [Google Scholar] [CrossRef]
  71. Foreman, N.; Sandamas, G.; Newson, D. Distance Underestimation in Virtual Space Is Sensitive to Gender but Not Activity-Passivity or Mode of Interaction. Cyberpsychol. Behav. 2004, 7, 451–457. [Google Scholar] [CrossRef]
  72. Coelho, H.; Melo, M.; Branco, F.; Vasconcelos-Raposo, J.; Bessa, M. The Impact of Gender, Avatar and Height in Distance Perception in Virtual Environments. In Advances in Intelligent Systems and Computing; Springer International Publishing: Cham, Switzerland, 2019; pp. 696–705. ISBN 9783030161835. [Google Scholar] [CrossRef]
  73. David, W.; Hosmer, S.; Lemeshow, R.X. Applied Logistic Regression; John Wiley & Sons: Hoboken, NJ, USA, 2013; Volume 398. [Google Scholar]
Figure 1. Different perspectives of two tests: (a) a round without a scale as seen in the Unity editor; (b) a round with a scale as seen in the Unity editor; (c) a round without a scale as seen from the perspective of participants; and (d) a round with a scale as seen from the perspective of participants.
Electronics 12 02253 g001
Figure 2. The 95% CIs of the estimated significant coefficients when one factor was analyzed.
Electronics 12 02253 g002
Figure 3. The 95% CIs of the estimated significant coefficients when pairs of factors were analyzed.
Electronics 12 02253 g003
Figure 4. The 95% CIs of the estimated significant coefficients when triplets of factors were analyzed. These triplets consisted of gender, gaming hours per week, and display device.
Electronics 12 02253 g004
Figure 5. The 95% CIs of the estimated significant coefficients when triplets of factors were analyzed. These triplets consisted of gender, previous VR experience, and display device.
Electronics 12 02253 g005
Figure 6. The 95% CIs of the estimated significant coefficients when triplets of factors were analyzed. These triplets consisted of gaming hours per week, previous VR experience, and display device.
Electronics 12 02253 g006
Figure 7. The 95% CIs of each investigated significant factor regarding the effects on distance estimation time.
Electronics 12 02253 g007
Figure 8. The 95% CIs of each investigated significant pair of factors regarding the effects on distance estimation time. They are graphically split into (a,b) for better readability.
Electronics 12 02253 g008
Figure 9. The 95% CIs of each investigated significant triplet of factors regarding the effects on distance estimation time. They are graphically split into (ac) for better readability.
Electronics 12 02253 g009
Figure 10. The 95% CIs of each investigated significant quartet of factors regarding the effects on distance estimation time. They are graphically split into (ad) for better readability.
Electronics 12 02253 g010aElectronics 12 02253 g010b
Figure 11. The 95% CIs of each investigated significant quintet of factors regarding the effects on distance estimation time. They are graphically split into (a,b) for better readability.
Electronics 12 02253 g011
Disclaimer/Publisher’s Note: The statements, opinions and data contained in all publications are solely those of the individual author(s) and contributor(s) and not of MDPI and/or the editor(s). MDPI and/or the editor(s) disclaim responsibility for any injury to people or property resulting from any ideas, methods, instructions or products referred to in the content.

