Communication

Energy-Based MRI Semantic Augmented Segmentation for Unpaired CT Images

School of Computer Science and Technology, East China Normal University, Shanghai 200062, China
*
Author to whom correspondence should be addressed.
Electronics 2023, 12(10), 2174; https://doi.org/10.3390/electronics12102174
Submission received: 10 March 2023 / Revised: 24 April 2023 / Accepted: 2 May 2023 / Published: 10 May 2023

Abstract

:
The multimodal segmentation of medical images is essential for clinical applications as it allows medical professionals to detect anomalies, monitor treatment effectiveness, and make informed therapeutic decisions. However, existing segmentation methods depend on paired images of modalities, which may not always be available in practical scenarios, thereby limiting their applicability. To address this challenge, current approaches aim to align modalities or generate missing modality images without a ground truth, which can introduce irrelevant texture details. In this paper, we propose the energy-basedsemantic augmented segmentation (ESAS) model, which employs the energy of latent semantic features from a supporting modality to enhance the segmentation performance on unpaired query modality data. The proposed ESAS model is a lightweight and efficient framework suitable for most unpaired multimodal image-learning tasks. We demonstrate the effectiveness of our ESAS model on the MM-WHS 2017 challenge dataset, where it significantly improved Dice accuracy for cardiac segmentation on CT volumes. Our results highlight the potential of the proposed ESAS model to enhance patient outcomes in clinical settings by providing a promising approach for unpaired multimodal medical image segmentation tasks.

1. Introduction

In contemporary clinical practice, the application of imaging modalities has brought about a paradigm shift in the identification and management of diverse pathologies and medical ailments. These advanced technologies offer intricate depictions of internal tissue and organ structures, facilitating medical practitioners in the detection of anomalies, tracking treatment efficacy, and making informed therapeutic judgments [1]. Notably, computed tomography (CT) and magnetic resonance imaging (MRI) are widely utilized imaging modalities, particularly in rendering precise anatomical details of cardiac structures [2].
Medical image analysis relies heavily on accurate segmentation, which is a pivotal process that partitions an image into distinct regions based on its intensity or other relevant features. Segmentation aims to isolate structures or tissues of interest within the image. However, the unique imaging characteristics and underlying physical principles governing image formation necessitate the development of separate segmentation methods for CT and MRI data. Thus, modality-based segmentation strategies are employed to meet the specific requirements of each imaging modality. Various traditional algorithms have been proposed to assist in organ segmentation, including thresholding, region-based methods and graph cut techniques [3]. Thresholding is a classic and straightforward approach for segmenting images with light objects against dark backgrounds [4], as it involves fewer calculations. Region growing is a common example of a region-based method [5], but its effectiveness depends on the selection of seed points, and it can result in under-segmentation when dealing with tissue that is not uniform. To address this issue, researchers have proposed adaptive methods [6] that learn homogeneous criteria for the region, but their efficiency still depends on the tissue’s homogeneity. Graph cut represents the image as an undirected weighted graph, requiring careful selection of seed points labelled as “object” and “background” [7], so it cannot always be automated. Notably, deep learning-based methodologies have shown promising results in several medical image analysis tasks through their reliance on vast amounts of annotated data [8]. U-Net [9] is a common approach that uses an “encoder–decoder” structure, where the encoder part extracts the image features and the decoder part uses them to generate the segmentation results. It has strong accuracy and reliability in segmentation tasks, especially for small target segmentation in medical images. SegNet [10] is also a commonly used method that uses an “encoder–decoder” structure similar to U-Net but introduces the indexing of the maximum pooling layer in the decoder part to improve the accuracy and robustness of image segmentation. This method has also achieved good results in medical image segmentation tasks [11].
However, independent modality utility may lead to the omission of comparative modality information, which refers to information that can be derived by comparing images from different imaging modalities. Certain tissues may appear differently in different imaging modalities due to variations in their physical properties, and this difference can be leveraged to improve the accuracy of the segmentation model [12]. Consequently, multimodality learning has emerged as a rapidly evolving approach in the medical imaging field.
Leveraging the comparative modality information by training segmentation models using both CT and MRI data can lead to the development of more accurate and robust multimodal segmentation methods, which are extensively utilized in multimodal learning. Previous studies have demonstrated the efficacy of joint learning from multimodality data in enhancing the accuracy of medical image segmentation. Various strategies have been proposed in the literature to accomplish this objective. One such approach is the early fuse strategy, where multiple modalities are concatenated as a network input [13,14,15]. Recent works have also employed intermediate multimodal representations to fuse information [16,17]. These strategies effectively enable the fusion of information from different modalities, resulting in more accurate and robust segmentation models.
The above-mentioned multimodal segmentation methods rely on paired modality images, which necessitates that the input images are both paired and registered across multiple modalities. However, acquiring paired images may not always be possible due to various reasons, such as the high cost of certain inspections, the significant challenge of processing large amounts of paired multimodal data, and the time-consuming and labor-intensive task of labelling. The high cost of MRI inspection often results in a common scenario where patients only undergo CT inspection, leading to a unimodal image that may have limitations in medical segmentation or diagnosis due to the absence of comparative modality information. To simplify the discussion, we refer to the more accessible data as the query modality and the lacking modality as the support modality. In this context, there exists an independent support modality dataset that is unpaired with the query modality. The objective of this work is to address the challenge of unpaired multimodal medical image segmentation by leveraging the complementary information available from the support modality to improve the accuracy of medical image segmentation. In this paper, unpaired multimodal indicates that for both the training and validation stages, the same patient only has images of one of the modalities.
To leverage prior semantic knowledge from unpaired support modality, several approaches have been proposed. Some methods [18,19] have used special network structures with shared parameters. Nie et al. [18] proposed a Y-shaped network, a widely-used late fusion scheme for multimodal learning. Valindria et al. [19] proposed an X-shaped network. They developed dual-stream encoder–decoder architectures, assigning specific feature extractors to the data for each modality separately to explore cross-modality information. However, similar approaches may not effectively capture the intricate relationship. Some methods [20,21,22,23] have emphasized image synthesis. Jiang et al. [20] and Zhang et al. [21] proposed to eliminate the gap between different modalities with the generative adversarial network (GAN) for multimodal segmentation. In recent years, some unsupervised domain adaptation methods [22,23] have been proposed which intend to reduce the gap between source and target domains by leveraging source domain-labelled data to generate labels for the target domain. Nevertheless, these methods introduce additional networks from features to high-definition pictures. This part is mainly for generating texture and style information, which is not helpful for segmentation. Other methods employ knowledge distillation [24,25]. Li et al. [24] proposed a novel mutual knowledge distillation scheme to better exploit modality-shared knowledge with mutual guidance of model outputs, integrating cross-modality knowledge in a mutual-guided way instead of directly fusing multimodality knowledge by joint training. Dou et al. [25] reused network parameters by sharing all convolution kernels across CT and MRI and only employed modality-specific internal normalization layers that compute respective statistics. Meanwhile, the authors of [25] introduced a novel loss term by explicitly constraining the Kullback–Leibler (KL) divergence [26] of derived prediction distributions between modalities. But the strategies of these methods need manual design, and their distillation strategies are not necessarily perfect.
Instead of generating a support modality image without a ground truth, this work proposes to leverage the latent energy of semantic features. Specifically, this paper introduces a novel approach called the energy-based semantic augmented segmentation (ESAS) model, which utilizes the semantic priors of the support modality to enhance the segmentation performance on the query modality data. In this case, CT is the query modality, and MRI is the support modality, as CT images are more accessible. ESAS can also be extended to other unpaired multimodal medical segmentation tasks. In detail, ESAS utilizes a U-Net [9] architecture and extracts latent semantic features from the support modality. To extract semantic features from the query modality and support modality in a common space, we leverage a shared-parameter decoder with independent batch normalization layers. Further, as in the validation stage, only the query modality is accessed, ESAS learns an energy-based model and leverages the latent semantic features’ energy of the support modality to transport semantic features of the query modality to that of the support modality. Finally, it combines the complete semantic features, including semantic comparative modality information, for segmentation. Overall, ESAS leverages the latent semantic features’ energy of the support modality to generate semantic comparative modality information, which can be used to assist in segmentation. We conduct experiments on the MM-WHS 2017 challenge dataset [2] to validate the efficiency of our ESAS method. The results of the experiments show that our proposed ESAS framework substantially improves the Dice accuracy for cardiac segmentation on CT volumes. The main contributions of this work are summarized as follows:
-
The proposed ESAS, which leverages the latent semantic features’ energy of the support modality to generate semantic comparative modality information, is a novel and general method that can be applied to most unpaired multimodal image-learning tasks;
-
Instead of generating a whole image, this work only transforms the semantic features, making the approach lightweight and efficient;
-
Extensive experiments on the MM-WHS 2017 challenge dataset [2] demonstrate the effectiveness of the proposed method, ESAS, which outperforms the state-of-the-art methods.

2. Materials and Methods

To implicitly leverage the schema of unpaired modalities, in this work, we introduce a novel unpaired multimodal medical image segmentation method named energy-based semantic augmented segmentation (ESAS). The overall approach is depicted in Figure 1, which highlights the key steps of our method.
Firstly, we introduce the structural design of a pre-trained model with shared parameters. By sharing the same parameters across different modalities, the ESAS can ensure that the learned features are consistent and compatible across modalities. Following the pre-trained model, we introduce an energy-based model for image translation. This model aims to generate realistic images from one modality to another. By learning to translate images between modalities, we can bridge the gap between different data sources and enable the use of more available information for segmentation.

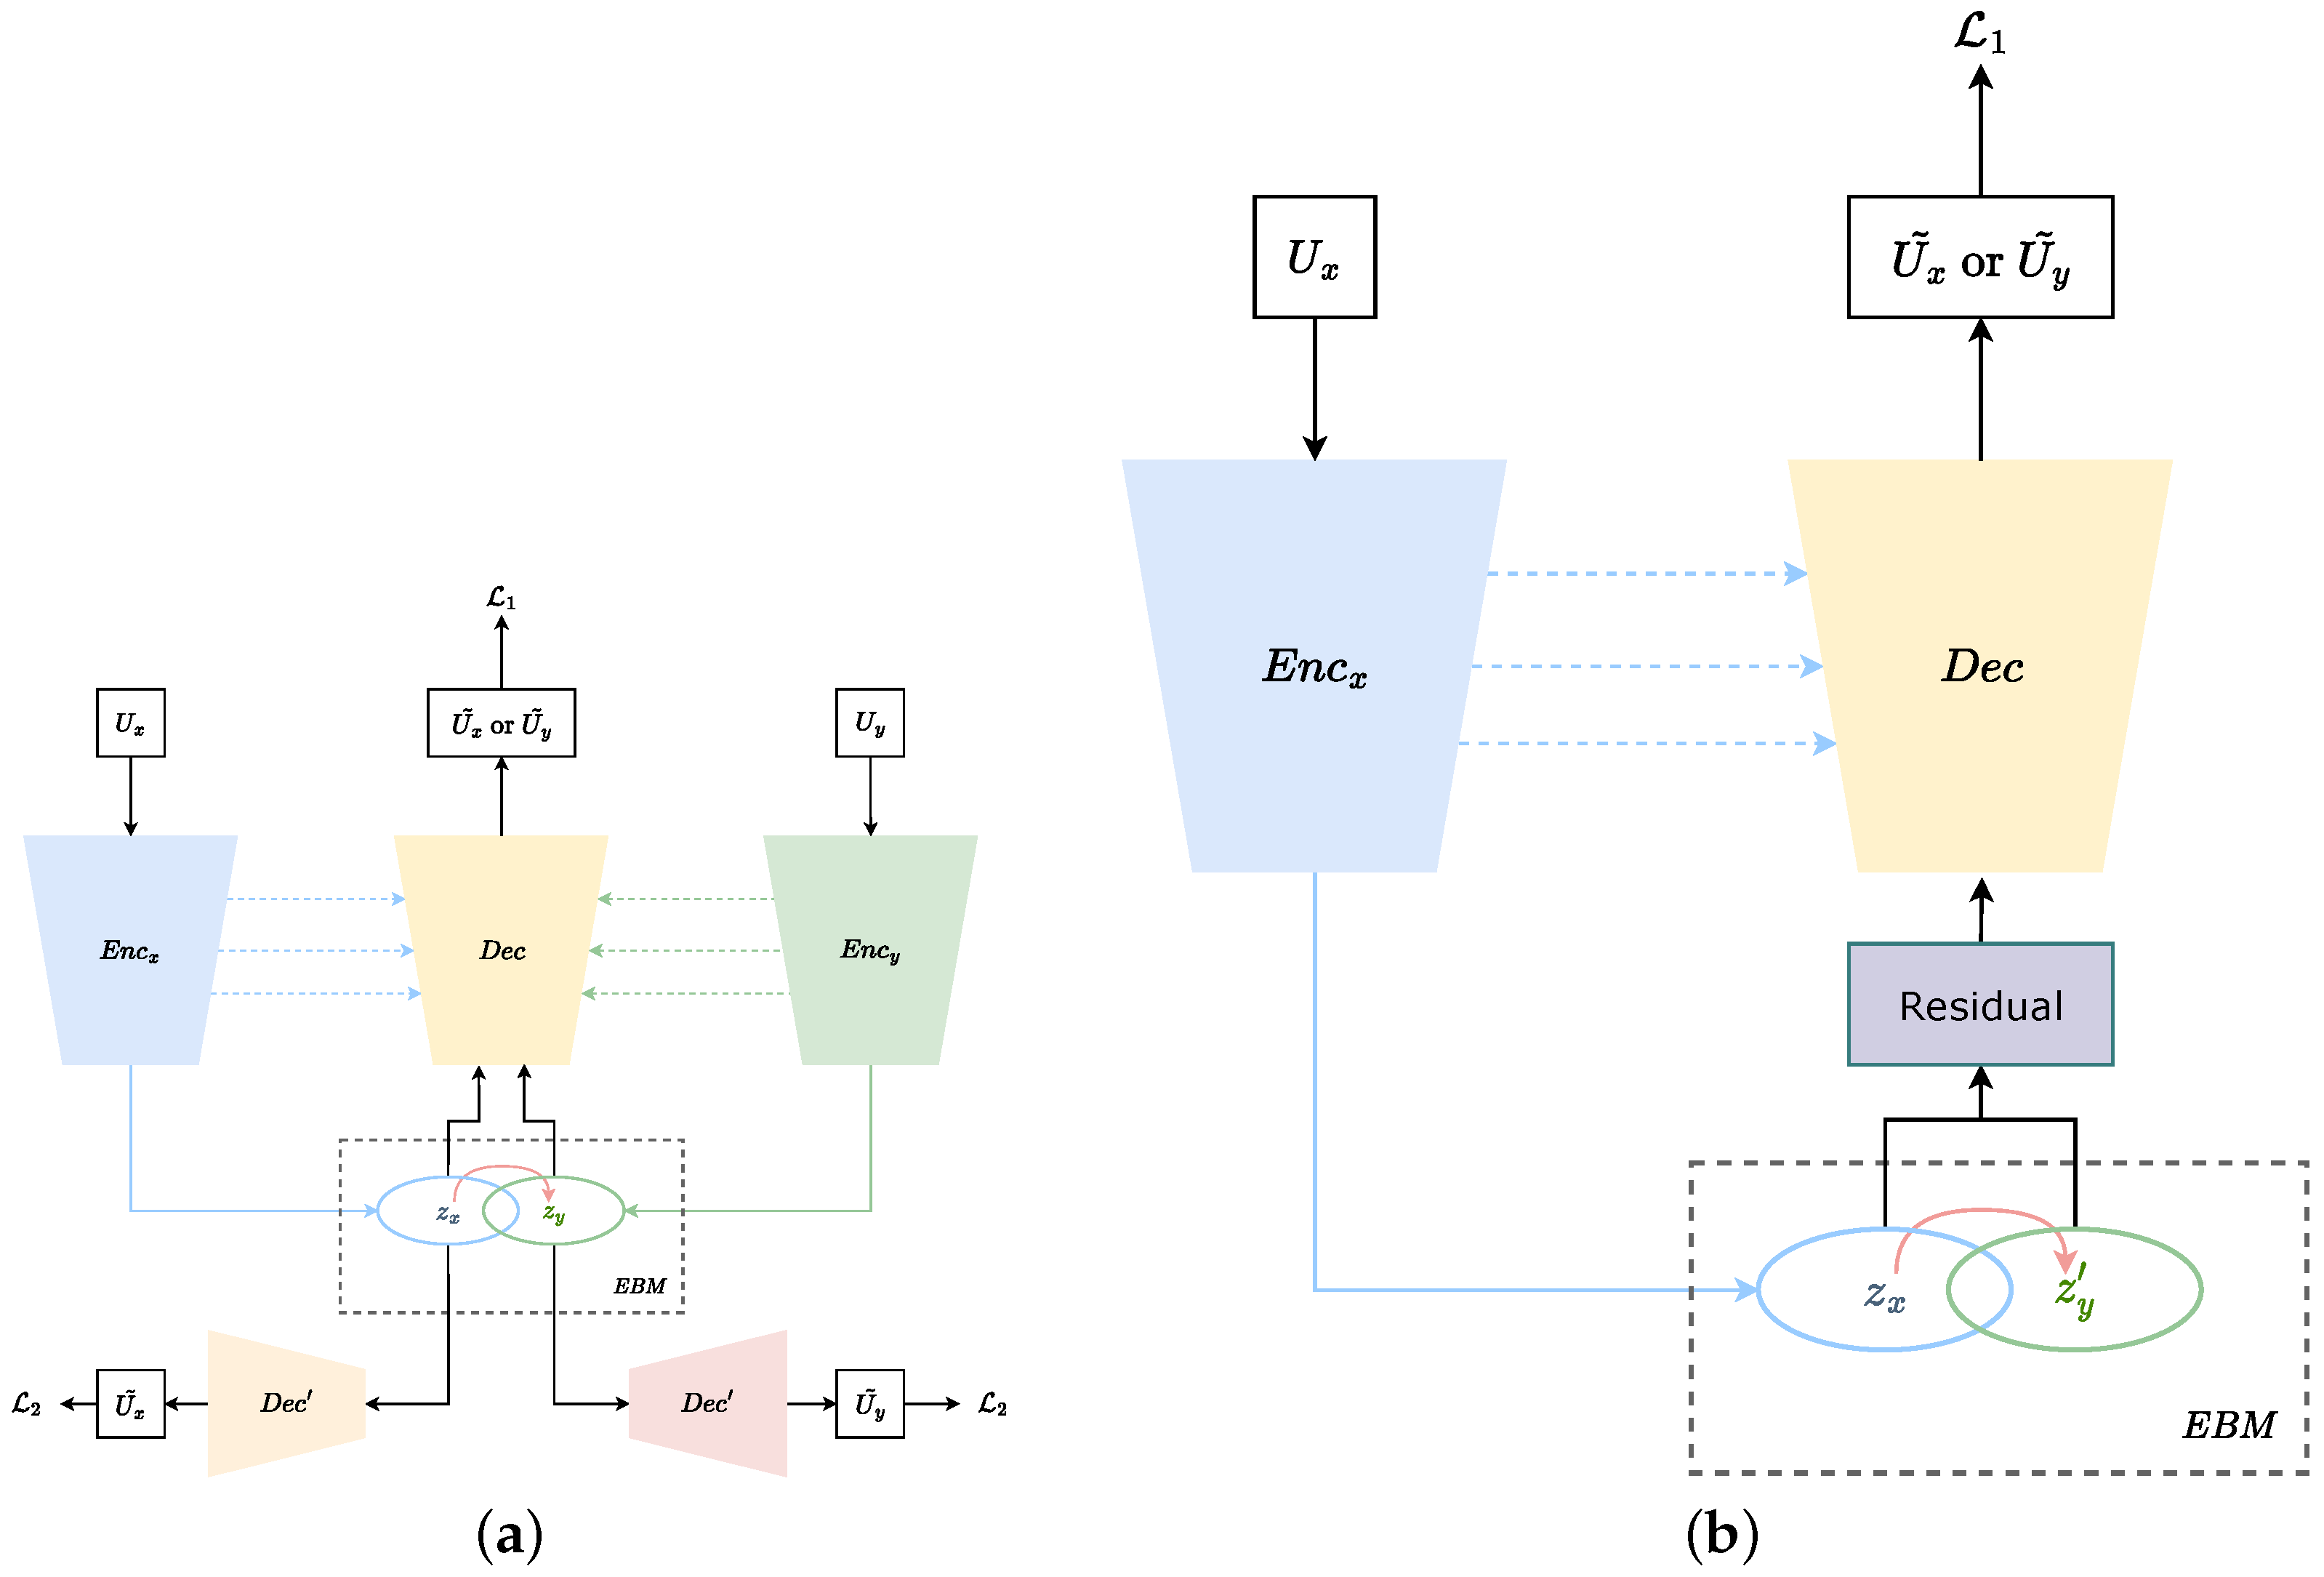
2.1. Pre-Trained Model with Shared Parameters

Inspired by [25], which employed the same set of CNN kernels to extract features for both modalities rather than using modality-specific encoders/decoders with early/late fusions. In our approach, we utilize a shared convolutional layer in the decoder for both modalities, while employing separate CNN convolutional layers for each modality’s encoder. It gives hope for the extraction of more expressive and robust universal representations through the use of these modality-independent kernels. Calibration of the model’s feature extraction is important for this purpose. Normalizing the internal activation to a Gaussian distribution is a common practice for improving convergence speed and network generality.
Let x S g k denote the activation in the kth layer, S g k is the gth group of activations in the layer for which the mean and variance are computed. The normalization layer is:
y = x E [ x ] V a r [ x ] + ϵ · γ + β ,
where γ and β denote the trainable scale and shift. There are different ways to define S g k , e.g., batch normalization [27], instance normalization [28], group normalization [29], etc.
We utilize distinct internal normalization techniques for each modality since the CT and MRI data possess dissimilar statistics that necessitate distinct normalization methods; otherwise, this could produce defective features. To be more precise, separate variable scopes are used to implement normalization layers for different modalities (i.e., CT and MRI), while a shared variable scope is used to construct convolution layers. For each training iteration, the samples from each modality are loaded separately into sub-groups and passed through shared convolution layers and independent normalization layers to generate logits. These logits are then used to compute the loss.
Since there is a skip connection for the U-shaped network used here, the image-to-image translation needs to be verified. To verify the effectiveness of the image-to-image transition that will be discussed later, we use the intermediate results of the encoder and downsampled ground truth to train a simple decoder D e c for the support modality at the same time. During training, DC and CE loss need to be calculated [30]:
L = D C + C E ,
where D C denotes the Dice coefficient and C E means cross-entropy. The Dice loss and cross-entropy loss can be calculated by
D C = 1 2 i = 1 C x i x i ^ i = 1 C ( x i + x i ^ ) ,
C E = i = 1 C x i log ( x i ^ ) ,
where C, x i and x i ^ represent the number of classes, the ground truth (0 or 1), and the predicted class probability, respectively.
The model will be trained by minimizing L 1 + λ L 2 .
  • L 1 : the loss measures the difference between the full-sized segmentation results of the U-shaped network and the ground truth.
  • L 2 : the loss measures the difference between the low-resolution inference results of the simple decoders D e c and the downsampled ground truth.

2.2. Energy-Based Modal

Given an observed image x R D sampled from distribution p data , an energy-based model is defined as follows:
p θ ( x ) = exp E θ ( x ) Z ( θ ) ,
where E θ ( x ) : R D R is the scalar energy function parameterized by θ and Z ( θ ) denotes the partition function:
Z ( θ ) = exp ( E θ ( x ) ) d x .
To calculate the energy of all x, which cannot be solved in high dimensions, we need some way to approximate or avoid directly calculating Z ( θ ) .
The model can be trained by maximizing the log-likelihood
L ( θ ) = 1 N i = 1 N log p θ ( x i )   E x p data log ( p θ ( x ) )
with the given data points { x i } i = 1 N observed from the data distribution. The derivative of the negative log-likelihood is
L ( θ ) θ = E x p d a t a θ E θ ( x ) E x ˜ p θ θ E θ ( x ˜ ) ,
where the second expectation term under p θ is intractable. We will approximate it via Markov chain Monte Carlo (MCMC) such that the EBM can be updated by gradient descent [31].
To sample x ˜ p θ via MCMC, we rely on Langevin dynamics that recursively compute the following step [32]:
x ˜ t + 1 = x ˜ t η t 2 x ˜ t E θ x ˜ t + η t ϵ t , ϵ t N ( 0 , I ) ,
where η t is the step size typical with polynomially decay to ensure convergence and ϵ t is a Gaussian sample to capture the data uncertainty and ensure sample convergence.
Given two domains X and Y , our input images are sampled on the marginal distributions P X and P Y . Suppose we want to translate from X to Y (i.e., from CT to MRI). We can achieve this by performing image-to-image translation in the latent semantic space obtained from the previous pre-trained encoder.
Specifically, we consider a pre-trained model for the input image u as follows:
Encoding :   z x = E n c x ( u ) , u P X   z y = E n c y ( u ) , u P Y Decoding :   u ˜ = D e c ( z x )   ( or   D e c ( z y ) ) ,
where E n c x ( · ) , E n c y ( · ) and D e c ( · ) represent the encoder and decoder, and z x and z y represent the semantic information extracted by the corresponding encoder.
To adapt P X to P Y , we aim to learn an EBM E x y such that:
p θ ( z y ) = 1 Z ( θ ) exp ( E x y ( z y ) ) , z y = E n c y ( y ) .
In practice, we use a 3D convolutional network as the EBM. The learning process of E x y is very simple by adopting Equation (9):
z ˜ y t + 1 = z ˜ y t η t 2 z ˜ y t E x y z ˜ y t + η t ϵ t ,
where z ˜ y 0 = z x = E n c x ( x ) , x P X . After T Langevin steps, the reconstructed D e c ( z ) will serve as a better result, where z is the concatenate of z x and z ˜ y T . As the encoders are pre-trained, the above method only requires optimization of the EBM before training a new decoder D e c . Meanwhile, z x and z y are the last latent space that is not involved in the skip connection in the U-shaped network.

3. Experiments and Results

3.1. Dataset and Implementation Details

We evaluate the proposed method on the Multimodality Whole Heart Segmentation Challenge 2017 (MM-WHS 2017) dataset, which contains unpaired 20 MRI and 20 CT volumes as training data and the annotations of 7 cardiac substructures, including the left ventricle blood cavity (LV), the right ventricle blood cavity (RV), the left atrium blood cavity (LA), the right atrium blood cavity (RA), the myocardium of the left ventricle (MYO), the ascending aorta (AA), and the pulmonary artery (PA) [2]. We set MRI as the support modality and CT as the query modality. We randomly split 20 CT volumes and 20 MRI volumes into five folds and utilize five-fold cross-validation. All experiments were conducted based on Python 3.10.9 , PyTorch 1.13.1 , and Ubuntu 20.04 . All training procedures were performed on a single NVIDIA A100 GPU with 40GB memory, taking about 3 h for training.
For data pre-processing, we use the same pre-processing (code for data pre-processing in nnU-Net: https://github.com/MIC-DKFZ/nnUNet/blob/v1.7.1/nnunet/preprocessing/preprocessing.py, accessed on 20 April 2023) and argumentation (code for data augmentation in nnU-Net: https://github.com/MIC-DKFZ/nnUNet/blob/v1.7.1/nnunet/training/data_augmentation/default_data_augmentation.py accessed on 20 April 2023) method as nnU-Net [30] and use the patch-based training mode with a patch size of 64 × 64 × 64 . We train our network for 1000 epochs with a batch size of 2. The Adam [33] algorithm (documentation and implementation of Adam in Pytorch: https://pytorch.org/docs/stable/generated/torch.optim.Adam.html, accessed on 20 April 2023) is leveraged to optimize the network with β 1 and β 2 of 0.9 and 0.999 , respectively, as they are good default settings for the tested machine learning problems [33]. Furthermore, we adopt the “poly” learning rate policy where the initial learning rate 10 4 is multiplied by 1 epoch max _ epoch p with p = 0.9 . For EBM, the number of Langevin steps is default set to 20.
We list the network configurations of our proposed ESAS in Table 1. In detail, the “Dilated Conv3D” is a type of convolution that can “inflate” the kernel by inserting holes between the kernel elements [34], the “ConvTranspose3D” is used to upsample the feature maps of the previous layer, which involves expanding the size of the feature maps by padding zeros and then applying a convolution operation to them [35]. The “Decoder” row indicates the configuration of the decoder D e c in the pre-training stage. For D e c , used in the training and inference stage, we design a residual block to combine multimodal semantic features.

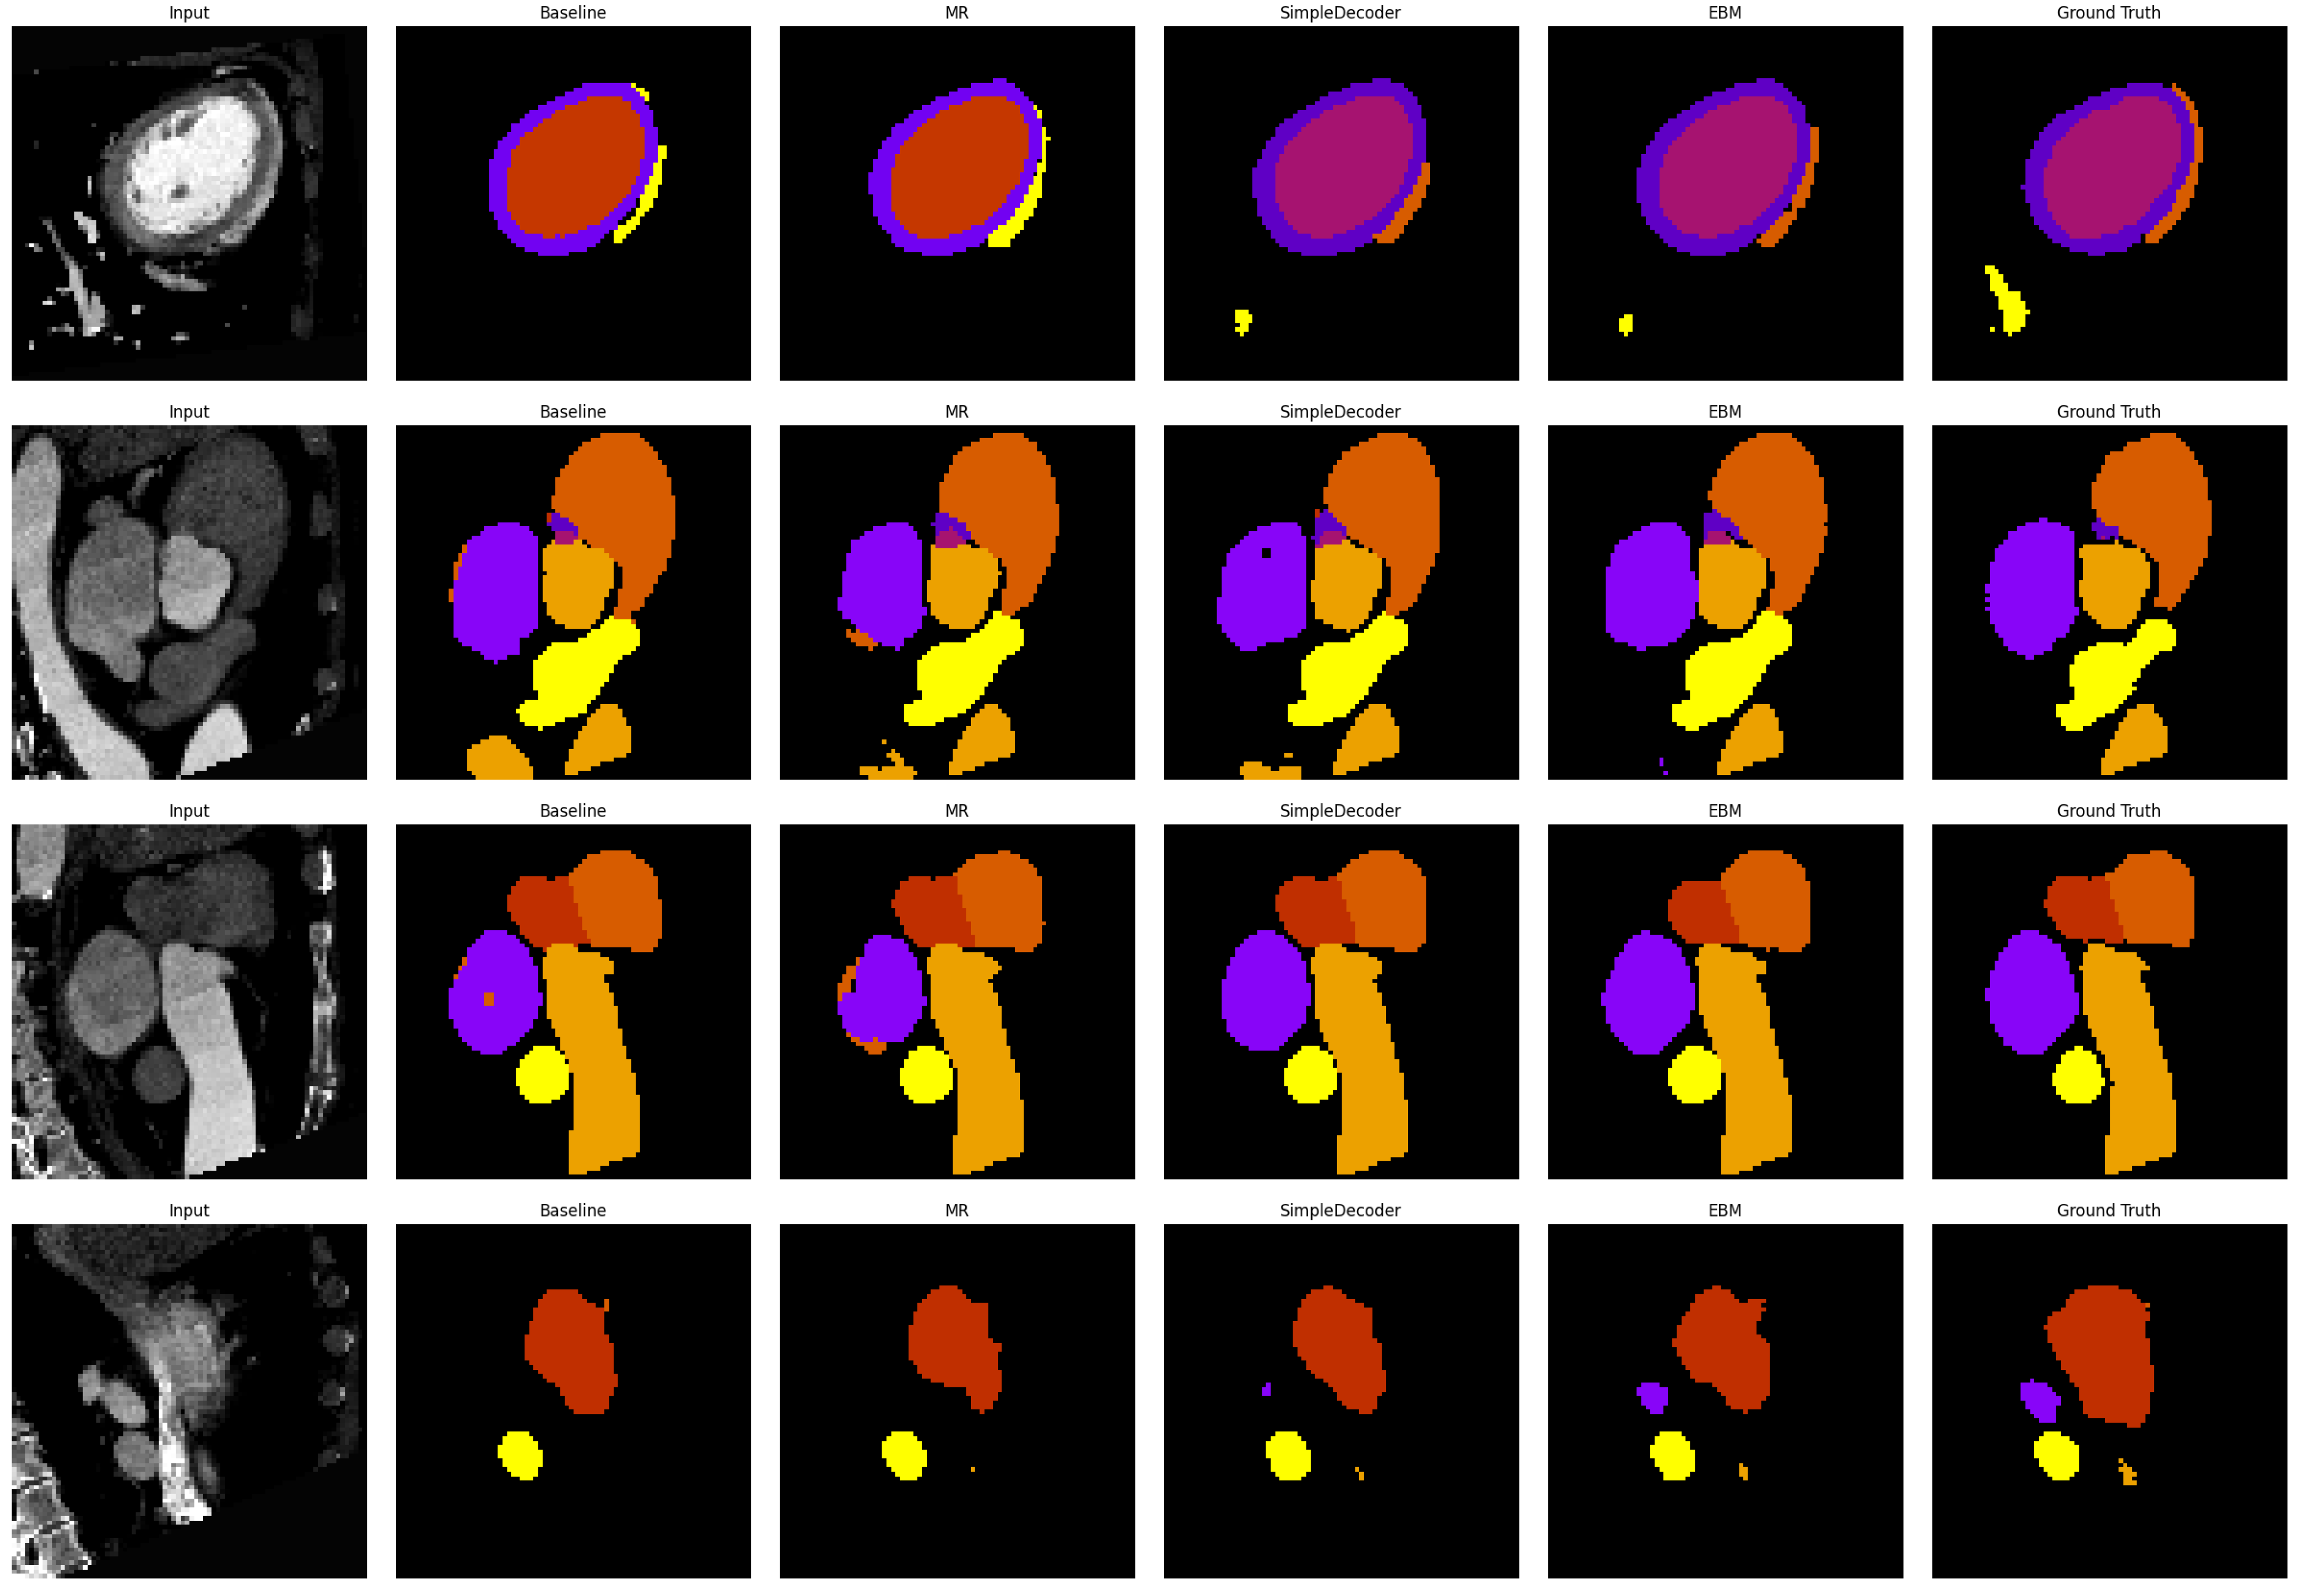
3.2. Comparison with Other Methods

To demonstrate the effectiveness of our method, we use a base model with only CT data as our baseline and compare our method with other multimodality learning methods. The quantitative results in whole heart segmentation are shown in Table 2. Our results (the last two rows) outperform the existing state-of-the-art results. In order to make the comparison fair, the value of the Dice score listed in the penultimate row of the table uses the same evaluation method as the previous method, resize-based; in the last row, we use the patch-based method to perform the evaluation on the original image, which is more practical and more convenient to be used directly by doctors, because the output map is not cropped.

3.3. Ablation Study of Key Components

In order to ensure that each individual component of our framework is effective and contributes to the overall performance, we conducted an ablation study. This involves systematically removing specific parts of the framework and evaluating the results. By doing so, we can identify which components are most critical and make informed decisions about where to focus our efforts to improve the framework further.
In detail, we use a base model with only CT data as our baseline. The results of our ablation study are presented in Table 3. The table displays the performance of the system with each individual component removed, as well as the overall performance when all components are included. The results clearly show that the removal of certain components leads to a significant deterioration in performance.
Specifically, in the second row of the table, we introduced MRI as an additional modality and employed a shared-parameter model. This approach resulted in a slight improvement in the accuracy of the segmentation results, compared to using CT as the single modality. In the third row of the table, we further improved the segmentation results by incorporating a simple decoder into our model. This decoder allows for the direct decoding of semantic information into segmentation results, thereby simplifying the overall segmentation process and increasing its efficiency. Finally, in the last row of the table, we explored the transfer of semantic information learned from CT to MRI using EBM. This technique allowed us to effectively transfer the knowledge learned from one modality to another, resulting in even more accurate segmentation results. This approach demonstrated the effectiveness of our method in leveraging pre-existing knowledge from one imaging modality to improve segmentation results in another modality. This indicates that each individual component plays an important role in the overall performance of the system and that all components are necessary to achieve the best results. Figure 2 shows some visualization comparisons.
Through our ablation study, we were able to confirm the effectiveness of each component in our framework and gain a better understanding of the relative importance of each component. This information can help us to refine our framework further and develop more effective ones in the future.

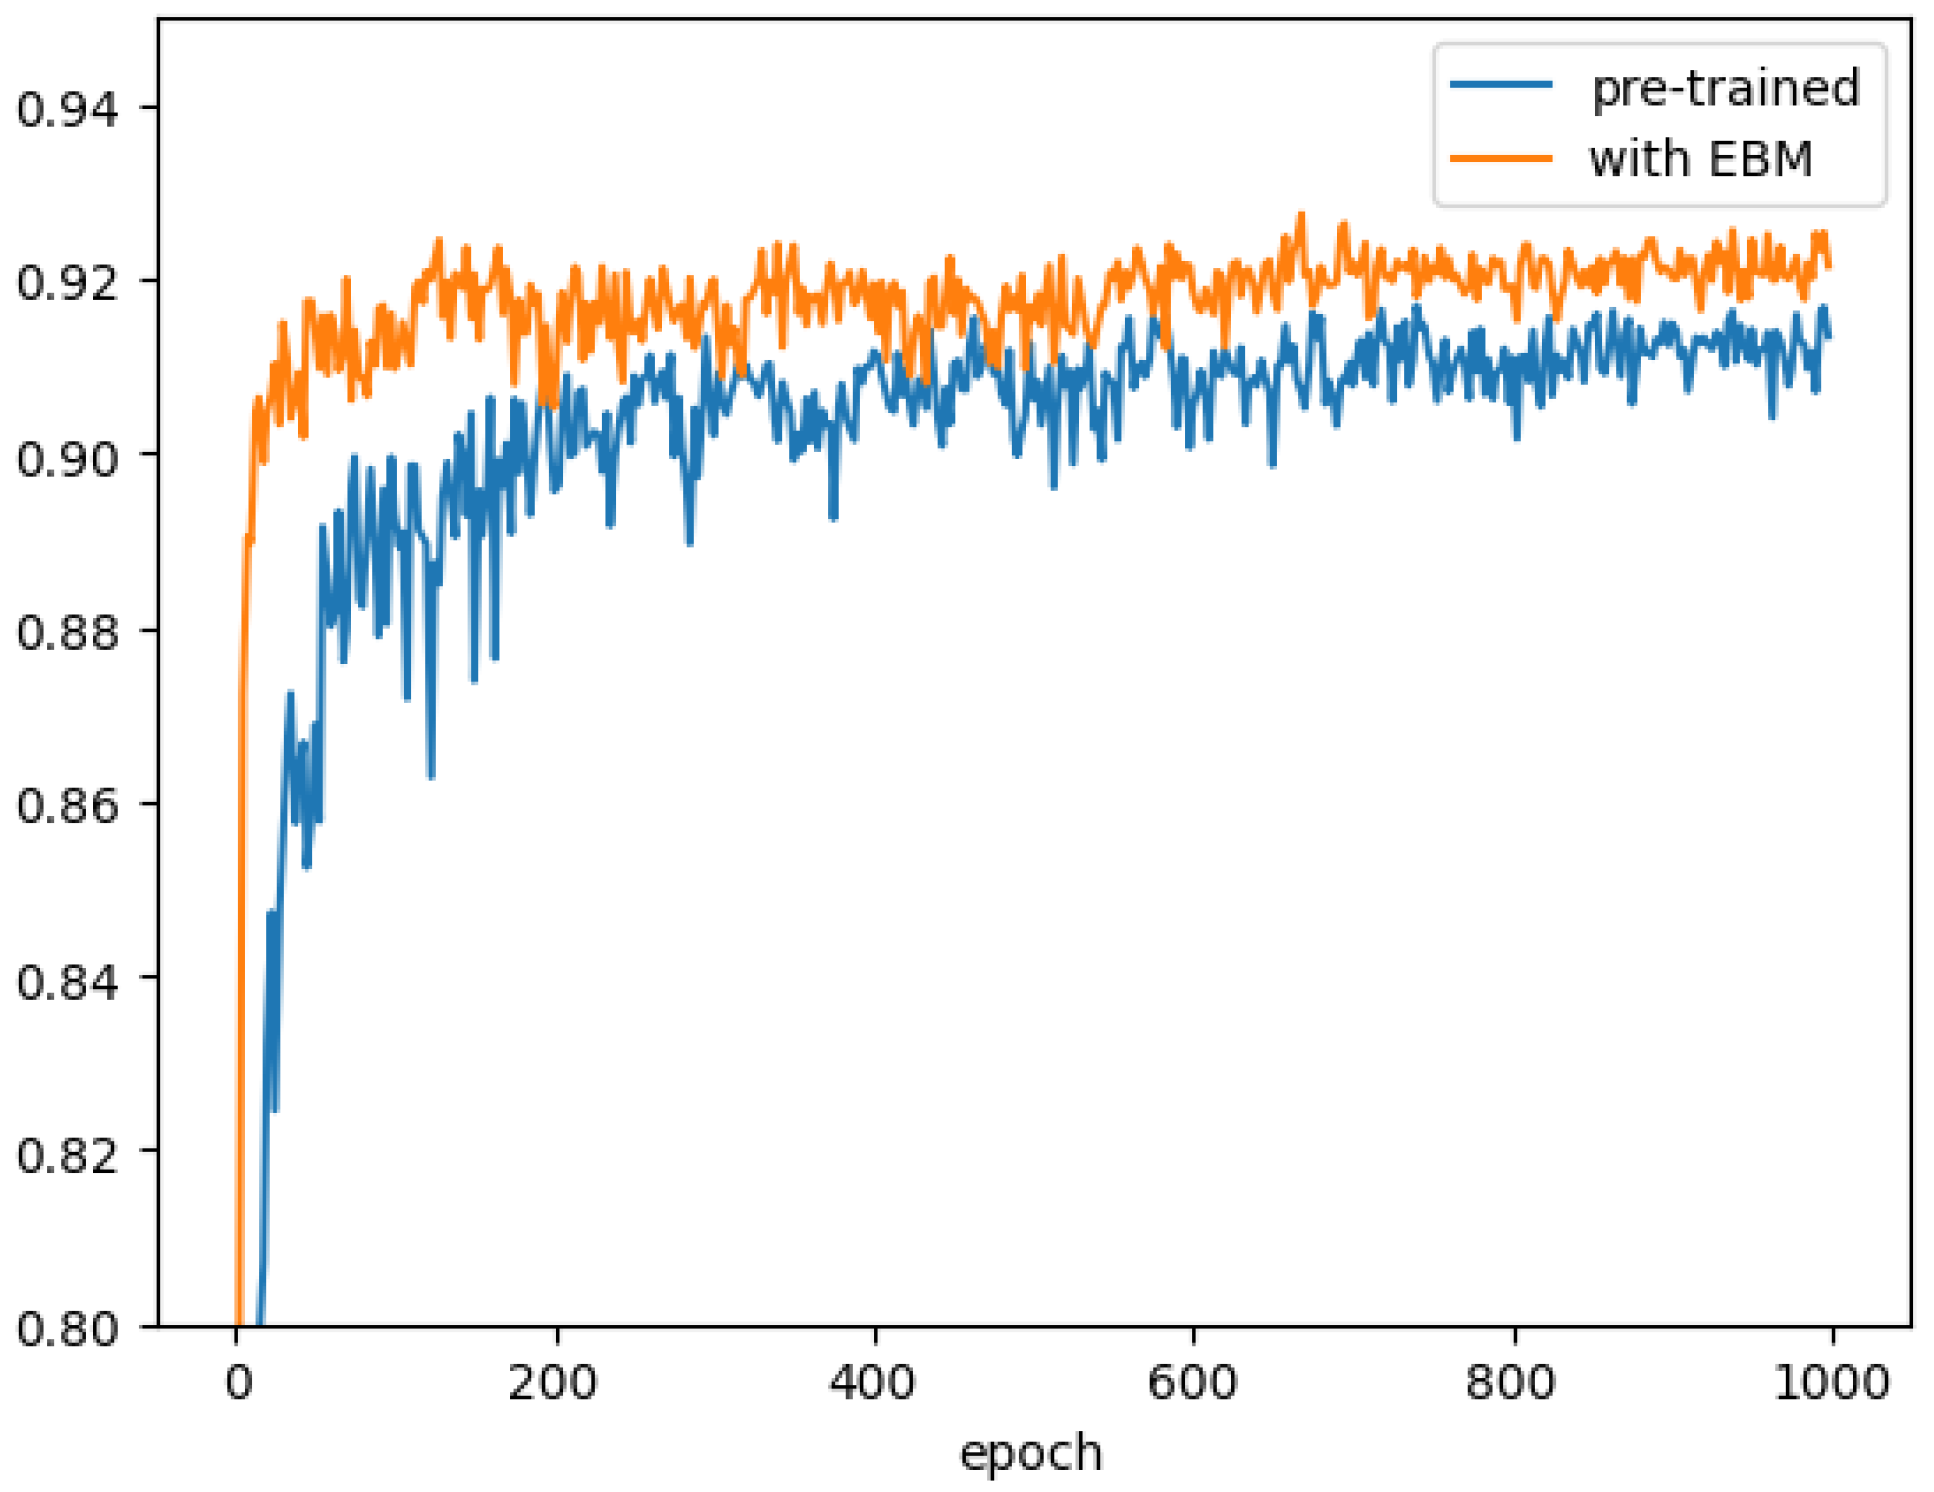
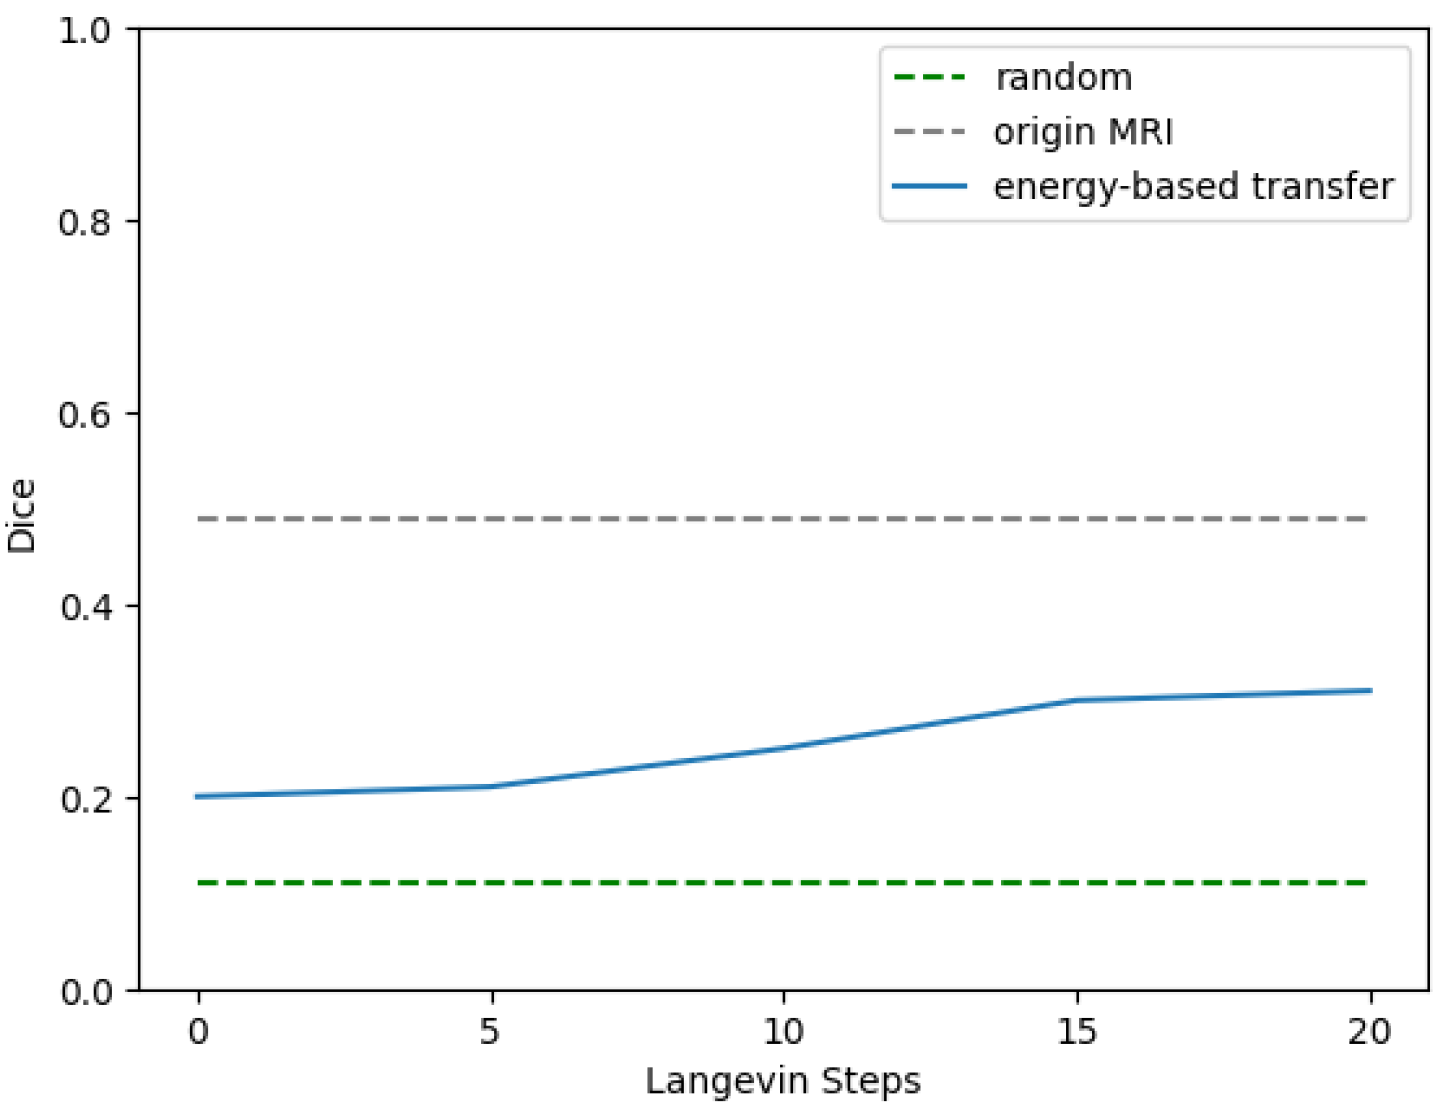
3.4. Proof-of-Concept Verification of the EBM

As shown in Figure 2 and Figure 3 and Table 3, EBM has an effect on the improvement of results. We conduct a proof-of-concept verification which verified that the EBM can effectively translate information from one type of medical image (CT) to another type (MRI) rather than pre-learned shared parameters with “skip connections” between the two types of images. To do this, we used random images and the MRI information translated by the EBM (i.e., using different “Langevin steps”, or iterations of the model) to feed a simplified decoder in a pre-trained model, then calculated the difference between the segmentation results obtained by the decoder and the ground truth, or the actual segmentation of the images. By doing this, we were able to determine whether the EBM was successfully learning to translate information between the two types of images or simply relying on pre-learned parameters to generate its results. This is an important step in validating the effectiveness of the EBM model in translating medical image data between different imaging modalities. The results are shown in Figure 4.

4. Conclusions

We proposed the energy-based semantic augmented segmentation (ESAS) model, a new approach for cross-modality image segmentation which leverages the latent semantic features’ energy of the support modality to generate semantic comparative modality information. This is a novel and general method that can be applied to most unpaired multimodal image learning tasks. To achieve this, we developed a framework that involves the use of a pre-trained model with shared parameters, which is then used to train an energy-based model that leverages the modality-shared knowledge. We conducted experiments on the MM-WHS 2017 dataset to evaluate the performance of our method. The results of our experiments demonstrate that our proposed approach is effective in improving the segmentation performance of query modality images by incorporating prior knowledge from supporting modality images. Overall, we believe that our novel framework could provide a valuable contribution to the field of cross-modality image segmentation, and has the potential to be applied to a range of medical imaging applications.

Author Contributions

Conceptualization, S.C.; methodology, S.C. and C.S.; software, S.C. and C.S.; validation, S.C.; writing—original draft preparation, S.C.; writing—review and editing, C.S. and X.W.; visualization, S.C. and C.S. All authors have read and agreed to the published version of the manuscript.

Funding

This research received no external funding.

Data Availability Statement

The original contributions presented in the study are publicly available. This data can be found from: http://www.sdspeople.fudan.edu.cn/zhuangxiahai/0/mmwhs/ (accessed on 28 February 2023).

Conflicts of Interest

The authors declare no conflict of interest.

References

  1. Cao, X.; Yang, J.; Gao, Y.; Guo, Y.; Wu, G.; Shen, D. Dual-core steered non-rigid registration for multi-modal images via bi-directional image synthesis. Med. Image Anal 2017, 41, 18–31. [Google Scholar] [CrossRef] [PubMed]
  2. Zhuang, X.; Li, L.; Payer, C.; Štern, D.; Urschler, M.; Heinrich, M.P.; Oster, J.; Wang, C.; Smedby, Ö.; Bian, C.; et al. Evaluation of algorithms for multi-modality whole heart segmentation: An open-access grand challenge. Med. Image Anal. 2019, 58, 101537. [Google Scholar] [CrossRef]
  3. Liu, X.; Guo, S.; Yang, B.; Ma, S.; Zhang, H.; Li, J.; Sun, C.; Jin, L.; Li, X.; Yang, Q.; et al. Automatic organ segmentation for CT scans based on super-pixel and convolutional neural networks. J. Digital Imaging 2018, 31, 748–760. [Google Scholar] [CrossRef] [PubMed]
  4. Moltz, J.H.; Bornemann, L.; Dicken, V.; Peitgen, H. Segmentation of liver metastases in CT scans by adaptive thresholding and morphological processing. In Proceedings of the MICCAI workshop, New York, NY, USA, 6 September 2008; Volume 41, p. 195. [Google Scholar]
  5. Chang, Y.L.; Li, X. Adaptive image region-growing. IEEE Trans. Med. Imaging 1994, 3, 868–872. [Google Scholar] [CrossRef] [PubMed]
  6. Pohle, R.; Toennies, K.D. Segmentation of medical images using adaptive region growing. In Proceedings of the Medical Imaging 2001: Image Processing, Davis, CA, USA, 18–22 June 2001; Volume 4322, pp. 1337–1346. [Google Scholar]
  7. Luo, S. Review on the methods of automatic liver segmentation from abdominal images. J. Comput. Commun. 2014, 2, 1. [Google Scholar] [CrossRef]
  8. Litjens, G.; Kooi, T.; Bejnordi, B.E.; Setio, A.A.A.; Ciompi, F.; Ghafoorian, M.; Van Der Laak, J.A.; Van Ginneken, B.; Sánchez, C.I. A survey on deep learning in medical image analysis. Med. Image Anal. 2017, 42, 60–88. [Google Scholar] [CrossRef] [PubMed]
  9. Ronneberger, O.; Fischer, P.; Brox, T. U-net: Convolutional networks for biomedical image segmentation. In Proceedings of the Medical Image Computing and Computer-Assisted Intervention—MICCAI 2015: 18th International Conference, Munich, Germany, 5–9 October 2015; Springer: Berlin/Heidelberg, Germany, 2015; pp. 234–241. [Google Scholar]
  10. Badrinarayanan, V.; Kendall, A.; Cipolla, R. Segnet: A deep convolutional encoder-decoder architecture for image segmentation. IEEE Trans. Pattern Anal. Mach. Intell. 2017, 39, 2481–2495. [Google Scholar] [CrossRef] [PubMed]
  11. Alqazzaz, S.; Sun, X.; Yang, X.; Nokes, L. Automated brain tumor segmentation on multi-modal MR image using SegNet. Comput. Vis. Media 2019, 5, 209–219. [Google Scholar] [CrossRef]
  12. Han, Z.; Chen, Q.; Zhang, L.; Mo, X.; You, J.; Chen, L.; Fang, J.; Wang, F.; Jin, Z.; Zhang, S.; et al. Radiogenomic association between the t2-flair mismatch sign and idh mutation status in adult patients with lower-grade gliomas: An updated systematic review and meta-analysis. European Radiol. 2022, 32, 5339–5352. [Google Scholar] [CrossRef] [PubMed]
  13. Kamnitsas, K.; Ledig, C.; Newcombe, V.F.; Simpson, J.P.; Kane, A.D.; Menon, D.K.; Rueckert, D.; Glocker, B. Efficient multi-scale 3D CNN with fully connected CRF for accurate brain lesion segmentation. Med. Image Anal. 2017, 36, 61–78. [Google Scholar] [CrossRef] [PubMed]
  14. Zhou, C.; Ding, C.; Lu, Z.; Wang, X.; Tao, D. One-pass multi-task convolutional neural networks for efficient brain tumor segmentation. In Part III 11, Proceedings of the Medical Image Computing and Computer Assisted Intervention–MICCAI 2018: 21st International Conference, Granada, Spain, 16–20 September 2018; Proceedings, Part III 11. Springer: Berlin/Heidelberg, Germany, 2018; pp. 637–645. [Google Scholar]
  15. Pereira, S.; Pinto, A.; Alves, V.; Silva, C.A. Brain tumor segmentation using convolutional neural networks in MRI images. IEEE Trans. Med. Imaging 2016, 35, 1240–1251. [Google Scholar] [CrossRef] [PubMed]
  16. Tseng, K.L.; Lin, Y.L.; Hsu, W.; Huang, C.Y. Joint sequence learning and cross-modality convolution for 3D biomedical segmentation. In Proceedings of the IEEE Conference on Computer Vision and Pattern Recognition, Honolulu, HI, USA, 21–26 July 2017; pp. 6393–6400. [Google Scholar]
  17. Dolz, J.; Gopinath, K.; Yuan, J.; Lombaert, H.; Desrosiers, C.; Ayed, I.B. HyperDense-Net: A hyper-densely connected CNN for multi-modal image segmentation. IEEE Trans. Med. Imaging 2018, 38, 1116–1126. [Google Scholar] [CrossRef] [PubMed]
  18. Nie, D.; Wang, L.; Gao, Y.; Shen, D. Fully convolutional networks for multi-modality isointense infant brain image segmentation. In Proceedings of the 2016 IEEE 13Th international symposium on biomedical imaging (ISBI), Prague, Czech Republic, 13–16 April 2016; pp. 1342–1345. [Google Scholar]
  19. Valindria, V.V.; Pawlowski, N.; Rajchl, M.; Lavdas, I.; Aboagye, E.O.; Rockall, A.G.; Rueckert, D.; Glocker, B. Multi-modal learning from unpaired images: Application to multi-organ segmentation in CT and MRI. In Proceedings of the 2018 IEEE winter conference on applications of computer vision (WACV), Lake Tahoe, NV, USA, 12–15 March 2018; pp. 547–556. [Google Scholar]
  20. Jiang, J.; Hu, Y.C.; Tyagi, N.; Zhang, P.; Rimner, A.; Mageras, G.S.; Deasy, J.O.; Veeraraghavan, H. Tumor-aware, adversarial domain adaptation from CT to MRI for lung cancer segmentation. In Proceedings of the Medical Image Computing and Computer Assisted Intervention—MICCAI 2018: 21st International Conference, Granada, Spain, 16–20 September 2018; Proceedings, Part III 11. Springer: Berlin/Heidelberg, Germany, 2018; pp. 777–785. [Google Scholar]
  21. Zhang, Z.; Yang, L.; Zheng, Y. Translating and segmenting multimodal medical volumes with cycle-and shape-consistency generative adversarial network. In Proceedings of the IEEE conference on computer vision and pattern Recognition, Salt Lake City, UT, USA, 18–22 June 2018; pp. 9242–9251. [Google Scholar]
  22. Vesal, S.; Gu, M.; Kosti, R.; Maier, A.; Ravikumar, N. Adapt everywhere: Unsupervised adaptation of point-clouds and entropy minimization for multi-modal cardiac image segmentation. IEEE Trans. Med. Imaging 2021, 40, 1838–1851. [Google Scholar] [CrossRef] [PubMed]
  23. Zhao, Z.; Zhou, F.; Xu, K.; Zeng, Z.; Guan, C.; Zhou, K. LE-UDA: Label-efficient unsupervised domain adaptation for medical image segmentation. IEEE Trans. Med. Imaging 2022, 42, 633–646. [Google Scholar] [CrossRef] [PubMed]
  24. Li, K.; Yu, L.; Wang, S.; Heng, P.A. Towards cross-modality medical image segmentation with online mutual knowledge distillation. In Proceedings of the AAAI Conference on Artificial Intelligence, New York, NY, USA, 7–12 February 2020; Volume 34, pp. 775–783. [Google Scholar]
  25. Dou, Q.; Liu, Q.; Heng, P.A.; Glocker, B. Unpaired multi-modal segmentation via knowledge distillation. IEEE Trans. Med. Imaging 2020, 39, 2415–2425. [Google Scholar] [CrossRef] [PubMed]
  26. Kullback, S.; Leibler, R.A. On information and sufficiency. Ann. Math. Stat. 1951, 22, 79–86. [Google Scholar] [CrossRef]
  27. Ioffe, S.; Szegedy, C. Batch normalization: Accelerating deep network training by reducing internal covariate shift. In Proceedings of the International Conference on Machine Learning. PMLR, Lille, France, 6–11 July 2015; pp. 448–456. [Google Scholar]
  28. Ulyanov, D.; Vedaldi, A.; Lempitsky, V. Instance normalization: The missing ingredient for fast stylization. arXiv 2016, arXiv:1607.08022. [Google Scholar]
  29. Wu, Y.; He, K. Group normalization. In Proceedings of the European Conference on Computer Vision (ECCV), Munich, Germany, 8–14 September 2018; pp. 3–19. [Google Scholar]
  30. Isensee, F.; Jaeger, P.F.; Kohl, S.A.; Petersen, J.; Maier-Hein, K.H. nnU-Net: A self-configuring method for deep learning-based biomedical image segmentation. Nat. Methods 2021, 18, 203–211. [Google Scholar] [CrossRef] [PubMed]
  31. Song, Y.; Kingma, D.P. How to train your energy-based models. arXiv 2021, arXiv:2101.03288. [Google Scholar]
  32. Welling, M.; Teh, Y.W. Bayesian learning via stochastic gradient Langevin dynamics. In Proceedings of the 28th International Conference on Machine Learning (ICML-11), Bellevue, DC, USA, 28 June–2 July 2011; pp. 681–688. [Google Scholar]
  33. Kingma, D.P.; Ba, J. Adam: A Method for Stochastic Optimization. In Proceedings of the 3rd International Conference on Learning Representations, ICLR 2015, San Diego, CA, USA, 7–9 May 2015. Conference Track Proceedings. [Google Scholar]
  34. Yu, F.; Koltun, V. Multi-Scale Context Aggregation by Dilated Convolutions. In Proceedings of the 4th International Conference on Learning Representations, ICLR 2016, San Juan, Puerto Rico, 2–4 May 2016. Conference Track Proceedings. [Google Scholar]
  35. Zeiler, M.D.; Krishnan, D.; Taylor, G.W.; Fergus, R. Deconvolutional networks. In Proceedings of the 2010 IEEE Computer Society Conference on Computer Vision and Pattern Recognition, San Francisco, CA, USA, 13–18 June 2010; pp. 2528–2535. [Google Scholar]
Figure 1. An overview of our proposed energy-based semantic augmented segmentation (ESAS) framework. First, using a pre-train model, ESAS trains modality-specific encoders and shared-parameter decoders with individual batch normalization layers. The pre-trained model architecture is shown in (a). U x and U y represent the original image input of the query modality and support modality, respectively, while z x and z y represent their semantic information, respectively, and U ˜ x and U ˜ y represent the segmentation results. Additionally, the energy-based model (EBM) is also pre-trained. Second, only the query modality is utilized for training and in the inference stages, as it is shown in (b). Semantic features of the query modality are transported to the support modality. At last, semantic features are combined with a residual block and then input into the decoder D e c for segmentation. (a) Unpaired multimodal pre-trained architecture of the ESAS; (b) training and inference without the support modality architecture of the ESAS.
Electronics 12 02174 g001
Figure 2. Qualitative comparison of the segmentation results from ablation study. From left to right are the CT image inputs, the results of the baseline model trained with CT images only, the results of the model learned jointly using unpaired MR images, the results of the pre-trained model with shared parameters as described in Section 2.1, the results of the model after introducing EBM, and the ground truth.
Electronics 12 02174 g002
Figure 3. Mean Dice evaluated during training. The blue line shows the mean Dice on the validation set when pre-training the shared-parameter decoder, and the orange line shows the one when training the new decoder after we have trained the EBM.
Electronics 12 02174 g003
Figure 4. Comparison under different translation results. The horizontal axis represents the number of iterations of Langevin steps, while the vertical axis represents the Dice coefficient results. When using EBM, our results are better than those of random images (the green dotted line) because we use the decoder with shared parameters that keep our semantic features in the same space. The results obtained from the original MRI images (the grey dotted line) should be an upper bound.
Electronics 12 02174 g004
Table 1. The network configurations of our proposed energy-based semantic augmented segmentation (ESAS) model, reporting the operators, input size, output size, and kernel size. The stride can be inferred easily based on the input and output size as we apply padding equal to 1. Specifically, ESAS uses P to denote the patch size, and C to denote the base number of filters.
ArchitectureModulesOperatorsInput SizeOutput SizeKernel Size
EncoderDown1Conv3D + Batch Norm + LeakyReLU P 3 × 1 P 3 × C 3 3
Dilated Conv3D + Batch Norm + LeakyReLU P 3 × C ( P / 2 ) 3 × C 3 3
Down2Conv3D + Batch Norm + LeakyReLU ( P / 2 ) 3 × C ( P / 2 ) 3 × 2 C 3 3
Dilated Conv3D + Batch Norm + LeakyReLU ( P / 2 ) 3 × 2 C ( P / 4 ) 3 × 2 C 3 3
EncoderDown3Conv3D + Batch Norm + LeakyReLU ( P / 4 ) 3 × 2 C ( P / 4 ) 3 × 4 C 3 3
Dilated Conv3D + Batch Norm + LeakyReLU ( P / 4 ) 3 × 4 C ( P / 8 ) 3 × 4 C 3 3
Down4Conv3D + Batch Norm + LeakyReLU ( P / 8 ) 3 × 4 C ( P / 8 ) 3 × 8 C 3 3
Dilated Conv3D + Batch Norm + LeakyReLU ( P / 8 ) 3 × 8 C ( P / 16 ) 3 × 8 C 3 3
ResidualConv0Conv3D ( P / 16 ) 3 × 16 C ( P / 16 ) 3 × 16 C 3 3
DecoderUp1ConvTranspose3D + Batch Norm + LeakyReLU(P/16) 3 × 16C(P/8) 3 × 8C 3 3
Conv3D + Batch Norm + LeakyReLU ( P / 8 ) 3 × 16 C ( P / 8 ) 3 × 8 C 3 3
Up2ConvTranspose3D + Batch Norm + LeakyReLU ( P / 8 ) 3 × 8 C ( P / 4 ) 3 × 4 C 3 3
Conv3D + Batch Norm + LeakyReLU ( P / 4 ) 3 × 8 C ( P / 4 ) 3 × 4 C 3 3
Up3ConvTranspose3D + Batch Norm + LeakyReLU ( P / 4 ) 3 × 4 C ( P / 2 ) 3 × 2 C 3 3
Conv3D + Batch Norm + LeakyReLU ( P / 2 ) 3 × 4 C ( P / 2 ) 3 × 2 C 3 3
Up4ConvTranspose3D + Batch Norm + LeakyReLU(P/2) 3 × 2 C P 3 × C 3 3
Conv3D + Batch Norm + LeakyReLU P 3 × 2 C P 3 × C 3 3
OutputConv3D P 3 × C P 3 × O 3 3
EBMConv1Conv3D + Batch Norm + LeakyReLU ( P / 16 ) 3 × 8 C ( P / 16 ) 3 × 4 C 3 3
Conv2Conv3D + Batch Norm + LeakyReLU ( P / 16 ) 3 × 4 C ( P / 16 ) 3 × 2 C 3 3
Conv3Conv3D ( P / 16 ) 3 × 2 C (P/16) 3 1 3
Table 2. Quantitative comparison between our method and other multimodality segmentation methods. Here, we take CT as the query modality and MRI as the support modality. The Dice scores of all heart substructures and the average of them are reported here. Since the results for most cases have been detailed in [24] and our setup is similar to it, we directly refer to it for these results. In addition, the largest and second largest Dice scores are in bold.
MethodMean DiceDice of Substructure of Heart
MYOLALVRARVAAPA
Baseline0.87060.87020.89220.90860.83860.84600.92520.8134
Fine-tune0.87690.87160.90400.90790.84430.85260.92740.8305
Joint-training0.87430.86650.90760.91230.82780.84920.93020.8266
X-Shape [19]0.87670.87190.89790.90940.85510.84440.93430.8240
Jiang et al. [20]0.87650.87230.90540.90730.83380.85250.94840.8156
Zhang et al. [21]0.88500.87810.91120.91340.85140.86310.94300.8342
Ours0.89450.89610.92300.90450.86610.86850.94920.8539
Ours (patch-based)0.92670.91830.94050.94110.93230.93430.95300.8669
Table 3. Ablation study of key components in our framework, where the mean Dice scores of all heart substructures by patch-based method evaluation are reported. In addition, the largest Dice scores are in bold.
MRSimple DecoderEBMMean DiceDice of Substructure of Heart
MYOLALVRARVAAPA
0.92450.91260.93680.93710.92870.93430.95030.8718
0.92470.91300.93810.93870.93120.93570.95130.8651
0.92500.91630.93750.93950.93120.93610.95120.8635
0.92670.91830.94050.94110.93230.93430.95300.8669
Disclaimer/Publisher’s Note: The statements, opinions and data contained in all publications are solely those of the individual author(s) and contributor(s) and not of MDPI and/or the editor(s). MDPI and/or the editor(s) disclaim responsibility for any injury to people or property resulting from any ideas, methods, instructions or products referred to in the content.

