Article

Bounding the Upper Delays of the Tactile Internet Using Deterministic Network Calculus

College of Information Science and Engineering, Hunan Normal University, Changsha 410081, China
*
Authors to whom correspondence should be addressed.
Electronics 2023, 12(1), 21; https://doi.org/10.3390/electronics12010021
Submission received: 29 October 2022 / Revised: 11 December 2022 / Accepted: 17 December 2022 / Published: 21 December 2022
(This article belongs to the Special Issue Advances and Applications of Networking and Multimedia Technologies)

Abstract

:
With the increasing popularity of time-sensitive network applications and the gradual integration of the Tactile Internet into people’s lives, how to ensure ultra-low latency has become a demand and challenge for network performance. Therefore, it is extremely important to analyze the performance of the Tactile Internet. In this paper, we propose an analytical model based on deterministic network calculus (DNC) to quantitatively derive the end-to-end performance bounds of the Tactile Internet, develop a tandem model describing the communication of the Tactile Internet network, and analyze delay-related traffic parameters, such as arrival rate and burst size. We investigate the variation of the accuracy of the DNC analytical model and the measurement model under different parameters, and verify the accuracy of the proposed DNC analytical model by theoretical derivation and analysis and comparison with the measurement model under the NS3 platform. We discuss the impact of relevant parameters on the delay boundaries to determine which network configuration enables the end-to-end delay to meet the established requirements. This will provide valuable guidance for the design of Tactile Internet architectures.

1. Introduction

Nowadays, the Internet has pervaded all aspects of people’s lives, and traditional network architectures have struggled to deliver satisfactory network performance. However, in some emerging areas such as self-driving cars, virtual reality, augmented reality, health-care 4.0 and industry 4.0, there are more stringent requirements for quality of service (QoS) such as low latency and high reliability, which pose further challenges for network performance.
For the challenges facing the network in the new era, the concept of Tactile Internet is proposed [1]. The IEEE P1918.1 Working Group defines the Tactile Internet as a network, or a network of networks, for remotely accessing, sensing, manipulating, or controlling real and virtual objects or processes that are sensed in real time [2]. To provide a medium for delivering control, touch and sensing and driving information in real time, the Tactile Internet requires highly reliable, responsive and intelligent connectivity. The envisioned Tactile Internet requires a suitable architecture to meet its design requirements, and it needs to provide extremely low round-trip latency of 1 ms or less [3]. If the delay in tactile information exceeds 1 ms, it can lead to unwanted effects such as cyber sickness, whose symptoms are comparable to motion sickness [1]. For example, in virtual reality, if the time difference between the virtual picture and human motion is more than 1 ms, “halo screen” may occur, which leads to user dizziness [3]. Therefore, end-to-end delay will be a key factor in the performance of the Tactile Internet architecture, and worst-case delay performance should be considered during the design phase of the Tactile Internet.
Providing such stringent QoS requires network modeling and performance analysis as an integral part, in addition to key technologies such as 5G that can guarantee ultra-reliable and low-latency communication for the Tactile Internet [4]. For the low-latency scenarios required by the Tactile Internet, we can estimate the performance metrics of the Tactile Internet in advance through network modeling, and then turn them back to guide the resources that need to be provided, which is very helpful for the design of the Tactile Internet architecture.
Network modeling can be divided into measurement models, analytical models and machine learning models [5]. The measurement model is a simulation model for studying network systems built by various network simulators, such as NS3 and OMNeT++. We usually run this model on a computer and then analyze the output results. Measurement models require accurate simulation of network systems, which requires higher costs on large network architectures. Analytical models describe the research object and system according to certain qualifications and reasonable assumptions, abstract the mathematical analytical model of the research object, and use the mathematical analytical model to solve the problem. However, when a system is complex, it becomes difficult to describe the system accurately with some restrictive assumptions. Machine learning models can be helpful when analytical models are challenged by system complexity [5,6]. Machine learning is able to model the relationship between output variables (e.g., latency) and one or more independent input variables (e.g., software and hardware parameters) [7], and this approach is not limited by system complexity and often achieves good results, but it also lacks a reasonable explanation for network models, and for the interaction aspects of system parameters.
As far as we know, it is rare to see measurement models and machine learning models for performance analysis of Tactile Internet. The queuing models [4,8,9] are commonly used to analyze the network; however, the queuing models on the one hand analyze the average delay, which cannot meet the strict requirements of the Tactile Internet for the worst-case delay, on the other hand queuing models use a random traffic model, which may not match the realistic traffic characteristics [10]. Most importantly, the above models are difficult to make accurate predictions under the performance requirement of 1 ms, especially in the case of Tactile Internet, which is extremely sensitive to delay. While deterministic network calculus (DNC) shows great potential in dealing with these aspects, it is a system theory for studying communication networks [11], specifically calculating worst-case bounds for delay requirements in networks. It focuses on worst-case performance guarantees and is considered as a key technology for future Internet performance analysis. Worst-case delay is the most important issue for Tactile Internet service scenarios, and these services are critical for applications such as remote surgery and smart driving. Considering that the analytical model can simplify the network environment and relies on qualifying conditions and assumptions, we combine the analytical model with the measurement model and verify the results obtained from the analytical model by the measurement model to prove the rationality and accuracy of the proposed analytical model.
Curve-based system models such as network calculus, real-time calculus (RTC) and compositional performance analysis (CPA) are the basis of modern analytical frameworks [12]. Network calculus is compositional in the sense that the system under analysis is decomposed into a set of components connected by streams. Each component is analyzed individually by computing for given curves on the input streams the respective curves bounding the output streams (local analysis). RTC is an adaptation of NC to real-time systems focusing, for instance, on domain-specific scheduling problems. Despite notational differences, the underlying models are considered as equivalent [13]. CPA is a compositional analysis framework for distributed real-time systems which has been developed independently from NC and RTC [14].
Compared with traditional real-time applications, emerging time-sensitive network (TSN) applications have more stringent requirements for latency, and there is a more urgent need for network calculus. Many studies (such as [15,16,17,18,19]) have used network calculus to analyze the performance of TSN, especially those with strict requirements on latency. Therefore, in this paper, we use DNC to propose a method for modeling end-to-end delay upper bounds for the Tactile Internet.
The main contributions of this paper are as follows:
  • We establish a network domain analytical model of Tactile Internet based on DNC and derive the delay bound of single-flow with single-switch, multi-flow with single-switch and multi-flow with multi-switch.
  • We carry out extensive simulation experiments on measurement models for different network configurations, combine the theoretical model with the measurement model, verify the accuracy of the proposed analytical model, and compare it with existing CPA model.
  • We perform numerical analysis of the model according to different parameters to evaluate the effect of the number of switches and traffic competition on Tactile Internet latency.
The organization of this paper is summarized as follows. Related works are presented in Section 2. Section 3 introduces the Tactile Internet end-to-end architecture and the basic theory of DNC. Section 4 gives a network model of Tactile Internet based on DNC. Section 5 performs the derivation of delay bounds for the model. Section 6 obtains simulation results by computing the model experimentally, compares them with the results derived in Section 5, and performs a comprehensive performance analysis based on the proposed model. Finally, Section 7 concludes this paper.

2. Related Works

In 2014, the Telecommunication Standardization Sector of the International Telecommunication Union published a report on the Tactile Internet [1], which outlined the potential of the Tactile Internet, explored its prospects in various application areas, described the needs of the Tactile Internet for future digital infrastructure and its expected impact on society, and included the Tactile Internet in the Technology Watch area. Since the release of the report, the Tactile Internet has grown rapidly in various fields. However, ultra-low latency, the most important feature of the Tactile Internet, meeting 1 ms end-to-end delay has become a major challenge for the Tactile Internet.
There are many analytical studies of Tactile Internet performance. She et al. [4] analyzed the queuing delay for vehicular communication using a queuing model, and since the queuing dynamics in medium access control was affected by the randomness of the time-varying channel and the random geometry of the physical layer, it was very difficult to make the instantaneous queuing delay bounded by a deterministic value, so the focus was on the average delay constraint, which had limited application in future low-latency services. Maier et al. [20] developed an analytical framework to calculate the average end-to-end delay and its distribution for both local and non-local remote operations in the presence of human-to-machine traffic in a telemedicine setting, discussing different arrival models including deterministic, gamma, generalize Pareto, and Poisson distributions, but did not combine these arrival models with a service model as a way to obtain worst-case delay constraints. Kim et al. [21] proposed a new performance evaluation method to evaluate strategies to assess the delay constraints and reliability constraints of base stations and users in the Gangnam station area in Seoul, Korea, which combined ray tracing tools with system-level simulation, but the method had certain requirements for specific environments and was difficult to apply to other specific scenarios. Aijaz et al. [22] used a 5G design based on orthogonal frequency division multiplexing technique to ensure that the air interface transmission budget was limited to 100 μs in a factory automation use case with a delay requirement of 1 ms, focusing on radio resource allocation, but they only considered queuing delays without transmission delays and network delays.
For various application scenarios of Tactile Internet, it is important to reduce delay and it is also important to classify traffic based on traffic characteristics and network device conditions. However, there is a lack of classification consideration for the complex network environment of Tactile Internet in the above work, and the methods in the above work either focus on average delay or have limited capability for latency constraints, while the DNC analyzes the worst-case delay.
DNC has been used in the past to model different communication networks. Georges et al. [23] demonstrated the application of DNC in switched real-time networks. Yang et al. [24] obtained strict delay bounds for avionics full duplex switched networks with realistic traffic patterns and network workloads based on DNC. Zhang et al. [25] constructed a framework for analyzing the stochastic end-to-end delay of long term evolution (LTE) networks by modeling the arrival and service models of LTE networks using stochastic network calculus. De et al. [26] build a model for calculating worst-case delays in a critical embedded system environment for audio/video bridging based on DNC. Geyer et al. [27] demonstrated the use of DNC to model worst-case delays in communication networks used in the automotive and aerospace industries. Duan [28] used network calculus for service function chain (SFC) modeling and performance analysis in software defined network (SDN)/network function virtualization (NFV) to determine the end-to-end delay boundaries that SFC can guarantee to their end-users based on their service capacity and load characteristics, applicable to dynamic elastic service provisioning for various SFC in SDN/NFV. Hu et al. [29] computed delay bounds for asynchronous traffic shaping hops with inconsistent parameters in time-sensitive networks based on DNC. Ren et al. [30] derived an end-to-end delay model and a backlog model for fog server nodes and fog nodes using DNC theory.
DNC analysis uses network information such as network topology, network forwarding capability and flow path to determine the worst-case delay. With the increasing delay requirements of time-sensitive network applications, DNC has been widely used in the above network scenarios, and has achieved good results. In this paper, we use DNC to model and analyze the performance of Tactile Internet and obtain the end-to-end delay bound. The experimental results show that our model can be applied to various application scenarios in Tactile Internet.

3. Background

In this section, we first give the end-to-end architecture of the Tactile Internet, using tele-surgery as an example, and describe the management and implementation of the Tactile Internet. Then, we review the basic idea of DNC.

3.1. Description of the Tactile Internet Architecture

While the traditional Internet transmits text, audio and video, giving people an auditory and visual experience, the Tactile Internet will transmit tactile and driving information on top of the traditional Internet, providing haptic feedback and giving people a real tactile experience.
The Tactile Internet relies on haptic and non-haptic control to communicate between end-to-end operations [3]. The difference between haptic and non-haptic control is that in addition to visual and auditory feedback for haptic control, the system actually has a haptic feedback (kinesthetic or vibrotactile), resulting in a global control loop. The feedback of non-tactile control can only be auditory or visual, so there is no concept of control loop [31].
As shown in Figure 1, the end-to-end architecture of the Tactile Internet is represented by three main parts: the master domain, the network domain and the slave domain. In order to properly evaluate the performance of Tactile Internet, most related studies rely mainly on simulation-based evaluation [32]. It is necessary to abstract the architecture of the Tactile Internet model.

3.1.1. Master Domain

The master domain usually consists of human operator (HO) and human-system interface (HSI). The HSI is a tactile device that serves to convert human control into a tactile input through coding technology, and through command signals, the operator can achieve operation of the slave domain. In some applications, a master domain may consist of multiple operators operating a single slave domain in concert. Such HSI haptic devices are available from vendors such as iFeelPixel Association, Immersion Corporation, Neurodigital Technologies, Sensable and Geomagic [33], they are usually designed in the form of a linkage, which includes a mechanical arm attached to the stylus that moves with the stylus and applies a certain force at its tip. The main entities that connect the master to the network domain are the Network Controller (NC) and the Gateway Node (GN). We can configure them at an edge, collectively called “GNC” [34]. To realize the vision of the Tactile Internet, further improvements in tactile devices are needed, especially in terms of increasing degrees of freedom (DoF) to meet the demand and incorporating network interfaces to ensure communication with the core network.

3.1.2. Network Domain

The network domain provides bi-directional communication between the master and slave domains, enabling the combination of HO and remote environments. Tactile command signals sent from the master domain will pass through routers, switches, gateways, base stations, access points, and servers and reach the tactile support engine in the slave domain, thus enabling control of remote machines. Conversely, the haptic feedback signal is sent from the domain, goes through the above series of transmissions, and finally reaches the master domain, giving the human operator the corresponding haptic feedback. Thus, in the Tactile Internet, the human operator and the remote machine maintain this tactile communication through command signals and feedback signals in the network domain.

3.1.3. Slave Domain

The slave domain consists of a remote operator console (robot) and operates accordingly by receiving command signals sent from the master domain, after which the tactile data is fed back to the human operator console, thus achieving real-time interaction and forming a global control loop.

3.2. Overview of DNC

DNC is a system theory in communication networks [35]. In contrast to traditional queuing theory models, DNC is a theoretical framework that uses minimum plus ( m i n , + ) algebra and maximum plus ( m a x , + ) algebra to analyze computer network performance and obtain worst-case bounds on delay and buffer queue length in the network. The DNC solves network performance boundary problems using two basic tools: arrival curves, which represent the upper bound on data arriving at the system, and service curves, which represent the minimum service the system is guaranteed to provide. A system S can be a buffer, a simple network node, or a complex network.

3.2.1. Arrive Curve

The cumulative function R ( t ) represents the sum of the data volume in the time interval [ 0 , t ] . When t = 0 , R ( 0 ) = 0 and R ( t ) is a generalized incremental function. Then, define the arrival curve of the data flow F as:
R ( t ) R ( s ) α ( t s ) t s 0 .
It can also be combined with the ( m i n , + ) convolution formula expressed as:
R R α .
If the arrival curves of the two flows ( F 1 and F 2 ) are α 1 and α 2 , respectively, the arrival curve of their convergent flow is ( α 1 + α 2 ) .
The leaky bucket model is the most commonly used arrival curve model, and its expression is α r , b = r t + b , where r denotes the average rate and b denotes the burst size.

3.2.2. Service Curve

Suppose a system S is given an input function of R ( t ) and an output function of R ( t ) , and we can define the service curve β provided by system S as:
R ( t ) inf s t { R ( s ) + β ( t s ) } t 0 .
It can also be expressed as:
R R β .
Obviously, we stipulate that R ( t ) R ( t ) .
The latency-rate model is the most commonly used service curve model, and its expression is
β R , T ( t ) = R [ t T ] + = R ( t T ) , if   t > T , 0 , otherwise ,
where R is the service rate, T is the delay, and R 0 , T 0 .

3.2.3. Tandem Theorem

Suppose a flow passes through systems S 1 and S 2 in turn, and the service curves provided by these two systems are β 1 and β 2 , respectively, then the equivalent service curves of these two systems will be β ˜ = β 1 β 2 . Without loss of generality, assume that a flow passes through n systems in sequence, the equivalent service curve for these n systems is β ˜ s y s = β 1 β 2 β n .
From [11], the equivalent service curves of two systems S 1 and S 2 with latency-rate service curves β R 1 , T 1 and β R 2 , T 2 are β m i n ( R 1 , R 2 ) , T 1 + T 2 . Therefore, the equivalent service curve extended to n systems with latency-rate service curves β R i , T i is β m i n ( R 1 , , R n ) , T 1 + , T n .

3.2.4. Delay Bound

From the definitions of arrival and service curves, it can be obtained that the virtual delay d ( t ) experienced by a flow with arrival curve α as it passes through the node providing service curve β is
d ( t ) sup t 0 { inf d 0 { d : α ( t ) β ( t + d ) } } .
We can use h ( α , β ) to denote the maximum horizontal deviation between the arrival curve α and the service curve β . So the above equation can be expressed as: d ( t ) h ( α , β ) .

3.3. Problem Description

Tactile Internet architecture shown in Figure 1 is very sensitive to latency. Tactile Internet vision would enable to provide remote real-time control, whether that is human-to-machine or machine-to-machine [36]. It is necessary to ensure that the latency between the master and slave domains is within a certain value. Our work is based on DNC for network modeling to obtain the latency upper bound. This in turn guides the deployment of the network infrastructure based on the given latency requirements in real-world application scenarios. The effect of the relevant parameters on the delay boundaries is discussed through DNC theory to determine which network configuration enables the end-to-end delay to meet the established requirements. This allows for a more rational configuration of network devices and efficient network planning and optimization.
There have been studies [20,37] applying artificial intelligence (AI) to mobile edge computing (MEC) servers for the Tactile Internet. The HSI on the HO side is equipped with an AI edge sample forecast (ESF) module. If a sample is lost or excessively delayed, this module is responsible for providing the HO with a predicted sample (based on previous samples) instead of waiting for a lost or delayed sample, thus allowing the operator to proceed to the next operation smoothly. In addition, this waiting time threshold needs to be set taking into account the worst-case end-to-end delays in the Tactile Internet. Thus, the DNC can be used to analyze the end-to-end delay of the Tactile Internet to obtain a theoretical upper bound on the delay, which can be set as a time threshold for starting the prediction module. This will be shown in our next study.
In the architecture of the Tactile Internet, the network domain is a key part of the implementation of tactile communication. Therefore, we only analyze the network domain transmission latency to obtain a network domain design solution for a given latency requirement. However, in the future Internet, end-to-end latency will also include latency of composite service systems combining network and cloud computing [38], which we will investigate in our future work.

4. Modeling Tactile Internet Using DNC

To quantitatively study the performance of the Tactile Internet network, we abstract the complex network domain in Figure 1 into a mathematical model, as shown in Figure 2. In the abstract Tactile Internet model, R ( t ) denotes the input data and R ( t ) denotes the output data, and the arrival traffic for each system can be either a single through traffic α t h ( t ) or an aggregated cross traffic α c r ( t ) synthesized from multiple cross traffic α c r j ( t ) . Since multiple flows may share servers, the cross-traffic can be used to represent the impact of resource competition.
There are n systems in the abstract model. Suppose the service curve of the i t h system is β i ( t ) . We can connect the service curves of the n systems into an equivalent system with the equivalent service curve of β ˜ ( t ) by convolution operation through the series theorem. By combining the traffic characteristics of the Tactile Internet and the network structure into the above model, we can obtain an end-to-end delay upper bound for the Tactile Internet.

5. Determining Delay Bounds

In this section, we derive the end-to-end delay calculation method for the Tactile Internet model abstracted in Figure 2 based on DNC theory. For different characteristics of traffic arrivals and network topology, we have derived models for the single-flow with single-switch, multi-flow with single-switch, and multi-flow with multi-switch cases.

5.1. Single Flow with Single Switch Performance Model

In this section, we will determine the delay bound when a single flow enters a network device. Suppose target flow f A enters a switch S 1 and exits through a port.
Let the average rate of f A be r f and the maximum burst be b f . Then, the arrival curve of f A is obtained from the leaky bucket model as
α f ( t ) = r f t + b f .
Let the processing rate of the switch be R and the fixed delay be T. Then, the service curve provided by S 1 is
β R 1 , T 1 = R [ t T ] + .
From the classical DNC results [11], the delay bound of f A can be derived as
d = T + b f R .

5.2. Multi-Flow with Single Switch Performance Model

In this section, we will determine the delay bound when multiple flows enter into a network device. When multiple flows are encountered for aggregation, we define the flow that requires a delay upper bound as f A , and the others as interfering flows f B . Assume that a single target flow f A and a single interfering flow f B enter a switch S 1 at the same time and are output through a single port. Let the average rate of the target flow f A be r f A and the maximum burst be b f A , and the average rate of the interfering flow f B be r f B and the maximum burst be b f B . Then, their arrival curves are α f A ( t ) and α f B ( t ) , respectively.
α f A ( t ) = r f A t + b f A , α f B ( t ) = r f B t + b f B .
Let the processing rate of switch S be R and the fixed delay be T. Based on the concept of residual service curve [39], the first-in-first-out (FIFO) residual service curve of the target flow f A at switch S 1 can be obtained as:
β R A , T A r e s = R A r e s [ t T A r e s ] + ,
where R A r e s = R r f B , T A r e s = T + b f B R . R A r e s is the service rate provided by the switch to the target flow, which is deducted from the total service rate used to service the interfering flow. The increase in fixed delay T A r e s is the maximum amount of burst used to service the interfering flows. Thus, the delay bound can be obtained as
d = T + b f B R + b f A R r f B .
When L target flows f A 1 , , f A L and M interfering flows f B 1 , , f B M enter a network device (with processing rate R and fixed delay T), we assuming that the average rate of the i t h target flow is r f A i , the maximum burst is b f A i , and the average rate of the j t h interfering flow is r f B j and the maximum burst is b f B j , their aggregated flow arrival curves can be expressed as
α A a g g ( t ) = i = 1 L r f A i t + i = 1 L b f A i , α B a g g ( t ) = j = 1 M r f B j t + j = 1 M b f B j .
Based on the above analysis of the residual service curve, the residual service curve of the aggregated target flow can be introduced as
β R A a g g , T A a g g r e s = R A a g g r e s [ t T A a g g r e s ] + ,
where R A a g g r e s = R r f B j , T A a g g r e s = T + b f B j R . Then, we can derive the delay bound as
d a g g = T + b f B j R + b f A i R r f B j .

5.3. Multi-Flow with Multi-Switch Performance Model

This section determines the delay bounds for multiple flows passing through multiple network devices connected in series. Let the processing rate of each of the N switches S 1 , , S N be R 1 , , R N and the fixed delay T 1 , , T N . Then, by the tandem theorem, the service curve β s y s provided by the equivalent system obtained from these N switches can be obtained as
β s y s = min ( R 1 , , R N ) · [ t i = 1 N T i ] + .
Thus, the upper bound d s i n g l e for the delay of a single flow (with arrival curve α f ( t ) = r f t + b f ) into the system can be obtained as
d s i n g l e = i = 1 n T i + b f min ( R 1 , , R N ) .
The upper bound on the delay d m i x e d for a single mixed flow (single target flow arrival curve for α f A ( t ) = r f A t + b f A and single interference flow arrival curve for α f B ( t ) = r f B t + b f B ), entering the system is
d m i x e d = i = 1 n T i + b f B min ( R 1 , , R N ) + b f A min ( R 1 , , R N ) r f B .
The upper bound on the delay d a g g m i x e d for multiple mixed flows (aggregated target flow arrival curve for α A a g g ( t ) = i = 1 L r f A i t + i = 1 L b f A i and aggregated interference flow arrival curve for α B a g g ( t ) = j = 1 M r f B j t + j = 1 M b f B j ) entering the system is
d a g g _ m i x e d = i = 1 n T i + b f B j min ( R 1 , , R N ) + b f A i min ( R 1 , , R N ) r f B j .

5.4. Tactile Internet Performance Model

Some use cases and traffic requirements for the Tactile Internet are given by the IEEE 1918.1 “Tactile Internet” standard working group [2]. We will use the traffic characteristics of the tele-operation use case to validate our model.
We first consider the case when there is only one switch. When the master domain sends control commands to the slave domain in tele-operation, there is only one traffic flow “Haptic”, which corresponds to the single flow single switch case of Section 5.1, so there is
d c t r l = T + b H a p t i c R .
When the slave domain sends feedback signals to the master domain, there are three types of traffic: “Video”, “Audio”, and “Haptic feedback”, which correspond to the case of Section 5.2, a multi-flow single switch, so there is
d f d b k = T + b V i d e o + b A u d i o R + b H a p t i c f d b k R ( r V i d e o + r A u d i o ) .
Thus, the round-trip delay of tele-operation is
d r o u n d _ t r i p = d c t r l + d f d b k .
Following the above idea, we extend it to the case of N switches, and the delay of the control command and the delay of the feedback signal can be derived from Section 5.3, respectively:
d c t r l = i = 1 n T i + b H a p t i c min ( R 1 , , R N ) ,
and
d f d b k = i = 1 n T i + b V i d e o + b A u d i o min ( R 1 , , R N ) + b H a p t i c f d b k min ( R 1 , , R N ) ( r V i d e o + r A u d i o ) .
Since we use switches with the same attributes, there are i = 1 n T i = n T and m i n ( R 1 , , R N ) = R in Equations (23) and (24). We denote each of the above four cases in this section by Cases 1–4, and their descriptions and corresponding variable settings are summarized in Table 1.

6. Evaluation

In this section, we first validate and evaluate the upper bounds on delay obtained from the theoretical model described above ( a c c u r a c y ξ = a c t u a l d e l a y t h e o r e t i c a l d e l a y ). Then, we study the impact of traffic arrivals at different rates, interference from mixed flows, and the number of switches on the end-to-end performance of the Tactile Internet.

6.1. Experimental Settings

Referring to the parameters of the real switch used for time-varying analysis provided in [10], we use the switch parameters of 10 G and set the service rate R to 1250 Mbps and the fixed delay T to 8 μs. The packet size is set to 1024 bits. We perform simulation experiments in NS3 network simulator, which generates burst flows arriving according to a Poisson Pareto Burst Process module, with each burst generating a flow with a constant rate. Two terminal nodes and multiple switch nodes are generated through NodeContainer, the nodes are all connected in tandem, where one terminal node connects to the traffic generator as the master domain node and the other terminal node is used as the Receive, as the slave domain node.

6.2. Performance Validation

In order to verify the correctness and validity of the system end-to-end delay upper bound model, the experimental data obtained from the NS3 platform is compared with its calculated delay values to verify the accuracy of the proposed performance model. Also, we added another analytical model of end-to-end delay, CPA [40], to compare with our experiments.

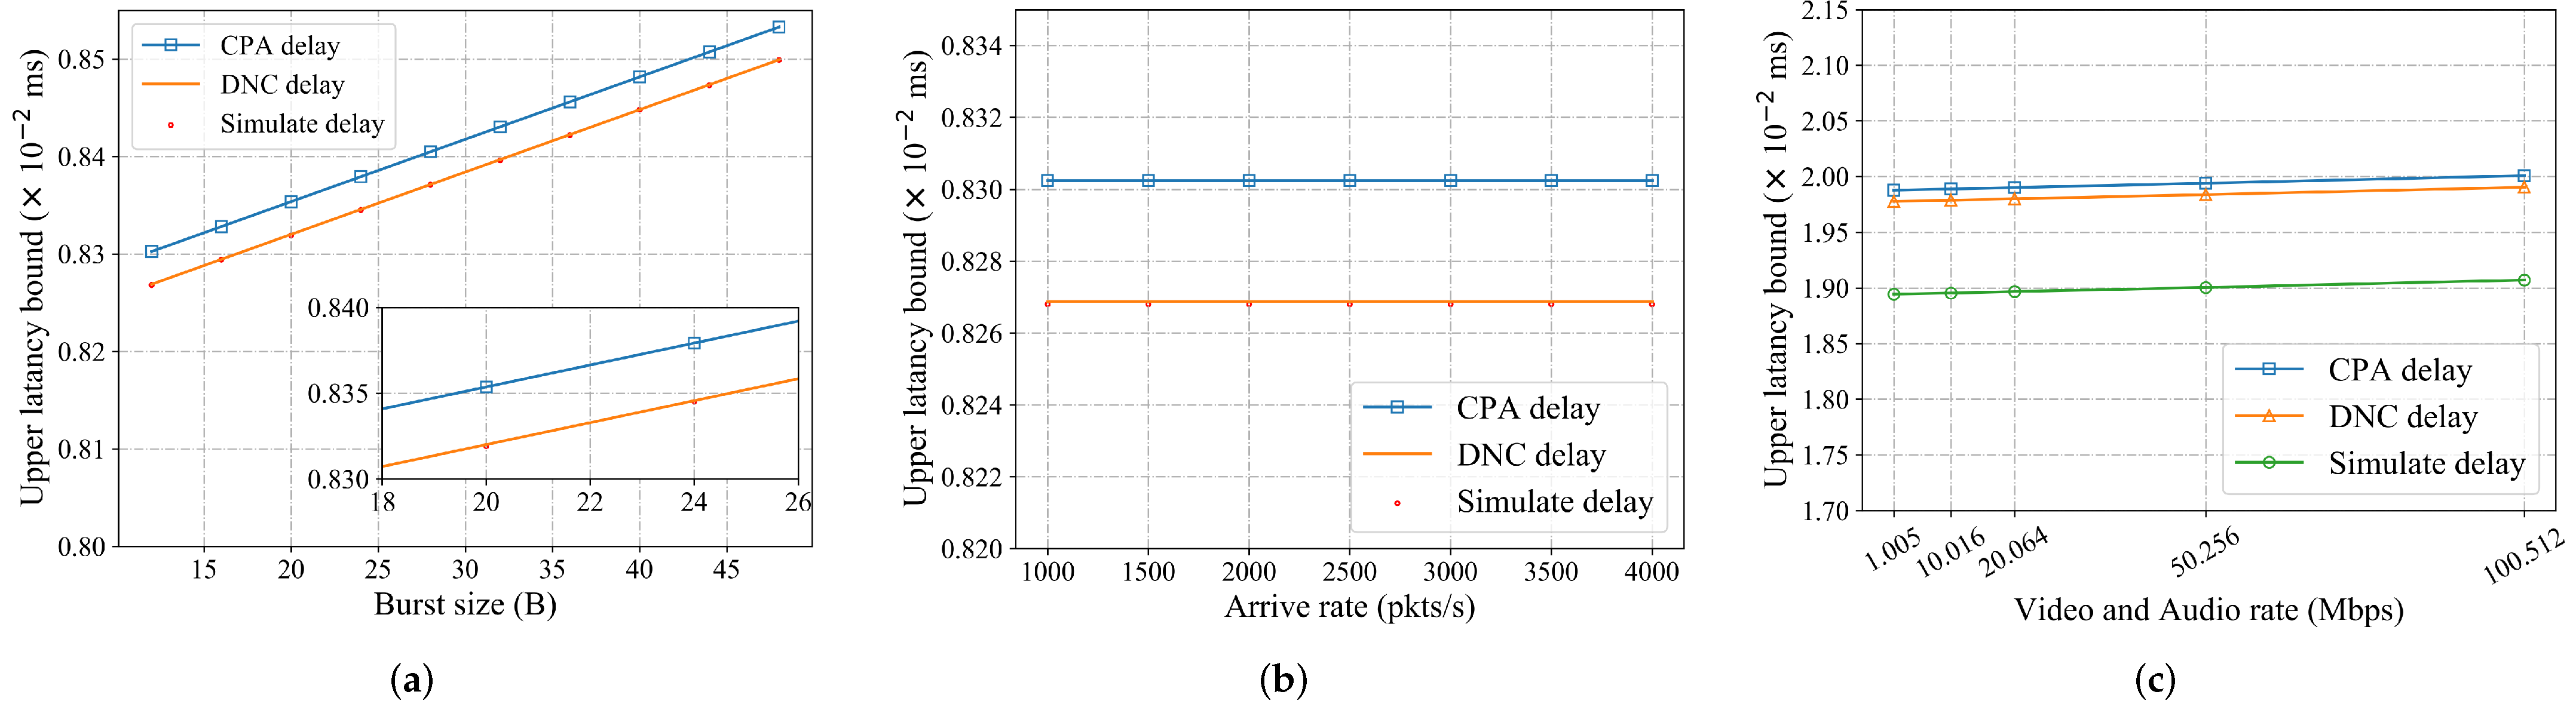
6.2.1. Single Flow with Single Switch

First, we simulate the case of single flow single switch, divide the traffic case of tele-operation, select the burst size of 6 DoF and divide it equally, and simulate the above case in turn and get its theoretical delay upper limit according to Equation (20), and explore the accuracy of the theoretical delay compared with the simulated delay under different burst sizes, the comparison results are shown in Figure 3a.
As can be seen from Figure 3a, when arrival rate is 1000 pkts/s, the upper bound of theoretical and simulation delay increase with the increase of burst size, showing a consistent trend. As can be seen from Figure 3b, when the burst size is 12 B, the theoretical and simulation delays remain basically unchanged with the increase of arrival rate, which is consistent with Equation (20). From these two results, it can be seen that the upper delay bound obtained by the DNC model is closer to the simulation delay than the CPA model. The DNC accuracy is above 99.99% and the CPA accuracy is above 99.60%, both maintain a high accuracy rate. Moreover, when the network is a simple structure in, the end-to-end delay obtained by the DNC theory is approximately equal to that of the delay obtained by the simulation.

6.2.2. Multi-Flow with Single Switch

The arrival rate of the tactile feedback flow in the feedback flow is the same as that in the control flow. Combined with the result of Case 1, we set arrival rate to 1000 pkts/s, treat video and audio flow as interference flow and divide their data rates into five combinations. Because of the additivity of the arrival curve, the two kinds of interference flow can be treated equally. The CPA, DNC and simulation results for the above five cases are shown in Figure 3c. It can be seen that the trends are consistent and the upper delay bound increases with the increase of the interference flow rate. The DNC accuracy is above 95.78% and the CPA accuracy is above 95.30%. The residual service curve analysis gives the maximum residual service rate that can be obtained by the target flow by separating the service required by the interfering flow from the total service capacity. Since the worst-case end-to-end delay of the target flow is considered, the interfering flow will use the switch’s services first and the target flow will use its residual services. Therefore, when the service required by the interfering flow increases, the residual service of the target flow will decrease and the upper bound of delay will increase. This method takes into account the case where the interfering flow does not use up its quota bandwidth and the target flow happens to occupy this part of the free bandwidth. Therefore, from the results, the network calculus is also applicable for the case of multi-flow mixing.

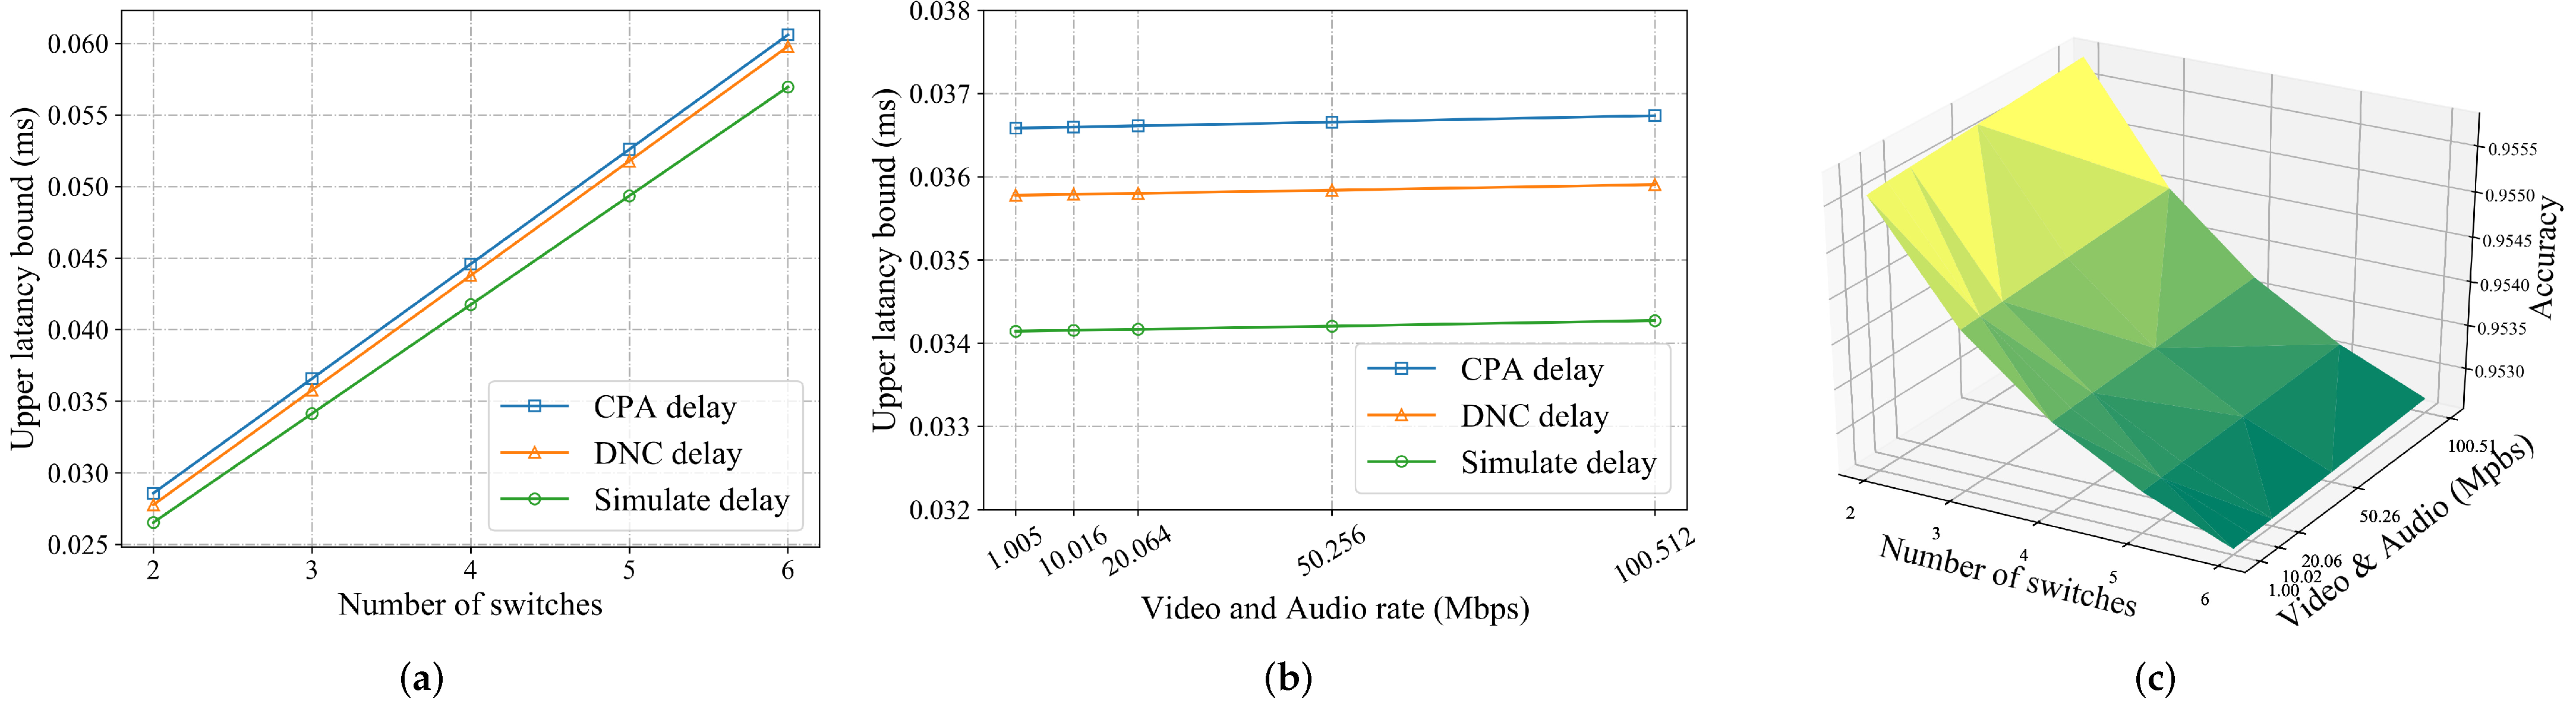
6.2.3. Single Flow with Multi-Switch

In this case, we use the same attribute of switch, we set up 2–6 switches, the service rate and fixed delay of the switch is still 1250 Mbps and 8 μs, and they are connected in series to discuss the comparison of DNC delay and simulation delay of various switches respectively under different burst size.
Figure 4a shows the relationship between the end-to-end delay and the number of switches for a burst size of 12 B, and it is easy to find that the CPA, DNC and simulation results show the same upward trend with the increase of switches and are relatively close to each other, which has a good fit. However, the DNC is still closer to the simulation result than the CPA, which is similar to the result of Case 1. Since we assume that the switches have the same properties and each switch has a fixed delay T, the upper bound on the delay is a simple linear summation under the (min,+) convolution operation. Figure 4b shows the variation of the accuracy with the burst size and the number of switches, we can see that the accuracy increases gradually with the increase of the burst size. This trend is consistent with that of Case 1. Moreover, the accuracy remains high as the number of switches increases, indicating that the Tactile Internet network model based on network calculus is also applicable to complex networks with multiple nodes.

6.2.4. Multi-Flow with Multi-Switch

Combined with Case 2 and Case 3, this case will discuss the relationship between the upper bound of the DNC delay and the simulation delay in the case of multiple flows and multiple switches.
As can be seen from Figure 5a, when the properties of the interference flow are fixed and the number of switches is increased, the CPA, DNC and the simulation delay are in the same upward trend with higher accuracy and DNC is closer to the simulation result, the DNC accuracy is above 95.26% and the CPA accuracy is above 92.84%. As can be seen from Figure 5b, when the arrival rate of the interfering flow increases, the end-to-end delay of the simulated target flow presents an upward trend. This is due to the competition between the interference flow and the target flow. The service rate of the target flow is the maximum remaining service rate that can be obtained by separating the services required by the interference flow from the total service capacity. This is the same analysis as in Case 2. Moreover, when the rate of interference increases, the simulation delay is gradually close to the theoretical delay(from 95.43% to 95.45%). This shows that when the delay of target flow increases, the delay obtained by DNC theory can better reflect the real upper bound of network delay.
Figure 5c gives the variation of the accuracy for different interfering flow attributes and the number of switches. As with the analysis of Figure 4b and Figure 5a, the target flow delay accuracy increases with the increase of the interfering flow rate, while the accuracy decreases when the number of switches increases, but still remains stable at over 95%. Therefore, the network calculus also ensures accurate latency analysis in the case of multiple flows and multiple switches. Reduced to the real scenario of haptic Internet, the end-to-end delay of the feedback signal with haptic information can also be predicted by network calculus theory.
From the above four cases, the DNC model can obtain higher tightness overall than the CPA model. We evaluate the overall situation of the above four cases using four regression indicators: mean squared error (MSE), root mean squared error (RMSE), mean absolute error (MAE) and R square ( R 2 ) (as in Table 2). The results show that the delay bounds obtained using DNC could perfectly fit the worst-case delay bounds of various cases, reflecting the feasibility and accuracy of this analytical model.

6.3. Performance Analysis

In this subsection, we will use the analytical model developed in Section 5 to investigate the performance of the Tactile Internet under different service configurations by varying the properties of the target flows, the number of nodes, and the cross-traffic arrival rate.

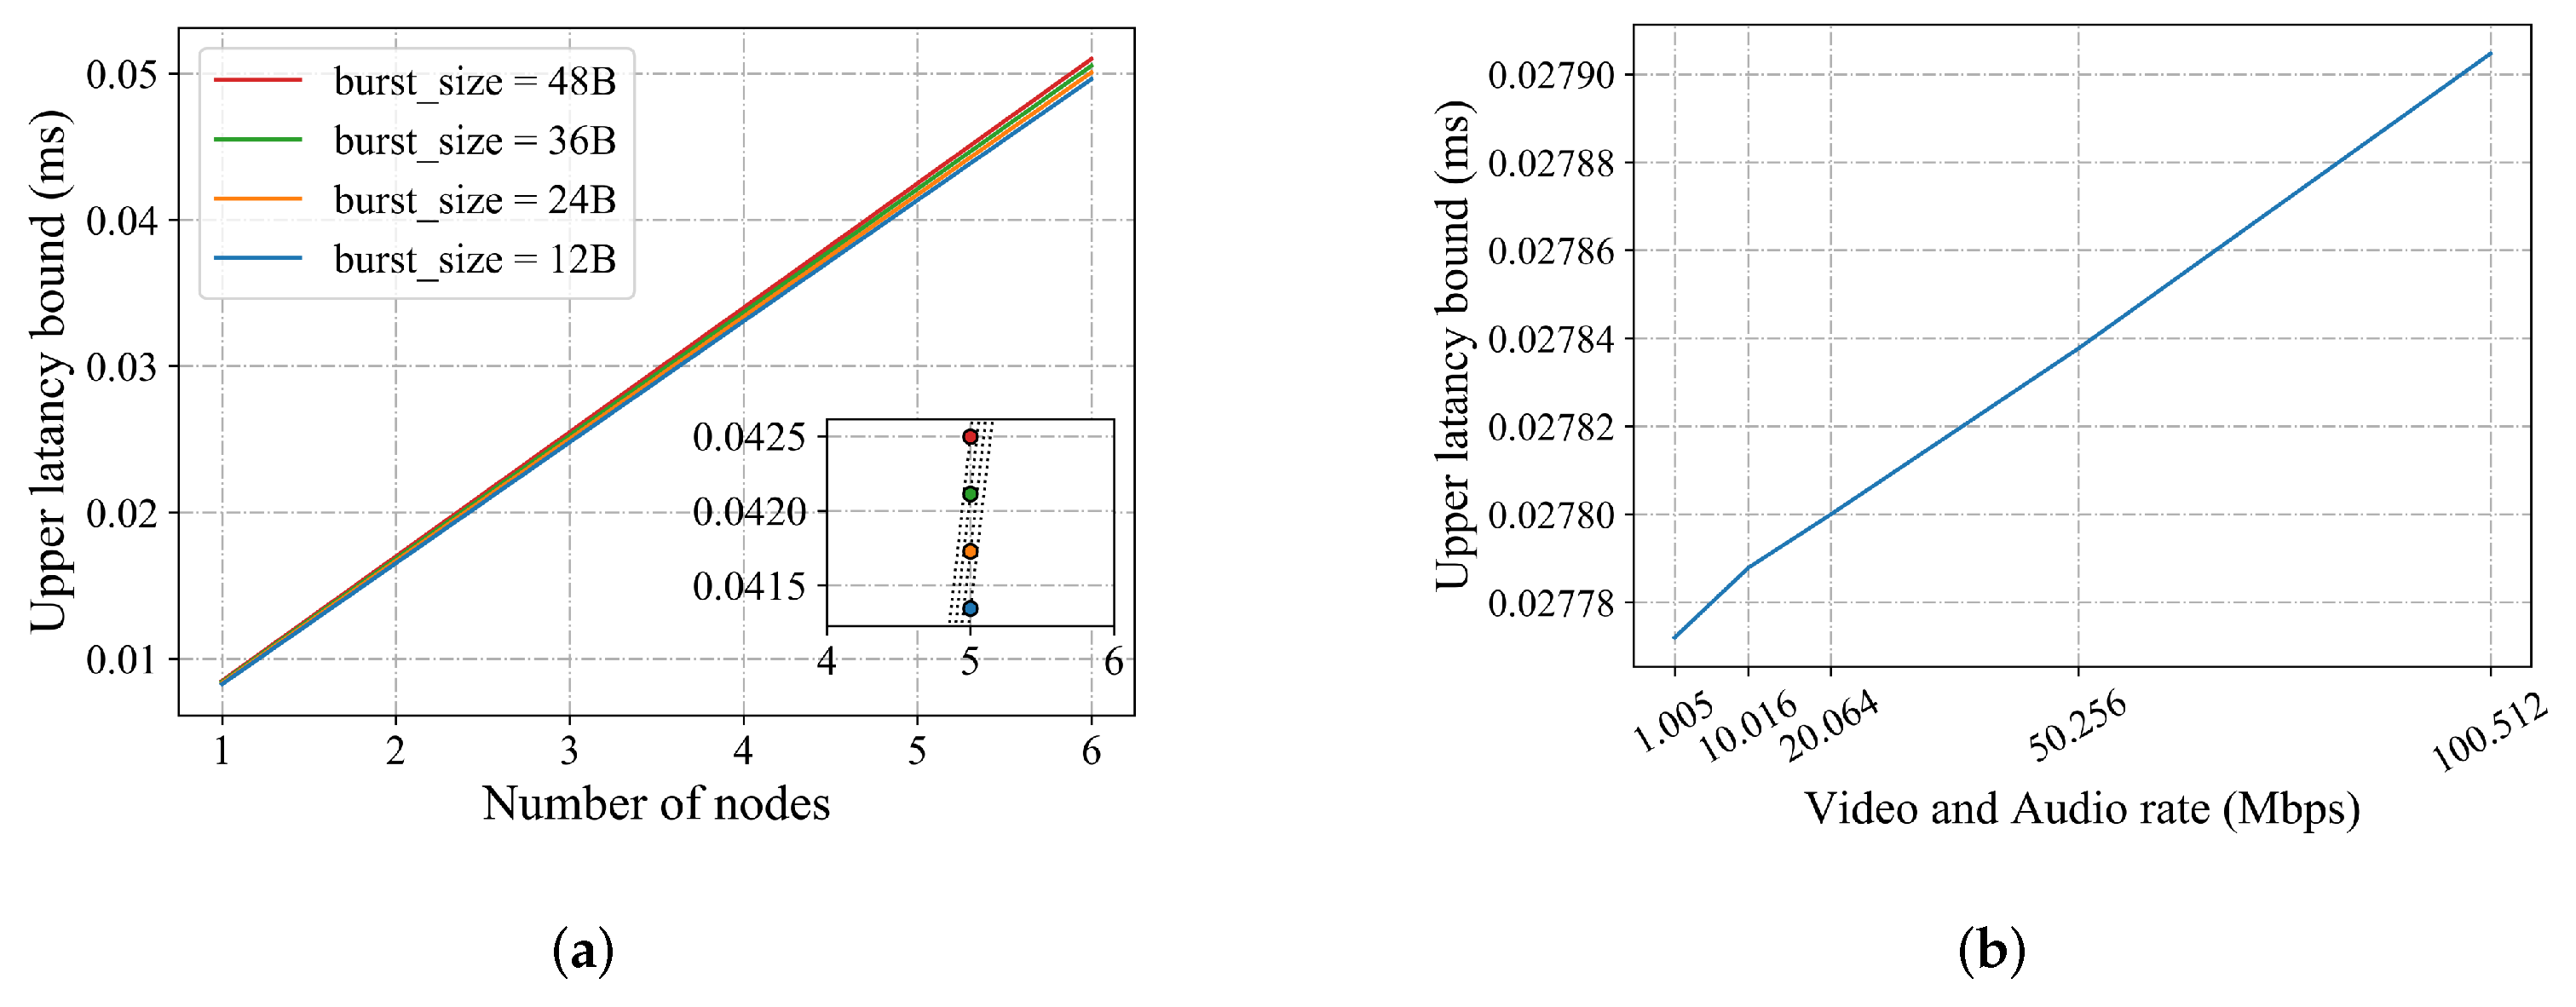
6.3.1. Effect of the Number of Tactile Internet Nodes on the Upper Bound of Delay

The number of Tactile Internet nodes is an important aspect of Tactile Internet architecture deployment, and this subsection aims to investigate the effect of the number of Tactile Internet nodes on delay bounds with different target flow burst sizes. The network setup is described as follows: the arrival traffic is modeled as a Poisson process and the arrival rate is set to 1000 pkt/s. In this section, we study the case of tandem connection of similar nodes, i.e., each node’s service process has a fixed service rate and delay, as can be obtained from Figure 6a. In that case, the upper limit of delay is linearly related to the number of Tactile Internet nodes and tends to increase as the number of nodes increases. This is because the tandem formula obtained from the ( m i n , + ) convolution formula, with the same node properties, only increases the fixed delay of that node for each additional node in the equivalent service curve, so the overall upper limit of delay is linearly increasing with the number of nodes. In addition, by comparing the delay bounds under the burst size of the four target flows, it is found that the delay bounds increase with the burst size because when the burst size increases, packets generate more congestion and wait in the cache before the service node, which increases the delay of the target packet that has to wait for the previous packet transmission to be processed, which also corresponds to the positive correlation between the DNC delay formula and the burst size.

6.3.2. Effect of Interference Flow Properties on the Upper Bound of Delay

While the Tactile Internet gives people haptic feedback in real time, it cannot be separated from picture and sound feedback. In many Tactile Internet applications, the types of traffic from the domain to the master domain include video, audio, and haptic feedback, and competing traffic other than haptic feedback will be queued with haptic traffic for shared services, which puts a premium on end-to-end delay of haptic information. This subsection investigates the effect of the properties of the interference flow on the upper bound of the tactile flow delay. As shown in Figure 6b, the interference traffic has a significant effect on the upper bound of the target flow delay in the Tactile Internet. A large amount of interfering traffic results in a higher delay upper bound. This is because under the FIFO scheduling algorithm, the interference traffic consumes a large amount of service resources, which leads to a reduction of available resources for the target traffic and negatively affects the service provisioning of the target traffic.
As analyzed above, the developed analytical model can be used as a practical tool for the deployment and management of Tactile Internet services. In particular, the developed analytical model can help service providers improve the performance of the placement of network nodes such as Tactile Internet servers or switches during the design phase of Tactile Internet architecture. In the performance analytical modeling process, we use a parametric approach to develop the resolution model. As a result, service providers and network operators can customize parameter values and perform performance evaluation based on their usage scenarios.

7. Conclusions

In this paper, we analyze the architecture of the Tactile Internet and model it abstractly as a tandem system based on its architectural features. The system can be described as a two-way communication between the master and slave domains, and one of the most important features of the communication is the ultra-low latency. We therefore apply DNC theory to the traffic characteristics of the Tactile Internet and perform a performance analysis. Using DNC theory, we investigate the impact of different traffic characteristics of the Tactile Internet and the number of switches on the end-to-end delay and the accuracy of DNC theory. The results show that DNC provide tighter upper bounds on delay in all cases. From the simulation experiments, it can be concluded that the main factor affecting delay is the number of switches. If reverted to a realistic scenario, it could be the number of servers deployed. This also implies that edge computing will be the trend in the deployment of Tactile Internet applications. In future research, we will use DNC to analyze the performance of more complex Tactile Internet network architectures.

Author Contributions

Conceptualization, L.Z. and P.D.; methodology, Q.W. and L.Z.; validation, Q.W.; writing—original draft preparation, Q.W.and L.Z.; writing—review and editing, Q.W., Z.M., B.Y., L.Z. and P.D.; visualization, Q.W. All authors have read and agreed to the published version of the manuscript.

Funding

This research was supported in part by the Hunan Provincial Natural Science Foundation of China (Nos. 2022JJ30398 and 2022JJ40277) and Scientific Research Fund of Hunan Provincial Education Department (Nos. 22A0056 and 22B0102).

Data Availability Statement

Not applicable.

Acknowledgments

The authors are grateful to the editors and the reviewers for their insightful comments and suggestions.

Conflicts of Interest

The authors declare no conflict of interest.

References

  1. Fettweis, G.; Boche, H.; Wiegand, T.; Zielinski, E.; Schotten, H.; Merz, P.; Hirche, S.; Festag, A.; Hä ffner, W.; Meyer, M.; et al. The Tactile Internet—ITU-T Technology Watch Report. 2014. Available online: https://www.itu.int/dms_pub/itu-t/opb/gen/T-GEN-TWATCH-2014-1-PDF-E.pdf (accessed on 9 October 2022).
  2. Holland, O.; Steinbach, E.; Prasad, R.V.; Liu, Q.; Dawy, Z.; Aijaz, A.; Pappas, N.; Chandra, K.; Rao, V.S.; Oteafy, S.; et al. The IEEE 1918.1 “tactile internet” standards working group and its standards. Proc. IEEE 2019, 107, 256–279. [Google Scholar] [CrossRef] [Green Version]
  3. Fanibhare, V.; Sarkar, N.I.; Al-Anbuky, A. A survey of the tactile internet: Design issues and challenges, applications, and future directions. Electronics 2021, 10, 2171. [Google Scholar] [CrossRef]
  4. She, C.; Yang, C. Ensuring the quality-of-service of tactile internet. In Proceedings of the 2016 IEEE 83rd Vehicular Technology Conference (VTC Spring), Nanjing, China, 15–18 May 2016; pp. 1–5. [Google Scholar] [CrossRef]
  5. Krasniqi, F.; Elias, J.; Leguay, J.; Redondi, A.E. End-to-end delay prediction based on traffic matrix sampling. In Proceedings of the IEEE INFOCOM 2020-IEEE Conference on Computer Communications Workshops (INFOCOM WKSHPS), Toronto, ON, Canada, 6–9 July 2020; pp. 774–779. [Google Scholar] [CrossRef]
  6. Rusek, K.; Suá rez-Varela, J.; Mestres, A.; Barlet-Ros, P.; Cabellos-Aparicio, A. Unveiling the potential of graph neural networks for network modeling and optimization in SDN. In Proceedings of the 2019 ACM Symposium on SDN Research, San Jose, CA, USA, 3–4 April 2019; pp. 140–151. [Google Scholar] [CrossRef] [Green Version]
  7. Malakar, P.; Balaprakash, P.; Vishwanath, V.; Morozov, V.; Kumaran, K. Benchmarking machine learning methods for performance modeling of scientific applications. In Proceedings of the 2018 IEEE/ACM Performance Modeling, Benchmarking and Simulation of High Performance Computer Systems (PMBS), Dallas, TX, USA, 12 November 2018; pp. 33–44. [Google Scholar] [CrossRef]
  8. Gouareb, R.; Friderikos, V.; Aghvami, A.H. Delay sensitive virtual network function placement and routing. In Proceedings of the 2018 25th international conference on telecommunications (ICT), Saint Malo, France, 26–28 June 2018; pp. 394–398. [Google Scholar] [CrossRef]
  9. Ravi, B.; Thangaraj, J. End-to-end delay bound analysis of VANETs based on stochastic method via queueing theory model. In Proceedings of the 2017 International Conference on Wireless Communications, Signal Processing and Networking (WiSPNET), Chennai, India, 22–24 March 2017; pp. 1920–1923. [Google Scholar] [CrossRef]
  10. Mathew, A.; Srinivasan, M.; Murthy, C.S.R. Network calculus based delay analysis for mixed fronthaul and backhaul 5G networks. In Proceedings of the 2020 IEEE 21st international symposium on “A World of Wireless, Mobile and Multimedia Networks” (WoWMoM), Cork, Ireland, 31 August–3 September 2020; pp. 205–214. [Google Scholar] [CrossRef]
  11. Van Bemten, A.; Kellerer, W. Network Calculus: A Comprehensive Guide. Technische Universitä t Mü nchen Lehrstuhl fü r Kommunikationsnetze, Technical Report No. 201603. 2016. Available online: http://mediatum.ub.tum.de/doc/1328613/375837.pdf (accessed on 10 December 2022).
  12. Kö hler, L. A Compositional Performance Analysis for Embedded Computing Systems with Weakly-Hard Real-Time Constraints. 2022. Available online: https://leopard.tu-braunschweig.de/receive/dbbs_mods_00071234 (accessed on 10 December 2022).
  13. Boyer, M.; Roux, P. Embedding network calculus and event stream theory in a common model. In Proceedings of the 2016 IEEE 21st International Conference on Emerging Technologies and Factory Automation (ETFA), Berlin, Germany, 6–9 September 2016; pp. 1–8. [Google Scholar] [CrossRef]
  14. Henia, R.; Hamann, A.; Jersak, M.; Racu, R.; Richter, K.; Ernst, R. System level performance analysis–the SymTA/S approach. IEE Proc.-Comput. Digit. Tech. 2005, 152, 148–166. [Google Scholar] [CrossRef] [Green Version]
  15. Zhang, J.; Chen, L.; Wang, T.; Wang, X. Analysis of TSN for industrial automation based on network calculus. In Proceedings of the 2019 24th IEEE International Conference on Emerging Technologies and Factory Automation (ETFA), Zaragoza, Spain, 10–13 September 2019; pp. 240–247. [Google Scholar] [CrossRef]
  16. Miao, W.; Min, G.; Wu, Y.; Huang, H.; Zhao, Z.; Wang, H.; Luo, C. Stochastic performance analysis of network function virtualization in future Internet. IEEE J. Sel. Areas Commun. 2019, 37, 613–626. [Google Scholar] [CrossRef] [Green Version]
  17. Zhao, L.; Pop, P.; Zheng, Z.; Li, Q. Timing analysis of AVB traffic in TSN networks using network calculus. In Proceedings of the 2018 IEEE Real-Time and Embedded Technology and Applications Symposium (RTAS), Porto, Portugal, 11–13 April 2018; pp. 25–36. [Google Scholar] [CrossRef]
  18. Maile, L.; Hielscher, K.; German, R. Network calculus results for TSN: An introduction. In Proceedings of the 2020 Information Communication Technologies Conference (ICTC), Nanjing, China, 29–31 May 2020; pp. 131–140. [Google Scholar] [CrossRef]
  19. Chen, Y.; Liao, K.; Chen, Y. End-to-end delay analysis in aerial-terrestrial heterogeneous networks. IEEE Trans. Veh. Technol. 2021, 70, 1793–1806. [Google Scholar] [CrossRef]
  20. Maier, M.; Ebrahimzadeh, A. Towards immersive tactile internet experiences: Low-latency FiWi enhanced mobile networks with edge intelligence. J. Opt. Commun. Netw. 2019, 11, B10–B25. [Google Scholar] [CrossRef]
  21. Kim, K.S.; Kim, D.K.; Chae, C.B.; Choi, S.; Ko, Y.C.; Kim, J.; Lim, Y.G.; Yang, M.; Kim, S.; Lim, B.; et al. Ultrareliable and low-latency communication techniques for tactile internet services. Proc. IEEE 2018, 107, 376–393. [Google Scholar] [CrossRef] [Green Version]
  22. Aijaz, A. Towards 5G-enabled tactile internet: Radio resource allocation for haptic communications. In Proceedings of the 2016 IEEE Wireless Communications and Networking Conference(WCNC), Doha, Qatar, 3–6 April 2016; pp. 145–150. [Google Scholar] [CrossRef]
  23. Georges, J.P.; Divoux, T.; Rondeau, É. Network calculus: Application to switched real-time networking. In Proceedings of the 5th International ICST Conference on Performance Evaluation Methodologies and Tools, Paris, France, 16–20 May 2011; pp. 399–407. [Google Scholar] [CrossRef]
  24. Yang, H.; Cheng, L.; Ma, X. Bounding network-induced delays for time-critical services in avionic systems using measurements and network calculus. In Proceedings of the 10th ACM/IEEE International Conference on Cyber-Physical Systems, Montreal, QC, Canada, 16–18 April 2019; pp. 338–339. [Google Scholar] [CrossRef]
  25. Zhang, L.; Chen, X.; Xiang, X.; Wan, J. A stochastic network calculus approach for the end-to-end delay analysis of LTE networks. In Proceedings of the 2011 International Conference on Selected Topics in Mobile and Wireless Networking, Shanghai, China, 10–12 October 2011; pp. 30–35. [Google Scholar] [CrossRef]
  26. De Azua, J.A.R.; Boyer, M. Complete modelling of AVB in network calculus framework. In Proceedings of the 22nd International Conference on Real-Time Networks and Systems, Versaille, France, 8–10 October 2014; pp. 55–64. [Google Scholar] [CrossRef]
  27. Geyer, F.; Carle, G. Network engineering for real-time networks: Comparison of automotive and aeronautic industries approaches. IEEE Commun. Mag. 2016, 54, 106–112. [Google Scholar] [CrossRef]
  28. Duan, Q. Modeling and performance analysis for service function chaining in the SDN/NFV architecture. In Proceedings of the 2018 4th IEEE Conference on Network Softwarization and Workshops (NetSoft), Concordia University, Montreal, QC, Canada, 25–29 June 2018; pp. 476–481. [Google Scholar] [CrossRef]
  29. Hu, H.; Li, Q.; Xiong, H.; Fang, B. The delay bound analysis based on network calculus for asynchronous traffic shaping under parameter inconsistency. In Proceedings of the 2020 IEEE 20th International Conference on Communication Technology (ICCT), Nanning, China, 28–31 October 2020; pp. 908–915. [Google Scholar] [CrossRef]
  30. Ren, Q.; Liu, K.; Zhang, L. Multi-objective optimization for task offloading based on network calculus in fog environments. Digit. Commun. Netw. 2021, 8, 829–837. [Google Scholar] [CrossRef]
  31. Simsek, M.; Aijaz, A.; Dohler, M.; Sachs, J.; Fettweis, G. 5G-enabled tactile internet. IEEE J. Sel. Areas Commun. 2016, 34, 460–473. [Google Scholar] [CrossRef] [Green Version]
  32. Shi, X.; Feng, M.; He, G.; Li, S.; Jiang, T. A versatile experimental platform for tactile internet: Design guidelines and practical implementation. IEEE Netw. 2022. [Google Scholar] [CrossRef]
  33. Gupta, R.; Tanwar, S.; Tyagi, S.; Kumar, N. Tactile internet and its applications in 5G era: A comprehensive review. Int. J. Commun. Syst. 2019, 32, e3981. [Google Scholar] [CrossRef]
  34. Monnet, W.; Yahiya, T.A. HoIP performance for Tactile Internet over 5G networks: A teleoperation case study. In Proceedings of the 2020 11th International Conference on Network of the Future (NoF), Bordeaux, France, 12–14 October 2020; pp. 48–54. [Google Scholar] [CrossRef]
  35. Fidler, M.; Rizk, A. A guide to the stochastic network calculus. IEEE Commun. Surv. Tutor. 2014, 17, 92–105. [Google Scholar] [CrossRef]
  36. Al Ridhawi, I.; Aloqaily, M.; Karray, F.; Guizani, M.; Debbah, M. Realizing the tactile internet through intelligent zero touch networks. IEEE Netw. 2022. [Google Scholar] [CrossRef]
  37. Beniiche, A.; Ebrahimzadeh, A.; Maier, M. The way of the DAO: Toward decentralizing the tactile internet. IEEE Netw. 2021, 35, 190–197. [Google Scholar] [CrossRef]
  38. Duan, Q. Modeling and performance analysis for composite network–compute service provisioning in software-defined cloud environments. Digit. Commun. Netw. 2015, 1, 181–190. [Google Scholar] [CrossRef] [Green Version]
  39. Le Boudec, J.Y.; Thiran, P. Network Calculus: A Theory of Deterministic Queuing Systems for the Internet; Springer: Berlin/Heidelberg, Germany, 2001. [Google Scholar]
  40. Ojewale, M.A.; Yomsi, P.M.; Nikolić, B. Worst-case traversal time analysis of tsn with multi-level preemption. J. Syst. Archit. 2021, 116, 102079. [Google Scholar] [CrossRef]
Figure 1. Tactile Internet architecture (with remote surgery as an example).
Electronics 12 00021 g001
Figure 2. End-to-end Tactile Internet model.
Electronics 12 00021 g002
Figure 3. Single flow and multi-flow with single switch: (a) CPA delay, DNC delay and simulate delay versus burst size when the arrival rate is 1000 pkts/s, (b) CPA delay, DNC delay and simulate delay versus arrival rate when the burst size is 12 B, and (c) effect of interference flow rates on the end-to-end delay of the target flow.
Electronics 12 00021 g003
Figure 4. Single flow with multi-switch: (a) End-to-end delay versus number of switches (when burst size is 12 B), and (b) accuracy of theoretical and simulated values versus the number of switches when the burst size is 12–48 B.
Electronics 12 00021 g004
Figure 5. Multi-flow with multi-switch: (a) end-to-end delay of target flow versus number of switches (at Video rate of 1 Mbps and audio rate of 5 Kbps), (b) end-to-end delay of the target flow versus the arrival rate of the interfering flow (when N = 3), and (c) interference flow rates and number of switches versus accuracy.
Electronics 12 00021 g005
Figure 6. Delay upper bound influence factor: (a) number of Tactile Internet nodes, and (b) arrival rates of interference flow (when the number of nodes is 2).
Electronics 12 00021 g006
Table 1. Actual situations and parameter Settings in four cases.
Traffic DirectionNumber of Flow(s) and Switch(es)Variable Setting
Case 1Master to Slave1 Flow and 1 SwitchHaptic arrival rate: 1–4 pkts/s
Haptic burst size: 12–48 B
Case 2Slave to Master3 Flows and 1 SwitchVideo arrival rate: 1–100 Mbps
Audio arrive rate: 5–512 Kbps
Case 3Master to Slave1 Flow and N SwitchesHaptic burst size: 12–48 B
Number of switches: 2–6
Case 4Slave to Master3 Flows and N SwitchesVideo arrival rate: 1–100 Mbps
Audio arrive rate: 5–512 Kbps
Number of switches: 2–6
Table 2. Overall evaluation of Case 1–Case 4.
Case 1Case 2Case 3Case 4
RMSE5.64  × 10 7 8.34  × 10 4 2.32  × 10 6 2.11  × 10 3
MSE3.18  × 10 13 6.95  × 10 7 5.40  × 10 12 4.46  × 10 6
MAE5.00  × 10 7 8.34  × 10 4 2.00  × 10 6 2.03  × 10 3
R 2 99.99%99.73%99.99%96.51%
Disclaimer/Publisher’s Note: The statements, opinions and data contained in all publications are solely those of the individual author(s) and contributor(s) and not of MDPI and/or the editor(s). MDPI and/or the editor(s) disclaim responsibility for any injury to people or property resulting from any ideas, methods, instructions or products referred to in the content.

