Article

An Extreme Value Analysis-Based Systemic Approach in Healthcare Information Systems: The Case of Dietary Intake

by
Dimitrios P. Panagoulias
,
Dionisios N. Sotiropoulos
and
George A. Tsihrintzis
*
Department of Informatics, University of Piraeus, Karaoli ke Dimitriou 80, 185 34 Piraeus, Greece
*
Author to whom correspondence should be addressed.
Electronics 2023, 12(1), 204; https://doi.org/10.3390/electronics12010204
Submission received: 28 November 2022 / Revised: 24 December 2022 / Accepted: 26 December 2022 / Published: 31 December 2022
(This article belongs to the Special Issue Trends and Applications in Information Systems and Technologies)

Abstract

:
Biomarkers are measurements of biological variables that can determine a state of health. They consist of measuring a single variable or a combination of variables related to the state of health that these variables represent. Biomarkers can provide an early warning of a health problem in relation to an individual patient or group of patients, and thus trigger actions and lead to interventions. Nutritional biomarkers measure the biological consequences of one’s diet. In our recent work, we have used machine learning to predict weight, metabolic syndrome and blood pressure, using blood-exam-based biomarkers. In the current work, we use extreme value theory to examine the significance of outliers in health data, with a focus on diet and the standard biochemistry profile. Specifically, we show that, using extreme value analysis and by applying a systemisation of the process, health trends can be predicted, and thus, health interventions can be (at least partially) automated. For that purpose, public access datasets have been used, which were retrieved from the National Health and Nutrition Examination Survey. The NHANES is a program of studies designed to assess the health and nutritional status of the population in the United States. In total, about 70,000 datapoints were analysed, covering about a decade’s worth of observations.

1. Introduction

Predictive medicine is based on the forecasting of a disease via biomarker analysis and the instigation of preventive measures to decrease the impact of that disease or avoid it altogether. It is often utilised in cancer treatment and diagnosis. Biomarker can offer precise evaluation pathways and more effective treatment strategies by focusing them on individuals or groups of individuals with similar biological characteristics. A familiar and recognisable biometric and biomarker is the resting heart rate. Resting heart rate is the indicator of heart functionality and is considered a measurement of overall physical fitness. An immediate outcome of high heart rate is that of coronary heart disease. Another known biomarker related to heart attacks, congenital heart defects, coronary artery disease and pancreatitis is the level of triglycerides, which is retrieved via blood examinations. T-cells, which are white blood cells that protect against pathogens and tumours, are related to cancer, death, atherosclerosis and Alzheimer’s disease.

1.1. Nutritional Variables and Data Collection Strategies

Diet and nutrition are closely related to health. Assessing though the impact and the relation is a vigorous task from an analytical and a data-collection standpoint. Nutritional assessment involves collecting information about food and liquids consumed over a specific time period, which is encoded and processed in order to calculate intake of energy, nutrients and other dietary components using food composition tables. The available nutritional assessment methods have different strengths and weaknesses, and the purpose of the data collection is essential for the more adequate method to be chosen [1].
The food frequency questionnaire (FFQ), using single or recurring 24 h recall, is a frequently used methodology for dietary assessment. Food records and/or food diaries are also utilised. The portion size is estimated using standardisation or population-average portion sizes, images and food models, among other methods. Diet history, diet checklist, direct observation, and dietary screening are methodologies also used for data collection purposes [1]. For the recurring 24 h recall method, the dietary intake is recorded by a trained interviewer or via automated self-administered systems. The detailed information on food and beverages consumed, including quantity, brand and preparation method, is logged. The preparation method may include ingredients, recipe and the addition of fats. The process includes structured questionnaires and memory-aiding images that are non-leading about the foods and beverages consumed over the previous 24 h period. Adoption of food-based dietary guidelines (F.B.D.G), should be considered a preventive approach to malnutrition and health optimisation through a balanced diet, while at the same time ensuring a positive environmental imprint [2]. F.B.D.G intends to influence consumer behaviour, through education about nutrients, foods and beverages [3]. As will be more thoroughly explained in Section 4, we have used publicly available data collected by the National Health and Nutrition Examination Survey. The NHANES is a set of studies designed to assess the health and nutritional status of the population in the United States. For the dietary data, the FFQ was used with 24 h recall.

1.2. Scope of the Study

Nutritional biomarkers can belong to one or more of three categories. They can be used as validators of dietary interventions or as substitute indicators of dietary habits or as measures for a nutrient. In cases where generic biomarkers are not sufficient to derive conclusions for some food ingredients, dietary intake methods and nutritional biomarkers can carry more information [4]. In this paper, we identify trends in nutrient intake and in the distribution of the extreme values. Seventy-thousand datapoints have been analysed, covering more than a decade (2000–2014) of observations. Specifically, we applied methodologies based on extreme value theory and correlation techniques to analyse dietary variables for different weight classes. Our goal is to automate the identification of patterns in nutrient intake as related to weight, and thus provide personalised interventions in nutrition management via intelligent information systems. In turn, this will educate and influence consumer behaviour. To better outline the characteristics of the examined hypothesis, we used our machine learning framework for the what, why and how [5].
More precisely, this paper is organised as follows: In Section 2, the basics of nutritional biomarkers and nutritional epidemiology are summarised, and an overview of application highlights of extreme value theory in the medical field is included. Section 3 outlines key issues and challenges related to our research, and the methodology used is analysed in Section 4. In Section 5, the implementation of the methodology is explained, and we report its results for select cases to better outline its usability aspects. In this section, the results of the described process are also discussed. Finally, in Section 6, conclusions are drawn and future research endeavours are considered.

2. Literature Review and Related Work

2.1. Nutritional Biomarkers and Bioinformatics

According to the Global Burden of Disease study, a sub-optimal diet is considered as the main risk factor for morbidity and mortality, surpassing smoking [6]. Disability-adjusted life years (DALYs) is a time-based metric that assumes years of life lost caused by premature mortality (Y.L.L) and years of life lost due to time lived in a sub-optimal health condition. Another similar metric is the years lost due to disability (Y.L.D.) and is determined by the number of years living disabled weighted by the level of disability. Both are used to assess the overall burden of a disease [7]. According to Herforth et al. [6], in 2019, about 8 million deaths and 180 million DALYs were attributable to dietary risk factors.

2.2. Epidemiology and Nutrition

Traditional epidemiology has contributed significantly to identifying many key lifestyle and environmental risk factors for chronic disease. “Systems epidemiology” is the research discipline that combines standard epidemiological methodologies and modern technologies to amplify the understanding of biological and metabolic pathways. Similarly, nutrition research offers another ideal domain, where traditional approaches and technological advances can optimise knowledge creation and knowledge sharing. Diet is a very important parameter of good health, and the data collection methods for dietary records have been instrumental to building awareness [8].
There is little evidence to suggest that metabolic effects interfere with weight loss [9]. On the contrary, compliance with dietary prescription is considered the main issue that affects weight loss. Indeed, recent studies that examined different diet plans with varying macro-nutrient content concluded that adherence to the prescribed diet is the strongest predictor of success [9]. Preventative dietary strategies could benefit eating behaviour and thus affect weight at the population level, when they are adopted as part of public health guidelines [10].

2.3. Research Continuity

In our previous related study, leading to the current one, we achieved high precision in predicting important health states. Namely, using blood-exam-based features, and more specifically, the standard biochemistry profile, we can predict weight class with 85% accuracy [11,12,13,14]. Moreover, using the same features, we can predict metabolic syndrome with 86% accuracy and high systolic blood pressure with 74% accuracy, as can be seen in Figure 1. The corresponding methodologies have been adapted in a system that can receive blood exams as input, assess the health state, offer recommendations and automate strategic health interventions [15,16,17]. Regulators, as stakeholders, have been examined in [5], where regulation and validation of methodologies were recognised as important factors in the development of health applications.

2.4. Theory and Application Highlights of Extreme Value Analysis

In this section, the key characteristics of extreme value theory are highlighted. Extreme value analysis (EVA) can be approached from two different angles. The first one refers to the block maxima (minima) series. According to block maxima (minima), the annual maximum (minimum) of time series data is extracted, generating an annual maxima or minima series, simply referred as AMS. The analysis of the AMS datasets are most frequently based on the results of the Fisher–Tippett–Gnedenko theorem, which leads to the fitting of the generalised extreme value distribution. A wide range of distributions can also be applied. The limiting of distributions for the maximum (minimum) of a collection of random variables from the same distribution is the basis of the examined theorem [18].
The peak-over-threshold (POT) methodology is the second approach used in EVA In POT, a sorted series is analysed, first identifying the peak values that exceed a given threshold in a given set of records. The analysis usually involves the fitting of two distributions. One concerns the number of events covering the time period or space analysed, and the other concerns the selected size of extracted peaks. As per the Pickands–Balkema–De Haan theorem, the POT extreme values asymptotically follow the generalised Pareto distribution family, and a Poisson distribution is used for the total number of events [19]. The return level (R.V.) of the extreme values can be approximated from the fitted distribution. The value expected or return value is equal to or exceeds the threshold on average once every interval T of time or space with a probability of 1 / T . P.D.F. refers to the probability density function of the continuous random variable, which, at any given point in the examined space, can provide the relative likelihood that the random variable is located near the sample space [18].
In medical data analysis, extreme value theory (EVT) is frequently utilised. In [20], Maud et al. predicted the weekly rates of deaths from pneumonia and influenza over a given time series. The daily number of emergency department visits was examined to determine the probability of extreme occurrences. In [21], Chiu et al. investigated mortality and morbidity using EVT. In [22], Flegal et al. examined age-specific extreme values of body mass index, using growth charts of the 2000 Centers for Disease Control and Prevention. Estimators based on asymptotic extreme value theory have been proposed, and their performances were theoretically evaluated and verified via Monte Carlo simulation as faster alternatives for estimation of the parameters of alpha-stable impulsive interference in [23].
In [24], Arsenault et al. used extreme value theory for the estimation of risk in finite-time systems, especially for cases when data collection is either expensive and/or impossible. For the monitoring of rare and damaging consequences of high blood glucose, EVA has been deployed using the block maxima approach [25]. More examples of application of EVT can be found in the recent literature, and here we only report those considered more relevant to our research.
The shape of the probability distribution is calculated via the L-moments. The L-moments represent linear combinations of order statistics (L-statistics) similar to conventional moments. They are used to calculate quantities analogous to standard deviation, skewness and kurtosis, and can thus be termed L-scale, L-skewness and L-kurtosis. Therefore, they summarise the shape of the probability distribution:
L 4 = n Σ n i ( Y i Y ˜ ) 4 ( Σ n i ( Y i Y ˜ ) 2 ) 2 .
L 4 = L-kurtosis.
Y i : ith Variable of the distribution.
Y ˜ : Mean of the distribution.
n: Number of Variables in the distribution.
μ ˜ 3 = Σ i N ( X i X ˜ ) 3 ( N 1 ) σ 3 .
μ ˜ 3 = L-skewness.
N = number of variables in the distribution.
X i = random variables.
X ˜ = mean of the distribution.
σ = standard deviation. namely.

3. Key Issues and Challenges

3.1. Patient’s Journey

The patient’s journey refers to the nonlinear process that integrates different parts of the healthcare ecosystem. Various stakeholders interact with each other, both directly and indirectly. In the micro-space, the relationships among the patients, the physician and the healthcare staff, which may include nursing and administrating personnel, are considered direct. Other indirect relationships may include the government, insurance agencies, academic regulating bodies, big pharmaceutical companies and others that fall outside the scope of this study. A systemic approach that involves automating a process in the healthcare ecosystem is considered an intervention in the patient’s journey [5].
Symptom identification is regarded as a starting point for the patient’s journey, followed by a visit to the doctor. As can be seen in Figure 2, for diagnosis of a health problem, the patient will visit a laboratory for generic and special examinations, and a treatment if deemed necessary by a specialist. A treatment follow-up may be required, which includes a general assessment of the patient’s health by the doctor, in order to determine if further treatment is required and what treatment could potentially improve the patient’s health state. Lifestyle changes can be suggested by the doctor, or more specialised treatment and continuous monitoring may be required [5,15]. The various steps are characterised by different emotions. Better alignment between patients and the other stakeholders of the ecosystem increases the likelihood that the patients will engage more, follow instructions and become more aware and proactive towards their health [16].
The use of big data and artificial intelligence technologies can support decision making, especially when incorporated as parts of intelligent knowledge systems [5]. New foundations in diagnostics and pathology analytics can be laid through more advanced machine learning pipelines [26]. On the other hand, extreme values and outliers in the medical domain provide considerable opportunities, where new pathways can be located and interventions can be engineered.

3.2. The Golden Circle of Innovation Adapted for Machine Learning

The golden circle of innovation as a process consists of three features, namely, the what, why and how [27]. To outline the problem at hand and define an adequate solution to it, we employ the golden circle of innovation as adapted for machine learning [5].

3.2.1. The What

Having obtained a first assessment of weight and metabolic status by analysing blood exams [11,12,13,14,28], it has become apparent that each weight class shows different characteristics. Since the outliers of each weight cluster form the gateway from one weight class to the next, the outliers of those characteristics can be analysed for additional patterns to be identified. The differences in those characteristics and the related distributions can also be examined and interpreted.

3.2.2. The Why

If patterns can be recognised in the distribution of the dietary variables, then recommendations and dietary strategies can be automated.

3.2.3. The How

Extreme values (otherwise known as “outliers”) are data points that are sparsely distributed in the tails of a univariate or a multivariate distribution. The understanding and management of extreme values is a key part of data management. Through their exploitation, dietary intake can be fine-tuned based on personalised and specific parameters.
In the following sections, we outline our methodology to tackle the issues defined here using EVA The implementation of the methodology will illustrate the capacity of the proposed system and the utility of the system outcome.

4. Methodology

4.1. Technical Overview

The independent variable examined using the EVA methodology is the BMI, and the corresponding dependent variable is the dietary intake. The analysis was performed for the different weight classes defined by the BMI ranges shown in Table 1.
The POT method was utilised, with which the BMI observations were sorted in ascending order. Three scenarios wereexamined per weight class. For the first scenario, the examined dietary variable exceeded the threshold that has been set. For the second scenario, the dietary variable fell below the threshold but lay above zero, and zero indicates that no consumption of the specific variable exists. Finally, for the third scenario, the dietary intake was equal to 0.

Dietary EVA Algorithm

In Figure 3, the designed algorithm is exhibited. As a first step, the BMI class to be analysed was chosen, and the dietary variable to be examined is set. A descriptive statistical analysis allows a first peek in the data examined as per the dietary variable and the weight class. The threshold was set for the peaks over it to be determined. The extreme values were plotted, and the corresponding L-moments were calculated. The results were then inspected, and the threshold was evaluated. If the results are not accepted, the process is repeated and the threshold is reset. Finally, the return values (R.V.) are extracted and plotted, and predictions based on trend can be proposed. For the implementation of the proposed EVA methodology, corresponding available Python libraries [29] were used, with the necessary modifications and adjustments.

4.2. EVA-Based Decision-Making Algorithm

In order to produce actionable insights, decision-making algorithms assimilate task-related information from the environment. In the healthcare domain, a decision-making algorithm can use a patient’s vital markers and return a diagnosis. In [30], a decision-making algorithm is implemented for the suggestion of alternative foods, using a hybrid clustering food recommendation method based on chronic disease clustering. According to Kochenderfer et al. [31], agents are entities that can act based on observations from the environment. When implemented completely through software, those agents are non-physical and interact with the environment based on actions suggested by decision-making algorithms.
In Figure 4, a decision-making algorithm is proposed which uses EVA. Firstly, the dietary EVA algorithm is applied as previously described and output plots, and return values are produced. Following that, three different clusters are extracted based on three different scenarios, as can be seen in Figure 4, which are related to the threshold that defines the peaks in the examined data. Scenario (e) refers to the observations that are above the threshold, and scenario (o) refers to those below the threshold and greater than zero. Finally, scenario (z) refers to the cluster where the consumption of the examined dietary variable is equal to zero. Then, for the different scenarios examined, the correlations among the blood variables were analysed to identify how the body may react in each dietary context. The correlations were then filtered, setting a (−,+) threshold. For example, the threshold may be set according to whether correlation is below (−) or above (+) 55 percent. The filtered outputs for the different scenarios were then compared, and if the observed correlations for scenario (e’) increase compared to scenario (o’), more analysis is extracted related to unique demographic characteristics, weight differences and dietary consumption totals per scenario. If Total (e’) is greater than Total (o’), the Pearson correlation coefficient (PCC) between the dietary variable and blood exams is extracted for both scenarios. The difference is calculated to determine if the mean relation is negative or positive. The more prominent blood exams related to the mean are filtered.
If the observed correlations are equal, or if (e’) is less than (o’), then only the dietary consumption per scenario is examined. To summarise the process, decision-making algorithms can offer predictions based on weight trend and pinpoint a possible consumption level of the dietary variable, based on the EVA algorithm. Moreover, the progressive impact on the health state of an individual is outlined as determined by the blood exams. By outlining the demographic characteristics per scenario, an added layer of explainability is constructed. The patient/user can recognise and compare how a change in dietary behaviour can benefit his/her life. For example, if the normal consumption of a dietary intake leads to a better health state as indicated by better balanced blood metrics, then the goal of a dietary intervention is better-defined and explained.

4.3. Business Issue and Systemisation

A system is a series of explicit processes and operations that can be repeated. Systemisation is the process of creating a unique system by combining different operational activities and actions. Via systemisation, each process is outlined, examined and optimised.
In Figure 5, the EVA decision-making process is systematised. Moreover, we utilised the what, why and how of our adapted-for-machine-learning golden circle approach, which we analysed in Section 3.2. As per the “what”, the intelligent system returns a trend analysis and cluster characteristics based on EVA. The process is automated, and the system returns actionable insights. As per the “why”, the systemisation of health-related enquiries facilitates interventions to the patient’s journey. EVA can add precision to the decision making. As per the “how”, user input is received and analysed in the form of dietary intake. Via comparative analysis, a series of returns retrieved from EVA offer useful insights for a better dietary strategy and an overview of the relation of diet with a generic health state. Explainability of the process is a system option, where the user can view how the system works and the related procedure on which the decision–making algorithm is based. As a first step, the patient/user will input his/her dietary intake. The user can use the weight class predictor [5] to estimate his/her weight class, which will have to be validated or correctly manually inserted, to move on to the succeeding analytical procedure based on EVA. From there, the system return is shown to the user in the form of a report, where actionable insights can drive user engagement.

5. Implementation

5.1. Overview

The examined diet-related data reflect nutrients obtained from foods, beverages and tap or bottled water. Nutrients obtained from other sources, such as supplements or medications, are not included. The data collection was conducted in the U.S.A. via two 24 h dietary recall interviews (see Section 1.1). All parameters and criteria were determined by the National Health and Nutrition Examination Survey, which operates under the Centers for Disease Control and Prevention (CDC) [32]. A complete list of analysed dietary intake can be seen in Table 2. A complete list of the examined blood variables, alongside their aliases used in this paper and their respective measurement units, can be found in Table A1 in Appendix A. In this section, we present a precise descriptive analysis of the data used. The results of the implemented EVA pipeline are analysed in Figure 3, and the outputs of the EVA-based decision-making algorithm were extracted. The following dietary variables are analysed in this paper as an example of the proposed methodology:
  • Vitamin C for the overweight category.
  • Alcohol for the obese category.

5.2. Descriptive Analytics

In Figure 6, selected metrics are shown of the analysed data. In this section, the generic and descriptive data analysis is detailed. The results of the EVA algorithm are reported and discussed. Finally, a proposed user report is examined, as produced by the systemisation algorithm (Figure 5). The dataset is separated based on weight class, which is defined by the ranges of the BMI (Table 1). The ”obese”, “overweight”, “normal” and “underweight” categories are composed of about 23,000, 21,000, 20,000 and 2100 data-points. Moreover, our dataset consists of equally distributed females and males. The data were also analysed by age, educational level, whether the interviewee is pregnant and/or married and so on. Those data were used either for training the EVA algorithm or for categorising the patients, with regard to his/her relation to the different clusters that are defined by the data.
In the following section, the data are analysed using the algorithms described in Section 4. Some variables are examined more closely, in order to illustrate in more detail how a system works and how EVA is used as a decision making tool.

5.3. Results

The results of the analysis consist of three parts: (i) the outputs of the EVA methodology, where the peaks over threshold are defined and plotted; (ii) the return value plot and probability density plot, derived by extreme value theory, and the related L-moments that define the distribution of the extremes; and (iii) the correlations among the blood variables for the different scenarios defined by the threshold examined. Finally, a comparison is given between each scenario as per the BMI and the general consumption and the related demographic characteristics.
In the next section, some examples are shown of how the data are analysed and can be utilised by an external user according to the systemisation algorithm in Figure 5.

5.4. System Analysis and Pipeline Outputs

5.4.1. Vitamin C–Overweight Status

In Figure 7, the consumption of vitamin C is analysed for the overweight category using the proposed algorithm. The formula used for defining the threshold (t) and thus getting the peaks from the dataset is the percentage (p) of the maximum of the examined sample ( t = max ( Σ X n ) p ). When applying the algorithm in Figure 3 to the overweight category, percentage p was set to 0.34 and the threshold t was equal to 668 mg. The examined data were sorted in ascending order based on the value of the BMI of each observation. For T = 1.6 , where T is BMI, the extreme consumption (return value) of the examined nutrient can increase to 1017 mg (with a confidence interval between 1010 and 1047), once every T with a probability of 1 / T and vice versa. When comparing the correlation between blood variables (Figure 8 for each scenario, following the decision-making algorithm (Figure 4), an increase in correlation in the extreme scenario (e’) as compared to the normal scenario (i.e., in normal consumption of dietary variable for the examined weight class) can be seen.
In Figure 9, the related demographics and the key findings are shown, which can be employed as decision-making benchmarks. More precisely, these are the related demographics per scenario, the most prominent correlations between the blood variables and the dietary variable and the average dietary consumption per scenario. The statistics and demographics of the normal consumption for the normal weight category are also presented and can be used as a benchmark that an intelligent system can utilise to offer recommendations and suggestions related to better weight and health management. Based on the decision-making algorithm based on EVA, where PCC for scenario (e’) is compared with PCC for scenario (o’), the more prominent blood exam correlations are the following: aspartate aminotransferase, globulin, glucose, gamma glutamyl transferase, iron, phosphorus and triglycerides. The more immediate relation is with the following organs where a multiplier is added, depending on how many blood variables are related to it: heart (2×), liver (6×), kidneys (3×), pancreas, teeth, bones, parathyroid and intestines. In Figure 10, a semantic map is shown of the relationship between the blood variables and affected organs.
As per Figure 9, the impact of extreme consumption to BMI is too small. More precisely, when in the normal range of consumption, the BMI is greater than when in the extreme range and equal to 0.074. There is a generally positive relation between blood exams and the examined dietary variable: when the dietary intake increases, the value of the blood variables mostly increase and that increase is greater when consumption is extreme. The extreme average consumption is greater than the normal average consumption by 795 mg. The related demographics per scenario show that the average age for scenario (e’) is 37 years, and the average education level was lower than that of scenario (o’) but greater than that of scenario (z’). The average age of scenario (o’) was 46.6, and it had the highest percentage of being married or in a relationship. For the normal weight category where consumption of the examined dietary intake is also normal, the average age is 35. Average consumption of the dietary variable was equal to 86 mg.

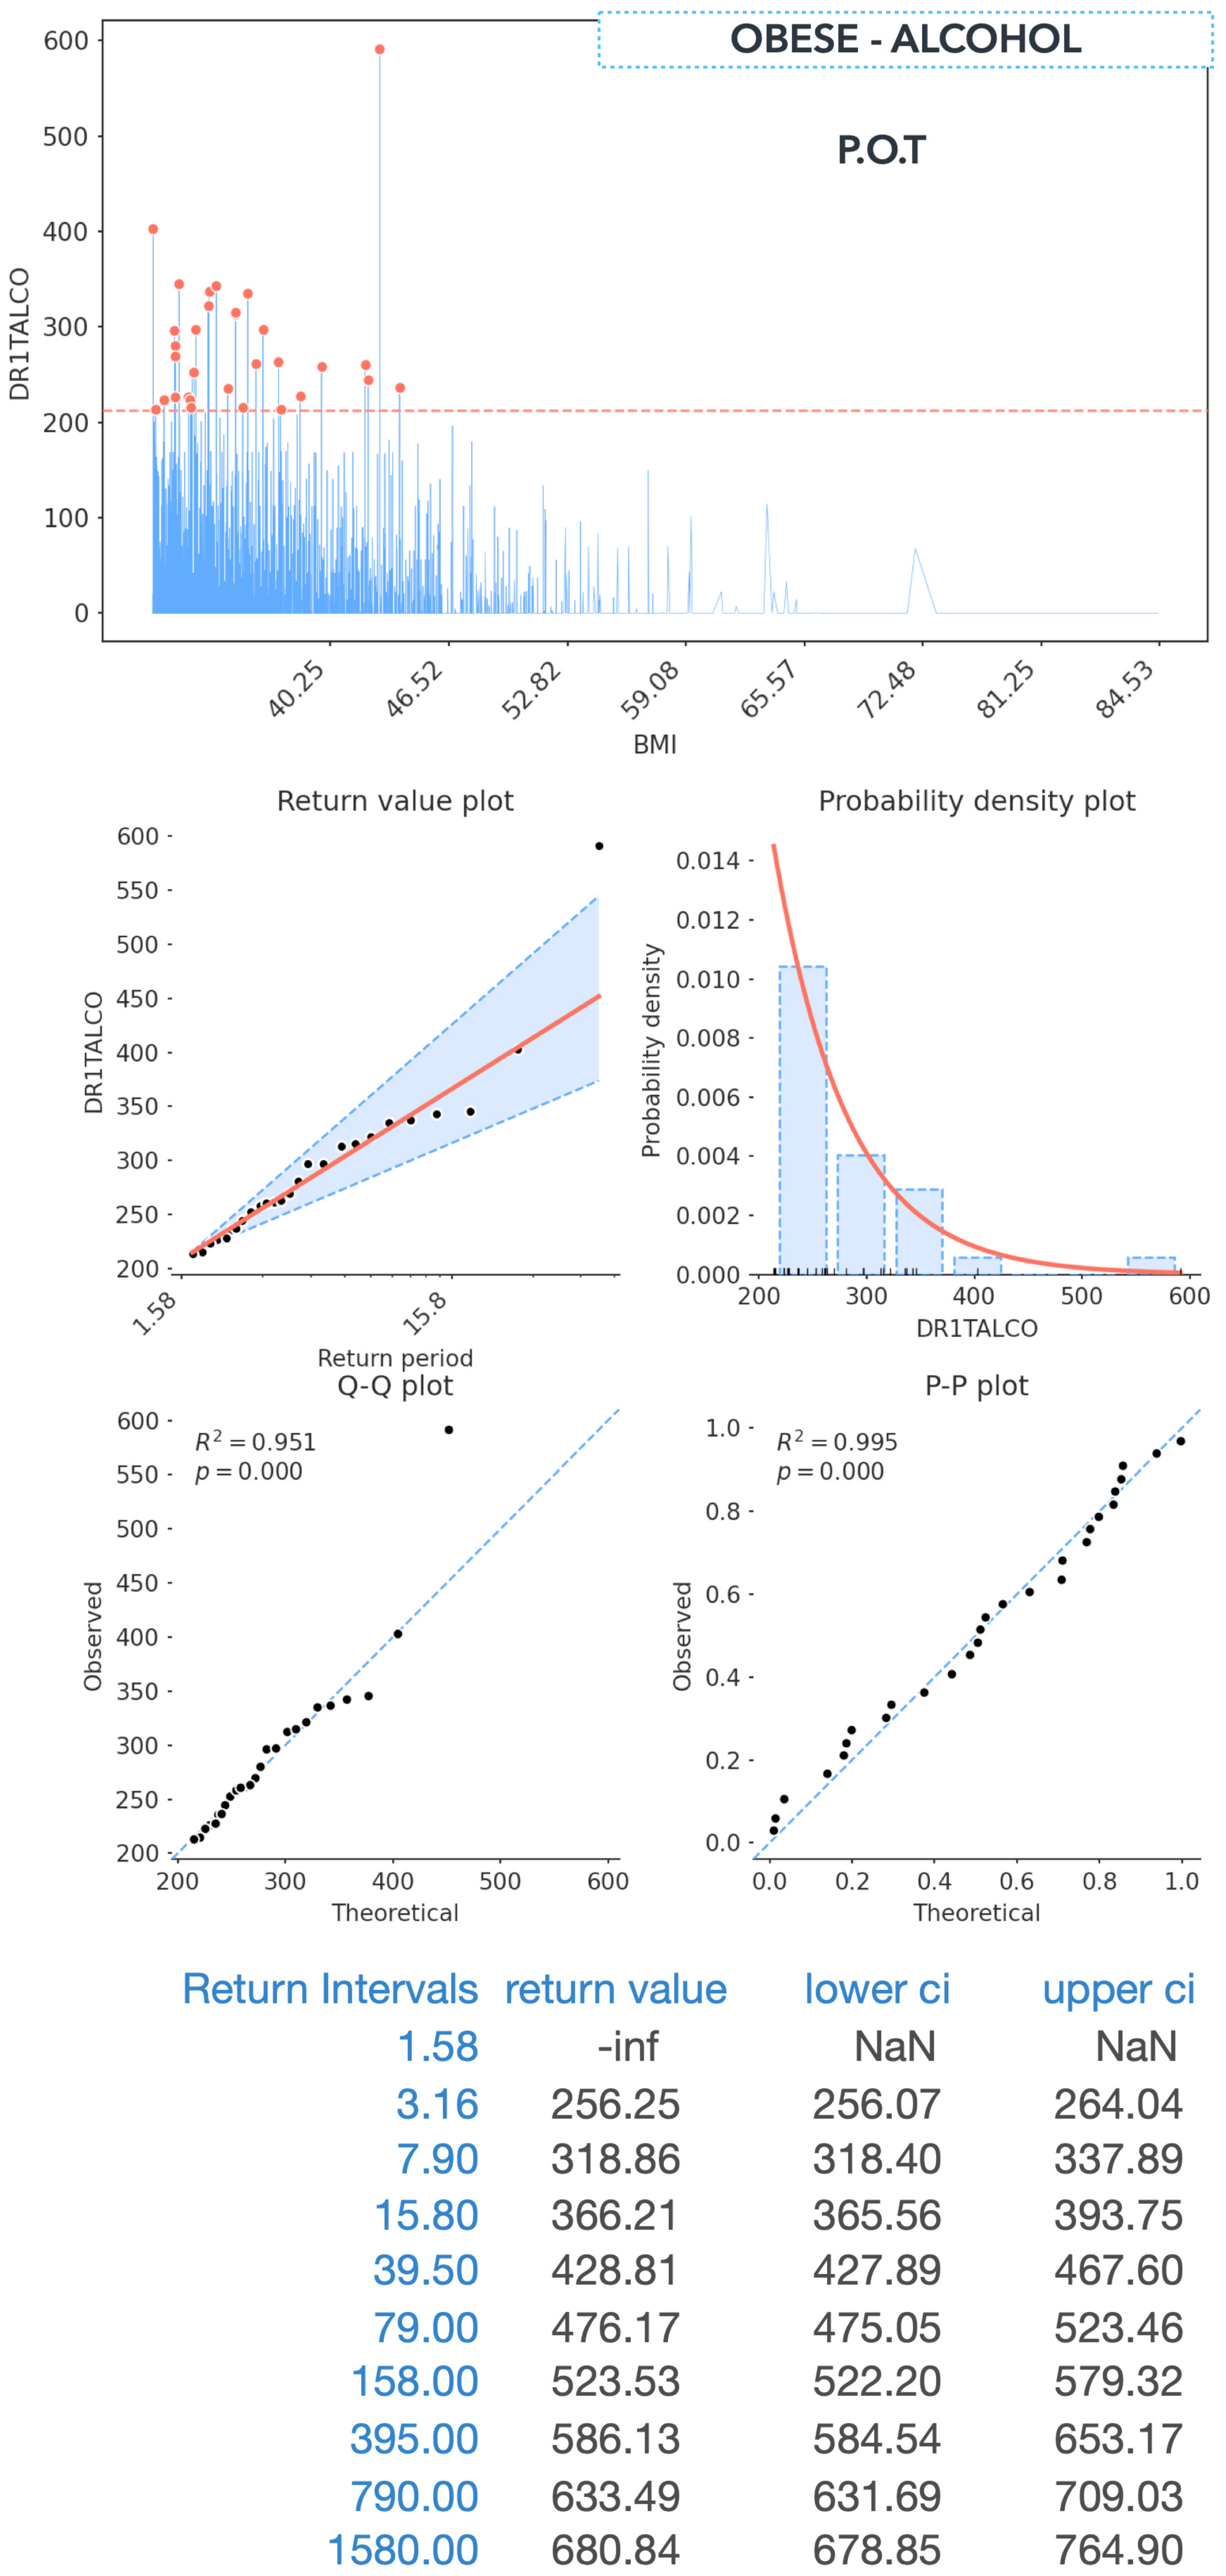
5.4.2. Alcohol–Obese Status

In Figure 11, the consumption of alcohol is analysed for the obese category, using the proposed algorithm. The formula used for defining the threshold (t), and thus, getting the peaks from the dataset, is the percentage (p) of the maximum of the examined sample ( t = max ( Σ X n ) p ). Following the algorithm shown in Figure 3, for the obese category, p is set to 0.36. The data examined are sorted in ascending order based on the value of the BMI of each observation. For T = 15.8 , where T is BMI, the extreme consumption (return value) of the examined nutrient can reach 366.21 gm (with a confidence interval being between 365 and 393), once every T with a probability of 1 / T and vice versa. When comparing the correlations among blood variables (Figure 12) for each scenario, following the decision-making algorithm (Figure 4), an increase can be seen as a correlation in the extreme scenario (e’) as compared to the normal scenario (normal consumption of dietary variable for examined weight class).
In Figure 13, the related demographics and the key findings are shown, which can be employed as decision-making benchmarks. More precisely, these are the related demographics per scenario, the most prominent correlated blood variables, the dietary variable and the average dietary consumption per scenario. The statistics and demographics of the normal consumption for the normal weight category are also presented and are used as benchmarks that an intelligent system can utilise to offer recommendations and suggestions related to better weight and health management.
According to the decision-making algorithm based on EVA, where PCC for scenario (e’) is compared with PCC for scenario (o’), the more prominent blood exam correlations are the following: bicarbonate, chloride, creatinine, gamma glutamyl transferase, iron, bilirubin and uric acid. The more immediate relation is with the following organs where a multiplier is added depending on how many blood variables are related to it: muscles (2×), lungs, kidneys (5×), heart (2×), liver (3×), red blood cells, pancreas, intestines and vascular endothelium.
As per Figure 13, the impact of extreme consumption on BMI is negative, meaning that when consumption is normal, the BMI is greater. More precisely, when in the normal range of consumption, the BMI is 0.59 greater than when in the extreme range, and when consumption is zero, the BMI is 1.7 greater than when extreme. There is a generally positive relation between blood exams and the examined dietary variable. When the dietary intake increases, the values of the blood variables mostly increase, and that increase is greater when consumption is extreme. The extreme average consumption is greater than the normal average consumption by 240.62 gm.
The related demographics per scenario show that the average age for scenario (e’) is 37 years, and it has a significantly lower average education level than scenario (o’) and scenario (z’). The average age of scenario (o’) is 39, and it has a lower percentage of being married or in a relationship. For the normal weight category where consumption of the examined dietary intake is also normal, the average age is 45 and the average consumption of the dietary variable is 38 gm—less than that of the examined weight category.

5.5. Proposed Report and Recommendation Prototype

In this section, the system report is outlined:
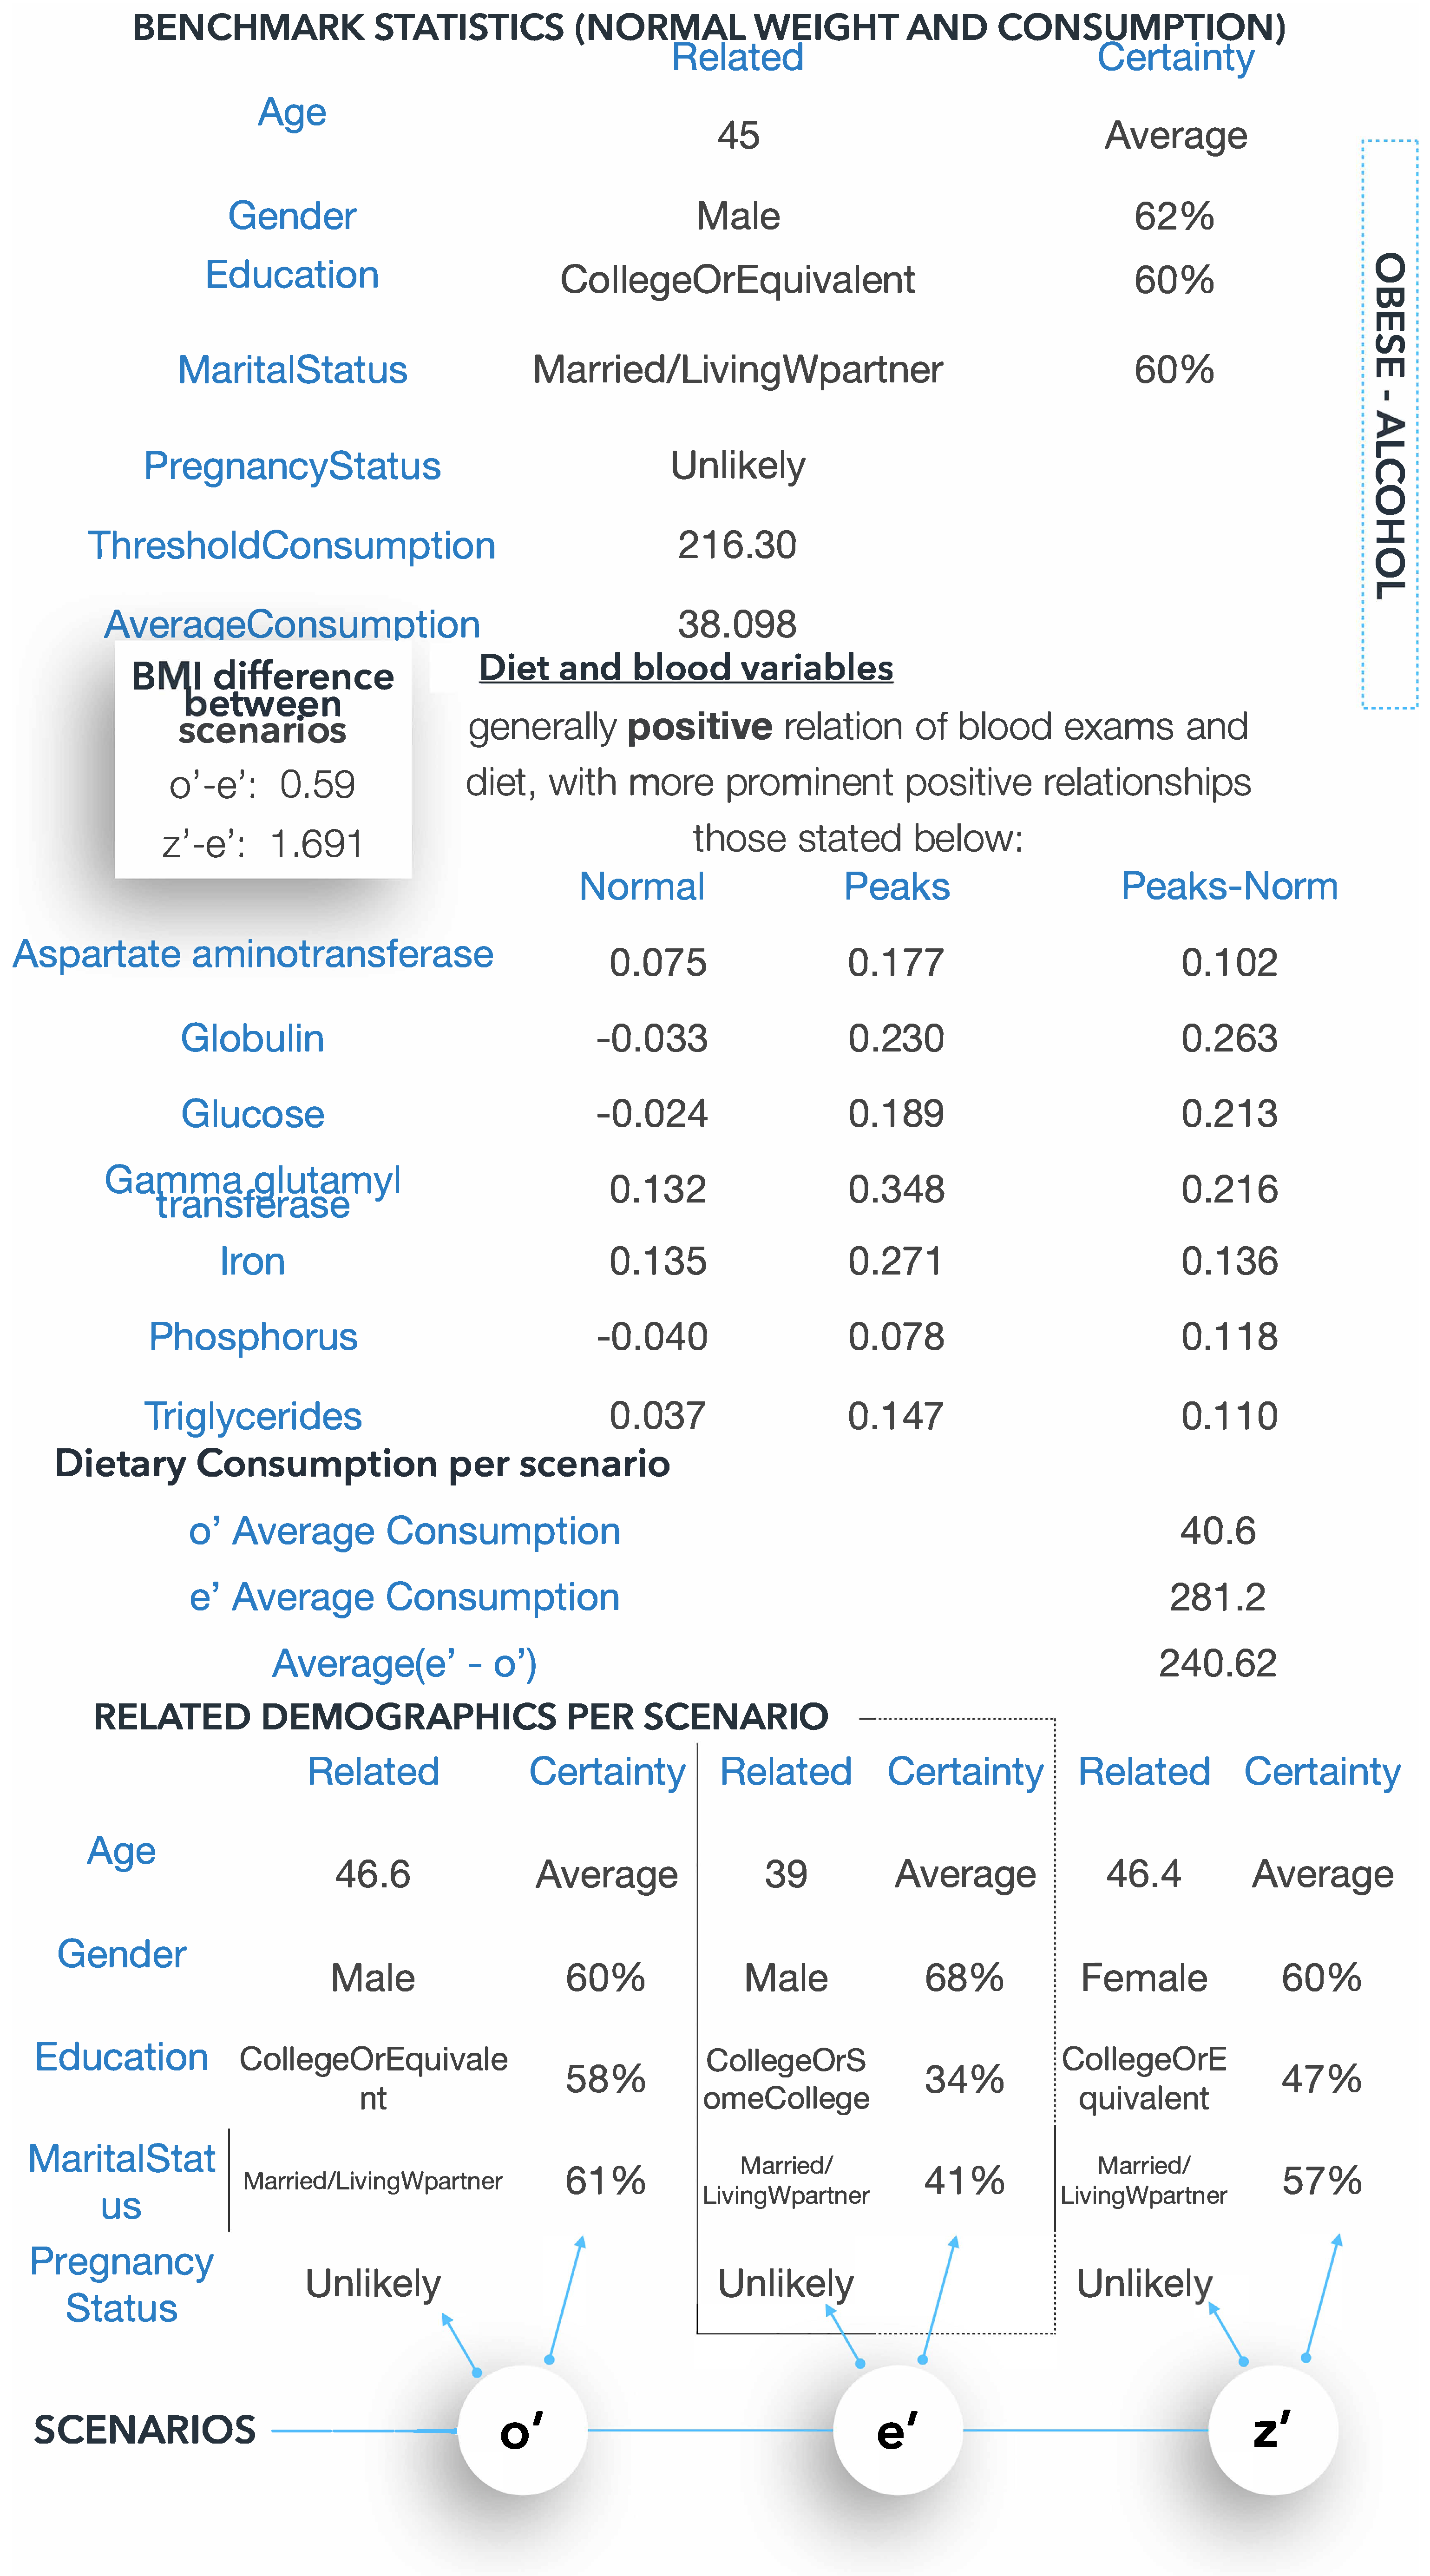
  • There is extreme consumption of the dietary variable (x), as per the EVA pipeline.
    When the dietary intake of (x) is greater than that of (n) for weight class (g), for a BMI increase by (s), dietary intake may increase by (s’) and vice versa.
  • When consumption of dietary variable (x) decreases by (s”), BMI can decrease by (s”’).
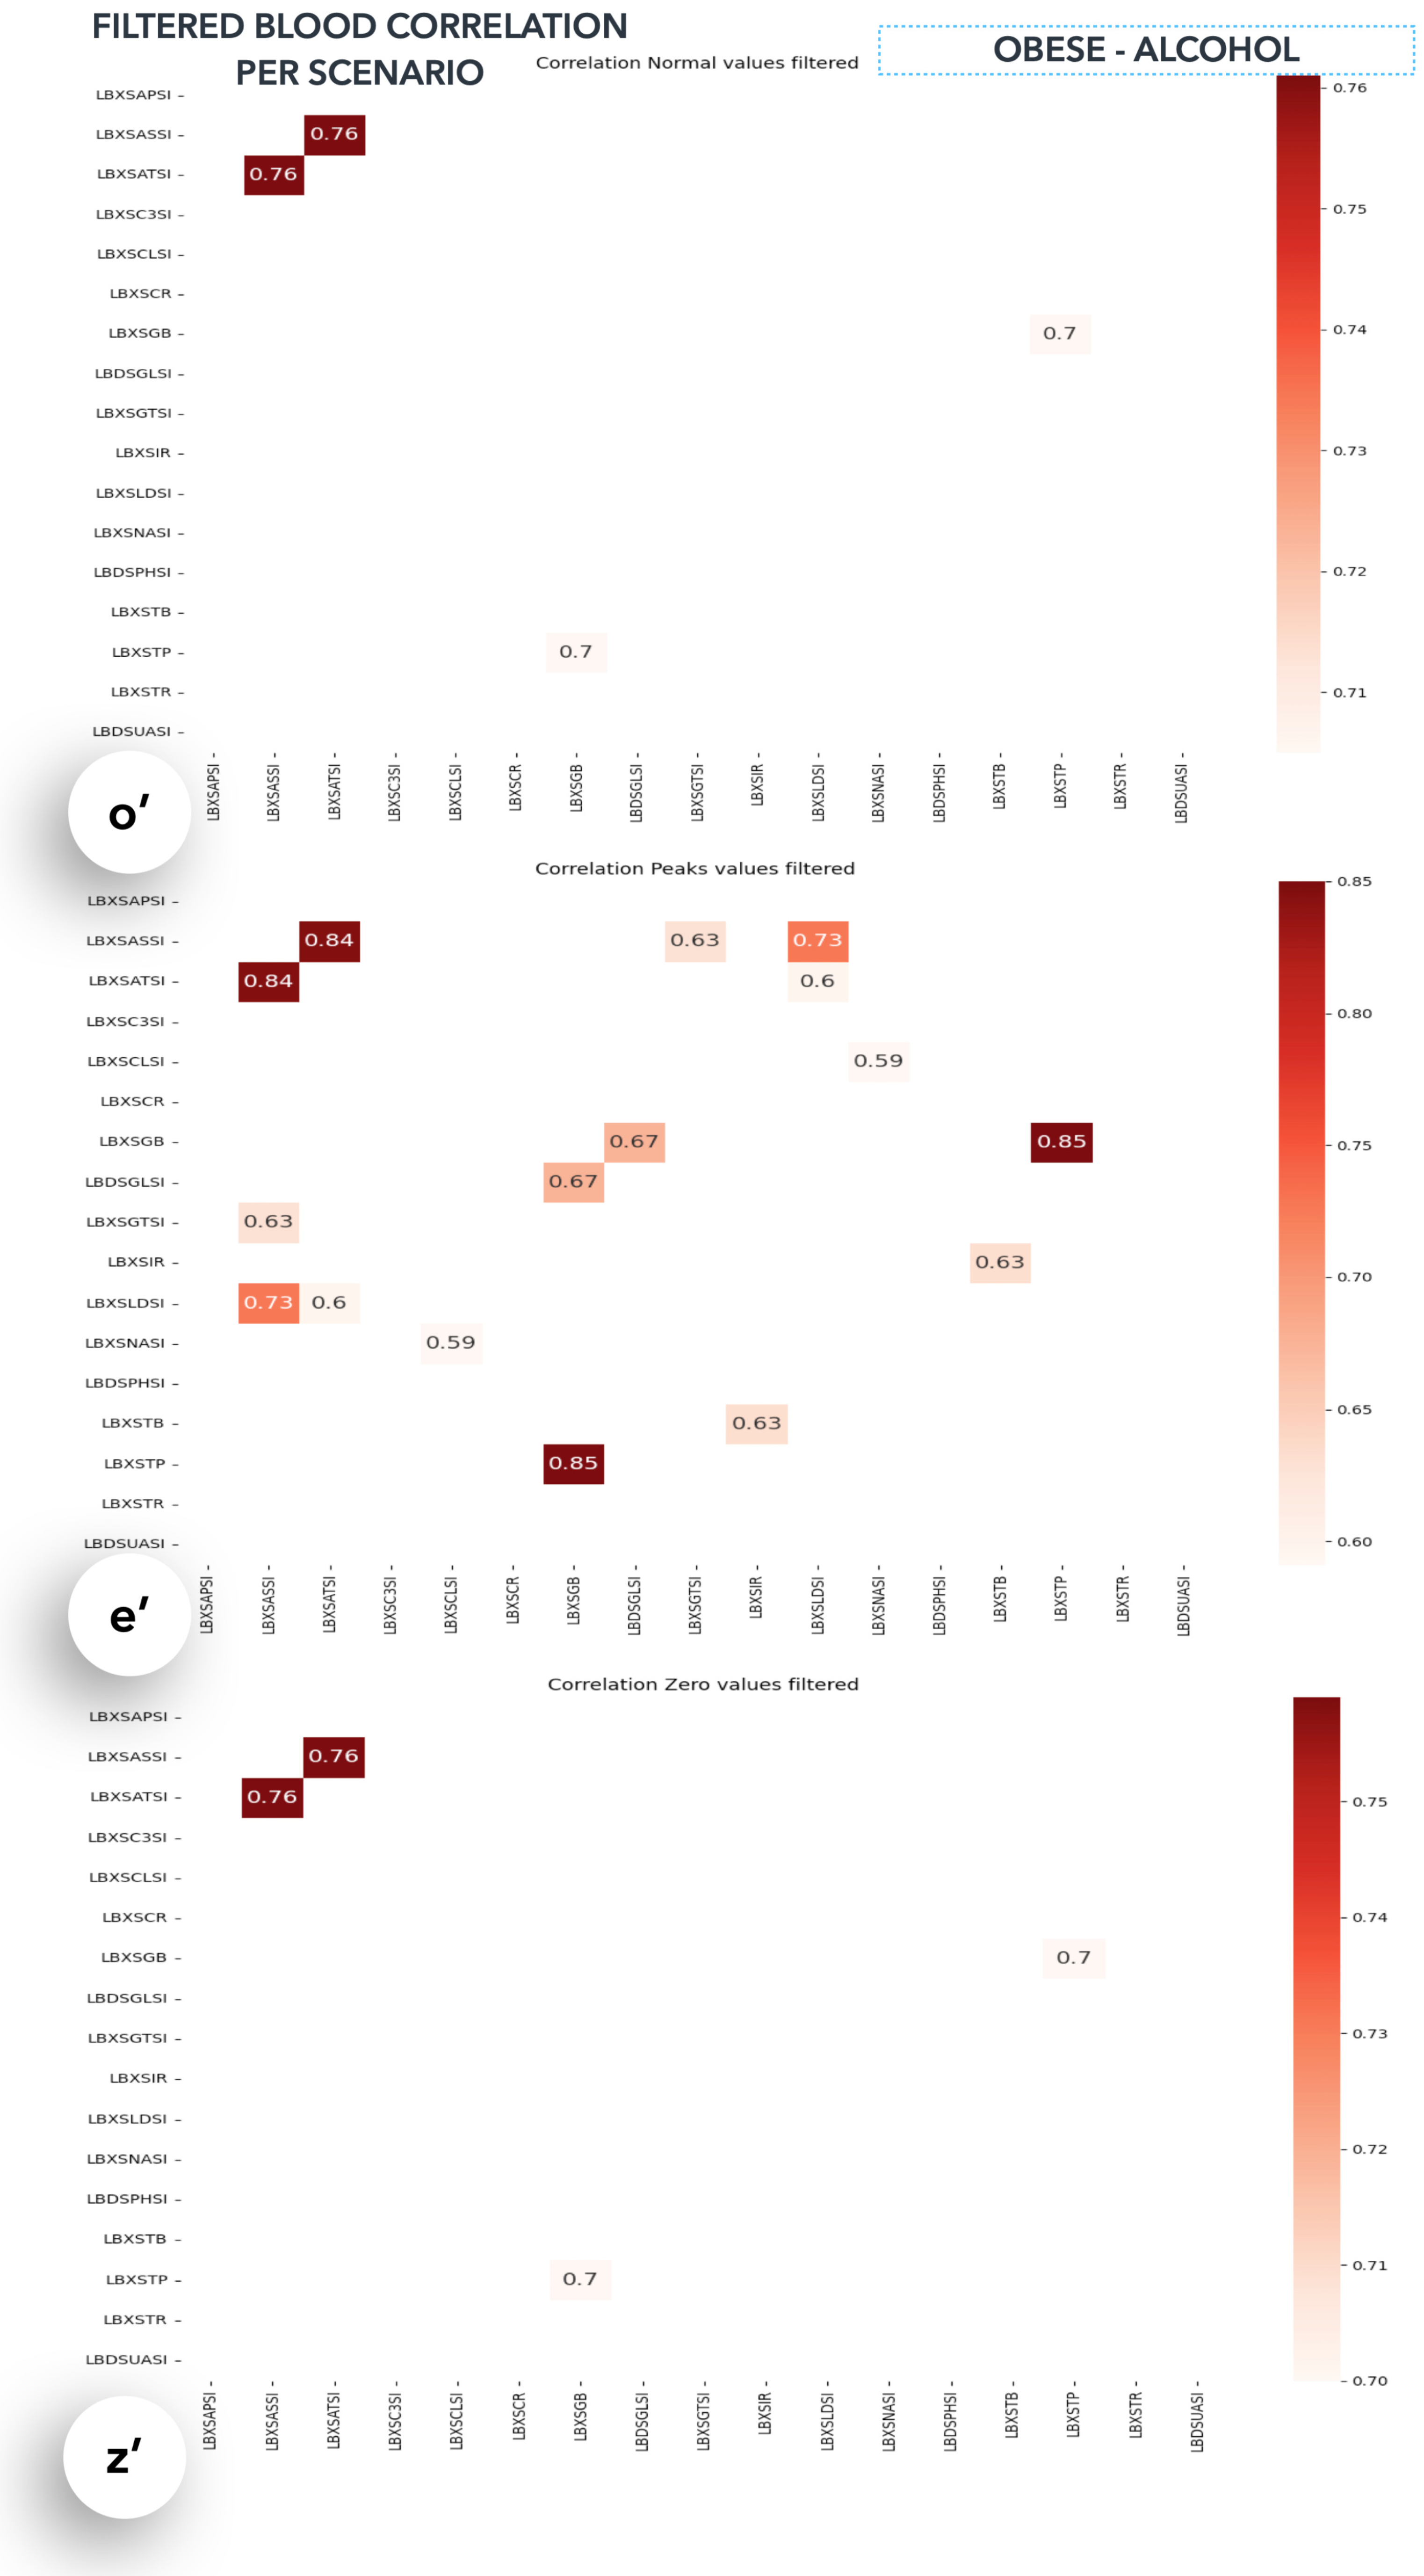
  • When dietary intake of (x) is extreme, the most affected blood variables are (Bn).
  • When dietary intake (x) is extreme, there is a stronger correlation between blood variables B(n) and B(n’).
  • The blood variables, B(n), are mostly associated with organs, O(n).
  • There is generally a positive (negative) relation between blood variable B(n) and dietary variable (x); the more prominent relations are dietary variable (x) and blood exam B-filtered(n).
  • Your related age is AGE your gender is GENDER, your education is EDU, your marital status is STATUS and you are a (non)smoker.

5.6. Discussion of Results and Medical Ontologies

New knowledge can be inferred through formal semantics that underlie an ontology and thus allow the automatic processing and extraction of targeted information. According to Cedeno-Moreno et al. [33] and Studer et al. [34], an ontology can be considered as an explicit specification of a shared conceptualisation. In this section, we extract some still unstructured concepts related to the variables analysed previously that can be presented as an add-on to the proposed report.

5.6.1. Knowledge Extraction—Vitamin C and Overweight Status

According to the pipelines proposed in this paper, some interesting findings are outlined. First of all, the average age of the population that belongs to the extreme (e’) consumption cluster (Figure 9) was lower than the average age of the normal consumption cluster for the overweight category. Secondly, the BMI differences between the two clusters suggest that, for the extreme scenario (e’), the weight was lower than that of the normal (o’) scenario. According to our pipelines, the demographic examined when consumption of vitamin C was extreme showed a desire for weight loss and a change in the dietary lifestyle, since vitamin C is mostly found in fruits and fruits—dietary choices that are considered healthy. It is probably also connected with more dietary changes that may be implemented without the assistance of a healthcare professional. Even though in the data analysed in this paper, the average weight was lower, overconsumption of any dietary variable can lead to unpleasant outcomes.
To sum up the conclusions and new knowledge, we can identify a will for a lifestyle change and at the same time the necessity of professional intervention. That intervention can assist in avoiding unnecessary health burdens and effectively empower an already made decision for a healthier outlook.

5.6.2. Overconsumption of Vitamin C

Even though vitamin C is an essential part of daily nutrition, extreme consumption can have some undesirable effects. Vitamin C is mostly derived from fruits and vegetables, such as oranges, strawberries, chopped red pepper and broccoli. It helps the body absorb iron and supports growth and development. The recommended daily amount is 75 milligrams (mg) a day for women and 90 mg for men. During pregnancy, an amount of 120 mg is suggested. The upper limit for all adults is 2000 mg per day. Large doses of vitamin C might cause: diarrhoea, nausea, vomiting, heartburn, stomach cramps and headaches [35].

5.6.3. Knowledge Extraction—Alcohol and Obese Status

In the second case examined, by the proposed pipelines, some interesting facts were extracted. First of all, the average BMI when consumption was extreme (e’) was lower (Figure 13) than in the normal (o’) consumption cluster. The average age was also lower 36.6 for the e’ scenario and 46.6 for scenario o’. Another interesting finding resides in the fact that scenario e’ concerns males (68% chance) that are more likely to be unmarried. Additionally, zero consumption (z’) was more likely to be found in the female population. By outlining a group based on well-defined population characteristics, targeted interventions and health awareness campaigns [36] for the particular population can have greater impact and be more effective, and thus improve health outcomes.

5.6.4. Alcohol and Obesity

Excessive drinking is defined as consuming four or more drinks during a single occasion for women and five or more drinks for men. Heavy drinking is considered to be when 8 or more drinks are consumed per week for women and 15 or more drinks per week for men. Excessive alcohol consumption can lead to harmful health conditions and result in injuries, violence, poisoning, kidney failure, miscarriage and stillbirth and heart attacks [37].

5.6.5. How Diet Affects Blood Variables

Diet affects all bodily functions, and dietary intake, when not normal, is usually displayed in blood exams. Essential minerals, such as sodium, potassium, calcium and chloride, and the macro-nutrients protein and carbohydrate, are necessary for the central nervous system to function. Muscles require energy from nutrients. Under- or over-nutrition can compromise endocrine and immune system functions. Inflammatory disorders are also symptoms of an imbalanced diet [38].

6. Conclusions and Future Research Endeavours

Intelligent health knowledge systems, when integrated with tracking devices and social media outlets, can revolutionise the creation of medical ontologies and the representation of medical data. The utilisation of such technologies can increase self-knowledge and data sharing [39,40], empower change, improve health and better communicate a health intervention or strategy.
EVA produces numerous tools that can improve the understanding of human biology and behaviour. The medical domain and the human biology are characterised by high complexity. The decoupling of that complexity and its transformation into useful and easy-to-understand information and actionable insights can simplify the development of systems that can add value to users and patients alike. Extreme value analysis can offer insights for dependable variables adapted to conditions that deviate from the normal distribution. With regard to health data, the management of medication dosage or quantity of nutritional intake is of outmost importance. EVA can add precision when proposing an optimisation strategy for a particular demographic. It can be utilised for biomarker discovery, since measurements can offer insights on outcomes of intervention and can be used as predictive and preventive tools.
By defining the usability aspects of EVA, using the machine-learning-adapted golden circle of innovation discussed in Section 3.2, we have outlined a suitable algorithm (Figure 3 and Figure 4) for health data analysis and knowledge retention. Using that algorithm, we can better understand the relations among nutrients, weight and impact of diet on health and also proposed ways for that algorithm to be adapted into an interactive system (Figure 5). The return levels (R.V.), alongside the thresholds set (for POT-based EVA), defined with precision which value should be referred to as the nutritional limit and which values lead to an increase in weight and impact blood values, and subsequently, the body (Figure 10).
In our future research, the product of this study will be adapted to an interactive system that will use the analytical pipelines described, in order to automate interventions and strategies and increase its users’ self knowledge about their health. The impact of dietary habits can be explained using the benchmark demographic statistics shown in the previous section, improving self knowledge and adherence to health interventions.

Author Contributions

Conceptualization, D.P.P. and G.A.T.; Data curation, D.P.P.; Methodology, D.P.P., D.N.S. and G.A.T.; project administration, G.A.T.; Software, D.P.P.; Supervision, G.A.T. and D.N.S.; Validation, D.P.P., G.A.T. and D.N.S.; Visualization, D.P.P.; Writing - original draft, D.P.P.; Writing review and editing, D.P.P. and G.A.T. All authors have read and agreed to the published version of the manuscript.

Funding

This work has been partly supported by the University of Piraeus Research Center.

Institutional Review Board Statement

Not applicable.

Informed Consent Statement

Publicly available data were used, where anonymity was ensured by the provider of the data. “Information from NHANES is made available through an extensive series of publications and articles in scientific and technical journals. For data users and researchers throughout the world, survey data are available on the internet and on easy-to-use CD-ROMs [41]”.

Data Availability Statement

All data are available in the digital library of the Centers for Disease Control and Prevention (CDC), from which the National Health and Nutrition Examination Survey (NHANES) was utilised [32] for the purposes of this research.

Acknowledgments

Theoretical/medical support and technical/medical advice as per the validity of our hypothesis was provided on 30 October 2022 by the medical doctors of Dermacen S.A https://www.dermatologikokentro.gr (accessed on 30 October 2022). For the implementation of the project and the analysis of the data, the scikit-learn python libraries were used [42].

Conflicts of Interest

The authors declare no conflict of interest.

Abbreviations

The following abbreviations are used in this manuscript:
BMIBody mass index
EVAExtreme value analysis
EVTExtreme value theory
POTPeaks over threshold
A.M.S.Annual maxima series
P.D.F.Probability density plot
R.V.Return value-level
FFQFood frequency questionnaires
DALYsDisability-adjusted life years
F.B.D.G.Food-based dietary guidelines
Y.L.L.Years of life lost from mortality
Y.L.D.Years lost due to disability
CDCCenter for Disease Control and Prevention
NHANESNational Health and Nutrition Examination Survey
WHOWorld Health Organisation
PCCPearson correlation coefficient

Appendix A

Table A1. Standard Biochemistry Profile.
AliasName (Measurement)
LBXSAPSIAlkaline phosphatase (IU/L)
LBXSASSIAspartate aminotransferase AST (IU/L)
LBXSATSIAlanine aminotransferase ALT (IU/L)
LBXSC3SIBicarbonate (mmol/L)
LBXSCLSIChloride (mmol/L)
LBXSCRCreatinine (mg/dL)
LBXSGBGlobulin (g/dL)
LBDSGLSIGlucose, refrigerated serum (mmol/L)
LBXSGTSIGamma glutamyl transferase (U/L)
LBXSIRIron, refrigerated serum (ug/dL)
LBXSLDSILactate dehydrogenase (U/L)
LBXSNASISodium (mmol/L)
LBDSPHSIPhosphorus (mmol/L)
LBXSTBTotal bilirubin (mg/dL)
LBXSTPTotal protein (g/dL)
LBXSTRTriglycerides, refrigerated (mg/dL)
LBDSUASIUric acid (umol/L)

References

  1. Dao, M.C.; Subar, A.F.; Warthon-Medina, M.; Cade, J.E.; Burrows, T.; Golley, R.K.; Forouhi, N.G.; Pearce, M.; Holmes, B.A. Dietary assessment toolkits: An overview. Public Health Nutr. 2019, 22, 404–418. [Google Scholar] [CrossRef] [PubMed] [Green Version]
  2. Cámara, M.; Giner, R.M.; González-Fandos, E.; López-García, E.; Mañes, J.; Portillo, M.P.; Rafecas, M.; Domínguez, L.; Martínez, J.A. Food-Based Dietary Guidelines around the World: A Comparative Analysis to Update AESAN Scientific Committee Dietary Recommendations. Nutrients 2021, 13, 3131. [Google Scholar] [CrossRef] [PubMed]
  3. Herforth, A.; Arimond, M.; Álvarez-Sánchez, C.; Coates, J.; Christianson, K.; Muehlhoff, E. A global review of food-based dietary guidelines. Adv. Nutr. 2019, 10, 590–605. [Google Scholar] [CrossRef] [PubMed] [Green Version]
  4. Potischman, N.; Freudenheim, J.L. Biomarkers of nutritional exposure and nutritional status: An overview. J. Nutr. 2003, 133, 873S–874S. [Google Scholar] [CrossRef] [PubMed] [Green Version]
  5. Panagoulias, D.P.; Virvou, M.; Tsihrintzis, G.A. Regulation and Validation Challenges in Artificial Intelligence-empowered Healthcare Applications—The Case of Blood-retrieved Biomarkers. In Proceedings of the 14th International Joint Conference on Knowledge-Based Software Engineering (JCKBSE 2022), Larnaca, Cyprus, 22–24 August 2022. [Google Scholar]
  6. Qiao, J.; Lin, X.; Wu, Y.; Huang, X.; Pan, X.; Xu, J.; Wu, J.; Ren, Y.; Shan, P.F. Global burden of non-communicable diseases attributable to dietary risks in 1990–2019. J. Hum. Nutr. Diet. 2022, 35, 202–213. [Google Scholar] [CrossRef] [PubMed]
  7. World Health Organization—Disability-Adjusted Life Years. Available online: https://www.who.int/data/gho/indicator-metadata-registry/imr-details/158 (accessed on 17 November 2022).
  8. Cornelis, M.C.; Hu, F.B. Systems epidemiology: A new direction in nutrition and metabolic disease research. Curr. Nutr. Rep. 2013, 2, 225–235. [Google Scholar] [CrossRef] [Green Version]
  9. Dansinger, M.L.; Gleason, J.A.; Griffith, J.L.; Selker, H.P.; Schaefer, E.J. Comparison of the Atkins, Ornish, Weight Watchers, and Zone diets for weight loss and heart disease risk reduction: A randomized trial. JAMA 2005, 293, 43–53. [Google Scholar] [CrossRef]
  10. Jebb, S.A. Dietary strategies for the prevention of obesity. Proc. Nutr. Soc. 2005, 64, 217–227. [Google Scholar] [CrossRef] [PubMed] [Green Version]
  11. Panagoulias, D.P.; Sotiropoulos, D.N.; Tsihrintzis, G.A. Biomarker-based deep learning for personalized nutrition. In Proceedings of the 2021 IEEE 33rd International Conference on Tools with Artificial Intelligence (ICTAI), Washington, DC, USA, 1–3 November 2021; pp. 306–313. [Google Scholar]
  12. Panagoulias, D.P.; Sotiropoulos, D.N.; Tsihrintzis, G.A. Nutritional biomarkers and machine learning for personalized nutrition applications and health optimization. In Proceedings of the 2021 12th International Conference on Information, Intelligence, Systems & Applications (IISA), Chania Crete, Greece, 12–14 July 2021; pp. 1–6. [Google Scholar]
  13. Panagoulias, D.P.; Sotiropoulos, D.N.; Tsihrintzis, G.A. Nutritional biomarkers and machine learning for personalized nutrition applications and health optimization (extended journal version). Intell. Decis. Technol. 2021, 15, 645–653. [Google Scholar] [CrossRef]
  14. Panagoulias, D.P.; Sotiropoulos, D.N.; Tsihrintzis, G.A. SVM-Based Blood Exam Classification for Predicting Defining Factors in Metabolic Syndrome Diagnosis. Electronics 2022, 11, 857. [Google Scholar] [CrossRef]
  15. Panagoulias, D.P.; Virvou, M.; Tsihrintzis, G.A. A microservices-based iterative development approach for usable, reliable and explainable A.I.-infused medical applications using R.U.P. In Proceedings of the 34th IEEE Conference on Tools with Artificial Intelligence (ICTAI 2022), Conference Proceedings, Virtually, 31 October–2 November 2022. [Google Scholar]
  16. Panagoulias, D.P.; Virvou, M.; Tsihrintzis, G.A. NUHEALTHSOFT: A Nutritional and Health Data Processing Software Tool. In Proceedings of the 2022 16th International Conference on Signal Image Technology and Internet Based Systems (SITIS), Dijon, France, 19–21 October 2022. [Google Scholar]
  17. Panagoulias, D.P.; Sotiropoulos, D.N.; Tsihrintzis, G.A. Extreme value analysis for dietary intake based on weight class. In Proceedings of the 2022 13th International Conference on Information, Intelligence, Systems & Applications (IISA), Corfu, Greece, 18–20 July 2022. [Google Scholar]
  18. Coles, S.; Bawa, J.; Trenner, L.; Dorazio, P. An Introduction to Statistical Modeling of Extreme Values; Springer: Berlin/Heidelberg, Germany, 2001; Volume 208. [Google Scholar]
  19. Xu, S. Proceedings of 2013 World Agricultural Outlook Conference; Springer: Berlin/Heidelberg, Germany, 2014. [Google Scholar]
  20. Thomas, M.; Lemaitre, M.; Wilson, M.L.; Viboud, C.; Yordanov, Y.; Wackernagel, H.; Carrat, F. Applications of extreme value theory in public health. PLoS ONE 2016, 11, e0159312. [Google Scholar] [CrossRef] [PubMed] [Green Version]
  21. Chiu, Y.; Chebana, F.; Abdous, B.; Bélanger, D.; Gosselin, P. Mortality and morbidity peaks modeling: An extreme value theory approach. Stat. Methods Med. Res. 2018, 27, 1498–1512. [Google Scholar] [CrossRef] [PubMed]
  22. Flegal, K.M.; Wei, R.; Ogden, C.L.; Freedman, D.S.; Johnson, C.L.; Curtin, L.R. Characterizing extreme values of body mass index–for-age by using the 2000 Centers for Disease Control and Prevention growth charts. Am. J. Clin. Nutr. 2009, 90, 1314–1320. [Google Scholar] [CrossRef] [PubMed] [Green Version]
  23. Tsihrintzis, G.A.; Nikias, C.L. Fast estimation of the parameters of alpha-stable impulsive interference. IEEE Trans. Signal Process. 1996, 44, 1492–1503. [Google Scholar] [CrossRef]
  24. Arsenault, E.; Wang, Y.; Chapman, M.P. Towards Scalable Risk Analysis for Stochastic Systems Using Extreme Value Theory. arXiv 2022, arXiv:2203.12689. [Google Scholar] [CrossRef]
  25. Szigeti, M.; Ferenci, T.; Kovács, L. The use of block maxima method of extreme value statistics to characterise blood glucose curves. In Proceedings of the 2020 IEEE 15th International Conference of System of Systems Engineering (SoSE), Budapest, Hungary, 2–4 June 2020; pp. 433–438. [Google Scholar]
  26. Huss, R.; Grunkin, M. Artificial Intelligence Applications in Human Pathology; WSPC: UK, London, 2022. [Google Scholar]
  27. Spruijt, J.; Spanjaard, T.; Demouge, K. The Golden Circle of Innovation: What Companies Can Learn from NGOs When It Comes to Innovation. In Modern Marketing for Non-Profit Organizations: International Perspectives; Smyczek, S., Ed.; University of Economics in Katowice Publishing House, Forthcoming: Katowice, Poland, 2013. [Google Scholar]
  28. Panagoulias, D.P.; Sotiropoulos, D.N.; Tsihrintzis, G.A. Towards Personalized Nutrition Applications with Nutritional Biomarkers and Machine Learning. In Advances in Assistive Technologies: Selected Papers in Honour of Professor Nikolaos G. Bourbakis; Tsihrintzis, G.A., Virvou, M., Esposito, A., Jain, L.C., Eds.; Springer: Berlin/Heidelberg, Germany, 2022; pp. 73–122. [Google Scholar]
  29. Pyextremes—Python Library. Available online: https://georgebv.github.io/pyextremes/ (accessed on 28 May 2022).
  30. Baek, J.W.; Kim, J.C.; Chun, J.; Chung, K. Hybrid clustering based health decision-making for improving dietary habits. Technol. Health Care 2019, 27, 459–472. [Google Scholar] [CrossRef] [PubMed] [Green Version]
  31. Kochenderfer, M.J.; Wheeler, T.A.; Wray, K.H. Algorithms for Decision Making; MIT Press: Cambridge, MA, USA, 2022. [Google Scholar]
  32. Johnson, C.L.; Dohrmann, S.M.; Burt, V.L.; Mohadjer, L.K. National Health and Nutrition Examination Survey: Sample Design, 2011–2014; Number 2014; US Department of Health and Human Services, Centers for Disease Control and Prevention: Atlanta, GA, USA, 2014. [Google Scholar]
  33. Cedeno-Moreno, D.; Vargas-Lombardo, M. An ontology-based knowledge methodology in the medical domain in the Latin america: The study case of republic of Panama. Acta Inform. Med. 2018, 26, 98. [Google Scholar] [CrossRef] [PubMed]
  34. Studer, R.; Benjamins, V.R.; Fensel, D. Knowledge engineering: Principles and methods. Data Knowl. Eng. 1998, 25, 161–197. [Google Scholar] [CrossRef] [Green Version]
  35. Mayo Clinic—Nutrition and Healthy Eating. Available online: https://www.mayoclinic.org/healthy-lifestyle/nutrition-and-healthy-eating/expert-answers/vitamin-c/faq-20058030/ (accessed on 17 November 2022).
  36. Hoschar, S.; Albarqouni, L.; Ladwig, K.H. A systematic review of educational interventions aiming to reduce prehospital delay in patients with acute coronary syndrome. Open Heart 2020, 7, e001175. [Google Scholar] [CrossRef] [PubMed] [Green Version]
  37. World Health Organization—Alcohol Use and Your Health. Available online: https://www.cdc.gov/alcohol/fact-sheets/alcohol-use.htm/ (accessed on 17 November 2022).
  38. Libre Texts Medicine—Nutrients Are Essential for Organ Function. Available online: https://tinyurl.com/yxsf45bs/ (accessed on 17 November 2022).
  39. Papacharissi, Z. A Networked Self: Identity, Community, and Culture on Social Network Sites; Routledge: London, UK, 2010. [Google Scholar]
  40. Kent, R. Social media and self-tracking: Representing the ‘health self’. In Self-Tracking; Springer: Berlin/Heidelberg, Germany, 2018; pp. 61–76. [Google Scholar]
  41. Uses of the Data. Available online: https://www.cdc.gov/nchs/nhanes/about_nhanes.htm#data/ (accessed on 17 November 2022).
  42. Pedregosa, F.; Varoquaux, G.; Gramfort, A.; Michel, V.; Thirion, B.; Grisel, O.; Blondel, M.; Prettenhofer, P.; Weiss, R.; Dubourg, V.; et al. Scikit-learn: Machine learning in Python. J. Mach. Learn. Res. 2011, 12, 2825–2830. [Google Scholar]
Figure 1. Developed methodologies and outcomes.
Electronics 12 00204 g001
Figure 2. Patient’s journey.
Electronics 12 00204 g002
Figure 3. Dietary variable analysis and diet intervention algorithm.
Electronics 12 00204 g003
Figure 4. EVA–based decision-making algorithm.
Electronics 12 00204 g004
Figure 5. EVA process systemisation.
Electronics 12 00204 g005
Figure 6. Descriptive analysis of data and selected demographics.
Electronics 12 00204 g006
Figure 7. Overweight category–EVA of vitamin C (DR1TVC).
Electronics 12 00204 g007
Figure 8. Overweight category–vitamin C. Filtered blood variable correlation as per EVA pipeline.
Electronics 12 00204 g008
Figure 9. Vitamin C, related demographics and key findings.
Electronics 12 00204 g009
Figure 10. Blood, diet and organ functionality (screenshot from NUHealthSoft [16]).
Electronics 12 00204 g010
Figure 11. Obese category–EVA of alcohol (DR1TALCO).
Electronics 12 00204 g011
Figure 12. Obese category–alcohol. Filtered blood variable correlation as per EVA pipeline.
Electronics 12 00204 g012
Figure 13. Alcohol, related demographics and key–findings.
Electronics 12 00204 g013
Table 1. BMI classification.
RangeCategory
less than 18underweight
between 18 and 25normal
between 25 and 30overweight
above 30obese
Table 2. Dietary variables examined—system input data.
NameName
Alpha-carotene (mcg)Alcohol (gm)
Vitamin E (mg)vitamin B12 (mg)
Beta-carotene (mcg)Caffeine (mg)
Calcium (mg)Carbohydrate (gm
Total choline (mg)Cholesterol (mg)
Copper (mg)Beta-cryptoxanthin (mcg)
Folic acid (mcg)Folate equivalents (mcg)
Food folate (mcg)Dietary fiber (gm)
Total folate (mcg)Iron (mg)
Energy (kcal)Lycopene (mcg)
Lutein + zeaxanthin (mcg)MFA (16–22):1 (gm)
Magnesium (mg)fatty acids (gm)
Moisture (gm)Niacin (mg)
Phosphorus (mg)Potassium (mg)
Protein (gm)Retinol (mcg)
Selenium (mcg)fatty acids (gm)
Sodium (mg)Total sugars (gm)
Total fat (gm)Theobromine (mg)
Vitamin A (mcg)Vitamin B1 (mg)
Vitamin B12 (mcg)Vitamin C (mg)
Vitamin D (D2 + D3) (mcg)Vitamin K (mcg)
Selenium (mcg)Zinc (mg)
Disclaimer/Publisher’s Note: The statements, opinions and data contained in all publications are solely those of the individual author(s) and contributor(s) and not of MDPI and/or the editor(s). MDPI and/or the editor(s) disclaim responsibility for any injury to people or property resulting from any ideas, methods, instructions or products referred to in the content.

