Article

Study on Thermal Runaway Propagation Characteristics of Lithium Iron Phosphate Battery Pack under Different SOCs

1
School of Emergency Management, Jiangsu University, Zhenjiang 212013, China
2
School of the Environment and Safety Engineering, Jiangsu University, Zhenjiang 212013, China
3
School of Materials Engineering, Changshu Institute of Technology, Changshu 215500, China
*
Authors to whom correspondence should be addressed.
Electronics 2023, 12(1), 200; https://doi.org/10.3390/electronics12010200
Submission received: 25 November 2022 / Revised: 27 December 2022 / Accepted: 28 December 2022 / Published: 31 December 2022

Abstract

:
Thermal runaway (TR) of lithium-ion batteries (LIBs) has always been the most important problem for battery development, and the TR characteristics of large LIBs need more research. In this paper, the thermal runaway propagation (TRP) characteristics and TR behavior changes of three lithium iron phosphate (LFP) batteries (numbered 1 to 3) under different states of charge (SOCs) were studied. The main parameters discussed include temperature, temperature rise rate, mass, mass change rate, and TRP flue gas ejection behavior. The experimental results indicate that with the increase in SOC, the TRP behavior of the battery is more obvious. The higher the temperature, more blocked temperature rise rate, mass loss rate, and greater mass loss, the shorter the TRP time that can be observed. The TRP interval of 100% SOC battery 1 to 2 is 71.4% smaller than that of 50% SOC, while the TRP interval of battery 2 to 3 is reduced by 87.2%. In addition, a 100% SOC battery pack exhibits spark ejection, while 50% SOC and 0% SOC battery pack exhibit flue gas generation.

1. Introduction

The issue of global warming is receiving extensive attention from countries around the world, and carbon neutrality plans are also recognized by many countries. China plans to peak carbon emissions by 2030 and achieve carbon neutrality by 2060, and “lucid waters and lush mountains are golden mountains and silver mountains” has always been China’s sustainable development concept. The development of new energy vehicles can effectively reduce the greenhouse gases, toxic gases, and particle emissions produced by fossil fuel combustion [1,2], and contribute to the protection of the global ecological environment. Lithium-ion batteries (LIBs) play the main role of energy supply in the new energy vehicle industry. Lithium-ion batteries have the advantages of high energy density, high power density, long cycle life, stable high and low-temperature performance, low self-conductivity, and no memory effect [3,4,5], and have been widely used in the energy storage system of the main power supply and power station of electric vehicles [6,7].
However, LIBs may undergo thermal runaway (TR) during work or energy storage, and TR can lead to fire and explosion, posing a threat to life and property. The occurrence of TR hinders the development of the LIB industry [8,9], and also greatly weakens consumers’ confidence in accepting new energy vehicles for life and electrochemical energy storage [10]. Battery TR can be caused by thermal abuse, electrical abuse, mechanical abuse, and internal short circuit [11], in which the TR of one subsystem may affect other subsystems, and in extreme cases, it will get out of control [12,13], which will lead to a larger area and greater hazard of fire and explosion. To change the traditional energy supply mode, promote the transformation of China’s energy structure, and promote the development of new energy industry, so as to achieve the goal of energy conservation and emission reduction, and commit to the stable development of the new energy industry, it is particularly important to study battery TR and TRP between battery packs.
The TRP of lithium batteries needs to be characterized by various parameters. Wang et al. [14] studied the TRP characteristics between jelly rolls during the TRP of LIB packs. They found that in the TRP process, about 60% of the total energy is used for self-heating and about 31% is emitted through the exhaust, and the time required for runaway propagation in the battery pack was affected by the heating power. Wang et al. [15] studied the TRP after fast charging of NCM811/C LIB modules, showing that increasing the battery spacing and trigger temperature would reduce the risk of TRP of battery modules, and the TRP speed gradually increased with the propagation process. Xu et al. [16] found that the parallel-series connection type of battery modules did not seem to have a significant effect on TR propagation behavior, and Zhou et al. [17] came up with a passive strategy based on thermal insulation to suppress TR propagation, indicating that parallel cells burn and propagate more violently than unconnected batteries. Lai et al. [18] studied and compared the TRP behavior of LIB modules in three typical trigger modes (heating, nail penetration, and overcharging). It was found that in the early stage of TRP, the TRP time and trigger temperature differences under different trigger modes were obvious, but these differences were gradually eliminated in the late stage of TRP, and the energy flow distribution showed that more than 60% of TR energy was used for battery self-heating, and more than 26% of the energy was released when the battery material exploded. Tao et al. [19] studied the effects of different vertical distances and states of charge (SOC) on the TRP of batteries. It was found that the critical surface temperature and the maximum surface temperature were independent of vertical distance, the total mass loss of lithium batteries increased with the increase in SOC, and the average opening time and ejection time of safety valves increased with the increase in distance. Wang et al. [20] studied the TR behavior of single cells and modules through overheating experiments, and the results showed that the maximum self-heating power of the cell also increased with the increase in SOC, and TR propagated in a single-layer module, but not in different layer modules. In addition, compared with the single cell, the TR of the battery module is more intense in the propagation process, and TR is most likely to fail during the propagation process of the second and third cells. Liu et al. [21] studied the TRP of linear array type 18,650 LIB modules under low voltage conditions, different temperatures, and electrical connection methods, indicating that the TRP tendency of open-circuit battery arrays was much lower, and only occurred at high ambient temperature and ambient pressure, and the rate of TRP decreases as the ambient pressure decreased with the reduction of parallel connected battery modules. Tang et al. [22] found that the conduction heat exchange increased with the increase in the total area of the solder joint. Jin et al. [23] found that heating power had little effect on the propagation of TR in battery modules, but the accumulation rate of heat flux energy (equivalent flux power) played a crucial role. Huang et al. [24] found that TR under the three heating methods all showed white smoke emission behavior, and TR had the longest smoke emission volume, ejection speed, and ejection time when the surface heating was large. Wang et al. [25] proposed an instrument that could be used to analyze TR behavior at different pressures. It can be concluded that as the ambient pressure decreased, the heat outgassing trigger time became longer and the surface maximum temperature decreased. Dhananjay Mishra et al. [26,27] studied the changes in TRP behavior of supersonic turbulent hot gas diffusion in linear thermo-fluid simulation, and also studied the influence of various geometric parameters of the battery pack on the diffusion of exhaust gas, and the results showed that the intercellular space, overhead space, and the position of the stomata on the cell body had a significant effect on the nature of TRP to neighboring cells. Fang et al. [28] studied the effects of the SOC (50%, 80%, 100%) and spacing (0, 4, 6, 8 mm) on the vertical propagation of two 18650 cells, and the results showed that TRP only occurred when organic carbon was greater than 50%. Li et al. [29] studied the TRP behavior under different side plate design schemes, showing that the side plate delayed the initial TR trigger time, significantly affected the energy flow distribution, and increased the average propagation time interval. Weng et.al [8,30] studied the mitigation effects on thermal runaway propagation of structure-enhanced phase change material modules with flame retardant additives, and they also discussed the honeycomb-inspired design, as well as oxygen level and dilution gas on the alleviation effects of battery thermal runaway propagation [31,32]. Li et al. studied the internal temperature and heat transfer of the battery pack by changing the position of the faulty battery and establishing the relationship between the battery spacing and the environmental cooling characteristics, and the results showed that the thermal runaway battery can disperse its heat, and the change of ambient pressure produces a greater temperature drop under forced air cooling conditions than under natural ventilation conditions [33,34]. These studies give many new references for improving the fire safety and protection of LIB modules.
At present, the thermal runaway of lithium-ion batteries mainly focuses on the research of the thermal runaway propagation behavior of single cells or cylindrical battery packs, and this paper takes large LFP battery packs as the research object, to study the thermal runaway propagation phenomenon between high-capacity lithium battery packs. In order to further study the changes in the TRP behavior of LIBs, TR propagation experiments were carried out on LIB modules of different SOCs, and the changes of temperature, mass, and external jet behavior in the TRP process were analyzed in detail, and the total heat absorption and heat contribution of the battery were analyzed. It is expected to provide some valuable references for the propagation of LIB modules.

2. Experiment

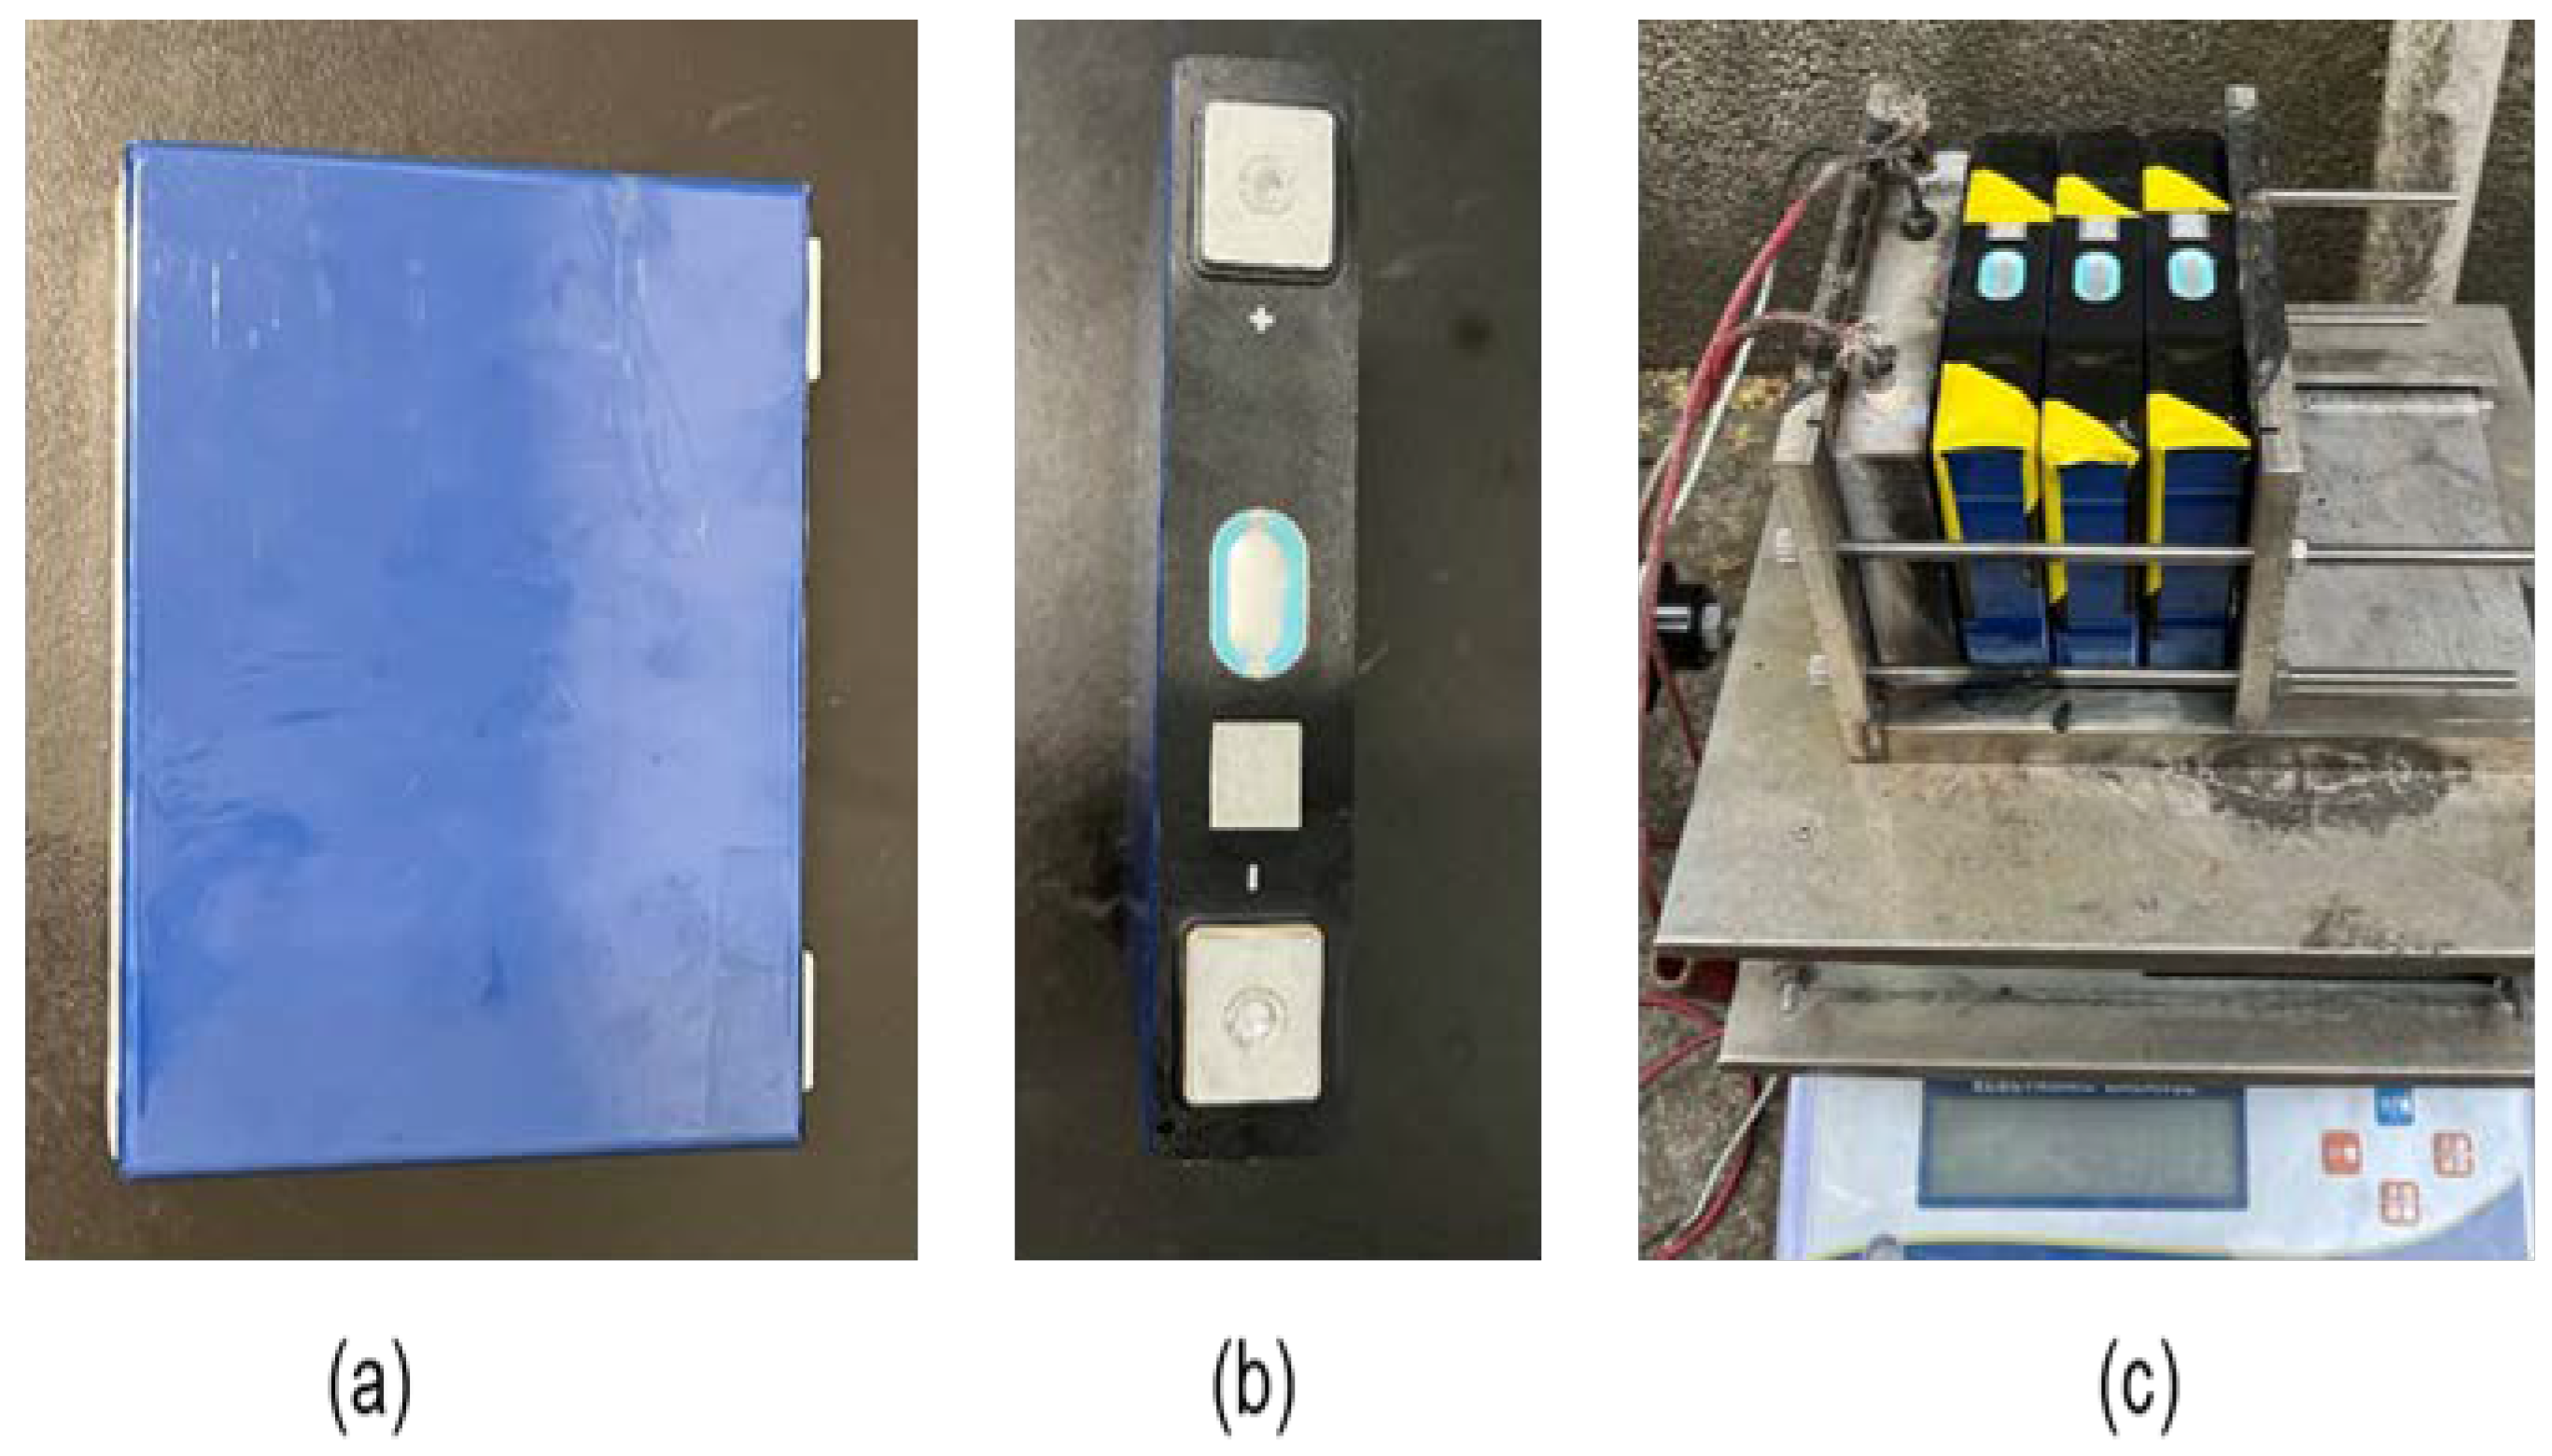
2.1. Battery Information

The Lithium iron phosphate (LFP) battery used for the research object is a 42 Ah prismatic battery with LiIFeIIPO4 cathode and graphite anode, produced by AVIC Lithium, as shown in Figure 1a,b. The battery parameters are listed in Table 1. Prior to the experiments, the battery is charged and discharged to the required SOC. The battery cycler is NEWARE CT-4004-5V60A-NFA. We used the instrument in advance to fully discharge the battery, and then charge it to the desired SOC, to be achieved with a SOC of 100% SOC, 50% SOC, 0% SOC.

2.2. Experimental Device and Battery Modules Description

The experiment was carried out in a special laboratory chamber (2000 mm × 2000 mm × 2500 mm). The bottom of the cabin is made of concrete, the cabin is made of galvanized steel sheeting, and a fume exhaust fan (power 140 W, exhaust air 3000 m3/h) is set on the top. The experiment object of this research comprised 0%, 50%, and 100% SOC cells. The battery module for each SOC consists of three square cells arranged horizontally, as shown in Figure 1c. In addition, the three cells were in direct contact to study the phenomenon of TRP.

2.3. Experiment Setup

The experiment in this paper is a TR experiment for a module consisting of three batteries. The overall experimental setup diagram is shown in Figure 2a, and the cell arrangement diagram and the thermocouple layout diagram are shown in Figure 2b. The batteries used in the experiment are all 42 Ah square lithium-ion batteries as shown in Table 1. K-type thermocouples are fixed to the surface of the battery and above the battery. The heating plate is fixed on the left side of battery 1 and is placed parallel to the battery pack. The maximum heating temperature is set to 300 °C, and the heating plate is used to trigger the thermal runaway of battery 1 in the module. When TR occurs in the battery, the heating plate immediately stops heating. To study the propagation of the battery module TR, we changed the SOC of the battery separately.
The experimental setup consists of LFP LIBs, heat copper plates (trigger TR), electronic scales, lifting platforms, iron plates, and K-type thermocouples. In order to clearly observe the TR behavior of the battery pack, the experiments were recorded with SONY cameras throughout the procedure to study changes in TR behavior. The heat copper plate (the same size as the battery) is used to heat the battery and trigger the TR. The copper plate is next to the battery. The copper plate heating power is 1500 W, and the entire heating device is fixed with a steel plate. The thermocouple is fixed to the top, back, and sides of the battery in the center, as shown in Figure 2.

3. Results and Discussion

3.1. Analyze the Battery Pack’s TR and TRP by Temperature

Figure 3 illustrates the battery temperature distribution and propagation during TRP of 100% SOC, 50% SOC, and 0% SOC. There are a total of 10 curves in Figure 3, which represent the temperature changes on the left, top, rear, and right sides of battery 1, 2, and 3, and are expressed as bat-il, bat-iu, bat-ib, bat-ir, where i is the ith cell in the same battery pack. In addition, 1#, 2#, and 3# are the numbers of battery 1, 2, and 3 respectively (all such numbers are included in the figure in this article). As shown in Figure 3, battery 1 of the 100% SOC battery pack began to rupture when the safety valve ruptured, which occurred when it was heated for1791 seconds with the heating plate heated to 265 °C. TR began to occur after 6 seconds, it can be seen that the three characteristic curves of battery 1 experienced a downward and then rising trend under the influence of the rupture of the safety valve, which is due to the fact that the moment when the safety valve was opened, the battery surface temperature dropped briefly. This is because the safe exhaust takes away a lot of heat, which will cause a decrease in total heat. This phenomenon has been confirmed by many scholars [35]. The ambient temperature was not high when the battery 1 safety valve was broken, so the safety exhaust will affect the curve before the safety valve breaks and TR. After the TR of battery 2 and battery 3, when the safety valve was broken, the left and rear curves of the battery showed a trend of first falling and then rising. The difference is that the temperature curve above the battery had not experienced a clear trend of first falling and then rising; this is because the upper thermocouple was arranged in a position close to the safety valve. When the safety valve was broken, a large number of high-temperature gases were sprayed out, the heat was compensated, and the heat generated by TR was enough to make up for the heat loss of the safe exhaust, so the heat taken away by the high-temperature gas did not significantly affect the change in the temperature of the battery.
From the battery temperature change curve, it can be found that in the TR of the battery pack, the sequence of events is that the safety valve was opened first, causing the temperature to drop, and then entered the TR trigger stage, just like the curve in Figure 3. This phenomenon can be confirmed in many scholars’ experiments [36,37,38]. However, for battery packs with 100% SOC and 50% SOC, unlike battery 1, battery 2, and battery 3 had experienced TR before the safety valve broke. This is because the temperature of battery 1 rose slowly under the constant power heating conditions of the heating plate, the internal reaction was relatively slow, and the TR began to occur after the internal gas broke the safety valve. Under the condition of battery 2 in the TR of battery 1 there was a sharp rise, then the TR critical temperature reached a relatively rapid state, and less gas generation occurred when the TR critical temperature was reached, resulting in TR when the internal gas did not break through the safety valve.
As exhibited in Figure 3, in the battery pack of 100% SOC, the TR interval between battery 1 and battery 2 was 7 s, and the TR interval between battery 2 and battery 3 was 37 s. This is because the heating stage experienced by battery 1 was constant power heating, and the temperature of battery 1 itself was maintained in the critical stage of impending TR before TR, so it provided a lot of heat to battery 2 before TR, so the impact on battery 2 when TR occurred in battery 1 was relatively fast. Under the influence of battery 2 and the ambient temperature, the temperature of battery 3 slowly increased to reach the critical temperature of its TR. On the other hand, the TR interval between battery packs of 50% SOC was significantly higher than that of 100% SOC. The 100% SOC battery 1 to 2 TR interval time was 71.4% less than 50% SOC, while battery 2 to 3 TR interval time was reduced by 87.2%. The reason for this phenomenon can also be explained by the higher SOC battery storing more energy and therefore the internal reaction was more intense. Battery 1 of the 0% SOC battery pack only experienced the stage of the safety valve breakage, and the three batteries of the entire battery pack did not have TR. This indicates that with the reduction of SOC, the intensity of the internal reaction of the battery decreases, and the TR risk of the battery pack decreases.
In order to study the change in TR temperature more clearly, the temperature rise rate change of the thermocouple behind the battery under different SOCs is listed here, from the rupture of the safety valve of battery 1 to the end of TR in battery 3, as shown in Figure 4. As for the temperature rise rate, according to the temperature change rate formula, and the time interval in this study is 1 s; it can be obtained from the temperature of the outer surface of the battery, as expressed in (1).
dT i dt = T i , t + 1 T i , t
where dT i dt is the temperature rise rate of LIB i, T i , t + 1 and T i , t are the temperatures of LIB i at t + 1 and t seconds, respectively.
As shown in Figure 4, the temperature rise rate in the curve was less than 0 because the safety valve rupture or the adjacent safety valve rupture took away a lot of heat, and the heat generated by the battery itself cannot compensate for the heat taken away by the safety valve, resulting in a decrease in temperature. According to the standard definition, the overall temperature rise rate of the battery pack of 0% SOC was less than 1 °C/s, which could be considered that the battery pack did not undergo TR.
Figure 5a shows the maximum temperature after TR measured by the thermocouples on the back side of different SOC batteries 1, 2, and 3. It can be seen that for the 100% SOC LFP battery pack and 50% SOC LFP battery pack, the back of battery 2 had the highest temperature, followed by battery 1, and the back of battery 3 had the lowest temperature. On the other hand, battery 2 was sandwiched between battery 1 and battery 3, resulting in less heat conduction between battery 2 and the outside space, so the maximum temperature behind battery 2 was slightly higher than that of battery 1. Relative to the interval between TR in battery 1 and battery 2, battery 3 experienced a longer period after TR occurred in battery 2. Battery 1 and battery 2 had begun to experience a temperature reduction condition when battery 3, through its own TR and battery 2, experienced less heat transfer, resulting in the lowest temperature of battery 3. In addition, as SOC increases, the maximum temperature of the battery pack also rises, because batteries with higher SOCs store more energy, and therefore the internal reaction is more intense, and the energy released by TR is higher. Therefore, the TR of the battery itself will increase sharply, and a large amount of high-temperature gas will be generated, which will increase the ambient temperature, and the TR will propagate to the adjacent battery.
Figure 5b presents the maximum temperature rise rate behind different cells under different SOCs. It can be seen that for the same battery, the temperature rise rate of the battery increases with the increase in SOC. With the increase in SOC, there is more energy stored inside the battery, a more intense TR reaction, and faster heat generation. For the 100% SOC LFP battery pack and 50% SOC LFP battery pack, the maximum temperature rise rate of battery 1 was significantly greater than that of battery 2, and the maximum temperature rise rate of battery 2 was greater than that of battery 3. Because battery 1 is more fully heated, and the battery itself will release more energy when TR occurs; for battery 2, its TR was caused by the rapid heating of battery 1. The heating was not sufficient and the temperature rise rate was reduced, but the initial conditions of TR of battery 2 were reached, causing TR of battery 2.
In this study, changes in TR behavior were studied by analyzing changes in temperature and the temperature rise rate. The TR time and the time of safety valve rupture can be determined by the temperature change, and the TRP time interval can be determined. According to the thermal runaway time difference between the two batteries and the average temperature formula, the TRP time interval between two cells of the same battery pack is calculated by (2). The TR temperature of the battery can be calculated by averaging the temperature on the left and right sides of the battery, calculated by (3).
Δ t TR = t i + 1 , TR t i , TR
  T i , TR = T i , l + T i + 1 , l 2
where Δ t TR is the TR time interval between adjacent cells, and t i + 1 , TR and t i , TR are the TR start time of cell i and cell i + 1, respectively.   T i , TR is the TR temperature of cell i; T i , l and   T i + 1 , l are the left temperature of cell i and cell i + 1, respectively.
In addition, it is important to study the energy absorbed by the battery before TR. Through the study of Zhou et al. [39], according to the specific heat capacity formula, the total heat absorption of the battery can be calculated by (4). Before the battery TR, the battery in the battery pack will also transfer heat to other batteries, and the formula for transferring heat between batteries is shown in (5).
  Q i , t = c b m b ( T i , TR T )
  Q i , t j = c b m b ( T i ( t j + 1 , TR ) T i ( t j , TR ) ) , ( i   >   j )
where Q i , t is the total heat absorbed by battery i before TR, for which c b is the specific heat capacity of the battery (   c b value is about 1.1 J/g • K [40,41]).   m b is the mass of the battery, T i , TR is the temperature before TR of battery i, and T is the ambient temperature. Q i , t j is the thermal contribution of cell j to cell i, and t j + 1 , TR and t j , TR are the TR start time of cell j + 1 and cell j, respectively. T i ( t j + 1 , TR ) and   T i ( t j , TR ) are the temperature of the TR start time of cell i at cell j + 1 and cell j, respectively.
According to (4) and (5), the total heat absorbed by each cell of different SOC battery packs before TR can be calculated, as shown in Figure 6. It can be seen that the total heat absorbed by cells 1, 2, and 3 in the 100% SOC battery pack is 161.9 kJ, 282.7 kJ, and 300.9 kJ before TR, respectively, while the total heat absorbed by cells 1, 2, and 3 in the 50% SOC battery pack is 165.4 kJ, 201.2 kJ, and 175 kJ before TR, respectively, indicating that the total heat absorption of the 100% SOC battery pack is generally higher than that of the 50% SOC battery pack. In addition, it is important to study the thermal effects of TR on batteries that occur later. Figure 6 shows that the thermal contribution of cell 1 to cell 2 and the thermal contribution of cell 2 to cell 3 in a 100% SOC battery pack account for 71.6% and 89.9% of the heat absorbed by cells 2 and 3, respectively, while the 50% SOC battery pack is 68.6% and 77.9%, respectively. It shows that the TR of the previous battery is the main heat source of TR of the latter battery, and with the increase in SOC of the battery, the proportion of the thermal contribution of the previous battery increases.

3.2. Quality Analysis of TR and Its Propagation

Figure 7 shows the appearance of 100% SOC, 50% SOC, and 0% SOC LFP battery packs after TR. As can be seen from the figure, the TR of the 100% SOC battery pack is the most serious, followed by the 50% SOC battery pack, whose battery pack was adhered to the surface by a large number of substances that were not fully burned and ejected, while the battery 1 of the 0% SOC battery pack only undergoes the stage of safety valve rupture, and none of the three batteries had TR.
Figure 8 shows the overall mass change and mass change rate of 100% SOC, 50% SOC, and 0% SOC LFP battery packs. The overall mass change rate can be calculated from the scale readings, as shown in (2).
      dM dt = M t + 1 M t
where dM dt is the mass change rate of LIB pack,   M t + 1 and   M t are the mass of LIB pack at t + 1 and t seconds, respectively.
As shown in Figure 8a, the 100% SOC battery pack has the most serious mass loss after TR, with a mass loss of 675.3 g, followed by a 50% SOC battery pack with a mass loss of 486 g, and finally the 0% SOC battery pack with a quantity loss of only 90.7 g. This indicates that the mass loss increases with the increase in the battery pack SOC. This is because the battery pack with a large SOC exhibits a more obvious ejection behavior, and the TR chemical reaction is faster [42], spraying out a large amount of toxic and harmful gases and taking away the debris of the battery coil. For a 0% SOC battery pack, under the action of heater heating, a reaction occurs inside battery 1, which is much weaker than 50% and 100% SOC. However, the rupture and decomposition of its internal materials also produces gas, causing the safety valve to rupture, releasing gas and ultimately resulting in a mass loss of about 10%. On the other hand, the maximum number of electronic scale indications due to the gas ejection of battery 1 in 100% SOC, 50% SOC, and 0% SOC LFP battery packs are 3160 g, 3100.1 g, and 2950.9 g, respectively. The rupture of the safety valve of battery 2 and battery 3 will also lead to a relative increase in the number of electronic scales. In addition, with the increase in SOC, the battery pack exhibits a greater ejection force, and the conduction of the ejection gas through the force leads to an increase in the scale indicator. As shown in Figure 8b, the mass loss rate fluctuates positively and negatively before and after the rupture of the safety valve, and the fluctuation with the reduction curve of SOC is smaller, which also confirms that the larger the SOC, the stronger the internal chemical reaction of the battery, and the more serious TR behavior. The order of mass loss rate sizes is 100% SOC > 50% SOC > 0% SOC. On the other hand, with the spread of TR of the same SOC battery pack, the mass increase rate and mass loss rate of battery 1 are the highest compared with battery 2 and battery 3, reaching 896.8 g/s and 968 g/s respectively under 100% SOC, while battery 2 and battery 3 are smaller, showing a downward trend. The order of mass loss rate is battery 1 > battery 2 > battery 3.

3.3. LFP Battery TR Behavior Analysis

Figure 9 presents the change in TR behavior of a 42 Ah LFP battery pack with 100% SOC, 50% SOC, and 0% SOC. According to the change in TR behavior, it can be divided into 6 stages. At stage I, the LIB cell was heated by a heating plate with no significant change in cell behavior. At stage II, as the heating time of the heating plate to battery 1 increases, the temperature of battery 1 gradually increases, and at the same time, due to the heat conduction behavior, the temperature of battery 2 and battery 3 also increased to a lesser extent. The safety valve ruptured, producing a large amount of high-temperature gas; the gas was due to the redox reaction inside the battery and the evaporation of the electrolyte at high temperatures, so the internal pressure of the battery increased, and the battery safety valve could not withstand the pressure and was broken. Figure 8 shows that when the safety valve ruptures, battery 1 ejects sparks and was accompanied by the generation of flue gas. At stage III and stage V, the safety valves of cells 2 and 3 began to rupture, and cells 2 and 3 were also accompanied by sparks. Stage IV characterizes the stage where the TR behavior of battery 2 was most obvious. It can be seen that the 100% SOC LFP batteries exhibited a significant jet spark behavior during TR, but as the SOC decreases; this behavior gradually became less obvious, as 50% SOC LFP batteries only produced a large amount of white smoke at stage IV, while 0% SOC LFP battery 2 did not exhibit TR behavior. At stage VI, the toxic gases and fumes produced by the battery pack begin to disappear and the inside of the combustion chamber is clearly visible.

4. Conclusions

Through experimental tests, the changes in the TRP behavior of LFP battery packs under different SOC were studied. According to the experimental results, the propagation mechanism of TR was explained from five aspects: temperature, temperature rise rate, mass, mass change rate, and TR flue gas ejection behavior. Under different SOCs, as the battery SOC increases, the TR behavior becomes more obvious. The battery temperature rises faster, while the temperature propagates faster between the cells, and the battery quality loss is higher. In addition, the maximum temperature, temperature rise rate, and mass change rate of the battery packs are 100% SOC > 50% SOC > 0% SOC. The 100% SOC battery pack was accompanied by sparks in the rupture stage of the safety valve, while the 50% SOC and the 0% SOC LFP battery packs only showed the generation of flue gas. Under the same SOC, the TR behavior of battery 1 and battery 2 was more intense than battery 3, and the maximum temperature of the battery, the temperature rise rate, and the mass change rate was cell 1 > cell 2 > cell 3. In short, with the increase in battery SOC, the greater the risk of fire and explosion of the battery pack. As the battery and the heat source are closer, the TR behavior will be more intense. This conclusion reveals the characteristics of TRP of the LFP battery pack module, which is of great significance for preventing TRP in the battery pack and referring to the thermal management of the battery through TR characteristics.

Author Contributions

Conceptualization, M.C. and J.Y.; methodology, M.C.; validation, Y.C., M.Z. and L.Z.; investigation, M.Z., W.L. and F.Q.; writing—original draft preparation, M.Z.; writing—review and editing, M.C., Y.C., M.Z., J.Y. and L.Z.; project administration, M.C.; funding acquisition, M.C. All authors have read and agreed to the published version of the manuscript.

Funding

This research was funded by the National Natural Science Foundation of China (52204213), the China Postdoctoral Science Foundation (2020M681512), the project of research on educational reform and talent development of the School of Emergency Management of Jiangsu University (JG-03-03, JG-04-08).

Data Availability Statement

Data available on request due to restrictions eg privacy or ethical.

Conflicts of Interest

The authors declare no conflict of interest.

Abbreviations

The following abbreviations are used in this manuscript:
SOCstate of charge
LIBlithium-ion battery
LFPlithium iron phosphate
TRthermal runaway
TRPthermal runaway propagation

References

  1. Meng, X.; Yang, K.; Zhang, M.; Gao, F.; Liu, Y.; Duan, Q.; Wang, Q. Experimental study on combustion behavior and fire extinguishing of lithium iron phosphate battery. J. Energy Storage 2020, 30, 101532. [Google Scholar] [CrossRef]
  2. Tran, M.-K.; Mevawalla, A.; Aziz, A.; Panchal, S.; Xie, Y.; Fowler, M. A Review of Lithium-Ion Battery Thermal Runaway Modeling and Diagnosis Approaches. Processes 2022, 10, 1192. [Google Scholar] [CrossRef]
  3. Ping, P.; Wang, Q.; Huang, P.; Li, K.; Sun, J.; Kong, D.; Chen, C. Study of the fire behavior of high-energy lithium-ion batteries with full-scale burning test. J. Power Sources 2015, 285, 80–89. [Google Scholar] [CrossRef]
  4. Ouyang, D.; Weng, J.; Chen, M.; Wang, J.; Wang, Z. Electrochemical and thermal characteristics of aging lithium-ion cells after long-term cycling at abusive-temperature environments. Process Saf. Environ. Prot. 2022, 159, 1215–1223. [Google Scholar] [CrossRef]
  5. Zhang, J.; Liu, H.; Zheng, M.; Chen, M.; Zhao, L.; Du, D. Numerical study on a preheating method for lithium-ion batteries under cold weather conditions using phase change materials coupled with heat films. J. Energy Storage 2021, 47, 103651. [Google Scholar] [CrossRef]
  6. Cai, B.; Jan, N. Deep Learning-Based Economic Forecasting for the New Energy Vehicle Industry. J. Math. 2021, 2021, 3870657. [Google Scholar] [CrossRef]
  7. Zhang, F.; Feng, X.; Xu, C.; Jiang, F.; Ouyang, M. Thermal runaway front in failure propagation of long-shape lithium-ion battery. Int. J. Heat Mass Transf. 2022, 182, 121928. [Google Scholar] [CrossRef]
  8. Weng, J.; Xiao, C.; Ouyang, D.; Yang, X.; Chen, M.; Zhang, G.; Yuen, R.K.K.; Wang, J. Mitigation effects on thermal runaway propagation of structure-enhanced phase change material modules with flame retardant additives. Energy 2022, 239, 122087. [Google Scholar] [CrossRef]
  9. Weng, J.; Xiao, C.; Yang, X.; Ouyang, D.; Chen, M.; Zhang, G.; Waiming, E.L.; Yuen, R.K.K.; Wang, J. An energy-saving battery thermal management strategy coupling tubular phase-change-material with dynamic liquid cooling under different ambient temperatures. Renew. Energy 2022, 195, 918–930. [Google Scholar] [CrossRef]
  10. Feng, X.; Ren, D.; He, X.; Ouyang, M. Mitigating Thermal Runaway of Lithium-Ion Batteries. Joule 2020, 4, 743–770. [Google Scholar] [CrossRef]
  11. Wang, Z.; Chen, S.; He, X.; Wang, C.; Zhao, D. A multi-factor evaluation method for the thermal runaway risk of lithium-ion batteries. J. Energy Storage 2022, 45, 103767. [Google Scholar] [CrossRef]
  12. Börger, A.; Mertens, J.; Wenzl, H. Thermal runaway and thermal runaway propagation in batteries: What do we talk about? J. Energy Storage 2019, 24, 100649. [Google Scholar] [CrossRef]
  13. Ouyang, D.; Weng, J.; Chen, M.; Wang, J.; Wang, Z. Study on topographic, electrochemical, and safety characteristics of lithium-ion cells after long-term storage at abusive-temperature environments. Int. J. Energy Res. 2022, 46, 11903–11913. [Google Scholar] [CrossRef]
  14. Wang, H.; Xu, H.; Zhao, Z.; Wang, Q.; Jin, C.; Li, Y.; Sheng, J.; Li, K.; Du, Z.; Xu, C.; et al. An experimental analysis on thermal runaway and its propagation in Cell-to-Pack lithium-ion batteries. Appl. Therm. Eng. 2022, 211, 118418. [Google Scholar] [CrossRef]
  15. Wang, W.; He, T.; He, S.; You, T.; Khan, F. Modeling of thermal runaway propagation of NMC battery packs after fast charging operation. Process Saf. Environ. Prot. 2021, 154, 104–117. [Google Scholar] [CrossRef]
  16. Xu, C.; Zhang, F.; Feng, X.; Jiang, F.; Ren, D.; Lu, L.; Yang, Y.; Liu, G.; Han, X.; Friess, B.; et al. Experimental study on thermal runaway propagation of lithium-ion battery modules with different parallel-series hybrid connections. J. Clean. Prod. 2021, 284, 124749. [Google Scholar] [CrossRef]
  17. Zhou, Z.; Zhou, X.; Wang, B.; Liew, K.M.; Yang, L. Experimentally exploring thermal runaway propagation and prevention in the prismatic lithium-ion battery with different connections. Process Saf. Environ. Prot. 2022, 164, 517–527. [Google Scholar] [CrossRef]
  18. Lai, X.; Wang, S.; Wang, H.; Zheng, Y.; Feng, X. Investigation of thermal runaway propagation characteristics of lithium-ion battery modules under different trigger modes. Int. J. Heat Mass Transf. 2021, 171, 121080. [Google Scholar] [CrossRef]
  19. Tao, C.; Li, G.; Zhao, J.; Chen, G.; Wang, Z.; Qian, Y.; Cheng, X.; Liu, X. The investigation of thermal runaway propagation of lithium-ion batteries under different vertical distances. J. Therm. Anal. Calorim. 2020, 142, 1523–1532. [Google Scholar] [CrossRef]
  20. Wang, B.; Zhou, Z.; Li, L.; Peng, Y.; Cao, J.; Yang, L.; Cao, B. Experimental study on thermal runaway and its propagation of large format prismatic lithium-ion batteries. J. Energy Storage 2022, 55, 105550. [Google Scholar] [CrossRef]
  21. Liu, Y.; Niu, H.; Xu, C.; Huang, X. Thermal runaway propagation in linear battery module under low atmospheric pressure. Appl. Therm. Eng. 2022, 216, 119086. [Google Scholar] [CrossRef]
  22. Tang, Z.; Song, A.; Wang, S.; Cheng, J.; Tao, C. Numerical Analysis of Heat Transfer Mechanism of Thermal Runaway Propagation for Cylindrical Lithium-ion Cells in Battery Module. Energies 2020, 13, 1010. [Google Scholar] [CrossRef] [Green Version]
  23. Jin, C.; Sun, Y.; Wang, H.; Zheng, Y.; Wang, S.; Rui, X.; Xu, C.; Feng, X.; Wang, H.; Ouyang, M. Heating power and heating energy effect on the thermal runaway propagation characteristics of lithium-ion battery module: Experiments and modeling. Appl. Energy 2022, 312, 118760. [Google Scholar] [CrossRef]
  24. Huang, Z.; Yu, Y.; Duan, Q.; Qin, P.; Sun, J.; Wang, Q. Heating position effect on internal thermal runaway propagation in large-format lithium iron phosphate battery. Appl. Energy 2022, 325, 119778. [Google Scholar] [CrossRef]
  25. Wang, H.; Du, Z.; Liu, L.; Zhang, Z.; Hao, J.; Wang, Q.; Wang, S. Study on the Thermal Runaway and Its Propagation of Lithium-Ion Batteries Under Low Pressure. Fire Technol. 2020, 56, 2427–2440. [Google Scholar] [CrossRef]
  26. Mishra, D.; Shah, K.; Jain, A. Investigation of the Impact of Flow of Vented Gas on Propagation of Thermal Runaway in a Li-Ion Battery Pack. J. Electrochem. Soc. 2021, 168, 060555. [Google Scholar] [CrossRef]
  27. Mishra, D.; Shah, K.; Jain, A. Investigation of the Impact of Radiative Shielding by Internal Partitions Walls on Propagation of Thermal Runaway in a Matrix of Cylindrical Li-Ion Cells. J. Electrochem. Soc. 2021, 168, 120507. [Google Scholar] [CrossRef]
  28. Fang, J.; Cai, J.; He, X. Experimental study on the vertical thermal runaway propagation in cylindrical Lithium-ion batteries: Effects of spacing and state of charge. Appl. Therm. Eng. 2021, 197, 117399. [Google Scholar] [CrossRef]
  29. Li, K.; Xu, C.; Wang, H.; Jin, C.; Rui, X.; Chen, S.; Feng, X.; Fan, L.; Ouyang, M. Investigation for the effect of side plates on thermal runaway propagation characteristics in battery modules. Appl. Therm. Eng. 2022, 201, 117774. [Google Scholar] [CrossRef]
  30. Weng, J.; Huang, Q.; Li, X.; Zhang, G.; Ouyang, D.; Chen, M.; Yuen, A.C.Y.; Li, A.; Lee, E.W.M.; Yang, W. Safety Issue on PCM-based Battery Thermal Management: Material Thermal Stability and System Hazard Mitigation. Energy Storage Mater. 2022, 53, 580–612. [Google Scholar] [CrossRef]
  31. Weng, J.W.; Ouyang, D.X.; Liu, Y.H.; Chen, M.Y.; Li, Y.P.; Huang, X.Y.; Wang, J. Alleviation on battery thermal runaway propagation: Effects of oxygen level and dilution gas. J. Power Sources 2021, 509, 230340. [Google Scholar] [CrossRef]
  32. Weng, J.W.; He, Y.P.; Ouyang, D.X.; Yang, X.Q.; Chen, M.Y.; Cui, S.T.; Zhang, G.Q.; Yuen, R.K.K.; Wang, J. Honeycomb-inspired design of a thermal management module and its mitigation effect on thermal runaway propagation. Appl. Therm. Eng. 2021, 195, 117147. [Google Scholar] [CrossRef]
  33. Li, A.; Yuen, A.C.Y.; Wang, W.; Weng, J.; Lai, C.S.; Kook, S.; Yeoh, G.H. Thermal Propagation Modelling of Abnormal Heat Generation in Various Battery Cell Locations. Batteries 2022, 8, 216. [Google Scholar] [CrossRef]
  34. Li, A.; Yuen, A.C.Y.; Wang, W.; Weng, J.; Yeoh, G.H. Numerical investigation on the thermal management of lithium-ion battery system and cooling effect optimization. Appl. Therm. Eng. 2022, 215, 118966. [Google Scholar] [CrossRef]
  35. Haji Akhoundzadeh, M.; Panchal, S.; Samadani, E.; Raahemifar, K.; Fowler, M.; Fraser, R. Investigation and simulation of electric train utilizing hydrogen fuel cell and lithium-ion battery. Sustain. Energy Technol. Assess. 2021, 46, 101234. [Google Scholar] [CrossRef]
  36. Jia, Z.; Huang, Z.; Zhai, H.; Qin, P.; Zhang, Y.; Li, Y.; Wang, Q. Experimental investigation on thermal runaway propagation of 18,650 lithium-ion battery modules with two cathode materials at low pressure. Energy 2022, 251, 123925. [Google Scholar] [CrossRef]
  37. Zhang, Q.; Liu, T.; Wang, Q. Experimental study on the influence of different heating methods on thermal runaway of lithium-ion battery. J. Energy Storage 2021, 42, 103063. [Google Scholar] [CrossRef]
  38. Zhou, Z.; Zhou, X.; Cao, B.; Yang, L.; Liew, K.M. Investigating the relationship between heating temperature and thermal runaway of prismatic lithium-ion battery with LiFePO4 as cathode. Energy 2022, 256, 124714. [Google Scholar] [CrossRef]
  39. Zhou, Z.; Zhou, X.; Li, M.; Cao, B.; Liew, K.M.; Yang, L. Experimentally exploring prevention of thermal runaway propagation of large-format prismatic lithium-ion battery module. Appl. Energy 2022, 327, 120119. [Google Scholar] [CrossRef]
  40. Li, H.; Duan, Q.; Zhao, C.; Huang, Z.; Wang, Q. Experimental investigation on the thermal runaway and its propagation in the large format battery module with Li(Ni1/3Co1/3Mn1/3)O2 as cathode. J. Hazard. Mater. 2019, 375, 241–254. [Google Scholar] [CrossRef]
  41. Zhou, Z.; Zhou, X.; Peng, Y.; Li, L.; Cao, J.; Yang, L.; Cao, B. Quantitative study on the thermal failure features of lithium iron phosphate batteries under varied heating powers. Appl. Therm. Eng. 2021, 185, 116346. [Google Scholar] [CrossRef]
  42. Jia, Z.; Song, L.; Mei, W.; Yu, Y.; Meng, X.; Jin, K.; Sun, J.; Wang, Q. The preload force effect on the thermal runaway and venting behaviors of large-format prismatic LiFePO4 batteries. Appl. Energy 2022, 327, 120100. [Google Scholar] [CrossRef]
Figure 1. Battery overview. (a) LFP battery front view. (b) LFP battery top view. (c) Battery module layout drawing.
Electronics 12 00200 g001
Figure 2. Overview of the experiment. (a) Layout drawing of the experimental device. (b) Cell arrangement and thermocouple layout.
Electronics 12 00200 g002
Figure 3. Comparison of different SOC battery pack temperatures and cell temperatures within the pack.
Electronics 12 00200 g003
Figure 4. Comparison of temperature rise rates behind different SOC battery packs and cells in the pack.
Electronics 12 00200 g004
Figure 5. Comparison of the maximum temperature and maximum temperature rise rate behind the battery in different battery packs.
Electronics 12 00200 g005
Figure 6. Comparison of heat absorption and thermal contribution of 100% SOC and 50% SOC battery packs.
Electronics 12 00200 g006
Figure 7. The appearance of different SOCs battery packs after TR.
Electronics 12 00200 g007
Figure 8. Comparison of mass change and mass change rate of different SOC battery packs.
Electronics 12 00200 g008
Figure 9. TR behavior of battery pack under different SOCs.
Electronics 12 00200 g009
Table 1. Battery parameters.
PropertiesSpecifications
Cell TypePrismatic
Nominal Capacity42 Ah
Nominal Voltage3.9 V
Operating Voltage2.0 V–4.0 V
Nominal Charging rate1.0 C (30 °C~35 °C)
Size(26 ± 0.5) × (147 ± 0.5) × (102 ± 0.5) mm
Mass(917 ± 10) g
Disclaimer/Publisher’s Note: The statements, opinions and data contained in all publications are solely those of the individual author(s) and contributor(s) and not of MDPI and/or the editor(s). MDPI and/or the editor(s) disclaim responsibility for any injury to people or property resulting from any ideas, methods, instructions or products referred to in the content.

