Article

Building Penetration Losses at 3.5 GHz: Dependence on Polarization and Incidence Angle

Atlantic Research Centre, University of Vigo, 36310 Vigo, Spain
*
Author to whom correspondence should be addressed.
Electronics 2023, 12(1), 106; https://doi.org/10.3390/electronics12010106
Submission received: 10 November 2022 / Revised: 15 December 2022 / Accepted: 23 December 2022 / Published: 27 December 2022
(This article belongs to the Special Issue Advances in Wireless Networks and Mobile Systems)

Abstract

:
We measured and analyzed the building penetration losses for four different kinds of facades as a function of the incidence angle and polarization at 3.5 GHz, which is a frequency of interest for fifth generation (5G) communication systems. Results show that the attenuation may vary up to 8 dB with the incidence angle, which justifies the need for an angular characterization of the penetration losses, going beyond the simpler characterization used for normal incidence. We also found that there is a relevant polarization dependence of this attenuation, as electromagnetic theory predicts for wave transmission across flat discontinuities and even across flat dielectric slabs. Results would be of interest for the network design of future 5G base stations using orthogonal polarizations.

1. Introduction

Since they emerged in the 1990s, the development of digital cellular communications has been in an endless race in which user numbers, services, data rates and industry revenue continue to grow from year to year, at times exponentially. This expansion requires new resources and developments in order to manage a scarce and limited electromagnetic spectrum.
Despite modulation efficiencies having substantially improved, bandwidth requirements for these systems have grown in parallel to data rate demands. From the initial 200 KHz required for a GSM (2G) channel, we have reached 20 MHz with LTE (4G) and up to 100 MHz and 400 MHz in 5G systems, for the sub-6 GHz (FR1) and the millimetre wave (FR2) bands, respectively [1,2]. Primary spectrum bands chosen for 5G network deployments are C-bands n77 and n78 (3300–4200 MHz) [3]. These deployments require a deep knowledge on the radio channel behaviour at this frequency band, so that mobile network operators improve the planning tools needed for network rollout.
As a large number of user terminals are expected to be located indoors, but served by outdoor base stations, there is a need to assess the propagation path losses for outdoor to indoor links. This is necessary to analyze the base station coverage indoors, but also to calculate the attenuation of interfering signals due to building facades and to determine the possibility of frequency reuse in the radio network. A common outdoor to indoor propagation model [4,5,6] divides the path losses (PL) in three components:
PL = PL b + PL tw + PL in   [ dB ]
where PLb is the basic outdoor propagation loss, PLw are the building penetration losses and PLin are the indoor propagation losses.
Modeling building penetration losses is not an easy task. Although Maxwell equations may be useful to solve the problem of a plane wave impinging on an infinite flat surface separating two linear, isotropic and homogeneous media (see e.g., [7]), or on a series of successive dielectric slabs (also separated by infinite flat surfaces, with each slab being homogeneous), actual building facades are far more complex structures. Real facades may not have electrically flat surfaces (at least at 3.5 GHz); they may not be homogeneous; and they may even have an internally oriented structure. This makes it difficult to find an exact solution for the electromagnetic problem; thus, empirical modeling becomes necessary. Different empirical studies of building penetration losses have been published, showing that the losses depend on the facade material and structure, frequency, angle of incidence and even, as we will see in this paper, on the polarization of the incident field. A compendium of some studies on penetration losses can be found, for instance, in [1,8,9,10]. Regarding the 3.3–4.2 GHz frequency band, attenuation values vary from below 5 dB for old office buildings to 20–30 dB for modern office buildings [11]. Recent studies in new building materials based on concrete reinforcement and admixtures show attenuations constants of 0.8 to 4 dB/cm [12,13]. According to [1], citing [10], residential buildings with standard glass windows induce penetration losses up to 10 dB.
All these values correspond to normal incidence, which represents a situation where the base station is placed in front of the building facade. Despite building penetration losses usually tending to increase with incidence angle θ [5,6,7,14,15,16], some models do not even consider this angular dependence [4] or consider just a fixed term to account for non-perpendicular incidence, as in [17]:
PL tw = PL npi 10 · log 10 i = 1 N ( p i · 10   0 . 1   L material _ i )
where PLnpi denotes the non-perpendicular incidence additional losses, Lmaterial_i is the penetration loss of material i, pi is the proportion ratio of i-th materials and N is the number of materials. However, no values for PLnpi are given in [17]. Other models include a generic angular variation of the losses in the form of (1—cos θ)2 [5,6,10,15]. Finally, more complex models, which consider both the azimuth and elevation angular dependence of the building entry loss, have recently been developed [16]. Anyway, we have not found a specific study for penetration losses in the 3.3–4.2 GHz frequency band, considering both the polarization and angle of incidence.
Mobile communications systems do not commonly use a single vertically polarized field, but orthogonal polarizations (none of them being strictly vertical, in many cases). A few previous studies [12,18] have considered orthogonal polarizations, while the rest just deal with vertically polarized electric fields. Simulation results for wave transmission through double-glass windows presented in [19] show significant differences in the attenuation values for different polarizations and the angles of incidence, revealing the importance of considering both factors when analysing penetration losses.
In this paper, we extend the study of building penetration losses to consider not just the different construction materials used on building facades, but also the polarization and incidence angular dependence of these losses.
Measurements have been taken using directional antennas, which is reasonable as beamforming antennas are implemented for 5G communications. As shown in [20], directional antennas reduce the multipath contributions and increase the variation of the measured beam entry losses. Further reduction of other multipath contributions in the surrounding environment of the antennas is achieved by time gating.
The remainder of this paper is organized as follows: in Section 2, we provide a theoretical background supporting the proposals; in Section 3, we describe the measurement system and the measurement environments, including the procedure we followed during the campaign; we present and discuss the measurement results in Section 4; and finally, we summarize the main conclusions in Section 5.

2. Theoretical Background

When an electromagnetic wave travelling in free space impinges on an obstacle, only part of the energy of the incident wave is transmitted across that obstacle. Another part of the energy is reflected back while a further part may be dissipated within the obstacle itself. In any case, the transmitted energy is a fraction of the incident energy; thus, the wave has suffered attenuation. This attenuation depends on the size and the shape of the obstacle, but also on its electromagnetic properties; in addition, it may be computed using Maxwell’s equations.

2.1. Uniform Plane Wave Incident on A Semi-Infinite Medium

Consider a uniform plane wave propagating in free space that impinges on a planar obstacle, as seen in Figure 1.
The surface of this obstacle represents a planar boundary of an infinite extent. As a consequence of this discontinuity on the propagating medium, reflected and transmitted waves emerge. The electric and magnetic field of the three waves at the boundary should satisfy the boundary conditions derived from Maxwell’s equations. From these boundary conditions, the ratio of the amplitudes of the reflected and transmitted electric fields, relative to the amplitude of the incident electric field, known as reflection (Γ) and transmission (T) coefficients, respectively, can be calculated. The expressions for these coefficients are also known as Fresnel’s equations.
Both reflection and transmission coefficients depend on the polarization of the incident field relative to the incidence plane, which is the plane that contains the direction of propagation of the electromagnetic wave and a vector normal to the discontinuity surface ( n ). In Figure 1, the incidence plane is the plane of the paper sheet. We assume that the first medium corresponds to free space, while the second one is a good dielectric, with a relative dielectric constant εr and a conductivity σ. This assumption means that:
( σ 2 π   f   ε r   ε 0 ) 2   1
where f is the frequency and ε0 the permittivity of the vacuum. If the electric field is polarized perpendicular to the incidence plane, as in Figure 1a, Fresnel’s coefficients are [21]:
Γ perpendicular   = cos ( θ incident ) ε r sin 2 ( θ incident ) cos ( θ incident ) + ε r sin 2 ( θ incident )
T perpendicular = 2   cos ( θ incident ) cos ( θ incident )   + ε r sin 2 ( θ incident )
while if it is polarised parallel to the incidence plane, as in Figure 1b, the coefficients are:
Γ parallel   = ε r   cos ( θ incident ) + ε r sin 2 ( θ incident ) ε r   cos ( θ incident ) + ε r sin 2 ( θ incident )
T parallel = 2 ε r   cos ( θ incident ) ε r   cos ( θ incident )   + ε r sin 2 ( θ incident )
where θ incident is the incidence angle, as depicted in Figure 1.
The attenuation, in dB, may be calculated as:
A = 10 · log 10 ( 1 | Γ | 2 )
In Figure 2, we plotted the attenuation as a function of the incidence angle for obstacles made of concrete ( ε r = 5 . 31 ,   σ = 0 . 089   S / m ), brick ( ε r = 3 . 75 ,   σ = 0 . 038   S / m ) and glass ( ε r = 6 . 27 ,   σ = 0 . 02   S / m ) as an illustrative example to observe the clear theoretical differences due to the polarization and incidence angle. The electromagnetic properties of these materials were calculated from [7] for a frequency of 3.5 GHz.
As can be seen in Figure 2, the values of the attenuation vary with the polarization of the electric field as well as with the incidence angle of the electromagnetic wave, even when impinging on walls of the same material. For the case of perpendicular polarization, the attenuation increases monotonically with the incident angle. The attenuation for parallel polarization is lower and does not exhibit that large variation with the incidence angle.

2.2. Uniform Plane Wave Incident on A Slab

The case studied in Section 2.1. was quite simple, as just one discontinuity was considered in the propagating medium. If we intend to study the attenuation produced by building facades, a more realistic approach would be to consider a slab of thickness d; thus, with two parallel flat discontinuities in the propagating medium.
This will be the case depicted in Figure 3, where the incident wave will suffer multiple reflections at both discontinuities.
For this case, a solution using Maxwell’s equations can also been found [21]. The results for 30 cm thick slabs made of concrete or brick and a 15 cm slab made of brick were calculated and are given in Figure 4, both for perpendicular and parallel polarized incident fields. As can be seen for this case, there is no monotonic variation of the attenuation with the incidence angle.
For an actual facade, where multiple slabs of different materials may be present, the variation of the transmission losses may exhibit a much more complex behaviour. Furthermore, modeling that reality becomes increasingly difficult when each of those slabs is non-homogeneous and some of the discontinuities are rough instead of flat, as happens in many construction structures. To assess the penetration losses in such complex structures, an experimental approach is needed.

3. Experimental Set-Up

3.1. Measurement System and Procedure

The measurement system was based on a Keysight FieldFox N9913A portable vector network analyser (VNA). Two Electro-Metrics EM-6952 linearly polarized log-periodic antennas were connected to the VNA ports. These wideband antennas cover all the frequency range of our experiment and exhibit a 70° 3-dB E-plane beamwidth. During the measurements, we placed both antennas on tripods, at the same height, in opposite positions at each side of the building facades of the School of Telecommunication Engineering at the University of Vigo. The antennas pointed at each other. The distance from the antennas to the beam penetrating point on the facade was 1.5 m, enough to guarantee that the far-field conditions were met. The far-field distance was calculated as 2D2/λ, where D is the maximum antenna dimension and λ is the wavelength. For the range of frequencies considered in our experiment, the maximum far-field distance is 1.1 m. The radius of the illuminated zone in the facade for a distance of 1.5 m is around 1.05 m, given the antennas’ 3 dB beamwidth. The height of the antennas above the ground was chosen to avoid the main beam of the antenna illuminating the ground, covering then the first Fresnel zone, of which the radius is 0.274 m, for the lowest frequency in the range (3 GHz).
Measurements were taken at normal incidence (θ = 0°) as well as at ±15°, ±30°, ±45° and ±60° incidence angles, as shown in Figure 5, for vertical (perpendicular) and horizontal (parallel) polarizations of the electric field. To determine the antenna positions, a 1.5 m radius semicircle was drawn on the floor. The centre of the semicircle was at the facade, just below the beam-centre penetrating point. The antenna positions over the semicircle for the different incident angles were then calculated by simple trigonometric operations. The antenna was pointed at the beam-centre penetration point on the facade by using a laser pointer.
The S21 parameter was obtained by frequency sweeping from 3 GHz to 4 GHz. A time-gating technique [22] was applied to remove contributions from any multipath component and keep only the data related to propagation through the direct path across the facade. This technique consists of performing an inverse Fourier transform (iFFT) on the measured frequency response to obtain the impulse response of the radio channel. The radiowave propagating directly through the facade is identified by its delay, and the rest of the contributions due to reflection on other objects present in the nearby objects are filtered out. Thus, the building penetration losses through the building facade can be measured on site and the effect of the rest of the scatterers removed from the measurements.
As an example, Figure 6 shows the amplitude and phase of a measured S21 parameter as a function of frequency.
The result of performing the IFFT to the above result is shown in Figure 7, where the different multipath contributions can be identified by their delays as far as the propagation path differs by more than 30 cm. The contribution corresponding to the path through the facade is plotted in red.

3.2. Building Facades

Four different types of building facades were considered for this study. Two of them, shown in Figure 8 and Figure 9, are 30 cm width and are made of two brick walls separated by an air chamber. The brick walls are made of hollow clay bricks glued by mortar. Small stones cover the exterior surface, made by concrete, providing a rough surface. The inner face is plastered and painted by plastic paint. A schematic representation can be seen in Figure 10. For the facade with a window’s case, about half of the energy of the antenna is transmitted through the window and the other half across the facade. The windows are made of a single-glass pane within an aluminium frame.
The third case analyzed (see Figure 11) corresponds to a 15 cm facade made of a thin brick wall covered with plastic paint on both sides. The last facade analyzed was fully made of double glass pane with an air gap in the middle and aluminium frames, as we can see in Figure 12.
Measurements were taken at up to six spots placed with regular spacing along the facades for each type of facade. A total of ten frequency sweeps were performed with the VNA for each location and incident angle.

4. Results and Discussion

We computed attenuations for the different locations, angles of incidence and polarizations by comparing data gathered across the different facade sections with a free-space reference measurement using Equation (9):
Attenuation   ( dB ) = Main _ ray _ amplitude , free _ space     Main _ ray _ amplitude , facade
Averaging those attenuation values obtained at the different measurement points, for each type of facade and angle, yields the results shown in 
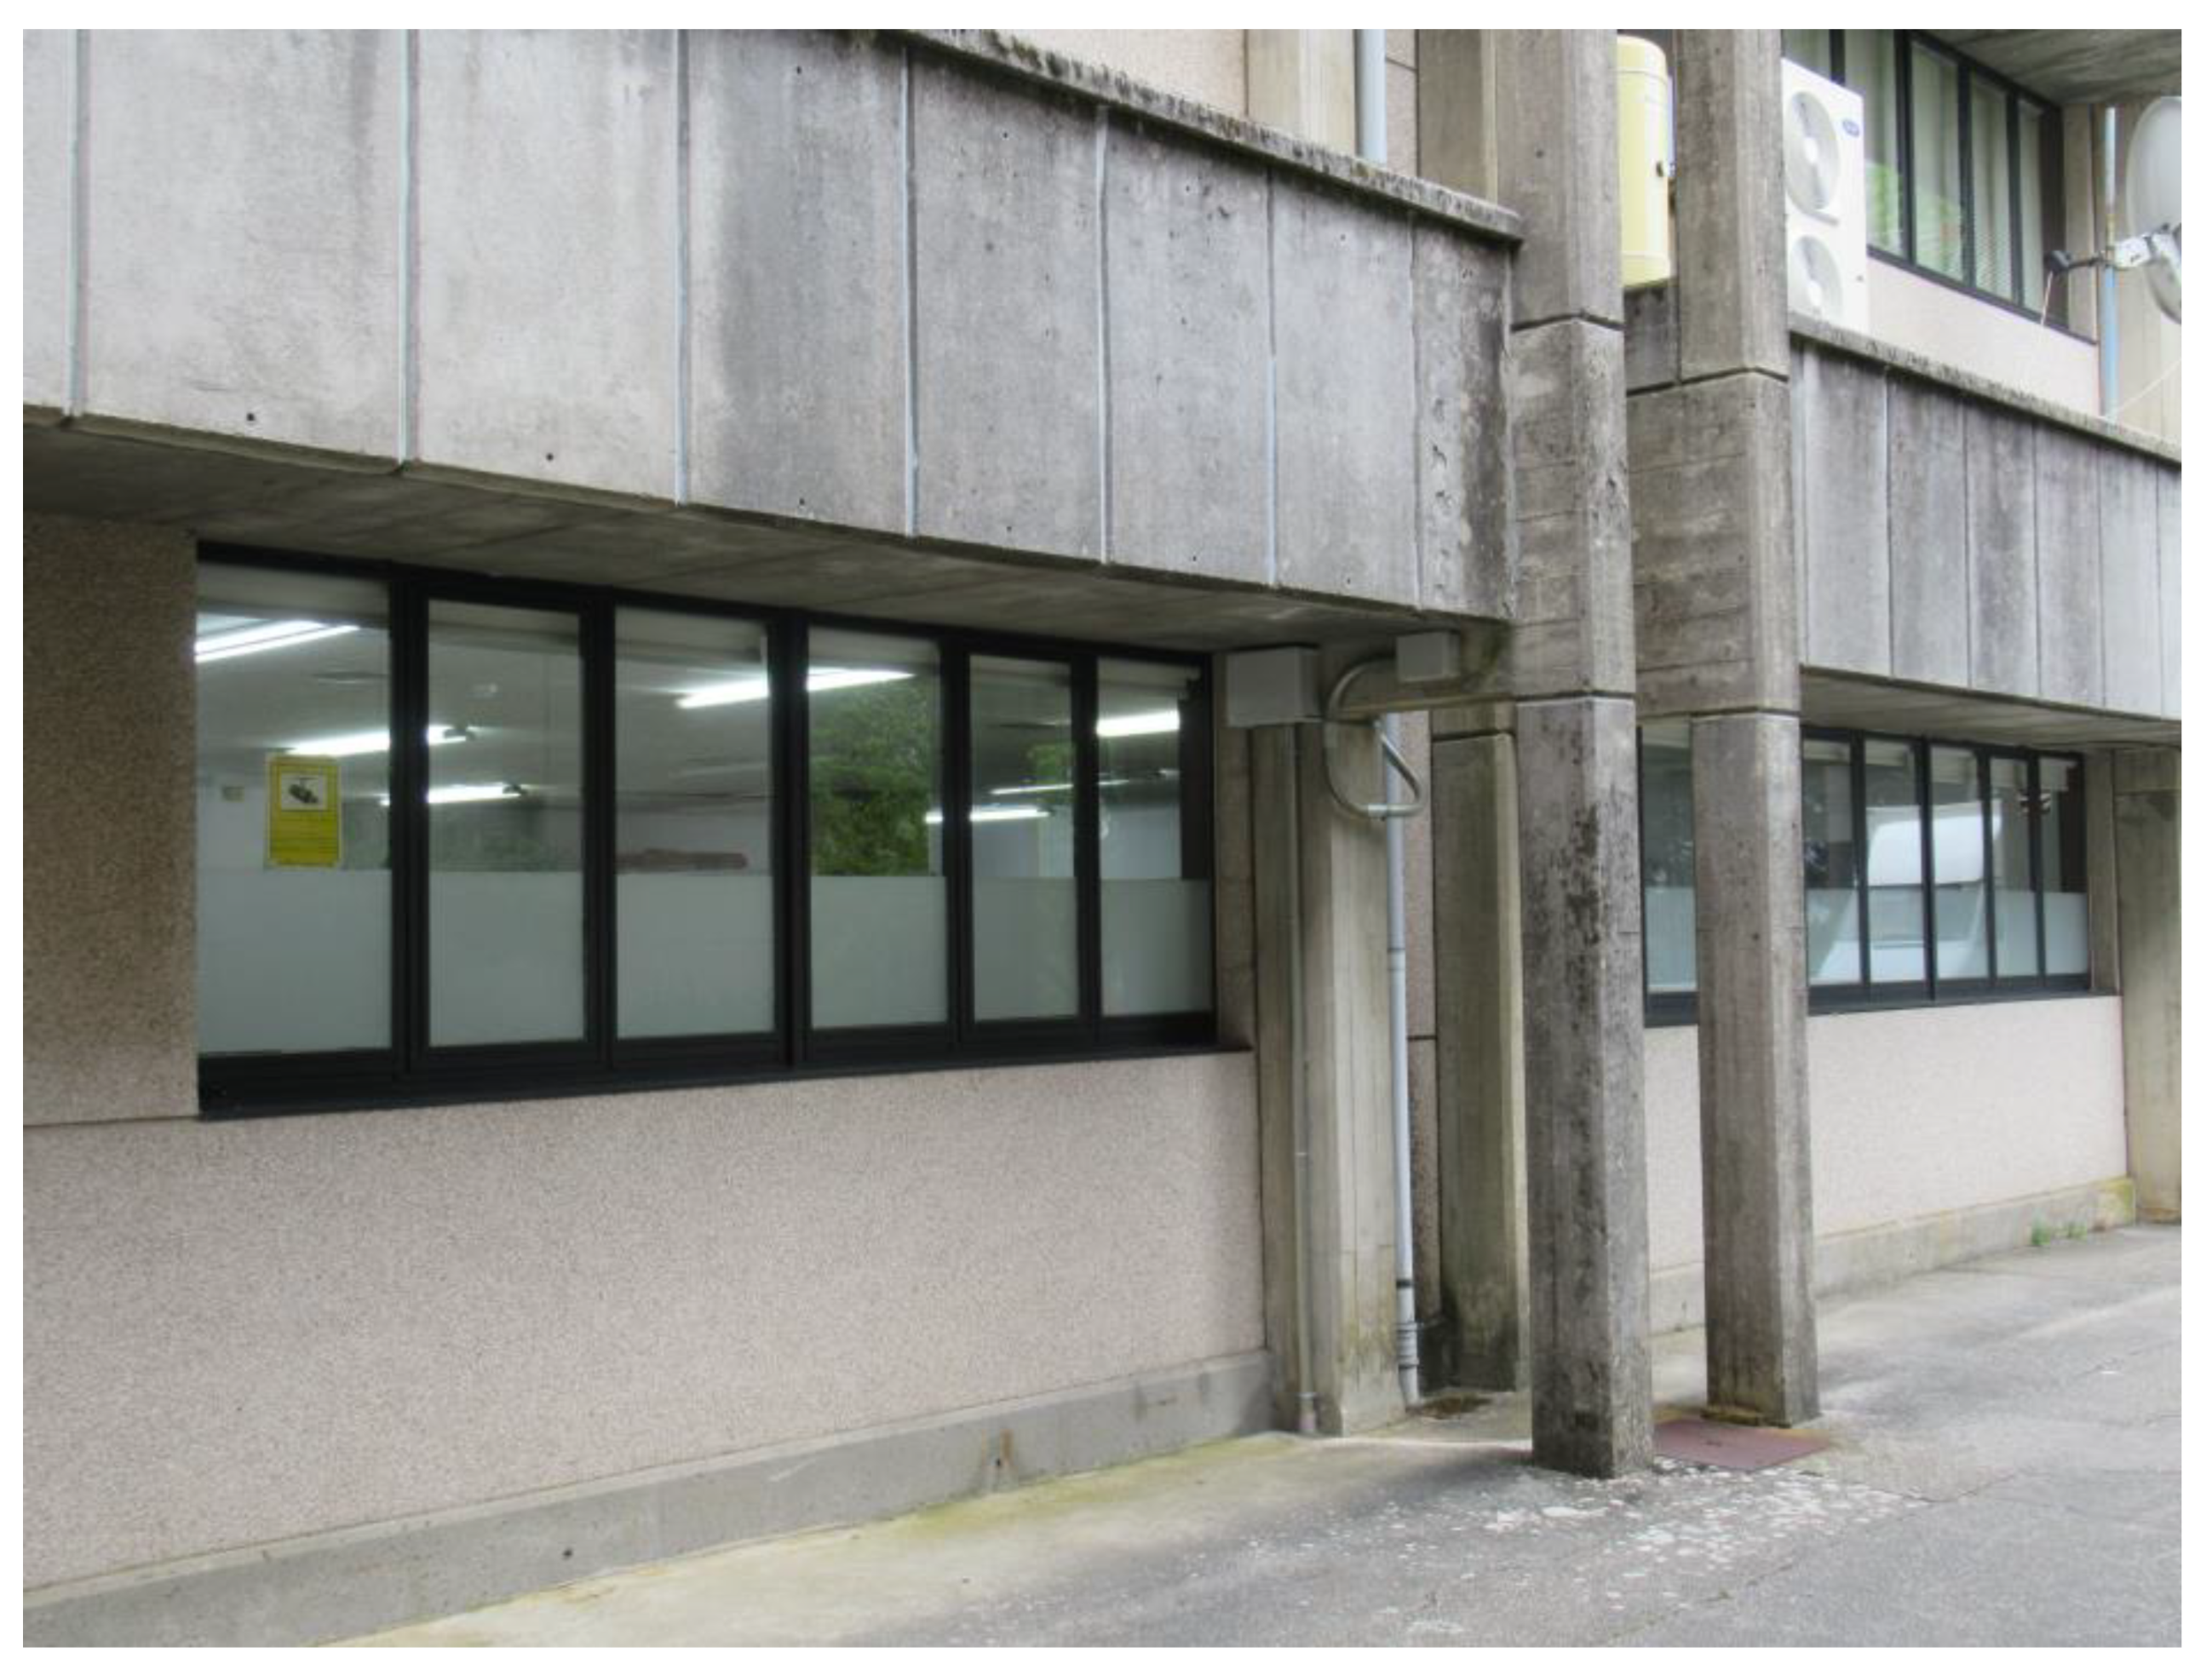
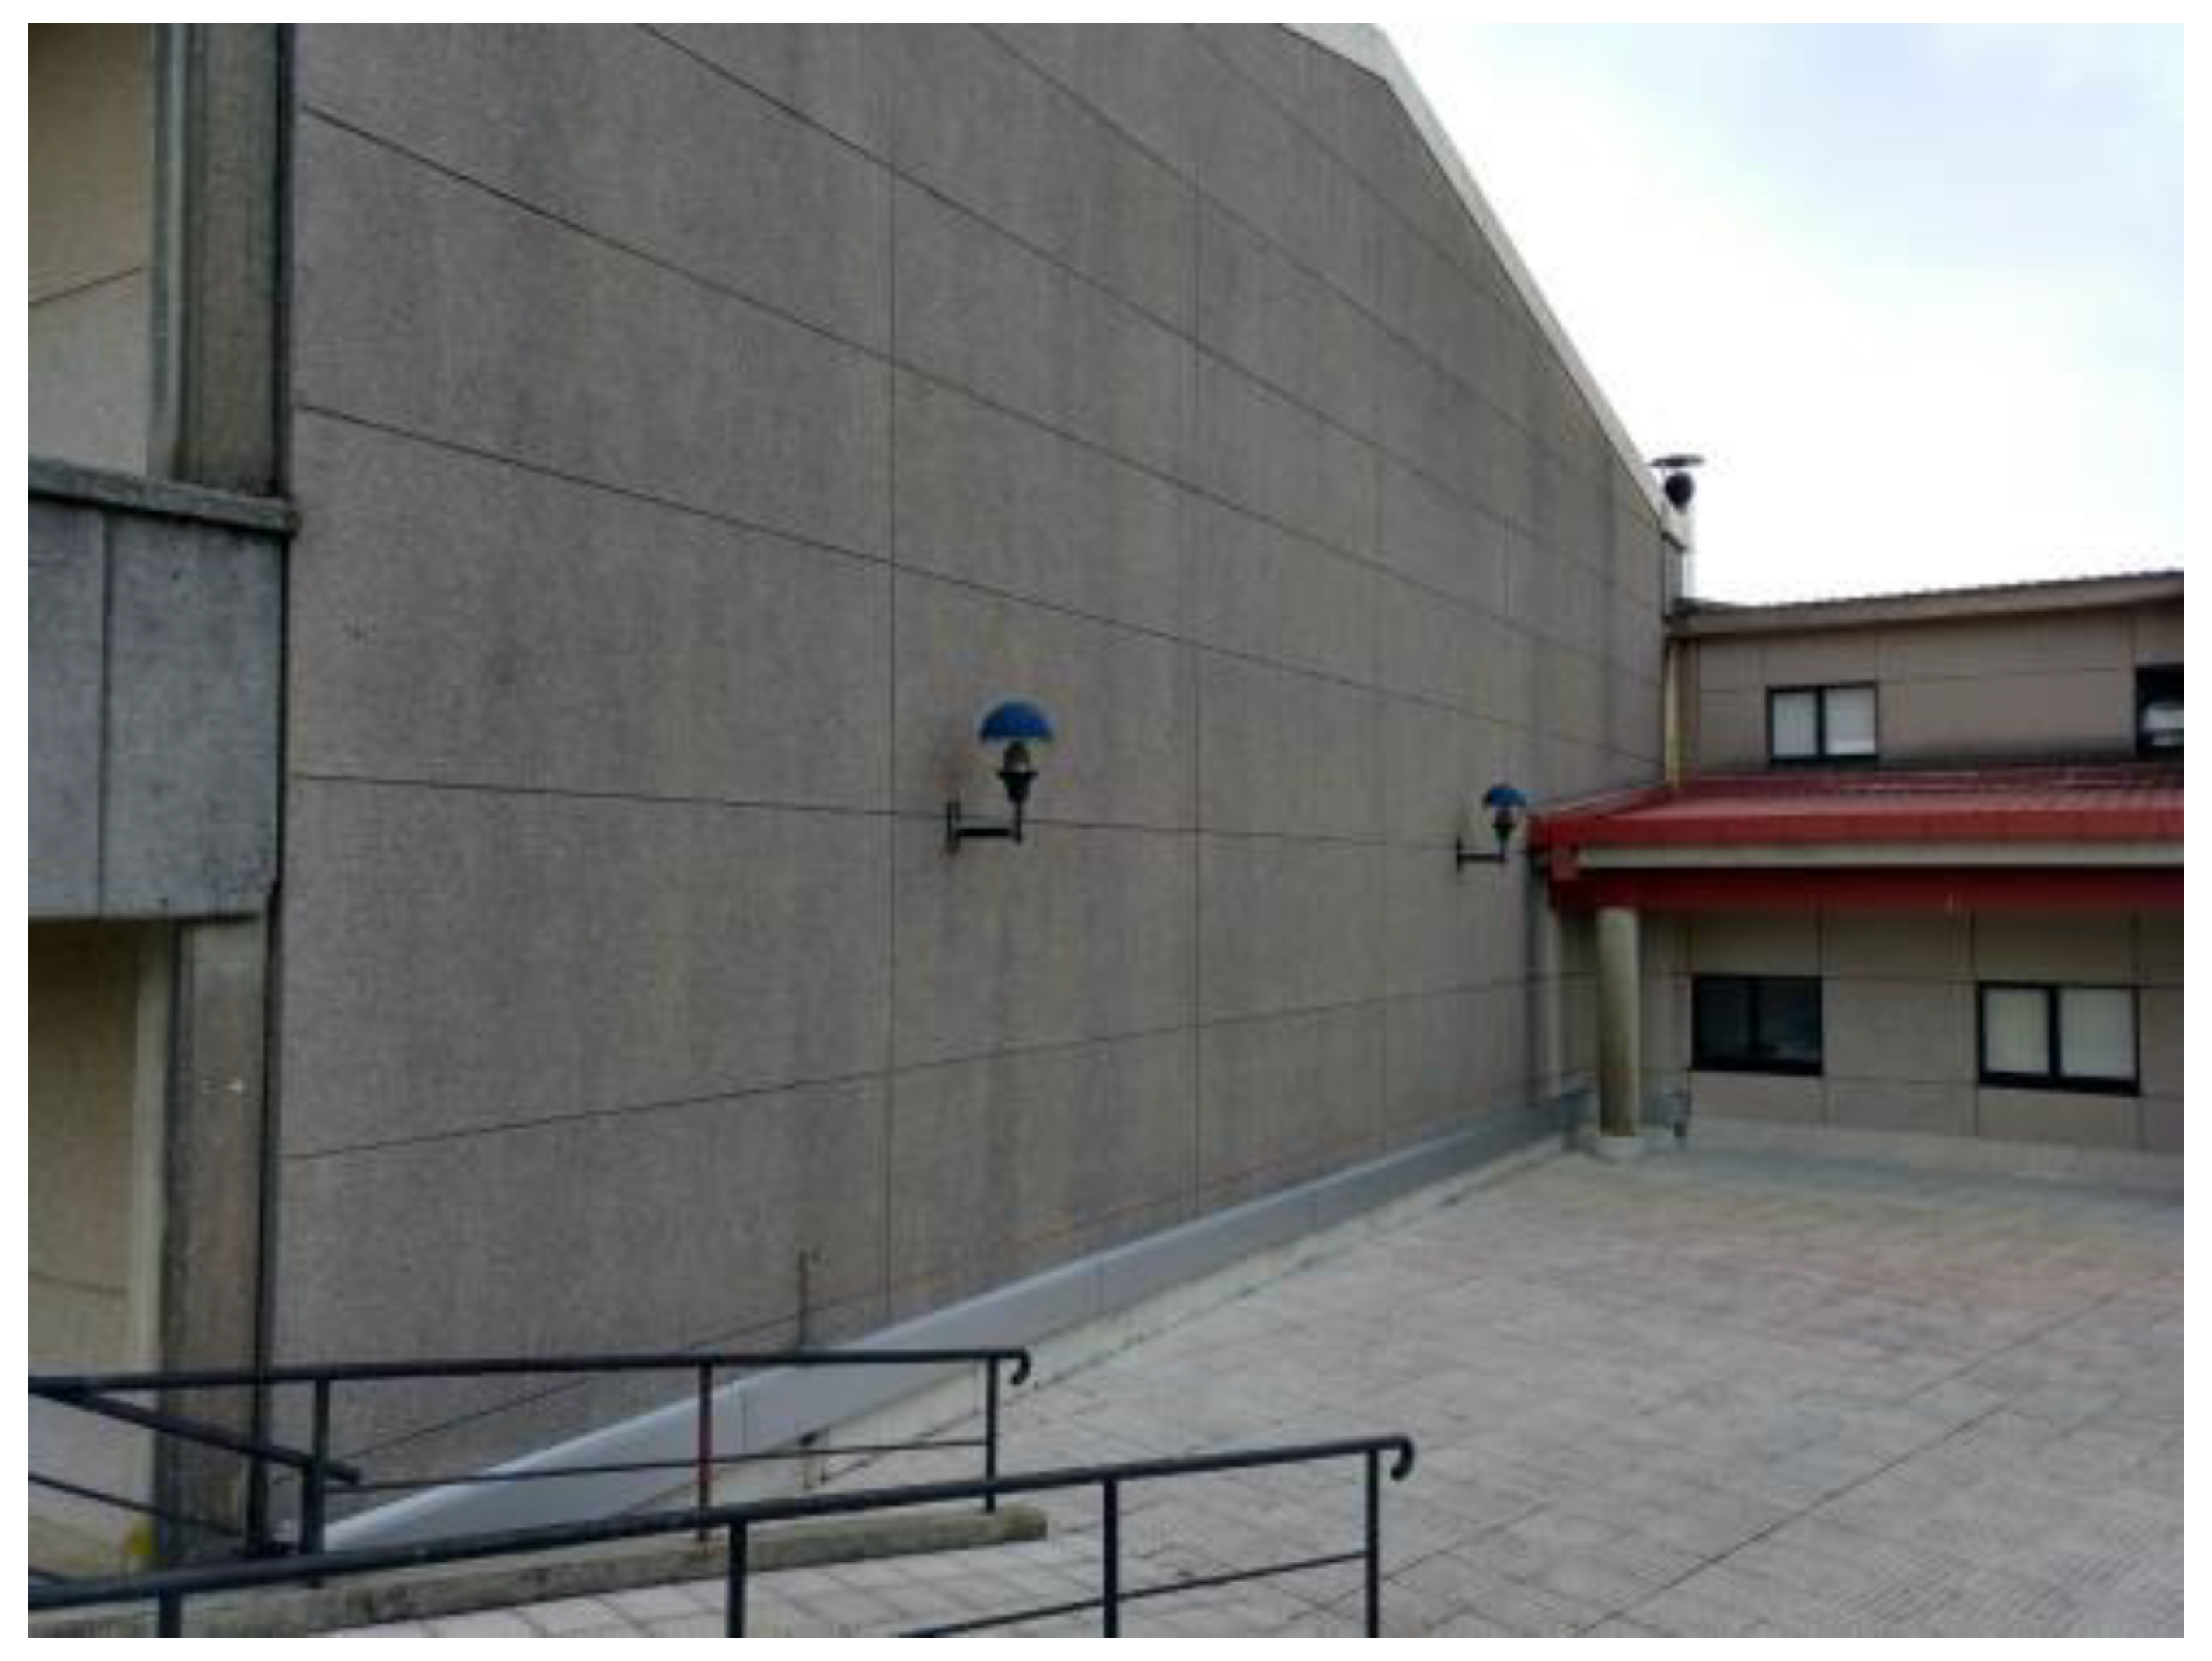
Figure 13 for vertical polarization. The averaging process reduces the measurement variability that may arise due to the variation of the facade composition from one measurement spot to another. Attenuation values are larger for the facade without windows than for that with windows.
The attenuation values obtained for the normal incidence (0°) and vertical polarization for the 30 cm facades are between 8 dB and 12 dB, depending on the presence of windows. This agrees with results in the literature. In [23], a value of 8.4 ± 1.4 dB is reported at 3.5 GHz for the external wall of a building made of light construction materials and clear glass windows, which is very similar to the no-windows facade used to obtain the results in this paper.
Regarding the angular variation, the attenuation values increase with the incidence angle by about 8 dB from 0° to 60° for both types of facade. This result is in agreement with those in the literature at other frequencies. In [15], at 2.5 GHz, the normal incidence attenuation will range from 4 to 20 dB, depending on the construction material, and it will increase by 5 dB at a 60° incidence angle, while in [24], a 17 dB attenuation increase from a normal to 60° incidence is reported at 5.2 GHz. According to [6,7,10], the normal incidence attenuation will be 14 dB and will increase by 4 dB at 60° for the 2-6 GHz frequency band.
However, the increase of the losses with the incidence angle is not monotonous, as the attenuation at 45° is slightly lower than at 30°. This does not agree with other empirical models in the literature as most of them expect a monotonous increase of the transmission losses with the incidence angle. However, as we showed in Section 2.2. and in Figure 4a, non-monotonous variations like these may happen in complex facades, such as the ones we considered, made by inhomogeneous walls of rough hollow clay bricks joined by concrete and with rough gravel covering the exterior wall.
The 15 cm facade results follow a similar trend to those of the 30 cm facade without windows, as the values increase non-monotonically with the incidence angle; however, the attenuation is lower due to the reduced width. The glass facade does follow a monotonous growing curve with the incidence angle.
The attenuation for these two last facades increases up to 6 dB from a normal incidence to 60° incidence, which is also in line with values reported in the literature mentioned above. The glass facade attenuates more than the brick one, which agrees with the results reported in [25].
For the horizontal polarization, results are given in Figure 14. For almost every angle, the attenuation values are lower than those found for vertical polarization. Such a difference is not strange, as even for the ideal situation of an infinite slab in air, the Fresnel equations predict different transmission coefficients for parallel and perpendicular polarizations.
The values for normal incidence on the 30 cm facades are also between 8 and 12 dB; however, there is not a clear trend to increase with the incidence angle. This agrees with the theoretical results in Section 2. Results vary with the incidence angle in an 8 dB range for the facade without windows and just around 1 dB for the facade with windows. The presence of windows in the facade increases the heterogeneity of the surface with its greater constructive complexity, having more corners, borders, metal frames, surfaces at different levels and so on. The presence of the metal frames of the windows may also explain why the attenuation is larger for the facade with windows than for the facade without windows at most incidence angles. The 15 cm facade again presents a similar trend to that of the 30 cm facade with no windows; however, with lower attenuation values and less variability with the incidence angle. The glass facade is the only showing a decreasing attenuation with the incidence angle. This agrees with the theoretical calculations presented in Figure 2 and also with the results given in [19].

5. Conclusions

We measured the building penetration losses for four different kinds of facade as a function of the incidence angle and polarization, in a band from 3 to 4 GHz, that is of interest for 5G deployment. Results show a relevant polarization and angle dependence of this attenuation. We also found that, as a general trend, the attenuation increases with the incidence angle if the field is vertically polarized, while for horizontal polarization, the angular variation is lower and not monotonous. We detected variations up to 8 dB comparing normal to 60° incidence with vertical polarization.
These results should be taken into account when estimating indoor 5G coverage at 3.5 GHz provided by outdoor base stations. They will also be useful for calculating the shielding provided by building facades and exploring the possibility of frequency reuse in a 5G mobile network at 3.5 GHz. To this extent, this paper would be of significant value to those who are required to deploy 5G coverage predictions for realistic indoor scenarios.

Author Contributions

Conceptualization, M.G.S. and I.C.; methodology, M.G.S. and I.C.; software, C.I.; validation, M.G.S., C.I., I.C. and I.E.; formal analysis, M.G.S. and I.C.; investigation, M.G.S., C.I., I.C. and I.E.; resources, M.G.S. and I.C.; data curation, M.G.S.; writing—original draft preparation, M.G.S.; writing—review and editing, C.I., I.C. and I.E.; supervision, M.G.S.; project administration, M.G.S.; funding acquisition, M.G.S. and I.C. All authors have read and agreed to the published version of the manuscript.

Funding

This research was funded by the Spanish Government, Ministerio de Ciencia e Innovación, Secretaría General de Investigación, grant number PID2020-112545RB-C52; Xunta de Galicia, project ED431C 2019/26; atlantTTic Research Centre and the European Regional Development Fund (ERDF); FCT/MCTES through national funds and when applicable, co-funded EU funds under the projects UIDB/EEA/50008/2021.

Conflicts of Interest

The authors declare no conflict of interest.

References

  1. Shafi, M.; Molisch, A.F.; Smith, P.J.; Haustein, T.; Zhu, P.; De Silva, P.; Tufvesson, F.; Benjebbour, A.; Wunder, G. 5G: A tutorial overview of standards, trials, challenges, deployment, and practice. IEEE J. Sel. Areas Commun. 2017, 35, 1201–1221. [Google Scholar] [CrossRef]
  2. International Wireless Industry Consortium. Evolutionary & Disruptive Visions Towards Ultra High Capacity Networks White Paper; International Wireless Industry Consortium: Doylestown, PA, USA, 2014. [Google Scholar]
  3. Global Mobile Suppliers Association. Evolution from LTE to 5G; Global Mobile Suppliers Association: Farnham, UK, 2022. [Google Scholar]
  4. 3GPP TR 36.873 v12.7.0. Sudy on 3D Channel Model for LTE. 2017. Available online: https://portal.3gpp.org (accessed on 9 November 2022).
  5. Electronic Publication. Guidelines for Evaluation of Radio Interface Technologies for IMT-Advanced; Report ITU-R M.2135-1; Electronic Publication: Geneva, Switzerland, 2009. [Google Scholar]
  6. IST-WINNER-II Deliverable 1.1.2 v.1.2. WINNER II Channel Models. 2007. Available online: www.ero.dk (accessed on 9 November 2022).
  7. Electronic Publication. Effects of Building Materials and Structures on Radiowave Propagation above about 100 MHz; Recommendation ITU-R P.2040-1; Electronic Publication: Geneva, Switzerland, 2015. [Google Scholar]
  8. ITU. Compilation of Measurement Data Relating to Building Entry Loss; Report ITU-R P.2346-0; ITU: Geneva, Switzerland, 2015. [Google Scholar]
  9. Rudd, R.; Craig, K.; Ganley, M.; Hartless, R. Building Materials and Propagation, Final Report 2604/BMEM/R/3/2.0; Ofcom: London, UK, 2014.
  10. Aalto University; BUPT; CMCC; Ericsson; Huawei; INTEL; KT Corporation; Nokia; NTT DOCOMO; New York University; et al. 5G Channel Model for Bands up to 100 GHz. 3rd Workshop on Mobile Communications in Higher Frequency Bands (MCHFB); White Paper: San Diego, CA, USA, 2015. [Google Scholar]
  11. Rodriguez, I.; Nguyen, H.C.; Jorgensen, N.T.K.; Sorensen, T.B.; Mogensen, P. Radio propagation into modern buildings: Attenuation measurements in the Range from 800 MHz to 18 GHz. In Proceedings of the IEEE 80th Vehicular Technology Conference, Vancouver, BC, Canada, 14–17 September 2014. [Google Scholar]
  12. Hegler, S.; Seiler, P.; Dinkelaker, M.; Schladitz, F.; Plettemeier, D. Electrical Material Properties of Carbon Reinforced Concrete. Electronics 2020, 9, 857. [Google Scholar] [CrossRef]
  13. Sean Ng, J.P.; Sum, Y.L.; Soong, B.H.; Maier, M.; Monteiro, P.J.M. Electromagnetic wave propagation through composite building materials in urban environments at mid-band 5G frequencies. IET Microw. Antennas Propag. 2022, 16, 627–638. [Google Scholar]
  14. European Commission, Directorate-General for the Information Society and Media. COST Action 231: Digital Mobile Radio towards Future Generation Systems; Final Report; Publications Office of the European Union: Luxembourg, 1999.
  15. Oestges, C.; Paulraj, A.J. Propagation into buildings for broad-band wireless access. IEEE Trans. Veh. Technol. 2004, 53, 521–526. [Google Scholar] [CrossRef]
  16. Saito, K.; Fan, Q.; Keerativoranan, N.; Takada, J. Vertical and horizontal building entry loss measurement in 4.9 GHz band by unmanned aerial vehicle. IEEE Wirel. Commun. Lett. 2019, 8, 444–447. [Google Scholar] [CrossRef]
  17. 3GPP TR 38.901 v14.0.0. 5G. Study on Channel Model for Frequencies from 0.5 to 100 GHz. 2017. Available online: https://portal.3gpp.org (accessed on 9 November 2022).
  18. Radivojevic, V.M.; Rupcic, S.; Milicevic, I.; Otkovic, I.I. Electromagnetic wave attenuation by plane concrete in the frequency range of 4G and 5G systems. In Proceedings of the International Conference on Smart Systems and Technologies (SST), Osijek, Croatia, 14–16 October 2020; pp. 31–38. [Google Scholar]
  19. Ni, Y.; Xiong, Q.; Zhang, S.; Luo, Y. Transmission Characteristics of Double Glass in 5G Communication. In Proceedings of the IEEE 5th International Conference on Electronics Technology (ICET), Chengdu, China, 13–16 May 2022; pp. 975–979. [Google Scholar]
  20. Lee, J.; Kim, K.W.; Kim, M.D.; Park, J.J.; Yoon, Y.K.; Chong, Y.J. Millimeter-wave directional-antenna beamwidth effects on the ITU-R building entry loss (BEL) propagation model. ETRI J. 2020, 42, 7–16. [Google Scholar] [CrossRef]
  21. Balanis, C.A. Advanced Engineering Electromagnetics, 1st ed.; John Wiley & Sons: Danvers, MA, USA, 1989. [Google Scholar]
  22. Cuiñas, I.; Sánchez, M.G. Building material characterization from complex transmissivity measurements at 5.8 GHz. IEEE Trans. Antennas Propag. 2000, 48, 1269–1271. [Google Scholar]
  23. Rodríguez, I.; Nguyen, H.C.; Kovács, I.Z.; Sørensen, T.B.; Mogensen, P. An empirical outdoor-to-indoor path loss model from below 6 GHz to cm-wave frequency bands. IEEE Antennas Wirel. Propag. Lett. 2017, 16, 1329–1332. [Google Scholar] [CrossRef] [Green Version]
  24. Electronic Publication. Propagation Data and Prediction Methods for the Planning of Short-Range Outdoor Radiocommunication Systems and Radio Local Area Networks in the Frequency Range 300 MHz to 100 GHz; Recommendation ITU-R P.1411-6; Electronic Publication: Geneva, Switzerland, 2012. [Google Scholar]
  25. Zhekov, S.S.; Nazneen, Z.; Franek, O.; Pedersen, G.F. Measurement of Attenuation by Building Structures in Cellular Network Bands. IEEE Antennas Wirel. Propag. Lett. 2018, 17, 2260–2263. [Google Scholar] [CrossRef]
Figure 1. Plane wave incident on a planar boundary: (a) with electric field perpendicular to the incidence plane; (b) with electric field parallel to the incidence plane.
Electronics 12 00106 g001
Figure 2. Transmission losses, in dB: (a) with electric field perpendicular to the incidence plane; (b) with electric field parallel to the incidence plane.
Electronics 12 00106 g002
Figure 3. Plane wave incident on a slab of thickness d.
Electronics 12 00106 g003
Figure 4. Transmission losses, in dB: (a) for perpendicular polarized electric field; (b) for parallel polarized electric field.
Electronics 12 00106 g004
Figure 5. Schematic representation of measurement procedure, with the antennas configured to 30° incidence angle measurements.
Electronics 12 00106 g005
Figure 6. Results of a S21 measurement as a function of frequency: (a) amplitude; (b) phase.
Electronics 12 00106 g006
Figure 7. Identification of the different propagation contributions in the delay domain.
Electronics 12 00106 g007
Figure 8. Building facade with windows.
Electronics 12 00106 g008
Figure 9. Building facade with no windows.
Electronics 12 00106 g009
Figure 10. Building facade schematic.
Electronics 12 00106 g010
Figure 11. 15 cm facade made of brick.
Electronics 12 00106 g011
Figure 12. Glass façade.
Electronics 12 00106 g012
Figure 13. Attenuation as a function of incident angle θ for vertical polarization for 30 cm facades without windows (red solid line); and with windows (blue dashed line), 15 cm brick facade (green dash-dot line) and glass facade (purple dotted line).
Electronics 12 00106 g013
Figure 14. Attenuation as a function of incident angle θ for horizontal polarization and 30 cm facade without windows (red solid line); and with windows (blue dashed line), 15 cm facade (green dash-dot line) and glass facade (purple dotted line).
Electronics 12 00106 g014
Disclaimer/Publisher’s Note: The statements, opinions and data contained in all publications are solely those of the individual author(s) and contributor(s) and not of MDPI and/or the editor(s). MDPI and/or the editor(s) disclaim responsibility for any injury to people or property resulting from any ideas, methods, instructions or products referred to in the content.

