1. Introduction
Since Satoshi Nakamoto first introduced the cryptocurrency known as Bitcoin in 2008, numerous altcoins, such as Ethereum have emerged [
1,
2,
3]. Presently, cryptocurrency continues to impact global financial markets and has become relatively ubiquitous in everyday life. Cryptocurrencies have become popular speculative investments compared to stocks, and they are also used for routine purchases of everyday products. Furthermore, blockchain technology has attracted considerable attention for the prevention of forgery and falsification via decentralized ledgers. Blockchain technology has been applied in various fields, including the Internet of Things (IoT), owing to its high security and ease of management [
4,
5,
6,
7,
8].
Moreover, the cryptocurrency market can be integrated with various new technologies such as non-fungible tokens (NFT) or the metaverse, which have recently attracted attention. Hence, these associations have further increased the value of cryptocurrency and their potential for more widespread adoption [
9,
10]. Moreover, non-face-to-face services, which minimize contact between people, are also increasing in popularity. As a result, NFT auctions of digital goods representing the ownership of tokens referencing links to artworks or digital assets are being actively conducted as non-face-to-face services. After an auction, transactions are conducted in cryptocurrency to acquire ownership of the tokens. Other non-face-to-face service-based transactions in metaverse systems are also conducted using cryptocurrency. In this manner, the existing cryptocurrency market is expanding beyond speculative investment—a limited scope—and is being integrated into the foundation of various emerging technologies. This trend is expected to accelerate along with associated research and development efforts.
Despite considerable controversy regarding the recognition of cryptocurrency assets, cryptocurrencies are actively traded on large exchanges with many investors in roughly the same manner as stocks. Investors analyze the trading market to predict cryptocurrency prices. However, cryptocurrency has a short history compared to conventional stocks, so research on techniques for the analysis and prediction of cryptocurrency prices has thus far remained in its relatively early stages. Therefore, recently, studies have been actively conducted to compensate for this gap in the literature [
11,
12,
13,
14]. Cryptocurrency price prediction can be helpful from a maintenance aspect, such as maintaining blockchain implementations or expanding blockchain networks. Moreover, cryptocurrency price prediction can be used as auxiliary indices for transactions and market price adjustments in NFT and metaverse markets.
Representative works include analyses of various training data from diverse perspectives by applying deep learning, as well as research on the prediction of cryptocurrency prices using long short-term memory (LSTM) and gated recurrent unit (GRU) models, which have exhibited excellent performance on time series data that solved the slow learning rate and “vanishing gradient” problems of recurrent neural network (RNN) models [
11,
12,
13,
14,
15]. However, recently, cryptocurrency prices have fluctuated drastically to the extent that it has become impossible or impractical to predict prices over time. For this reason, cryptocurrency prices may be considered to exhibit the characteristics of increasing volatility and fluctuations. Furthermore, it is generally difficult to predict cryptocurrency prices, and the prediction performance may be degraded considerably depending on circumstances [
16]. Over the past several years, various ideas have been proposed to solve these problems, and they have demonstrated effectiveness in real predictions. These studies have utilized hybrid models, sentiment analysis to reflect human psychological states, and frequency decomposition to minimize volatility and fluctuation [
17,
18,
19,
20,
21,
22,
23,
24,
25,
26,
27]. However, these studies involve some limitations. Accurate predictions may be important for cryptocurrencies, but the perspective of ultimately maximizing profit should also be considered in terms of situations involving extreme volatility and fluctuations [
28]. To maximize profits, providing clients with the means to make decisions—such as at what particular points they should sell, buy, or hold cryptocurrency assets—is much more useful in terms of client convenience and support than accurate price prediction alone. In this paper, to overcome these limitations, we propose new input features based on existing input features used in previous studies.
Therefore, in this study, we propose a deep learning-based price prediction and action recommendation model designed to recommend actions to support maximizing profits in addition to simply predicting near-term prices for the convenience of cryptocurrency clients and to facilitate their decision-making. To this end, we defined features sellProfit as the profit that can be obtained by selling a cryptocurrency at a given time, buyProfit, as the profit that can be obtained by buying a cryptocurrency at a given time, and maxProfit, which is the maximum profit that can be obtained at a given time. Next, we conducted an experiment to compare performance when sellProfit, buyProfit, maxProfit—the three input features we defined—were used with the performance when these features were not used. A total of six representative cryptocurrencies were used in this study, including Bitcoin (BTC), Cardano (ADA), Dash (DASH), Ethereum (ETH), Litecoin (LTC), and Monero (XMR) [
29,
30,
31,
32,
33,
34].
BTC is the first and most famous cryptocurrency. Therefore, it is receiving the most attention from the public [
29]. ADA was developed using a protocol called Ouroboros and a programming language called Haskell [
30]. Therefore, it is characterized by being designed very safely from hacking. DASH focused on speed. Therefore, most transactions can be processed within one second, and immediate payment is possible [
31]. ETH can be applied to various fields. Therefore, it is being developed based on the ETH platform in IoT, and other fields are also paying attention to ETH [
32]. LTC also focused on speed. It has improved the speed of transactions by adopting a Lightning network that only uploads final results after synthesizing all transactions [
33]. XMR applied a CryptoNote protocol to ensure the safest anonymity. Therefore, it is impossible to track receiving addresses and transaction history [
34].
For an objective experimental comparison, accuracy and F1 score were used as evaluation metrics. In addition, a t-test was also used to perform a systematic verification based on statistics.
Through this proposed model, clients are provided with criteria to determine whether they would benefit from selling, buying, or holding (“waiting”) cryptocurrency assets. Hence, they can use these criteria as decision-making indices that support profit maximization. Furthermore, in the context of NFTs and metaverse systems, these criteria can be used as auxiliary indices from a perspective of transactions conducted in internal markets and the adjustment of market prices.
In general, profit in cryptocurrency refers to a long-term profit calculated by comparing the price at the time the cryptocurrency was purchased, the current price, and the future price. However, short-term profits are also considered, which leads to market patterns resembling day trading. Such profits do not reflect the price at the time the cryptocurrency was purchased. Instead, such profits are calculated based on the best choice that can be made at a given time. For example, on the one hand, from a short-term profit perspective, it may be profitable to sell cryptocurrency before the price falls further if it is predicted to decrease. On the other hand, it may be profitable to buy the cryptocurrency before the price goes up further if the cryptocurrency price is predicted to increase. Therefore, we did not focus on long-term profits in this study. Instead, we focused on short-term profits, which do not take into consideration the price at the time the cryptocurrency was purchased. Thus, we propose a deep learning-based action recommendation model that supports maximizing profits.
The contributions of this study are summarized as follows:
In contrast to previous studies on the prediction of cryptocurrency prices, we proposed an action recommendation technique with new input features (sellProfit, buyProfit, and maxProfit) to improve the profits of cryptocurrency clients. The proposed approach can provide convenience to cryptocurrency clients and help them decide on actions to be taken at a given time to maximize profit;
The technique proposed in this study was compared with existing methods and analyzed in detail through a statistical verification method to verify the performance of the proposed technique;
More practical results were provided by analyzing the latest available data collected from real cryptocurrency markets instead of artificial data;
Cryptocurrency price prediction and action recommendation can be used as auxiliary indices when performing tasks such as cryptocurrency-based transactions and market price adjustments within new technology areas such as NFTs and metaverse systems.
The remainder of this study is organized as follows.
Section 2 describes related research on deep learning models designed to recommend actions that support profit maximization and improve price prediction performance using a deep learning model.
Section 3 explains our overall approach. Then,
Section 4 describes the experimental design along with the results. Lastly,
Section 5 summarizes the results of this study and describes our conclusions and future research.
3. Approach
Currently, cryptocurrencies are attracting a lot of attention. Cryptocurrencies have become new investments, and numerous platforms based on cryptocurrency are being developed. Therefore, cryptocurrency prediction research papers are important in terms of profitability and platform maintenance. However, most cryptocurrency prediction studies focus only on price prediction. Therefore, clients are inconvenienced by the necessity of rapidly making complex decisions on actions that support maximizing their profit. Clients have to sell cryptocurrency when the price of cryptocurrency rises, and they have to purchase it when the price fall. Furthermore, very few studies have explored the use of deep learning models to make recommendations for these actions, and the performance of such models remains low. In addition, there is a lack of research to newly calculate the input features. Therefore, in this paper, we propose new input features and a deep learning model to solve these problems.
Figure 1 shows the overall approach of the proposed method. The output of our proposed method is calculated based on cryptocurrency price data. First, we calculate new input features such as sellProfit, buyProfit, and maxProfit through the collected data and the proposed equation to train the deep learning model. Classification groups are limited to the most common functions: “Sell”, “Buy”, and “Wait”. We classify groups based on calculated sellProfit, buyProfit, maxProfit, and our proposed criteria. These classes then become the final output in the deep learning model. Next, we trained and tested the deep learning model through collected data, proposed input features, and proposed classes. Through the evaluation criteria used in the experiment, we compared existing methods using the LSTM model with the proposed method [
26,
27]. Finally, we evaluated the performance of these methods in terms of these evaluation criteria.
3.1. Feature Definition
In this section, we describe the three proposed input features: sellProfit, buyProfit, and maxProfit. For easy understanding, we described them based on price graphs, equations, and real prices.
3.1.1. sellProfit
The feature sellProfit represents the profit that can be obtained when selling a specific amount of cryptocurrency.
Figure 2 shows the daily price of Bitcoin over 88 days between 1 April 2021 and 30 June 2021. This graph shows that Bitcoin’s daily price continues to fall in the long run. According to a study by Ji et al., clients who trade stocks tend to sell if the price is predicted to continue to fall in the long run, as shown in
Figure 2 [
35]. Based on the results of this study, we propose Equation (1). The result of this equation is defined as sellProfit.
We assume a client sells M units of cryptocurrency today when tomorrow’s price (tomorrowPrice) falls compared to today’s (todayPrice). Because we sell when the price is high, the system turns a profit by multiplying the price difference (todayPrice − tomorrowPrice) by M units of cryptocurrency sold. On the contrary, if tomorrowPrice rises compared to todayPrice, we sell when the price is low. Thus, we lose profit by multiplying the price difference (todayPrice − tomorrowPrice) by M units of cryptocurrency sold.
For example, in
Figure 2, the price of Bitcoin on 17 April 2021 is about
$60,042. However, the price of Bitcoin on 18 April 2021 is about
$56,207. This is a price down
$3805 from the previous day. If we sell one cryptocurrency before the price falls, we can earn about
$3805 in profit.
3.1.2. buyProfit
The feature buyProfit is defined as profit that can be obtained when buying a specific amount of cryptocurrency.
Figure 3 is a Bitcoin daily price graph for 181 days between 1 September 2020 and 28 February 2021. This graph shows that Bitcoin’s daily price continued to fall in the long run. According to a study by Ji et al., clients who traded stocks tended to sell their stocks if the price was predicted to continue to rise in the long run, as shown in
Figure 3 [
35]. Based on the results of this study, we present Equation (2). The result of this equation is defined as buyProfit.
We assume that we purchase N units of cryptocurrency today when tomorrow’s price (tomorrowPrice) rises compared to today’s (todayPrice). Because we buy the units of currency when the price is low, we make a profit by multiplying the price difference (tomorrowPrice − todayPrice) by N quantities of cryptocurrency purchased. On the contrary, if tomorrowPrice falls compared to todayPrice, we purchase units when the price is high. Thus, we lose profit by multiplying the price difference (tomorrowPrice − todayPrice) by N quantities of cryptocurrency purchased.
For example, in
Figure 3, the price of Bitcoin on 4 November 2020 is about
$14,146. However, the price of Bitcoin on 5 November 2020 is about
$15,587. This is a price increase of
$1441 from the previous day. If we purchase one cryptocurrency before the price rises, we can earn about
$1441 in profit.
3.1.3. maxProfit
The feature maxProfit represents the maximum profit that can be obtained between sellProfit and buyProfit.
Figure 4 shows the flow chart for calculating maxProfit. According to a study by Ji et al., clients who trade stocks tend to take specific actions after comparing the profits earned when purchasing stocks with the profits earned from selling [
35]. Based on the results of this study, we propose a flowchart to obtain maxProfit. If sellProfit is greater than buyProfit, maxProfit is assigned the same value as sellProfit. This means that profits can be maximized when we sell. On the contrary, if buyProfit is greater than sellProfit, maxProfit is assigned the same value as buyProfit. This implies that profits can be maximized when units of cryptocurrency are purchased. Brief definitions of the three input features defined in this section are shown in
Table 2.
For example, in
Figure 2, the price of Bitcoin on 17 April 2021 is about
$60,042. However, the price of Bitcoin on 18 April 2021 is about
$56,207. We assume that we will sell or purchase one cryptocurrency. Assuming that the current date is 17 April 2021, if sellProfit is calculated through Equation (1), the value is 3805. However, if buyProfit is calculated through Equation (2), the value is −3835. Consequently, maxProfit has the same value as sellProfit because sellProfit is larger than buyProfit. Therefore, we can maximize profits when we sell cryptocurrency rather than when we purchase it.
On the contrary, in
Figure 3, the price of Bitcoin on 4 November 2020 is about
$14,146. However, the price of Bitcoin on 5 November 2020 is about
$15,587. We assume that we will sell or purchase one cryptocurrency. Assuming that the current date is 4 November 2020, if sellProfit is calculated through Equation (1), the value is −1441. However, if buyProfit is calculated through Equation (2), the value is 1441. Consequently, maxProfit has the same value as buyProfit because buyProfit is larger than sellProfit. Therefore, we can maximize profits when we purchase cryptocurrency rather than when we sell it.
3.2. Class Definition
Figure 5 shows the class classification criteria as flowchart. Three classes are used to perform classification, including “Sell”, “Buy”, and “Wait”. Classes were defined based on sellProfit, buyProfit, and maxProfit. In the case of the “Wait” class, some of the clients act when they can earn more than a given profit threshold, and if not, they can wait another day. Therefore, the “Wait” class means that maxProfit is less than a specific value and does not earn as much profit as desired.
4. Experiment
This section describes the experimental design for conducting our experiment and the results of the experiment performed. Detailed descriptions are given at the head of each subsection.
4.1. Experimental Design
The experimental design consists of three subsections: “Data Collection”, “Model Architecture”, and “Evaluation”. First, in the “Data Collection” section, we describe a brief description of the collected data for the experiment. Next, in the “Model Architecture” section, we describe input features, a Tensorflow 2.0-based deep learning model, hyperparameters, and a final output used in the experiment. Last, in the “Evaluation” section, we describe the evaluation criteria used in the experiment with equations and examples.
4.1.1. Data Collection
The cryptocurrencies considered in this study primarily include BTC and ETH, which are currently the most popular cryptocurrencies. Furthermore, based on data since January 2018, as the popularity of cryptocurrencies began to increase, we considered a total of six cryptocurrencies, including ADA, DASH, LTC, and XMR, which have advantages in terms of security, scalability, and speed. Moreover, the input features used in the experiment included average price (P), opening price (O), highest price (H), lowest price (L), and trading volume (V). The input features were obtained from Investing.com (access date: 5 April 2022, website:
https://www.investing.com/) [
36].
Figure 6 shows a price graph for each cryptocurrency. For each graph, the
x-axis represents the date, and the
y-axis represents the price of the cryptocurrency on that date. Cryptocurrencies received what may be considered full-fledged attention in the second half of 2017. As a result, the amount of recorded data is insufficient. Thus, 1339 days of data were used from 1 January 2018 to 31 August 2021; as may be observed from
Figure 6, all cryptocurrencies used in the experiment increased in volatility and fluctuation after a specific date. To evaluate the recommendation performance in this case, 70% of the data (937 days) were used to perform training and the remaining 30% (402 days) as testing data. In
Figure 6, the left side shows the training data, and the right side shows the testing data based on the red vertical line.
4.1.2. Model Architecture
We used a deep learning model based on Tensorflow 2.0 with Python and the Jupyter Notebook to implement the proposed approach. To validate the experimental results, the experiment was conducted using the same deep learning model. The model architecture is shown in
Figure 7. In the case of hyperparameters, the value was set to show optimal performance while consuming minimal time. Detailed values can be found in
Table 3 [
37].
The study by Nelson et al. found that the action recommendation model showed the highest performance when using LSTM among LSTM, MLP, RF, and a pseudo-random model [
26]. The study by Sanboon et al. also found that the action recommendation model showed the highest performance when using LSTM among LSTM, SVM, RF, MLP, KNN, Logistic Regression, and a Decision tree model [
27]. Therefore, we used LSTM to determine experimentally whether the proposed model affected actual performance. Input features include P, O, H, L, and V by default, and we compare the extent to which performance differences occurred when sellProfit, buyProfit, and maxProfit were added as input features.
4.1.3. Evaluation
In this section, we describe the evaluation criteria used in the experiment. Because the model used in the experiment was a recommendation model, the accuracy and the F1 score were used as two appropriate evaluations [
25,
26,
27]. In addition, the
t-test was also used to verify that the proposed method exhibited a significant performance improvement compared to existing methods [
26,
27]. All evaluation criteria were calculated with Scipy, which is an open-source Python library used for scientific computing and technical computing. These evaluation criteria cannot be absolute if used alone. Thus, a more systematic evaluation was performed using the accuracy, F1 score, and the results of the
t-test.
Table 4 is a simple matrix for understanding the evaluation criteria used in our experiment. When the actual class and the recommended class are the same, and the class is “Positive”, the result is a TP. On the contrary, when the actual class and the recommended class were the same, and the class was “Negative”, the result is considered a TN. When the actual class and the recommended class differed, and the class was “Positive”, the result was considered an FP. On the contrary, when the actual class and the recommended class differed, and the class was “Negative”, the result becomes FN.
Accuracy can be calculated as shown in Equation (3). This equation is a value calculated by dividing the number of accurately predicted samples by the number of total samples and indicates the overall prediction accuracy. It has a value between 0 and 1. This implies higher predictive performance as the value increases [
38]. However, accuracy involves a fatal problem as a measure of effectiveness. We assume that 100 samples would include, on average, 10 positive and 90 negative samples. If a predictive model predicts that all 100 samples were negative, the accuracy would be 0.9. However, this result would involve a class imbalance issue because positive classes were not successfully predicted at all. To solve this problem, the concepts of precision and recall emerged. Through the precision and the recall, we can calculate the F1 score.
The precision can be calculated as shown in Equation (4). This equation represents the ratio at which the actual value is also a “Positive” class when the predictive model is predicted to be a “Positive” class. It takes the same value as the accuracy between 0 and 1. This means higher predictive performance with increasing value [
39]. If the same example as the accuracy is applied, the precision becomes 0.
The recall can be calculated as shown in Equation (5). This equation represents the ratio at which the predicted value is also a positive class when the actual value is given a positive class. It takes the same range of values as the accuracy, between 0 and 1. This indicates higher predictive performance as the value increases [
39]. If the same example as the accuracy is applied, the recall becomes 0.
The F1 score can be calculated as shown in Equation (6). The precision and recall can be used effectively when class distribution imbalances. The F1 score is an equation that considers both the precision and the recall. It has the same value as the accuracy between 0 and 1. This means higher predictive performance as the value increases. In general, when both the precision and the recall were high, the F1 score was also high [
40]. If the same example as the accuracy was applied, the F1 score becomes 0. Considering both the accuracy and the F1 score, the assumed predictive model cannot be said to have exhibited excellent predictive performance.
The results of the
t-test can be calculated as shown in Equation (7). The
t-test is a statistical method that verifies whether there is a significant difference between the means of the two populations. In general, if the
t-test’s value is less than the
p-value, a difference between the means of the two populations is interpreted as significant. On the contrary, if it is larger than the
p-value, the difference between the means of the two populations is interpreted as insignificant [
41].
4.2. Experimental Results
For the verification of the proposed model, 402 days of data from 25 July 2020 to 31 August 2021, which is the date of increasing price volatility and fluctuation among 1339 days of data from 1 January 2018 to 31 August 2021, were used as testing data.
The confusion matrix for all cryptocurrencies is shown in
Table 5. We set “Positive” as “Wait” class and “Negative” as “Sell” and “Buy” class. When the actual class and the recommended class were the same, and the class was “Wait”, the result was a TP. On the contrary, when the actual class and the recommended class were the same, and the class was “Sell” or “Buy”, the result was considered a TN. When the actual class and the recommended class differed, and the class was “Wait”, the result was considered an FP. On the contrary, when the actual class and the recommended class differed, and the class was “Sell” or “Buy”, the result became FN. The results of the experiments in terms of the accuracy and the F1 score using test data and confusion matrix are summarized as follows.
Table 6 shows the accuracy and F1 score of the existing and proposed models for each cryptocurrency. Compared to existing models, it can be seen that both the accuracy and the F1 score improved from about 13% to 21%. In terms of accuracy, the percentage of correct answers in the proposed method improved from about 13% to 21%. In addition, in terms of F1 score, the percentage of correct answers in the proposed method improved from about 13% to 21% when reflecting the class distribution imbalance. We used the
t-test, a statistical technique, to assign validity to the performance difference for each cryptocurrency. The
t-test is a technique to verify whether there was a significant difference between the two populations. Before performing the
t-test, we checked the homogeneity of variance through the
F-test. We use the homoscedastic
t-test for the homogeneity of variance and the heteroscedastic
t-test for the heterogeneity of variance [
42]. The results of the
F-test for each cryptocurrency and evaluation criteria can be found in
Table 7. At this time, the significance level (
p-value) was set to 0.05.
For all cases, when the value calculated through the
F-test is smaller than the
p-value, this means there is not the homogeneity of variance but the heterogeneity of variance. Based on this result, we perform the heteroscedastic
t-test.
Table 8 shows the results of the heteroscedastic
t-test for each cryptocurrency and evaluation criteria. At this time, the
p-value was set to 0.05, which is the same value as the
F-test.
For all cases, the value calculated through
t-test is smaller than the
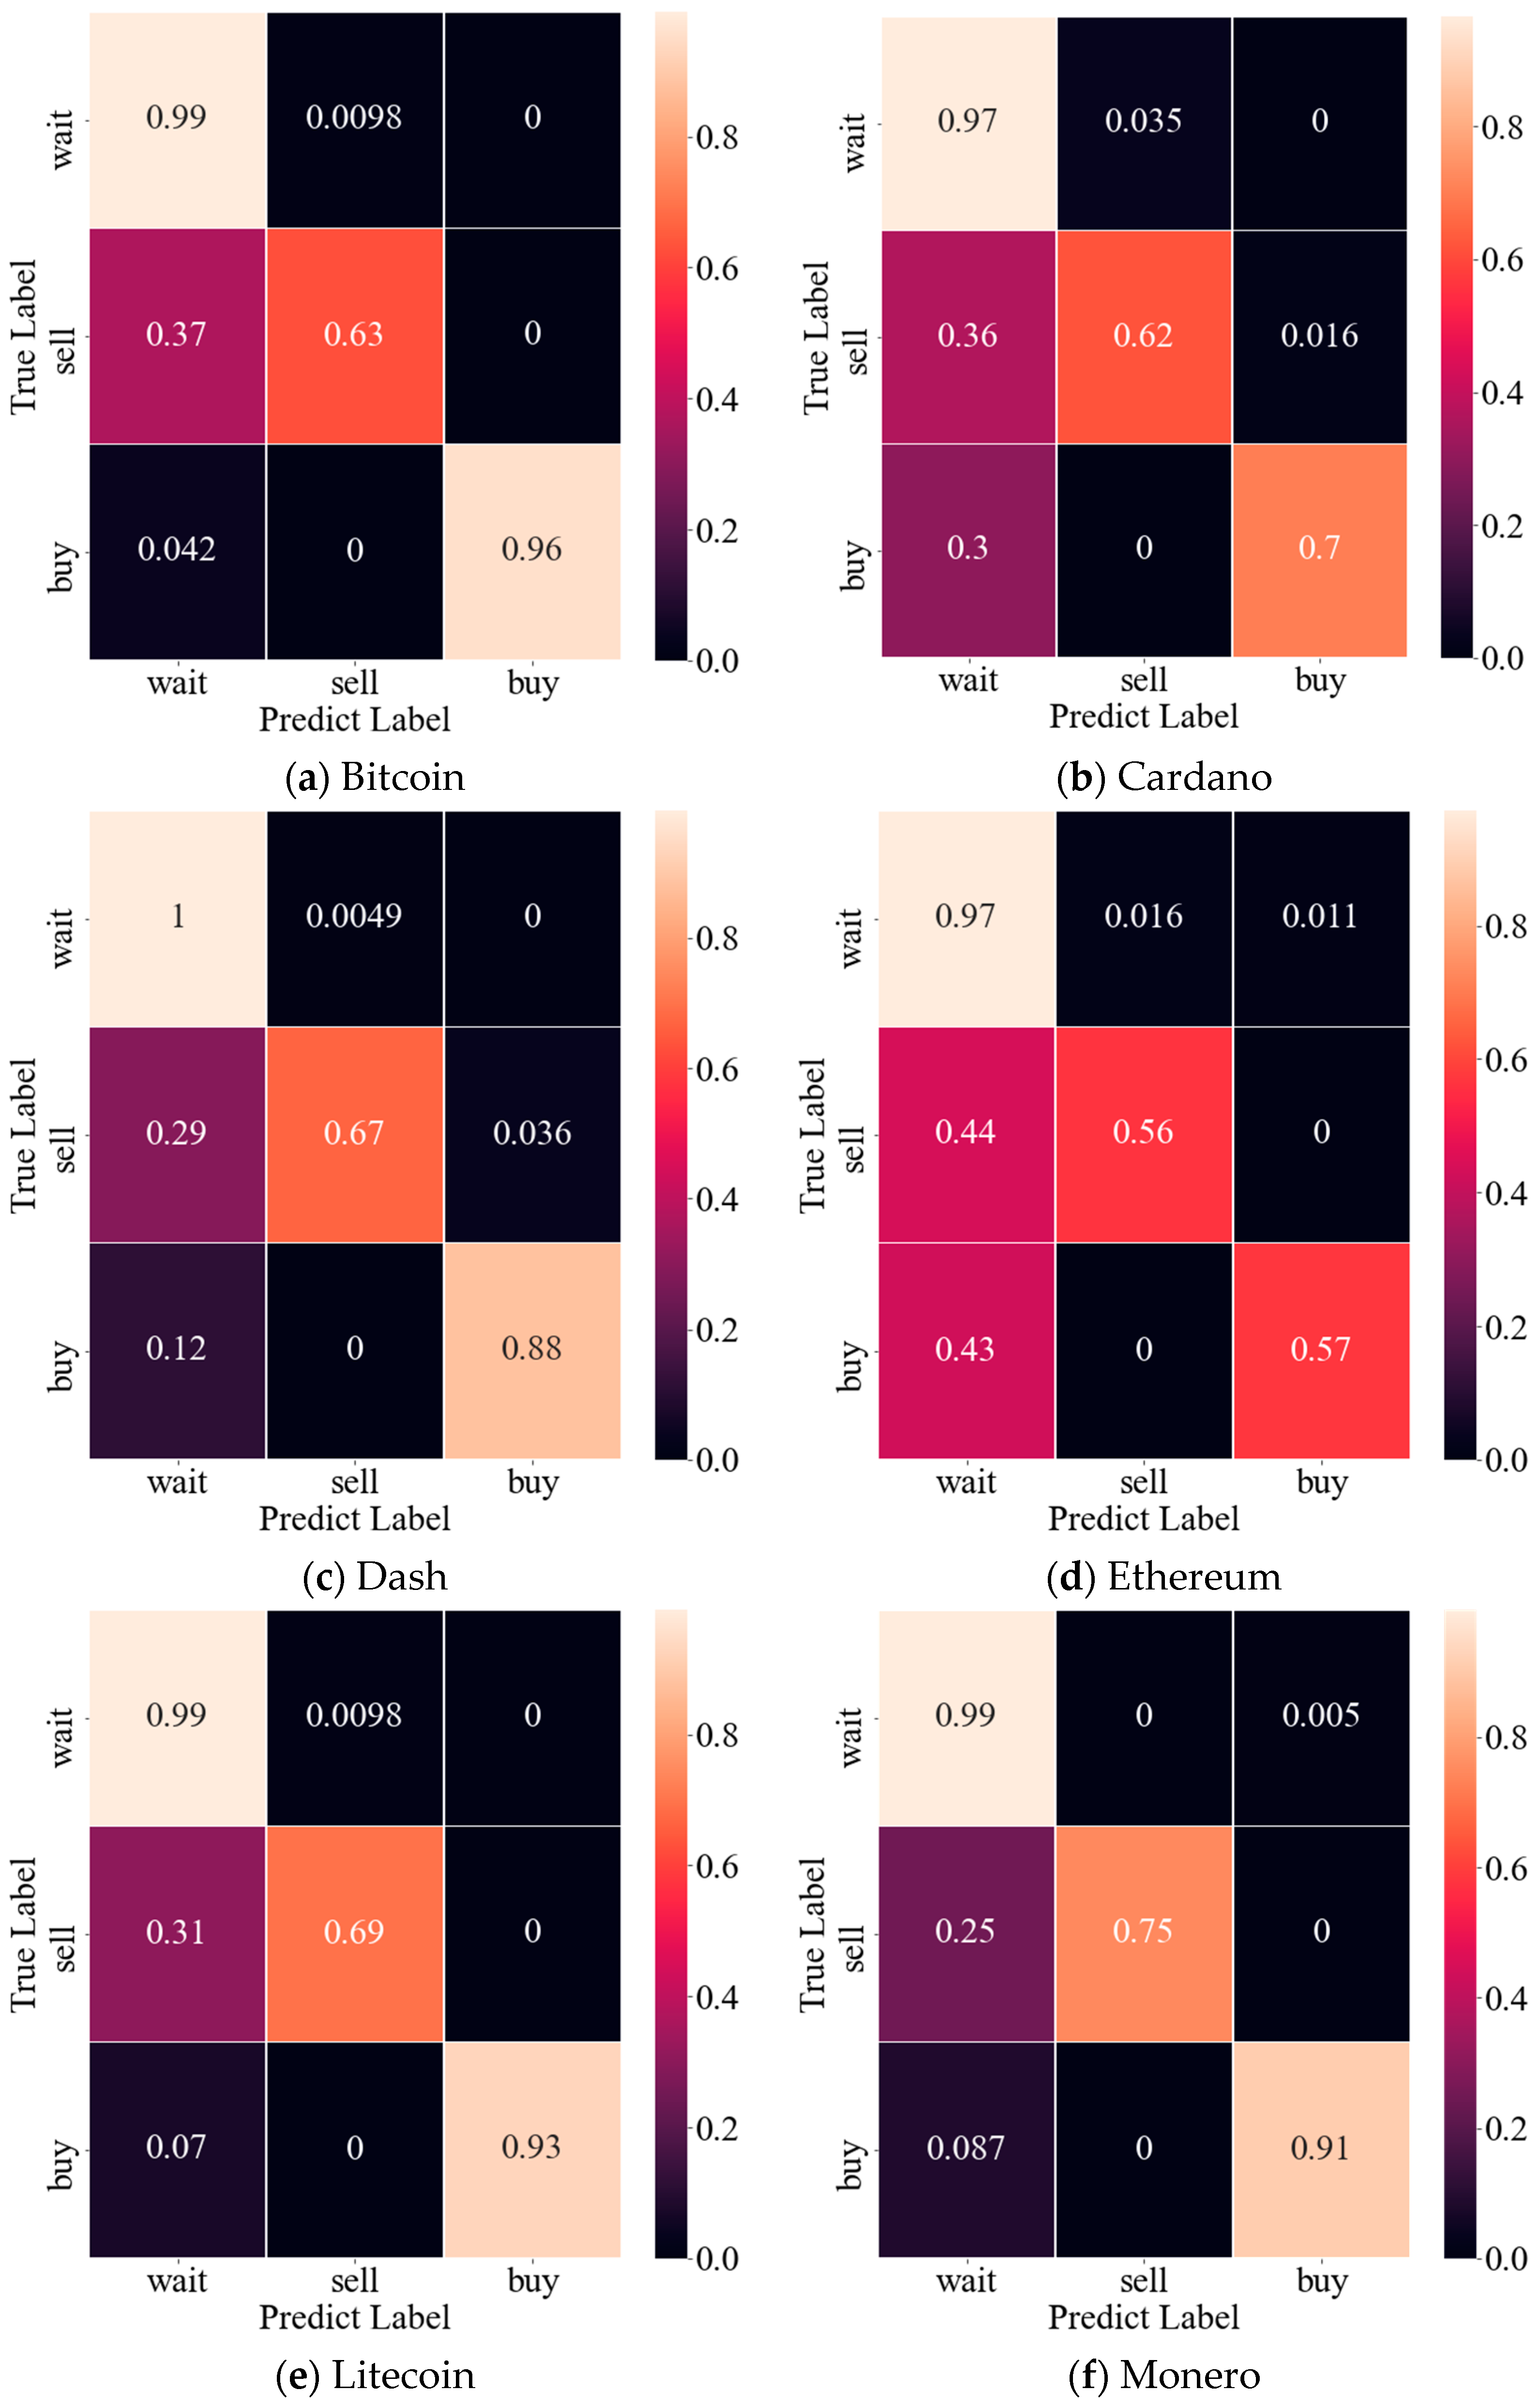
p-value, which means there was a significant difference between the two populations. Therefore, we concluded through statistical techniques that the proposed model showed significant performance improvements. We provide a confusion matrix showing the accuracy for each class for the systematic and transparency of the experiment. The confusion matrix can be found in
Figure 8 [
43].
For all cryptocurrencies, the first row refers to accuracy for the “Wait” class, the second row refers to accuracy for the “Sell” class, and the third row refers to accuracy for the “Buy” class. It may be observed that the accuracy for the “Wait” class was high in all cryptocurrencies, and the accuracy was low for the other two. In particular, Ethereum showed lower performance than other cryptocurrencies. We confirmed a class distribution for each cryptocurrency to identify the reasons for this result, and the result is shown in
Table 9.
Table 9 presents the class distribution of each cryptocurrency. Bold font represents which cryptocurrency has the largest number of specific classes. In contrast, an italic font represents which cryptocurrency has the least number of specific classes. First of all, it may be observed that all cryptocurrencies have many classes in the order of “Wait”-“Buy”-“Sell”. This class distribution is shown in
Table 9. A phenomenon may be observed in which accuracy for each class also has a higher value or the value in the order of “Wait”-“Buy”-“Sell”. In addition, in the case of ETH, it may be observed that the accuracy for “Buy” and “Sell” classes was lower than that of other cryptocurrencies. Excluding ETH, five cryptocurrencies exhibited between 600 and 700 “Wait” samples out of 1339 data. However, ETH had more than 800 “Wait” classes. Hence, the number of instances of learning “Buy” and “Sell” classes decreased, which caused the model’s low performance for these classes. This is expected to be solved if an equal ratio between classes can be created, such as by increasing the amount of learning data.
The observations evident from these results are described as follows. The proposed model showed approximately 13% to 21% improvement in accuracy and F1 score compared to existing methods. In addition, we confirmed that there was no major problem in class distribution imbalance through the F1 score. Performance improvement for all cryptocurrencies was statistically verified by the t-test.
Moreover, for all cryptocurrencies, the class distribution was in the order of “Wait”-“Buy”-“Sell”. It may also be observed that the class distribution was higher in the order of “Wait”-“Buy”-“Sell” in the Confusion Matrix. In the case of ETH, the accuracy of the “Buy” and “Sell” classes was lower than that of other cryptocurrencies. We confirmed the class distribution to identify the reason for this result and found that there were, in fact, an excessively large number of samples classified as “Wait” compared to other cryptocurrencies. We expect that this problem would be solved by correcting the class imbalance of the training data by creating an equal ratio between classes, such as by increasing the amount of learning data.
Table 10 shows the actual number of accurate prediction results for each cryptocurrency. The existing method [
26] correctly predicted between 278 and 296 out of a total of 402 data, and existing method [
27] correctly predicted between 268 and 287 out of a total of 402 data. Even though existing methods showed better prediction performance than the proposed method at certain short-term test data, the proposed method showed higher prediction performance generally. The proposed method correctly predicted between 316 and 346 out of a total of 402 data.
Considering the results, our proposed model showed approximately 13% to 21% improvement over the existing model. Moreover, the t-test results indicate that the performance improvement was meaningful. The results of this work provide clients with the recommended action that should be taken at the current time. Hence, the proposed method is expected to provide enhanced convenience and facilitate timely and effective decision-making. Through this paper, we also expect that researchers will be able to propose newly calculated input features based on existing research papers. They may be able to propose brand new methods to improve the performance of prediction models.
5. Conclusions and Future Research
In this study, we proposed a deep learning-based model designed to recommend actions to support maximizing short-term profit-taking by cryptocurrency clients operating roughly in the manner of conventional day traders. We collected data on a total of six representative cryptocurrencies: BTC, ADA, DASH, ETH, LTC, and XMR. Accuracy and F1 score were used as evaluation metrics for objective experimentation and verification. Furthermore, a statistical technique called a t-test was also used, in contrast to previous studies. Finally, the meaningful performance improvement of the model was systematically verified and analyzed compared to existing methods.
Compared to existing methods that only used the LSTM model, the accuracy and F1 score of the proposed model increased by approximately 13% to 21%. The experimental results indicate that the proportion of the correct answers was about 13% to 21% higher for the proposed model. The results also indicate that there was no major problem in terms of the class distribution imbalance. Moreover, the results of the t-test were lower than the p-values for all cryptocurrencies. The t-test results indicate that the performance improvement was meaningful.
Among the cryptocurrencies used in the experiment, Ethereum exhibited lower performance in terms of F1 score than the other five cryptocurrencies, so we analyzed this result using the confusion matrix. In particular, the “Sell” and “Buy” classes showed low performance. When the amount of data per class was analyzed, Ethereum contained approximately 800 samples classified as “Wait” out of a total of 1339 data samples. In contrast, other cryptocurrencies contained approximately 600 to 700 “Wait” classes. Hence, there was less opportunity to learn the “Sell” and “Buy” classes, and the results of the analysis showed that this issue caused the low performance of these classes.
The results of this work provide clients with the recommended action that should be taken at the current time. Hence, the proposed method is expected to provide enhanced convenience and facilitate timely and effective decision-making. In addition, cryptocurrency is increasingly being integrated with various new technologies such as NFTs and metaverse systems. In accordance with this trend, it is expected that cryptocurrency price prediction and action recommendations can be used as auxiliary indices from a perspective of transactions made within the market and market price adjustments. Through this paper, we also expect that researchers will be able to propose newly calculated input features based on existing research papers. They could be able to propose brand new methods to improve the performance of prediction models.
Although the proposed method exhibited higher performance than the existing method, it only focused on the maximum profit that could be made in a single day. Therefore, there is a limitation that a period longer than one day was not considered. To make recommendations by considering a wider period of time, research needs to be conducted to improve the performance of interval prediction methods, which reflect information from the distant future. However, the accuracy of interval prediction is very low, and most studies on interval prediction remain extremely inadequate. For example, most existing methods only predict the price for the following day [
44]. Therefore, we plan to conduct a study to improve the performance of interval prediction methods, which predict prices in the more distant future, such as three or seven days or one month. Moreover, based on existing research on interval prediction research and the results of the present work, we expect to further advance the state of the art with a deep learning model designed to recommend actions that cryptocurrency clients should take to maximize their profit over a longer period of time.


