Article

BTENet: Back-Fat Thickness Estimation Network for Automated Grading of the Korean Commercial Pig

1
Department of Bio-AI Convergence, Chungnam National University, Daejeon 305-764, Korea
2
Department of Computer Science & Engineering, Chungnam National University, Daejeon 305-764, Korea
3
Division of Animal and Dairy Science & Engineering, Chungnam National University, Daejeon 305-764, Korea
4
Korea Institute for Animal Products Quality Evaluation, Daejonchungnam Branch Office, Daejeon 34070, Korea
*
Authors to whom correspondence should be addressed.
Electronics 2022, 11(9), 1296; https://doi.org/10.3390/electronics11091296
Submission received: 29 March 2022 / Revised: 18 April 2022 / Accepted: 18 April 2022 / Published: 19 April 2022
(This article belongs to the Topic Machine and Deep Learning)

Abstract

:
For the automated grading of the Korean commercial pig, we propose deep neural networks called the back-fat thickness estimation network (BTENet). The proposed BTENet contains segmentation and thickness estimation modules to simultaneously perform a back-fat area segmentation and a thickness estimation. The segmentation module estimates a back-fat area mask from an input image. Through both the input image and estimated back-fat mask, the thickness estimation module predicts a real back-fat thickness in millimeters by effectively analyzing the back-fat area. To train BTENet, we also build a large-scale pig image dataset called PigBT. Experimental results validate that the proposed BTENet achieves the reliable thickness estimation (Pearson’s correlation coefficient: 0.915; mean absolute error: 1.275 mm; mean absolute percentage error: 6.4%). Therefore, we expect that BTENet will accelerate a new phase for the automated grading system of the Korean commercial pig.

1. Introduction

Pork is the most consumed meat in the world and its consumption is growing rapidly on the global meat markets [1]. Korea is one of the most pork-consuming countries in the world. In Korea, a pig grading system has been established to provide quality information of meat products to consumers. This grade is a prime determinant of consumers’ willingness to pay for the pork at markets. Furthermore, the pig grading system encourages pig producers to breed animals with attributes that are desirable to consumers. Therefore, the pig grading system should accurately reflect meat quality.
Figure 1 shows the main traits for grading the Korean commercial pig. The Korean pig grading system has adopted two-stage methods, which sequentially evaluate an initial grade and a final grade. The initial grade is determined based on the carcass weight, sex and back-fat thickness, and then the initial grade is fine-tuned to determine the final score based on the appearance and defects of the pig carcass. In this regard, the initial grade is the primary component for grading the Korean commercial pig. For the initial grade, the carcass weight is measured by the scale on the pig production rail. On the other hand, the back-fat thickness and sex are manually evaluated by human experts. Specifically, the experts use a ruler to measure the back-fat thickness and compare leg/hip shapes for the sex classification. This manual grading is cumbersome and inconvenient, and its results may vary in function of the experts’ skills, preferences, and fatigue. Furthermore, the number of slaughtered pigs in Korea has been steadily increasing every year [2]. In this regard, a rapid and accurate system needs to be developed to evaluate the initial grade of the pig carcass.
To accelerate the pig grading procedures, the Korean government has now authorized the use of an automatic pig grading machine, called VCS2000 [3]. VCS2000 estimates 52 characteristics of the pig carcass from the three images taken from two RGB cameras and one binary camera. However, VCS2000 showed a low performance on the back-fat thickness estimation. AutoFom [4], which has been authorized as the grading system in France, UK, and Hungary, which uses ultrasound machines to predict commercial cut weights in the pig carcasses. Furthermore, Carabús et al. [5] used CT-scanning parameters to predict the fat and lean weights of the pig carcass, and Sun et al. [6] employs fiber optical sensors to detect a lean meat ratio. However, these techniques [4,5,6] need additional equipment for data acquisition.
Deep learning is a good alternative system to solve this problem. With the recent success of deep convolutional neural networks [7,8,9], automated assessment methods have been developed in various fields. For instance, recent works in automated diagnosis train deep neural networks to classify skin lesions [10] and to detect cancer in CT scan images [11]. In pig quality assessment, Fernandes et al. [12] proposed deep neural networks to predict live body weight, back-fat, and muscle depth from top view 3D images. Kvam et al. [13] developed deep neural networks for estimating the intramuscular fat of live pigs from ultrasound images. However, these methods are not suitable for automated assessment system in pork production lines since they require additional imaging equipment, which is too costly.
In the Korean grading system, the sex and back-fat thickness are suitable candidates for adopting deep learning methods. The sex can be simply classified into three classes: boar, female, and barrow, based on existing image classification networks [7,8,9]. However, the back-fat thickness has a scalar value in millimeters which cannot be estimated by classification architectures. In this work, we propose deep convolutional neural networks to estimate the back-fat thickness from the head-side images of a pig carcass. The head-side images include the belly-fat, bones and muscles area as well as the back-fat area. These noisy regions may prevent the networks to analyze the back-fat area for thickness estimation. Therefore, the segmentation process to extract the back-fat area from input images is required for accurate back-fat thickness estimation. Here, we propose a back-fat thickness estimation network (BTENet), which simultaneously performs the back-fat area segmentation and the back-fat thickness estimation. The proposed BTENet includes a segmentation module and an estimation module. The segmentation module is trained to estimate the back-fat area masks from cropped images, and then the estimated segmentation mask is transferred to the thickness estimation module. Through both the cropped image and back-fat area mask, the thickness estimation module predicts a real back-fat thickness in millimeters by effectively analyzing the back-fat area. To train the BTENet, we also built a large-scale pig image dataset, called PigBT. Experimental results validate that the proposed BTENet achieves the reliable thickness estimation (Pearson’s correlation coefficient: 0.915, mean absolute error: 1.275 mm, mean absolute percentage error: 6.4%).

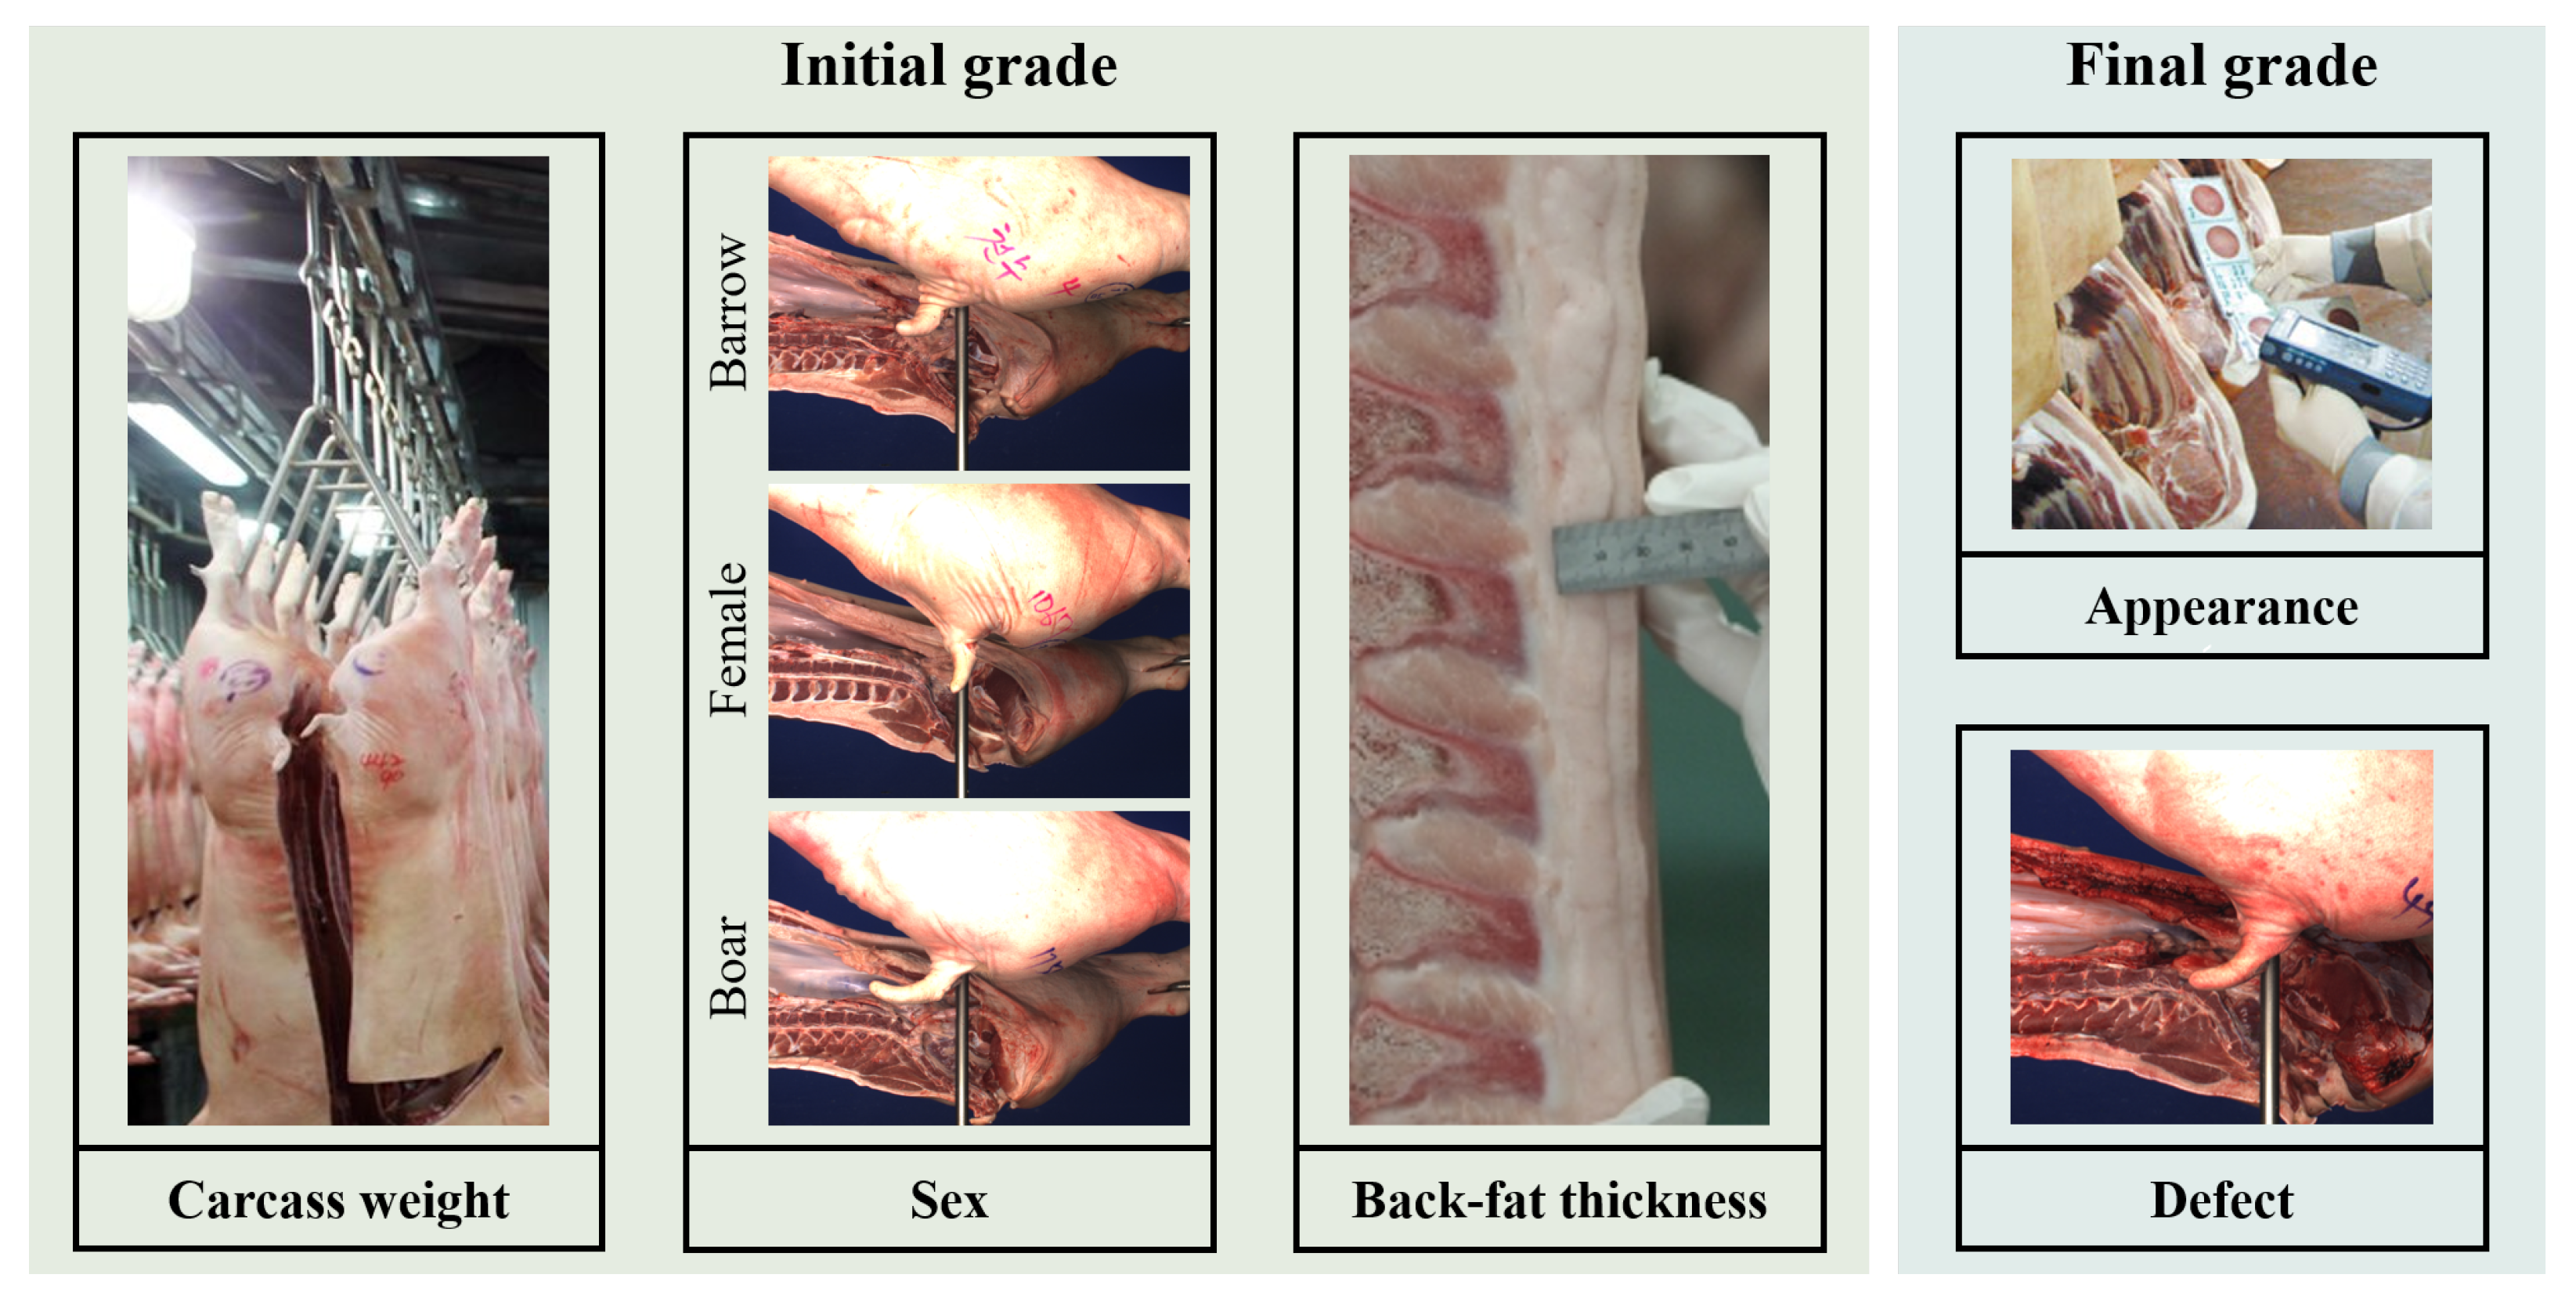
2. Materials and Methods
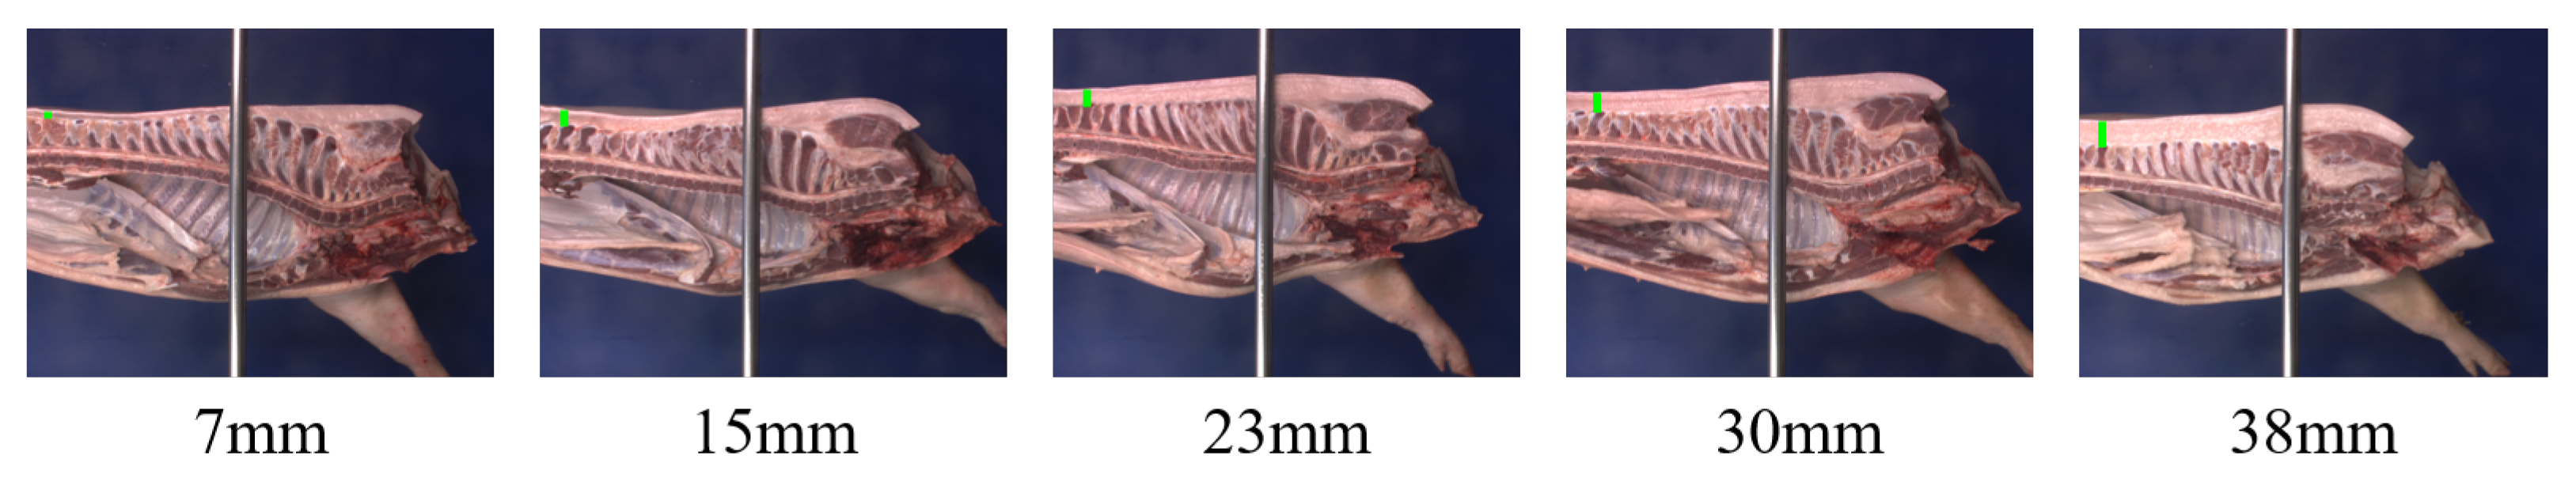
2.1. Dataset

In this work, we built a large-scale image dataset of the Korean commercial pig, called PigBT, which was collected from a commercial slaughter house with the strict photographic calibration described in [14]. Specifically, one RGB camera with a 5 × 3 meter field of view was placed on a slaughter line at a distance of 1.8 meters from the pig carcass. Furthermore, two light sources were placed alongside the camera to insure the proper illumination of carcasses. PigBT includes 3782 head-side images and each image contains two labels: (1) back-fat thickness (mm); and (2) THE segmentation mask of back-fat area. To collect each label, the experts manually annotated a mask for a back-fat area in RGB images and evaluated the back-fat thickness of pig carcasses in production lines. PigBT is split into training (60%), validation (20%), and test (20%) sets. Table 1 shows the summary statistics of PigBT and Figure 2 shows examples of PigBT. Notice that the National Institute of Animal Science (NIAS) in the Rural Development Administration (RDA) of South Korea approved the experimental procedures, and images were taken under public animal health and welfare guidelines.

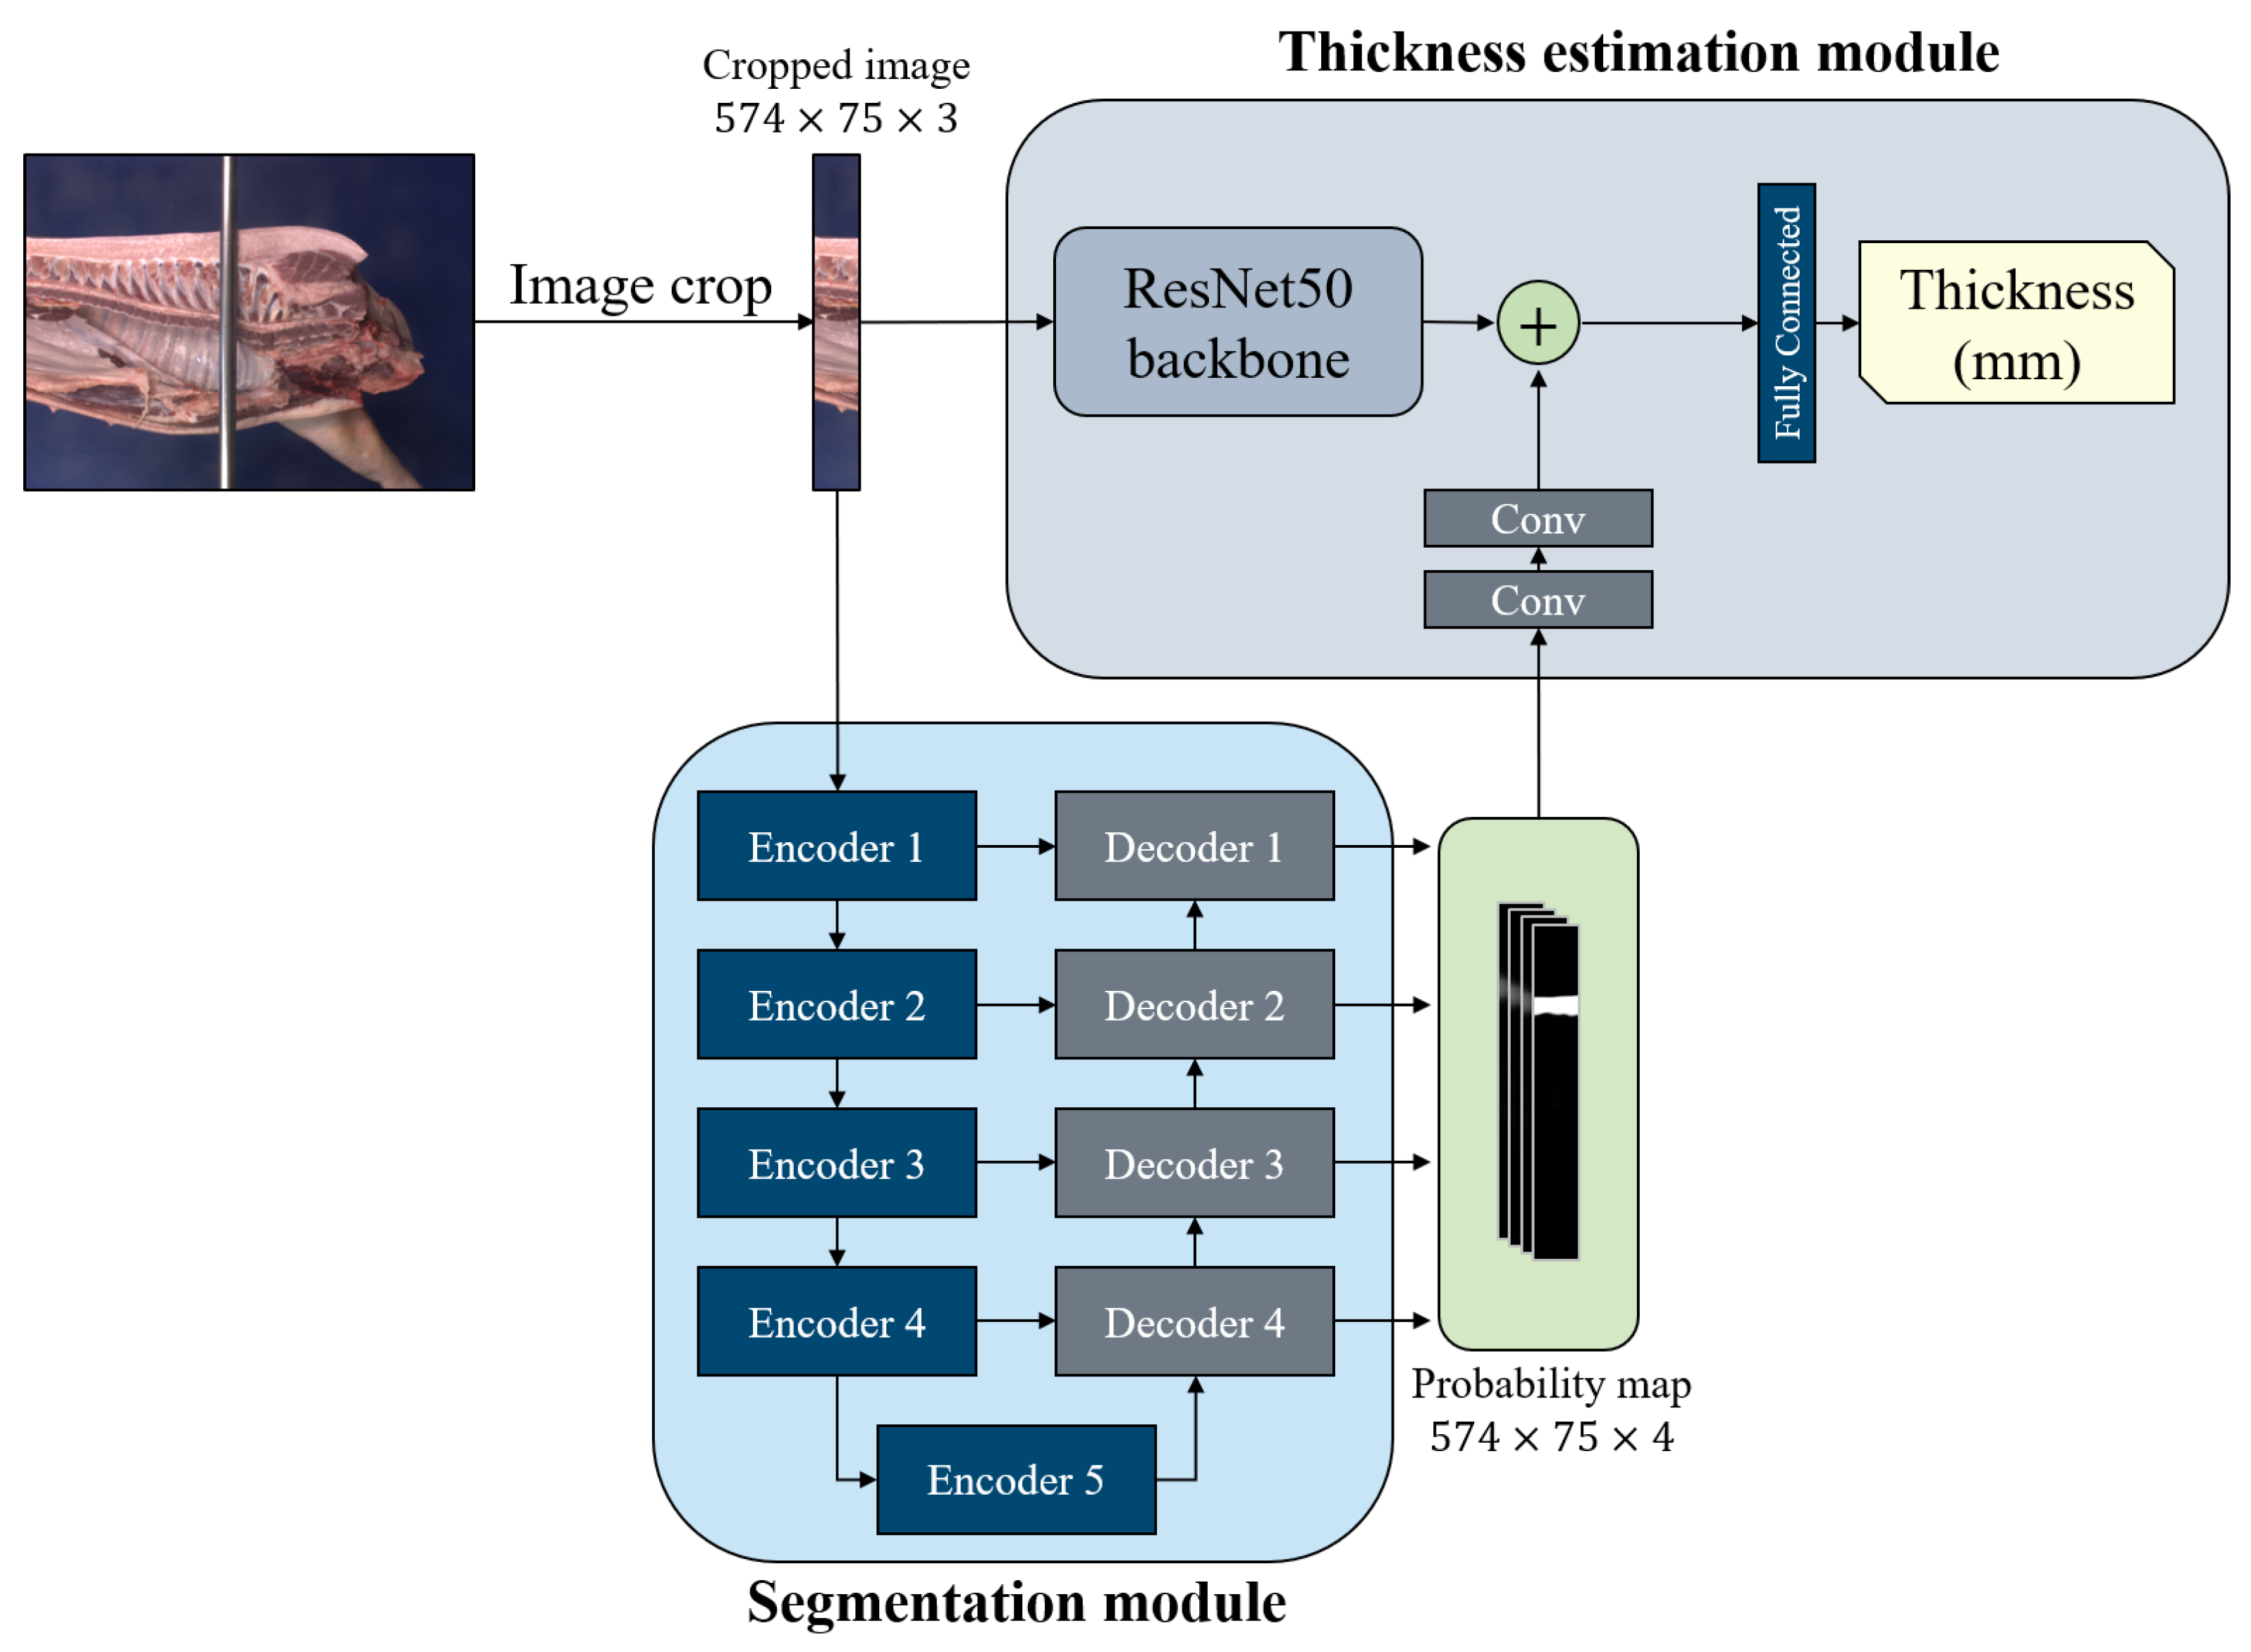
2.2. Back-Fat Thickness Estimation Network

In this paper, we developed the end-to-end back-fat thickness estimation network, called BTENet. Figure 3 shows an overview of the proposed network which includes the segmentation and thickness estimation modules. In the manual back-fat thickness assessment of Korea, human experts measured two back-fat depths in a loin area with a ruler and used a mean of them to the final back-fat thickness of each carcass. We empirically confirmed that these two points are included in the left 75 pixels of the head-side images. Therefore, the proposed network was designed to input RGB images, which are left 75 cropped from the head-side images. The cropped head-side images contain a belly-fat, bones, and muscles area as well as a back-fat area. These noisy regions often degrade a back-fat thickness estimation accuracy. Therefore, we developed the segmentation module to segment out the back-fat area from the cropped images. From the cropped image and segmentation mask, the thickness estimation module predicted a real back-fat thickness in millimeters.
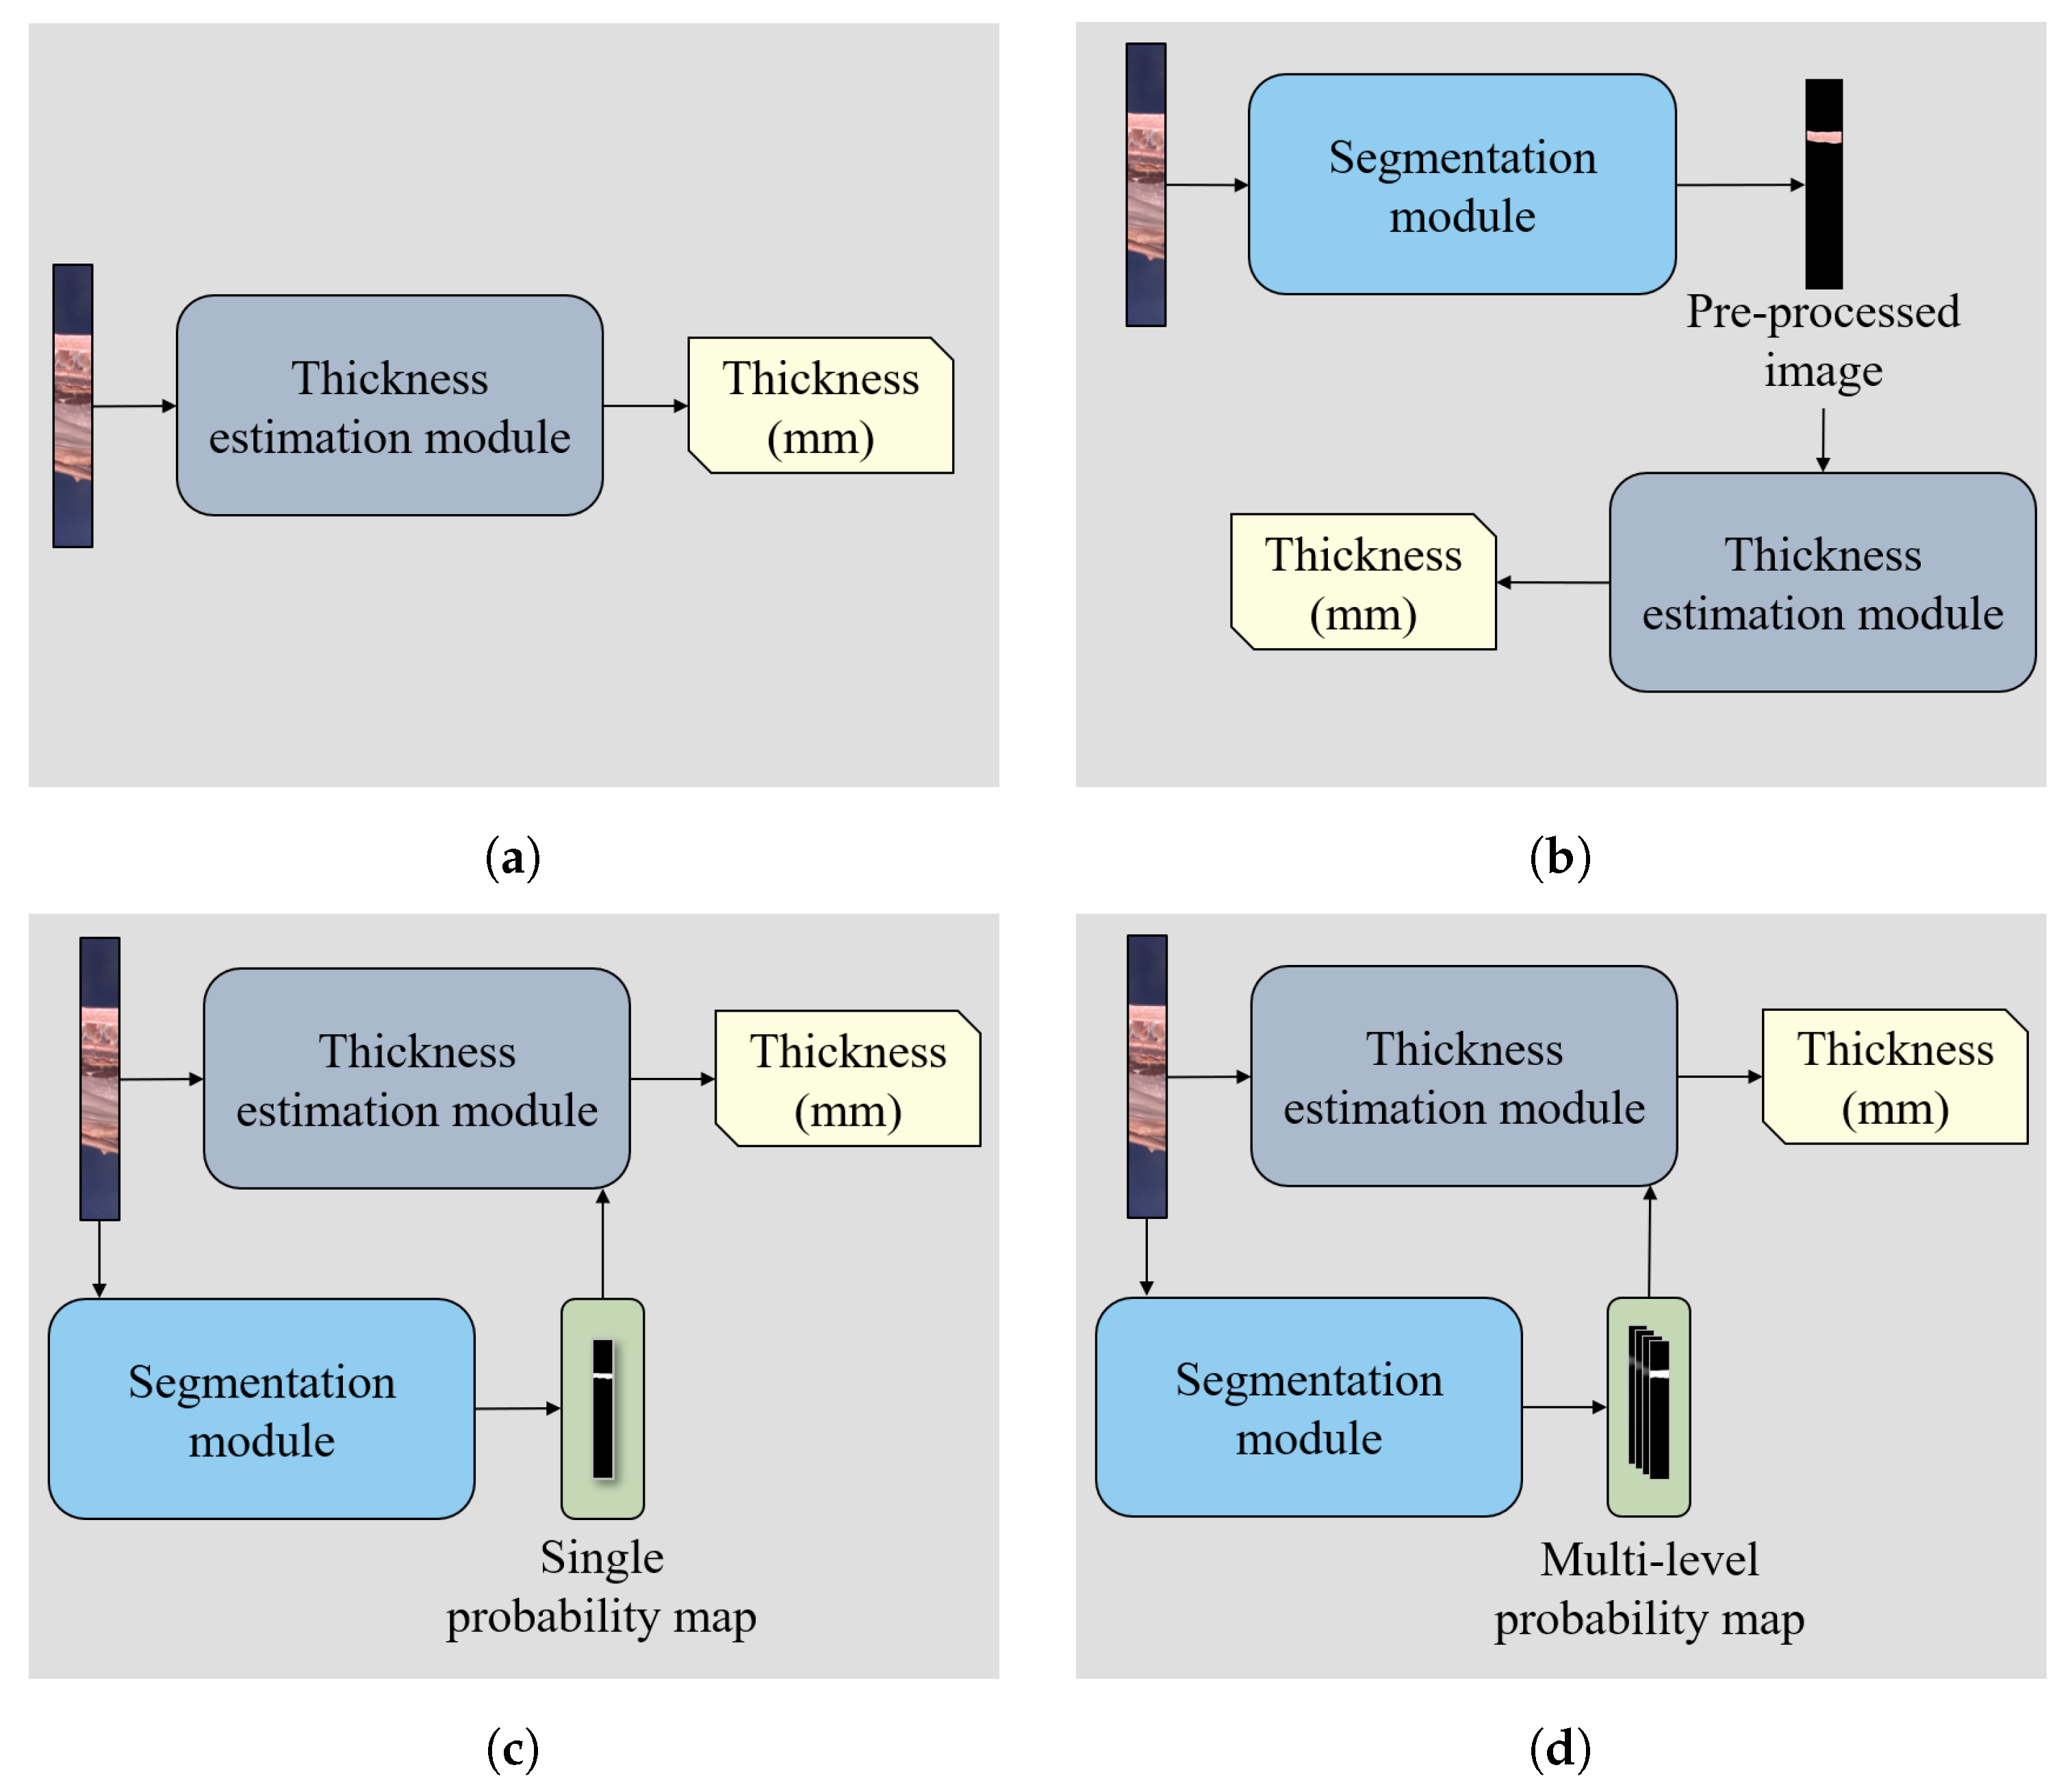
  • Segmentation module: To construct the segmentation module, we employed the encoder–decoder structure in U-Net [15]. Specifically, the segmentation module consists of five encoder blocks and four decoder blocks. Each encoder block has two 3 × 3 convolution layers with ReLU activation. Furthermore, except for the last encoder block, each encoder performed 2 × 2 max pooling operation with stride 2 to extract a high-level context for segmentation. Each decoder block takes two inputs: the output of the previous decoder block and the intermediate feature of the encoder. This makes the first input have the same size as the second input through the 2 × 2 upsampling operation, and then concatenates the upsampled first input and the second input along the channel dimension. Then, the decoder block produces an output through two 3 × 3 convolution layers with ReLU activation and 2 × 2 upsampling operation. Four decoder blocks sequentially predict a probability map of the back-fat area. To transfer information on the back-fat area to the thickness estimation module, the segmentation module yielded multi-scale segmentation masks. The output of each decoder block was transformed to the probability map ranging from 0 to 1 through one 1 × 1 convolution layer with sigmoid function. A total of four segmentation masks was interpolated to the size of the input cropped image 574 × 75 × 1 and concatenated by its channel dimension. To this end, the concatenated probability map 574 × 75 × 4 was transferred to the thickness estimation module. With the multi-level probability map, the thickness estimation module can extract a feature of back-fat area in various resolutions. For training BTENet and evaluating its segmentation performance, we only use the probability map of the last decoder block as the final segmentation mask.
  • Thickness estimation module: The thickness estimation module takes two inputs: the cropped image and multi-level probability map from the segmentation module. It extracts cropped image features throughout backbone networks. Here, we use ResNet50 [7] to the backbone networks. The probability map is transformed to the back-fat area features through two 3 × 3 convolution layers with ReLU activation and a global average pooling. Both the cropped image features and back-fat area features are concatenated and transferred to the final fully connected layer, which yields a scalar corresponding to the back-fat thickness of the input image.

2.3. Implementation Details

Each cropped head-side image contains two labels: (1) back-fat thickness t i and (2) back-fat area mask M i . Let t ^ i and M ^ i denote the estimated back-fat thickness and area mask, respectively. Then, the loss function for training BTENet is defined as
L ( t i , t ^ i , M i , M ^ i ) = λ L seg ( M i , M ^ i ) + L te ( t i , t ^ i )
where λ is a balancing hyper-parameter, which is set to 2.5. The segmentation loss L seg ( M i , M ^ i ) is the pixel-wise binary cross-entropy between M i and M ^ i . Furthermore, the thickness estimation loss L te ( t i , t ^ i ) is defined as the mean squared error between t i and t ^ i .
To train BTENet, we set an initial learning rate to 10 4 and reduce it by half every 30 epochs. The training is iterated for 100 epochs with a batch size 16 on RTX A6000 GPU. We employed Adam optimizer [16] to minimize the loss function. We determine the balancing hyper-parameter λ in (1) using the validation set. Furthermore, we determined network parameters, which achieve the best performance on the validation set.

3. Experimental Results

3.1. Quantitative Results

We use the test set in PigBT for the evaluation of BTENet. BTENet consists of the two modules: the segmentation module and thickness estimation module. For a metric of the segmentation module, we adopt the intersection over union (IoU). IoU, which is the most commonly used metric in a segmentation task, as a measure of overlapping between the predicted back-fat area mask and its ground-truth mask. For metrics of the thickness estimation module, we use three metrics, namely the Pearson’s correlation coefficient (Corr), mean absolute error (MAE) and mean absolute percentage error (MAPE) between the estimated back-fat thickness and actual back-fat thickness. Corr is the most common measure of linear correlation between the predicted values and true values since it can yield a normalized score between −1 and 1. MAE can represent an intuitive error of the estimated thickness in millimeters. On the other hand, MAPE is a measure of the relative error of the estimated thickness depending on the actual thickness.
In order to validate the effectiveness of the segmentation process, we also performed an ablation study as in Figure 4. First, we excluded the segmentation module from BTENet (S1); second, we separately trained the segmentation module and the thickness estimation module. Using segmentation results, we obtained pre-processed images by the remaining back-fat area only as in Figure 4b. Then, the pre-processed images were used as inputs of the thickness estimation module for both the training and test (S2). Third, only the single probability map from the last decoder of the segmentation module is transferred to the thickness estimation module (S3). Finally, we compare these three models with the proposed BTENet (S4). Table 2 shows the performance of four different scenarios. In the comparison between S1 and S2, we observe that the segmentation process significantly improves the thickness estimation performance. Furthermore, the multi-level probability maps (S4) outperforms the single probability map (S3) in terms of MAE (−0.042 mm), MAPE (−0.2%), and Corr (+0.004). Compared to S1, the proposed BTENet (S4) markedly decreased MAE (−0.569 mm) and MAPE (−2.9%) while increasing Corr by convincing margins of +0.082.
We also compare BTENet with state-of-the-art methods in the image classification [7,8,9,17]. In this study, all these methods directly estimate the back-fat thickness from the input cropped images without the segmentation module. Table 3 shows the quantitative comparison of BTENet with the state-of-the-art methods on PigBT. We can see that BTENet achieves superior results than the previous image classification networks. This indicates that the proposed BTENet, which explores the multi-level segmentation contexts, and is effective for the thickness estimation.

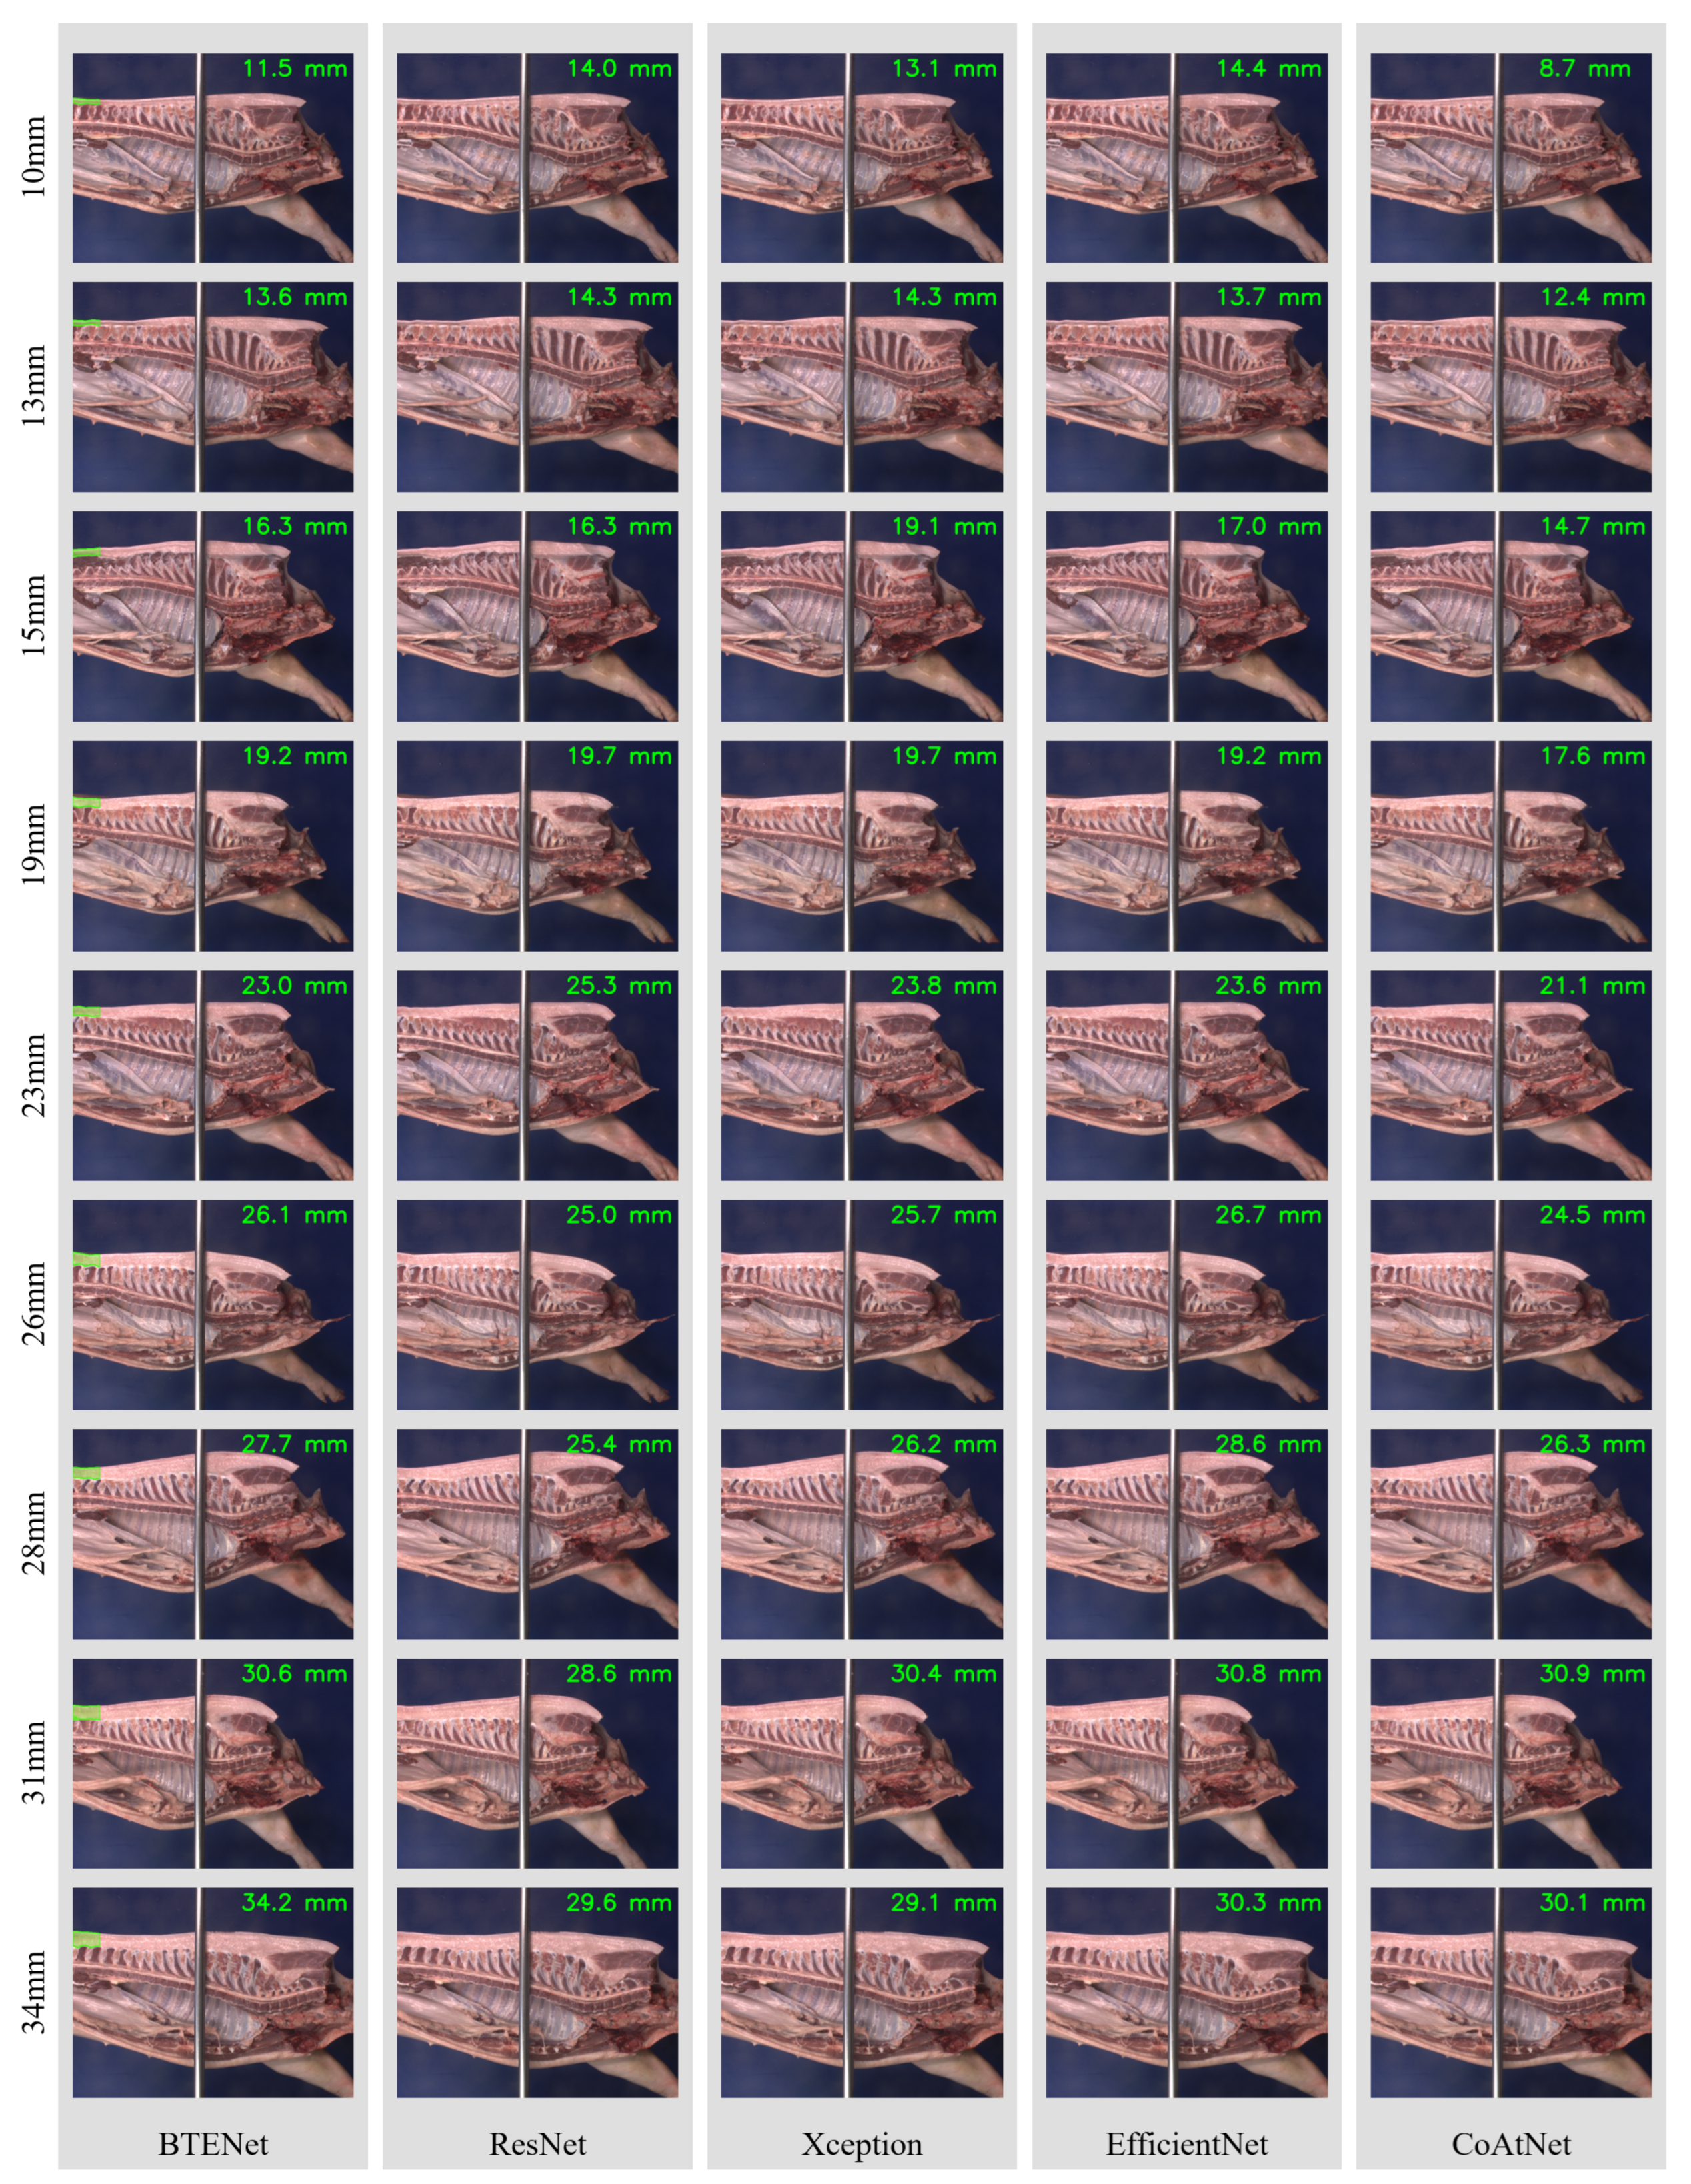
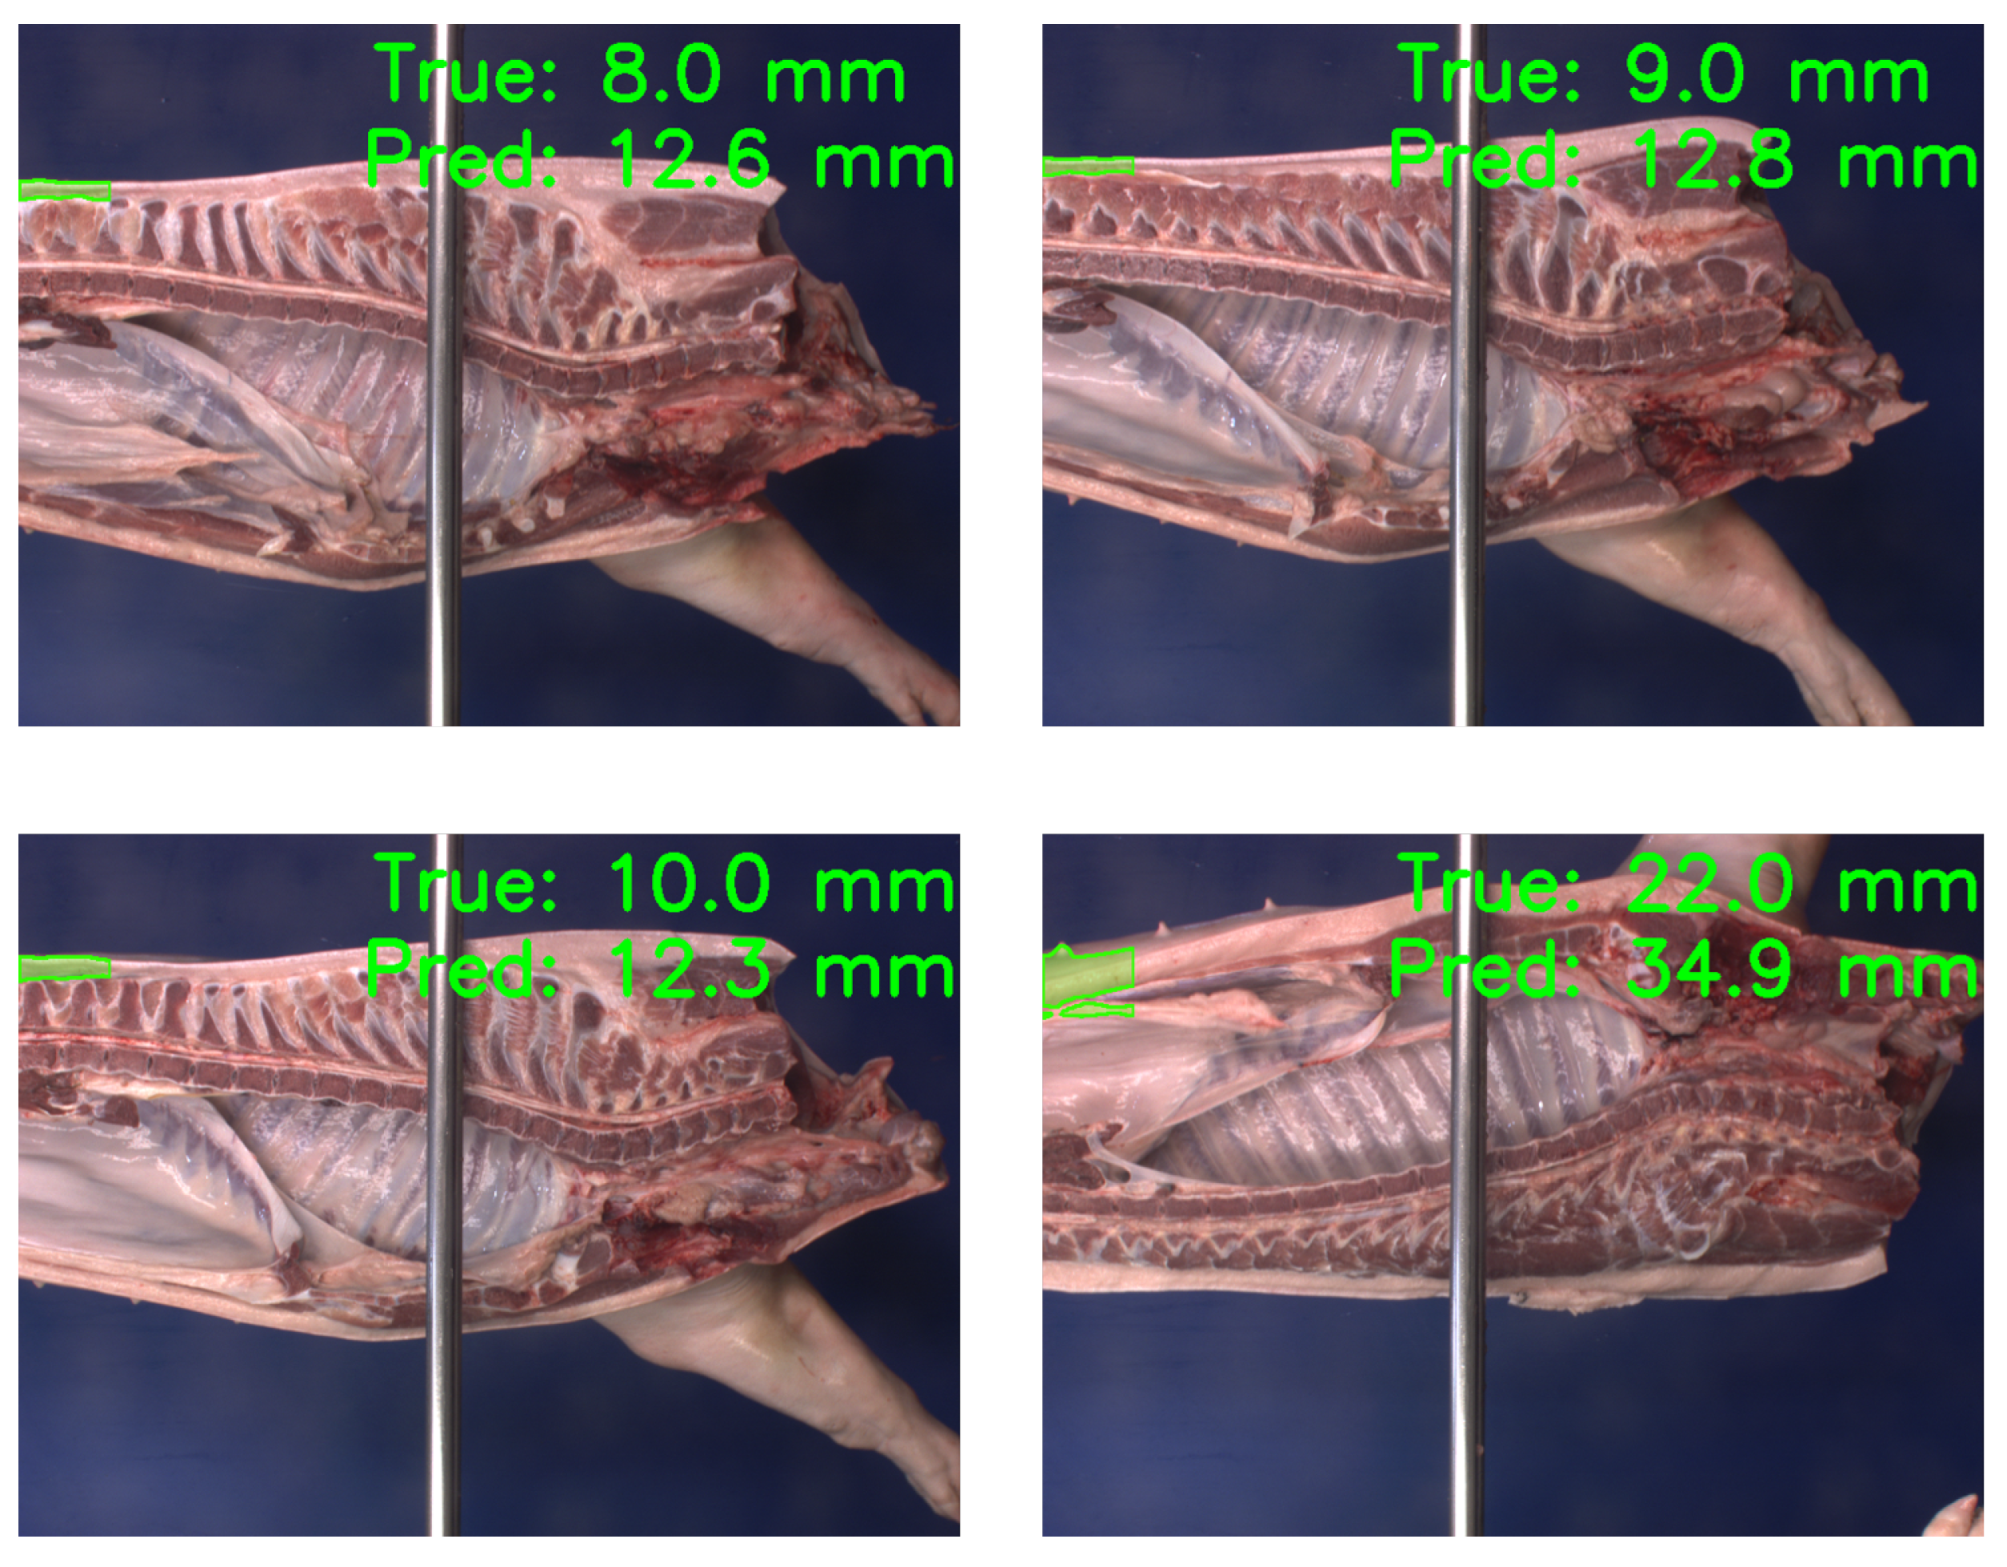
3.2. Qualitative Results

Figure 5 illustrates the qualitative comparison of BTENet with other image classification networks. As shown in Figure 5, BTENet faithfully divides back-fat area from backgrounds in various range of thickness (in the figure, 10 mm ∼ 34 mm). Compared to other methods, BTENet yields a more accurate back-fat thickness estimation since the segmentation module transfers effective features to the thickness estimation module.
Figure 6 shows failure examples of the proposed BTENet. In Figure 6, we observe that BTENet yields inaccurate estimation results for excessively thin back-fat. Furthermore, BTENet produces incorrect estimation and segmentation results when the carcass is hanging reversed due to the congested environment of pig production lines.

4. Discussion

In the Korean grading system, the back-fat thickness is essential for obtaining initial grades. For the back-fat thickness estimation, we develop BTENet, which includes the segmentation module to improve the estimation performance. In the experimental results, we demonstrated that the segmentation results improve the back-fat thickness estimation for the automated pig grading. Figure 7 shows the initial grades in the Korean grading system according to the carcass weight and back-fat thickness. ‘A’ is a higher grade than ‘B’. As in the figure, the back-fat thickness gap between ‘A’ and ‘B’ is only a margin of 2 mm (17 mm–15 mm) in the low thickness case. In this case, a margin of 0.5 mm or even less may cause incorrect grading results. Therefore, the segmentation module is worthwhile in BTENet, considering the 0.569 mm reduction in terms of MAE. Furthermore, the segmentation module makes BTENet yield the multi-task outputs which contain the back-fat thickness and back-fat area mask. This can visualize the discriminative regions for thickness estimation, as in Figure 5, which can be interacted with human judgment.
Even though BTENet shows the high performance on the PigBT test set, it still confuses estimating the thin back-fat. Thus, in the future, it will be important to modify the current training algorithm to take into account the thin back-fat. This can be achieved by adding a weighted loss to thin back-fat images during training phases. Furthermore, BTENet fails to estimate a reliable thickness of a reversed carcass hanging due to the congested environment of slaughter house. Therefore, it remains the task of future works to incorporate a process of determining whether the carcass is hanging reversed or not. In this study, we tested BTENet on PigBT, collected with the strict photographic calibration. To validate the flexibility of the proposed networks, it will need to be evaluated at different conditions, such as illumination and resolution in a further study. In addition, for the fully automated pig grading system, it is also a future research issue to develop additional networks to estimate various traits such as color, texture, and defects.

5. Conclusions

In this work, we proposed the deep learning method for the back-fat thickness estimation of the Korean commercial pigs. The proposed BTENet simultaneously performs the back-fat area segmentation and thickness estimation from the input head-side images. We also built a large-scale pig image dataset, called PigBT. Experimental results demonstrated the fact that BTENet provides a reliable performance on the PigBT test set. Therefore, we expected that the proposed method would be a good solution for the automated pig grading system in Korea.

Author Contributions

Conceptualization, S.H.L.; data curation, M.L. and W.P.; formal analysis, J.-H.B. and H.-J.L.; methodology, Y.J.K. and Y.-K.K.; resources, J.H.L.; software, H.-J.L.; writing—original draft, H.-J.L.; writing—review and editing, Y.J.K. and S.H.L. All authors have read and agreed to the published version of the manuscript.

Funding

This work was supported by the research fund of Chungnam National University.

Data Availability Statement

Restrictions apply to the availability of the full image data. Full image data are available from Hyo-Jun Lee (gywns6287@gmail.com) with the permission of Korea Institute for Animal Products Quality Evaluation. The code and example data are available at https://github.com/gywns6287/Automated_grading_of_Korean_comeerical_pig, accessed on 26 March 2022.

Acknowledgments

We acknowledge the Korea Institute for Animal Products Quality Evaluation for providing images of Korean commercial pig.

Conflicts of Interest

The authors declare no conflict of interest.

References

  1. Oh, S.H.; Whitley, N.C. Pork production in China, Japan and South Korea. Asian-Australas. J. Anim. Sci. 2011, 24, 1629–1636. [Google Scholar] [CrossRef]
  2. Korean Statistical Information Service. Livestock Statistics Survey. Available online: https://kosis.kr/ (accessed on 6 December 2021).
  3. Kim, J.; Han, H.D.; Lee, W.Y.; Wakholi, C.; Lee, J.; Jeong, Y.B.; Bae, J.H.; Cho, B.K. Economic analysis of the use of VCS2000 for pork carcass meat yield grading in Korea. Animals 2021, 11, 1297. [Google Scholar] [CrossRef] [PubMed]
  4. Brøndum, J.; Egebo, M.; Agerskov, C.; Busk, H. On-line pork carcass grading with the autofom ultrasound system. J. Anim. Sci. 1998, 76, 1859–1868. [Google Scholar] [CrossRef] [PubMed]
  5. Carabús, A.; Sainz, R.D.; Oltjen, J.W.; Gispert, M.; Font-i Furnols, M. Predicting fat, lean and the weights of primal cuts for growing pigs of different genotypes and sexes using computed tomography. J. Anim. Sci. 2015, 93, 1388–1397. [Google Scholar] [CrossRef] [PubMed]
  6. Sun, Z.; Leng, S.; Ma, W.; Xu, Q.; Xie, X. Method for detection of the lean meat ratio in pork carcass based on fiber optic sensor. MATEC Web. Conf. 2017, 95, 14009. [Google Scholar] [CrossRef] [Green Version]
  7. He, K.; Zhang, X.; Ren, S.; Sun, J. Deep residual learning for image recognition. In Proceedings of the IEEE Conference on Computer Vision and Pattern Recognition, Las Vegas, NV, USA, 30 June 2016; pp. 770–778. [Google Scholar]
  8. Chollet, F. Xception: Deep learning with depthwise separable convolutions. In Proceedings of the IEEE Conference on Computer Vision and Pattern Recognition, Honolulu, HI, USA, 21–26 July 2017; pp. 1251–1258. [Google Scholar]
  9. Tan, M.; Le, Q. Efficientnet: Rethinking model scaling for convolutional neural networks. In Proceedings of the International Conference on Machine Learning, Long Beach, CA, USA, 10–15 June 2019; pp. 6105–6114. [Google Scholar]
  10. Tschandl, P.; Sinz, C.; Kittler, H. Domain-specific classification-pretrained fully convolutional network encoders for skin lesion segmentation. Comput. Biol. Med. 2019, 104, 111–116. [Google Scholar] [CrossRef] [PubMed]
  11. Alakwaa, W.; Nassef, M.; Badr, A. Lung cancer detection and classification with 3D convolutional neural network (3D-CNN). Lung Cancer 2017, 8, 409. [Google Scholar] [CrossRef] [Green Version]
  12. Fernandes, A.F.; Dórea, J.R.; Valente, B.D.; Fitzgerald, R.; Herring, W.; Rosa, G.J. Comparison of data analytics strategies in computer vision systems to predict pig body composition traits from 3D images. J. Anim. Sci. 2020, 98, skaa250. [Google Scholar] [CrossRef] [PubMed]
  13. Kvam, J.; Kongsro, J. In vivo prediction of intramuscular fat using ultrasound and deep learning. Comput. Electron. Agric. 2017, 142, 521–523. [Google Scholar] [CrossRef]
  14. Lohumi, S.; Wakholi, C.; Baek, J.H.; Do Kim, B.; Kang, S.J.; Kim, H.S.; Yun, Y.K.; Lee, W.Y.; Yoon, S.H.; Cho, B.K. Nondestructive estimation of lean meat yield of South Korean pig carcasses using machine vision technique. Korean J. Food Sci. Anim. Resour. 2018, 38, 1109. [Google Scholar] [CrossRef] [PubMed] [Green Version]
  15. Ronneberger, O.; Fischer, P.; Brox, T. U-net: Convolutional networks for biomedical image segmentation. In Proceedings of the International Conference on Medical Image Computing and Computer-Assisted Intervention, Strasbourg, France, 27 September–1 October 2015; pp. 234–241. [Google Scholar]
  16. Kingma, D.P.; Ba, J.L. Adam: A method for stochastic gradient descent. In Proceedings of the ICLR: International Conference on Learning Representations, San Diego, CA, USA, 7–9 May 2015; pp. 1–15. [Google Scholar]
  17. Dai, Z.; Liu, H.; Le, Q.; Tan, M. Coatnet: Marrying convolution and attention for all data sizes. Adv. Neural Inf. Process. Syst. 2021, 34, 3965–3977. [Google Scholar]
Figure 1. Main traits for grading the Korean commercial pig.
Electronics 11 01296 g001
Figure 2. Examples of PigBT with head-side images and back-fat thickness labels. The back-fat thickness is marked in green.
Electronics 11 01296 g002
Figure 3. Architecture of BTENet.
Electronics 11 01296 g003
Figure 4. Four different scenarios for the ablation study. (a) S1: BTENet without the segmentation module (only thickness estimation module); (b) S2: Thickness estimation module with pre-processed input images; (c) S3: BTENet with a single probability map; and (d) S4 (proposed model): BTENet with multi-level probability maps.
Electronics 11 01296 g004
Figure 5. Qualitative comparison of the PigBT test set of different approaches. Text on the left side represents a ground-truth back-fat thickness. A top-right number (green text) in each image denotes an estimated back-fat thickness. The estimated back-fat area of BTENet is delineated in green.
Electronics 11 01296 g005
Figure 6. Failure examples of BTENet.
Electronics 11 01296 g006
Figure 7. Initial grades in the Korean grading system according to the carcass weight and back-fat thickness. The initial grade is ranked in order of ‘A’, ‘B’, and ‘C’.
Electronics 11 01296 g007
Table 1. Summary statistics of PigBT according to the back-fat thickness (mm).
StatisticTrainValidationTestTotal
Mean21.3921.4121.1921.36
Std4.474.424.264.42
N22697567573782
Std: standard deviation; N: the number of samples.
Table 2. Performance of three different scenarios for the ablation study.
ModelSegmentationThickness Estimation
mIOUCorrMAE (mm)MAPE (%)
S1X0.8331.8449.3
S20.9360.9071.3977.0
S30.9360.9111.3176.6
S4 (Proposed)0.9350.9151.2756.4
Table 3. Quantitative comparison of state-of-the-art methods on PigBT.
ModelCorrMAE (mm)MAPE (%)
ResNet [7]0.8331.8449.3
Xception [8]0.8921.4667.5
EfficientNet [9]0.8741.6018.0
CoAtNet [17]0.9011.6097.7
BTENet0.9151.2756.4
Publisher’s Note: MDPI stays neutral with regard to jurisdictional claims in published maps and institutional affiliations.

