Article

AlexNet Convolutional Neural Network for Disease Detection and Classification of Tomato Leaf

1
Department of Computer Science and Information Engineering, Asia University, Taichung City 413, Taiwan
2
Department of Medical Research, China Medical University Hospital, China Medical University, Taichung City 404, Taiwan
3
Department of Computer Science, Universitas Esa Unggul, Jakarta 11510, Indonesia
4
Department of Mechanical Technology, Universitas Muhammadiyah Yogyakarta, Bantul 55183, Indonesia
5
Department of Computer Science, Electrical Engineering and Mathematical Sciences, Western Norway University of Applied Sciences, 5063 Bergen, Norway
6
School of Intelligent Technology and Engineering, Chongqing University of Science & Technology, Chongqing 401331, China
7
Department of Telecommunication Engineering, National Kaohsiung University of Science and Technology, Kaohsiung City 825, Taiwan
*
Author to whom correspondence should be addressed.
Electronics 2022, 11(6), 951; https://doi.org/10.3390/electronics11060951
Submission received: 28 December 2021 / Revised: 25 February 2022 / Accepted: 15 March 2022 / Published: 18 March 2022

Abstract

:
With limited retrieval of reserves and restricted capability in plant pathology, automation of processes becomes essential. All over the world, farmers are struggling to prevent various harm from bacteria or pathogens such as viruses, fungi, worms, protozoa, and insects. Deep learning is currently widely used across a wide range of applications, including desktop, web, and mobile. In this study, the authors attempt to implement the function of AlexNet modification architecture-based CNN on the Android platform to predict tomato diseases based on leaf image. A dataset with of 18,345 training data and 4,585 testing data was used to create the predictive model. The information is separated into ten labels for tomato leaf diseases, each with 64 × 64 RGB pixels. The best model using the Adam optimizer with a realizing rate of 0.0005, the number of epochs 75, batch size 128, and an uncompromising cross-entropy loss function, has a high model accuracy with an average of 98%, a strictness rate of 0.98, a recall value of 0.99, and an F1-count of 0.98 with a loss of 0.1331, so that the classification results are good and very precise.

1. Introduction

Tomatoes grow in almost any moderately dry soil. Nine out of ten farmers grow tomatoes on their farms. One of the efforts in the cultivation of tomato plants is the prevention of diseases that attack these plants, which can cause crop failure. However, sometimes farmers and gardeners are not able to manage the growth of the plants properly [1,2]. Diseases of this plant could be recognized by changes in leaves, roots, stems, and seeds. However, the most easily observed are the changes that occur in tomato leaves. Often, diseases that attack tomato plants cannot be immediately overcome because they must first be examined and analyzed for the type of disease [3]. Errors in treatment can occur, such as detecting the wrong type of disease, causing the treatment method to be incorrect.
With the development of artificial intelligence (AI) technology, especially deep learning with the discovery of the convolutional neural network (CNN) algorithm, it is hoped that disease identification in tomato plants can be carried out based on changes in leaf appearance [4]. Thus, treatment can be carried out immediately according to the type of disease. CNN is a deep artificial neural network used for image classification, similarity grouping, and presenting object recognition based on picture visualization [2].
The application of CNNs to extract feature characteristics in an interpretable format ensures not only its reliability but also allows validation of model authenticity based on training data without involving individual intuition interference. While some image approaches were used as is, others had to be improved to achieve a limited layer that completely captures the features to produce the appropriate results. In addition, by figuring out the prevented responsiveness maps, we identified several layers that did not contribute to inference and removed these layers from the network, reducing the number of limitations by 75% without affecting classification accuracy [5,6,7,8]. Aside from academic research, deep learning is quite common in sectors with a lot of data.
AlexNet is a deep neural network created in 2012 by Alex Krizhevsky et al. [9]. It was created to classify photos for the ImageNet LSFRC-2010 competition, and it came in the first place [10]. It can also handle multiple GPUs. More and deeper neural networks, such as the outstanding VGG and GoogleLeNet, were proposed following that year. The accuracy rate of its official data model is 57.1%, and the top 1–5 have an accuracy rate of 80.2%. For typical machine learning classification algorithms, this is already impressive. AlexNet is a deep convolutional network designed to handle large-scale colored images (224 × 224 × 3). It has over 62 million trainable parameters in total.
Currently, Android as a platform for mobile phones provides its users with a wealth of smart functions as well as a pleasing appearance. The Android operating system can be used as a multimedia player (music and video). A camera, an accelerometer, a gyroscope, and other sensors are among the hardware included. Furthermore, there are various features that distinguish Android as an operating system worthy of being used by users or developed by developers [11,12]. An Android application with a high-resolution camera could aid in the detection of plant diseases by photographing leaves and sending them off to a cloud server for treatment and detection [13]. However, due to the limited capacity of smartphones, both in terms of memory size and other features, especially cameras, further research is needed in the application of the CNN algorithm in mobile-based applications. An example is implementing CNN with AlexNet architecture in an application that can help tomato farmers identify the type of disease based on the appearance of leaf images from smartphone camera shots. Of course, it requires research related to the CNN architecture that will be used so that the process can still be carried out on smartphone devices.
This motivates the author to create an application that utilizes deep learning embedded in an Android-based application. The goal of this study is to create a mobile-based application that could forecast the disease that a tomato plant would develop based on a picture of the tomato leaves. Thus, this research contributes to:
  • Operating deep learning methods, especially the use of the modified AlexNet algorithm as a classifier algorithm.
  • Create a mobile-based application where the CNN algorithm with a modified AlexNet architecture is embedded and can be installed and used by tomato farmers.
  • Helping tomato farmers easily obtain disease information about the condition of tomato plants based on abnormal leaf appearances through scans or photos of the leaves through an Android-based smartphone platform.
This study is structured as follows: Section 1 discusses artificial intelligence (AI), especially deep learning, the Android platform, and the motivation and contributions of this research. Section 2 explains related work used in this research. Section 3 explains how to develop the application of the AlexNet modified-algorithm-based prediction on an Android platform. Section 4 explains the plot results of the application development, followed by the discussion. Finally, the conclusion of the paper is presented in Section 5.

2. Related Works

To overcome the above problems, authors have developed some respective solutions. In machine learning, different types of characters can be implemented to classify plant diseases [2]. Automatic detection of diseases from leaves in the plant is an important milestone in the land of agriculture. Furthermore, timely detection of plant diseases has a positive impact on crop yield and quality [2,14]. The requirement of CNN models should have many parameters and higher computational expense. In this work, we replace the common convolution with depth convolution or separable convolution, which reduces the number of parameters and computational cost. The patterns used in this study have been prepared on an accessible data source that included 14 different plant species, 38 different categorical disease classes, and healthy plant leaves. The experimental studies were carried out with the help of the Plant Village Dataset, which includes three pathogens: scar, late scourge, and leaves fungus. The research framework applied the figure discovered by the CNN in various processing hierarchies using consideration methods and achieved an overall rate of 98% on the authentication sets in five-fold cross-validation [1,4,15,16,17].
Six categories of data enhancement methods were applied: image inversion, gamma correction, noise injection, principal component analysis (PCA), color enhancement, rotation, and scaling [6]. The proposed model [6] achieved a classification accuracy of 96.46% after extensive simulation. The accuracy of the proposed work is higher than the accuracy of traditional machine learning approaches [6]. The data are gathered from the internet and divided into three sets for use in the experiments: a training set, a validation set, and a test set. The experimental outcome shows that the recommended models could correctly and rapidly identify the eleven types of tomato diseases, as well as segment the locations and shapes of infected areas. For classification, original data of 6208 pictures of four types of leaf disease detection was obtained from the Plant Village dataset [18,19,20]. CNN is regarded as a valuable solution for an extensive kind of image processing briefs, but its architecture is somewhat complex. To reduce the limitations in CNN, a binary explanation coding arrangement based on the improved crossover-based Monarch Butterfly Optimization (ICRMBO) algorithm is proposed [21]. The detection precisions are 86.35%, 99.74%, and 98.54%, respectively, which are greater than those of the deep residual network (ResNet) and the squeeze-and-excitation network (SENet) before enhancement [10,21,22,23].
The method for detecting tomato leaf spots early, developed based on the MobileNetv2-YOLOv3 methods, realizes better stability between accurateness and actual-time detection of gray leaf spots on tomatoes. F1 score and AP value are used to evaluate the detection effect of the models, and the testing is compared with Faster RCNN and SSD methods. The experiment results show that the proposed model’s detection effect is significantly improved [24].

3. Methods

This section explains the steps how to design the Android-based application we proposed, which are generally concentrated on using AI technology to improve the application. Thus, it has been designed according to Human-centered Concept and Machine Learning (HCML) in one or more objects in the lifecycle [25].
Next, for application development, Google Colaboratory (Colab) is used in collaboration with the Python programming language and Integrated Development Environment (IDE), as well as several supporting libraries such as NumPy, Scikit-learn, Pandas, and all of Python’s built-in libraries. All these libraries are used to manipulate and engineer raw data for it to match the requirements for input into the main library. The steps carried out in this research are described in Figure 1.

3.1. Data Preparation and Exploratory Data Analysis (EDA)

A dataset is a collection of interconnected data that may be viewed individually or in combination as well as maintained as a single entity. A data type is how a dataset is arranged. The dataset [26] consists of the image data of tomato plant leaf diseases used in this research. The dataset is obtained from Kaggle and can be accessed through the application programming interface (API). On the kaggle.com webpage [27], any user could easily obtain the “kaggle.json” API files.
By using the Google Collab IDE, the installation of the Kaggle API can be completed and the dataset loaded. The image data of tomato plant leaf diseases are separated into training data totaling 18,345 photos and test data totaling 4585 images. Bacterial spot, Early blight (scar), Late blight, Leaves Mold (fungus), Mosaic virus, Yellow Leaf Curl Virus, Septoria leaf spot, Target spot, Healthy, and Spider mites are among the ten forms of tomato leaf diseases found in the dataset. The specifics of the dataset consisting of tested dataset and trained dataset are presented in Table 1.
Then, the data collected during the exploration phase, EDA, are analyzed. The goal of EDA is to deliver data in such a way that the amount of data in the training and test data, as well as the relationship between variables, can be comprehended. The variables referred to here are the pixel values at the same location of the images that have been transformed along the red, green, and blue axes. The color image is the composite result of the basic colors, such as red, green, and blue.
The process of importing the Python libraries required for EDA is carried out for this purpose. By importing Python libraries and the exploratory data analysis function, the dataset can be divided into two categories of data: training data and valid data, each of which contains 10 different forms of leaf diseases in tomato plants.
The result of the exploratory data analysis function produces a graph which is listed in the form of the total training data set and test data set presented as follows.
Figure 2a shows the total training data from the image of leaf diseases in tomato plants. For example, the most of the data which is came from the yellow leaf curl virus with a total of 1961 images. The least amount of data which is came from bacterial spots with a total of 1702 images. The part of the code for tomato leaf disease detection using CNN [26] is shown in Figure 2b.
Furthermore, Figure 3a shows the total valid images data for the leaf diseases on tomato plants. From the picture, it could be seen that most of the image data came from the yellow leaf curl virus, with a total of 490 images. The least amount of data came from bacterial spots, with a total of 425 images. Figure 3b shows the part of the code for tomato leaf disease detection using CNN [26].

3.2. Making the CNN Model

The CNN model was created with the goal of simulating the biological processes that occur in human vision. Multiple layers were used in the networks, which were organized in different ways to create diverse network topologies. However, it can be divided into three different sorts of layers:
  • Layers of Convolution: The convolution operations are performed using two-dimensional convolution layers using trainable kernels or filters, which may include an optional trainable bias for each kernel. The kernels are moved over the input in “strides” during these convolution operations. The larger the stride, the more space the kernels skipped between each convolution in general. As a result, there were fewer overall convolutions and a smaller output size. A multiplication operation was done between the input section and the kernel for each placement of a given kernel, with the bias summed to the result. It resulted in a feature map with the convolved outcome. To give input for the next layer, the feature maps were usually routed through an activation function. The output size of the feature map was calculated by Equation (1), where N is the input size, F is the kernel size, P is the padding, and S is the stride.
    Output   size = N F + 2 P S + 1
  • Layers of subsampling: Non-trainable kernels or windows are used in two-dimensional subsampling layers to down-sample input characteristics. This often minimizes the amount of features and helps to eliminate a network’s reliance on position. Average pooling and maximal pooling were the two most used kinds of subsampling. The average or maximum of the values present in each kernel to be included in the resultant feature map is computed by both approaches. For subsampling layers, the feature map size was determined in the same way as for the convolution layers. To aid with overall model learning, some implementations of these layers incorporate certain trainable parameters.
  • Fully Connected Layers: CNNs had the only fully connected layers. They are usually found in the last few layers of most CNNs, appearing after multiple convolution and subsampling processes. The fully connected layer has several hidden layers, an activation function, an output layer, and a loss function. Their operations consisted of multiplying their inputs by trainable weight vectors with a trainable bias and summing the outcomes. Activation functions, similar to convolution layers, were used to deliver the output of these layers in the past. To avoid overfitting, CNN has dropped regularization. A dropout will randomly assign a value of 0 to a neuron during the backpropagation and forward learning processes. This is a simple technique so that the neural network does not get caught up in overfitting.
This section describes the CNN design used in this research, which includes dataset separation and CNN learning.
  • Dataset separation
    The obtained dataset is separated into two portions, training data and test data, prior to CNN training. Data that becomes CNN’s learning material is referred to as training data. The training data has a different composition than the test data. Using the 10-fold cross-validation approach, the training data is separated into two subsets, a training subset, and the validation subset, after being loaded into the software. The best CNN model will be reloaded when the learning process is complete to predict from each test dataset.
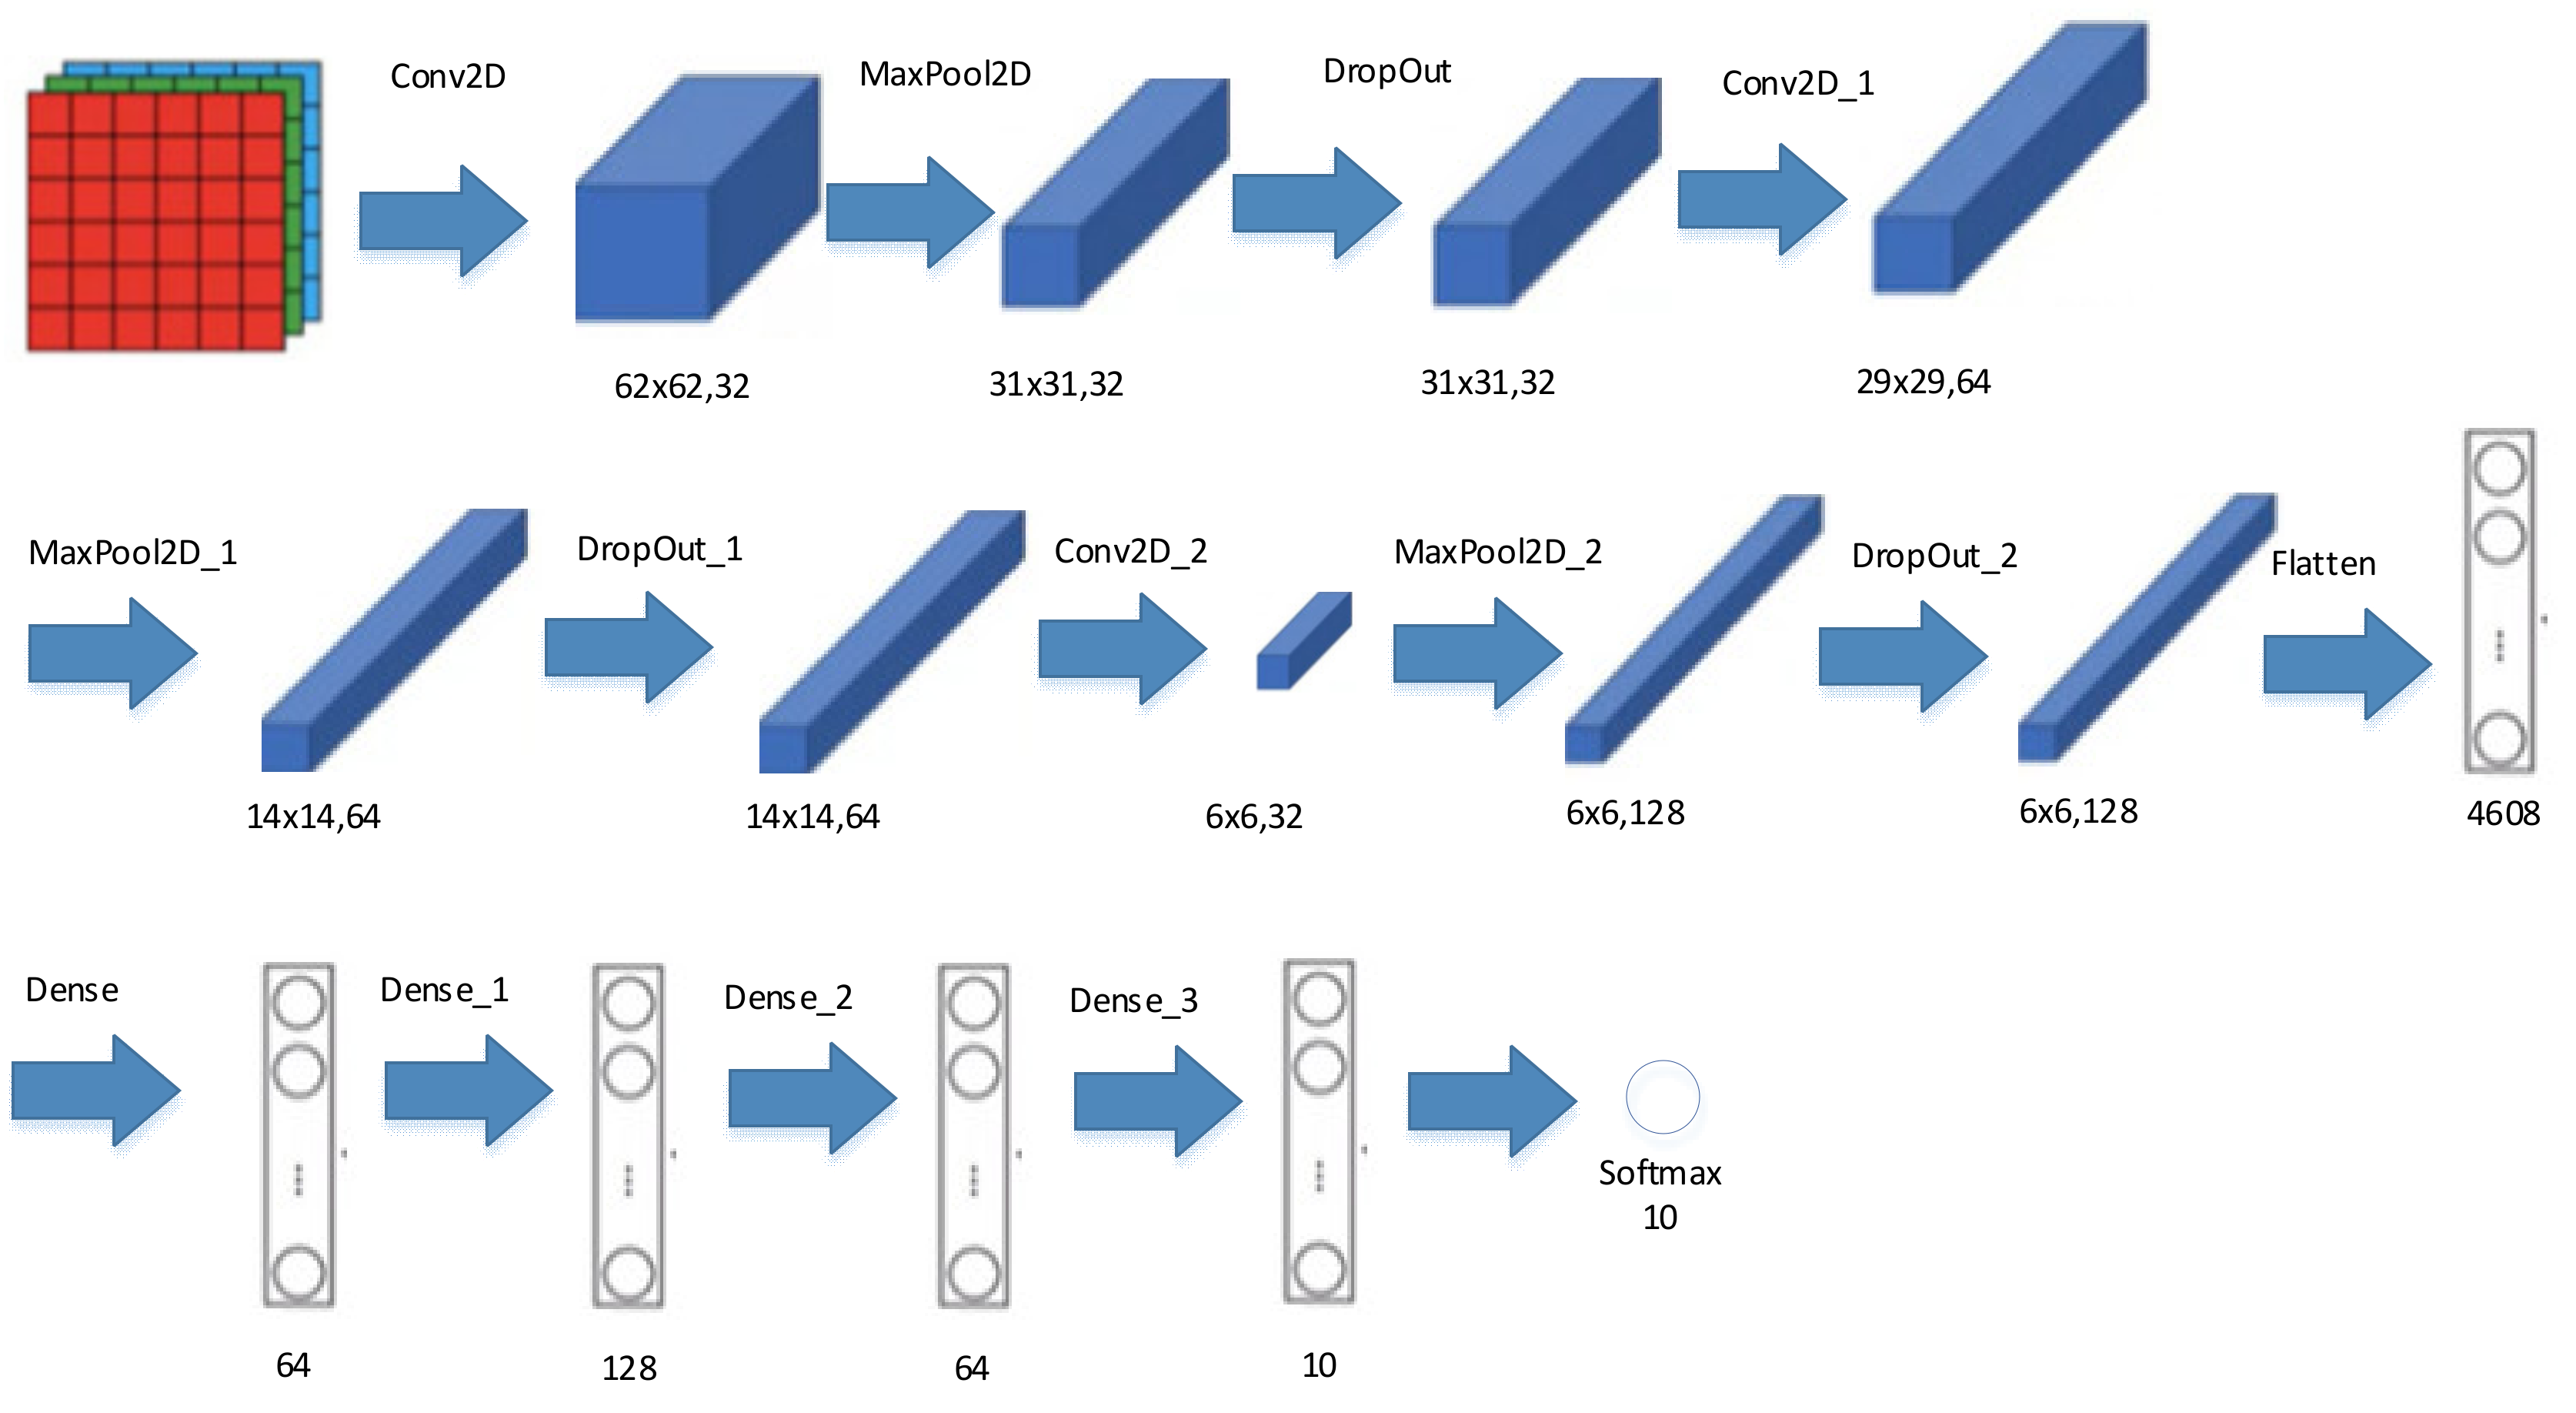
  • CNN learning
    It is crucial to determine which CNN architecture will be employed before starting the learning process. The highest performance will come from an architecture that is appropriate for the dataset. The CNN design used in this study is basically a modification of the AlexNet architecture. The choice of this architecture is based on the good performance of this architecture but also its applicability to platforms with limited capacities, such as Android mobile. The architecture consists of three convolution layers, three fully connected layers, and one output layer. The gradient descent method, which is included in the parameters employed in the neural network, is the most significant algorithm in the learning process (optimizer). The weights of each neuron will be updated using this algorithm. There are many types of optimizers in deep learning, such as adagrad, sgd, adadelta, adam, rmsprop, and others. In this research, the Adam optimizer was used with a learning rate of 0.005. Adaptive moment estimation (Adam) is a method that calculates the adaptive learning rate for each parameter. Adam keeps the decay rate exponentially on the previous gradient mt, similar to momentum:
    m ^ t = m t 1 β 1 t
    v ^ t = v t 1 β 2 t
Equations (2) and (3) show that mt and vt are estimates of the first moment (mean) and second moment (decentralized variance) of each gradient. Then, the final formula for the parameter is updated to:
θ t + 1 = θ t η v t ^ ϵ m t ^
The value of β 1 is 0.9, β 2 is 0.9999, and ε is 10 8 .

3.2.1. The Architecture of CNN Is based on Alex Net Modification

The CNN in this study is based on the AlexNet architecture which has eleven layers. However, in this research, the authors modified by fewer layers. The AlexNet modification architecture in this research is made up of six layers: three convolution layers, three fully related levels, and one output layer [28]. Figure 4 describes the AlexNet architecture modification used in this research.
The size of the input image is 64 × 64 RGB pixels. In the first convolution layer’s filter, which is 32 with a kernel size of 3 × 3, the rectified linear unit (ReLU) initiation operation is applied. ReLU is an activation function, which is shown by Equation (5).
f x = max 0 , x
The activation function is a non-linear transformation performed on the signal. The output of this transformation is then sent from a neuron as an input to the next layer. It runs with a threshold value of 0. If x is less than zero, the value of f(x) is zero; otherwise, the value of f(x) is the value of x itself. The first max pooling layer after an initial Conv2D layer is 2 × 2 with a dropout value of 0.2. The ReLU activation function is also used in the secondary convolution layer, which has 64 filters with a kernel size of 3 × 3.
The first convolution layer’s output and the prior pooling are fed into the second convolution layer. The pooling size in the second max pooling layer is 2 × 2 with a dropout value of 0.2. The ReLU activation function is used in the third convolution layer, which has a filter size of 64 and a kernel size of 3 × 3. The second convolution layer’s output and the prior pooling are fed into the third convolution layer. In the second max pooling layer, the pooling size is also 2 × 2 with a dropout value of 0.4. The ReLU activation function is used in the third convolution layer, which has a filter size of 128 and a kernel size of 3 × 3.
The AlexNet architecture for all datasets up to the flattening layer produces the same number of inputs and outputs. The output of this flatten layer will be used for the input of the dense layer. Table 2 shows the specifications of CNN with the AlexNet architecture used in the implementation of the leaf disease detection system in tomato plants. The neurons in the first hidden layer are 64 units, the second hidden layer are 128 units, and the third hidden layer are 256 units. The activation function used in the hidden layer is ReLu. One output with a hidden layer is as much as the number of existing classes, namely, 10 units with a Softmax activation function.
Softmax serves to distribute learning results or predictions from previous layers in the range [0, 1], with the result of the total value of all elements being 1. The highest value produced by Softmax is the class predicted by CNN. The formula of the Softmax function can be seen in Equation (6), where j is the index of each element z and N is the total number z of all elements. The Softmax equation [29] is translated into Equation (6).
σ z j = e z j k = 1 N e z k ,   j = { 1 , 2 ,   ,   N }  
The architecture employed in this study was determined through multiple experiments based on the number of layers to be used to find the best CNN model.

3.2.2. Implementation of CNN Based on AlexNet Modification Architecture

After the data set is downloaded and the EDA process is carried out, it is continued with the implementation of the modified AlexNet-based CNN Architecture. Because the architecture in this research is a modification of the existing AlexNet model, the authors tried to implement it starting from the use of 1 layer up to 4 layers, which is the most optimal architecture in this CNN model.
The modified AlexNet implementation uses three convolution layers, three fully connected layers, and one output. The functions used in layer convolution are ReLu with dropout values of 0.2, 0.2, and 0.4. Meanwhile, the output layer uses the Softmax activation function [29,30] and the number of the dense layer.
After the model is made, the next step is to compile it with three parameters, namely: optimizer, loss, and metrics. By initializing the Adam optimizer, the implementation of the model compilation is started.
The implementation of the training model is carried out by creating the steps per epoch argument, which contain the value of 75 data points for one epoch. Then there is the batch size argument. The batch size argument is the number of images entered in each training step, which is 128. Finally, there is a validation split argument. A validation split is a validation technique by dividing the data into two parts randomly. The authors make a value of 0.2 for the validation split.

3.3. Prediction and Evaluation Using CNN Model

This step is carried out to measure the ability of the best CNN model to predict from the results of previous training. The CNN model was given input from the test data. For each incoming leaf disease image, the CNN output layer will give the probability of each class using the Softmax activation function formula [29,30]. The result of CNN is an i-th neuron with the highest output probability value prediction.
The next step is to measure the performance of the model. At this stage, the prediction results of the model are compared with ground truth. To make it easier, a confusion matrix was made to calculate the accuracy, precision, recall, and F-measure values for each evaluation model.

3.3.1. Implementation of CNN Prediction Model

Implementation of model predictions is carried out to measure the ability of the training model to produce results. The Keras library has provided a function to predict the model, where its name is predict ( · ) function [31] The input image is loaded with a size of 64 × 64 to be converted into an array. Then, the predicted value and prediction result class are calculated.

3.3.2. Implementation of CNN Evaluation Model

The model is evaluated to determine the loss and accuracy values that are contained in the model. The implementation of the model evaluation is carried out by using the evaluate ( · ) function in Keras libraries [31].
The model prediction outcomes are displayed in the form of accuracy, precision, recall, and F-measure in the confusion matrix generated during the training.

3.4. Converting Model

The final step is to convert the CNN model so that the CNN model becomes an entity that can provide predictive results from live data. Then, the CNN model is converted to Tensorflow Lite [31].
Lite is a set of tools that enable on-device machine learning by helping developers run their models on mobile devices. Before converting, the model is saved first to a directory with the extension h5 format model [31].

3.5. Implementing to Mobile Application

Leaf disease image recognition in tomato plants (image recognition) is implemented into a mobile-based application. This application is implemented using the Android Image Recognition with Deep Learning library, in which there are algorithms and other libraries related to the image recognition process of leaf diseases in tomato plants. The activities carried out at this stage are as follows:
  • Create user interfaces and user experiences.
  • Create use case diagrams.
  • Create activity diagrams.
  • Create class diagrams.

4. Results and Discussion

The data were obtained by photographing the object of tomato leaves suspected of having the disease using a mobile phone as shown in Figure 5 and Figure 6.
Next, by using the input data processing procedure, the trial begins by transforming the RGB image to a vector image. To check for correctness, the classification results were compared with the leaf disease database’s training data on tomato plants. The accuracy, precision, recall, and F-measure values of the classification findings are evaluated as part of the truth test. The epoch value, the optimizer, the batch size, the loss function, and the learning rate used are all parameters used in the pilot scenario in this study. The test parameters are listed in Table 3. Based on various research, the learning rate value of 0.001 was chosen. The best value of the model was found in the learning rate range of 0.0005 to 0.001. Because the dataset employed is a multi-label dataset, definite cross entropy was chosen as a loss function.
Some parts of the test results of cases by using the built application are shown in Table 4.
The performance of the model using the optimizer on each dataset is utilized as the test parameter. The accurateness, precision, recall, and f-measure confusion matrix are used to test the model’s ability. Figure 7 shows the confusion matrix to predict the model.
The description of the confusion matrix on the ability of model to predict the type of disease is shown in Table 5.

5. Conclusions

According to various trials conducted in this research, the preprocessing approach and classification method by using the CNN algorithm with an architecture based on the modified AlexNet can be relied upon to determine the correctness of object image classification. The average accuracy value of 96%, precision value of 98%, recall value of 95%, and F-Measure value of 97% demonstrate this. This algorithm can be embedded in applications that have a mobile-based platform, which in this research uses Android as a platform. This is very appropriate because of the limited memory capacity of Android-based gadgets. On the other hand, the results of this study are expected to be useful for farmers or planters of tomatoes. Users can identify the types of diseases suffered by these plants in a timely manner by uploading photos of the leaves via Android gadgets. In this way, it is possible to determine how to manage disease at an early stage.
More experimental setups and structural modifications to other CNN architectures that perform better than AlexNet, such as GoogLeNet, ResNet, etc., are recommended so that they can be embedded in mobile-based applications in future research to accelerate the training process and generate faster classifications and reliable predictions.

Author Contributions

Conceptualization, H.-C.C., A.M.W. and C.-E.W.; methodology, H.-C.C. and A.M.W.; software, A.M.W. and M.R.; validation, A.M.W. and A.W.; formal analysis, A.M.W. and A.W.; investigation, M.R.; resources, H.-C.C., C.-E.W., J.C.-W.L. and L.C.; data curation, A.M.W., A.W. and M.R.; writing—original draft preparation, A.M.W., H.-C.C. and A.W.; writing—review and editing, H.-C.C., A.M.W., A.W., M.R., J.C.-W.L., L.C. and C.-E.W.; visualization, M.R. and J.C.-W.L.; supervision, H.-C.C., J.C.-W.L., L.C. and C.-E.W. All authors have read and agreed to the published version of the manuscript.

Funding

This work was supported by the Ministry of Science and Technology (MOST), Taiwan, under MOST grant numbers below. 110-2218-E-468-001-MBK, 110-2221-E-468-007, and 110-2218-E-002-044. This work was also supported in part by the Ministry of Education under grant number. I109MD040. This work was supported in part by Asia University, Taiwan, and China Medical University Hospital, China Medical University, Taiwan, under grant nos. ASIA-110-CMUH-22, ASIA-108-CMUH-05, ASIA-106-CMUH-04, and ASIA-105-CMUH-04. This work was also supported in part by Asia University, Taiwan, UMY, Indonesian, under grant no. 107-ASIA-UMY-02. This work was also supported in part by Asia University, Taiwan, UMY, Indonesian, under Grant 107-ASIA-UMY-02. This study was also supported in part by the Universitas Muhammadiyah Yog-yakarta, Indonesia.

Acknowledgments

This work was supported by the Ministry of Science and Technology (MOST), Taiwan, under MOST grant numbers below. 110-2218-E-468-001-MBK, 110-2221-E-468-007, and 110-2218-E-002-044. This work was also supported in part by the Ministry of Education under grant number. I109MD040. This work was supported in part by Asia University, Taiwan, and China Medical University Hospital, China Medical University, Taiwan, under grant nos. ASIA-110-CMUH-22, ASIA-108-CMUH-05, ASIA-106-CMUH-04, and ASIA-105-CMUH-04. This work was also supported in part by Asia University, Taiwan, UMY, Indonesian, under grant no. 107-ASIA-UMY-02. This work was also supported in part by Asia University, Taiwan, UMY, Indonesian, under Grant 107-ASIA-UMY-02. This study was also supported in part by the Universitas Muhammadiyah Yog-yakarta, Indonesia.

Conflicts of Interest

The authors declare no conflict of interest.

References

  1. Agarwal, M.; Singh, A.; Arjaria, S.; Sinha, A.; Gupta, S. ToLeD: Tomato Leaf Disease Detection using Convolution Neural Network. Proc. Comput. Sci. 2020, 167, 293–301. [Google Scholar] [CrossRef]
  2. Hassan, S.; Maji, A.; Jasiński, M.; Leonowicz, Z.; Jasińska, E. Identification of Plant-Leaf Diseases Using CNN and Transfer-Learning Approach. Electronics 2021, 10, 1388. [Google Scholar] [CrossRef]
  3. Chen, J.; Chen, J.; Zhang, D.; Sun, Y.; Nanehkaran, Y.A. Using deep transfer learning for image-based plant disease identification. Comput. Electron. Agric. 2020, 173, 105393. [Google Scholar] [CrossRef]
  4. Karthik, R.; Hariharan, M.; Anand, S.; Mathikshara, P.; Johnson, A.; Menaka, R. Attention embedded residual CNN for disease detection in tomato leaves. Appl. Soft Comput. 2020, 86, 105933. [Google Scholar]
  5. Arya, S.; Singh, R. A Comparative Study of CNN and AlexNet for Detection of Disease in Potato and Mango leaf. In Proceedings of the 2019 International Conference on Issues and Challenges in Intelligent Computing Techniques (ICICT), Ghaziabad, India, 27–28 September 2019; IEEE: Piscataway, NJ, USA, 2019. [Google Scholar]
  6. Geetharamani, G.; Pandian, A. Identification of plant leaf diseases using a nine-layer deep convolutional neural network. Comput. Electr. Eng. 2019, 76, 323–338. [Google Scholar]
  7. Toda, Y.; Okura, F. How convolutional neural networks diagnose plant disease. Plant. Phenom. 2019, 2019, 9237136. [Google Scholar] [CrossRef]
  8. Verma, S.; Chug, A.; Singh, A.P.; Sharma, S.; Rajvanshi, P. Deep learning-based mobile application for plant disease diagnosis: A proof of concept with a case study on tomato plant. In Applications of Image Processing and Soft Computing Systems in Agriculture; IGI Global: Hershey, PA, USA, 2019; pp. 242–271. [Google Scholar]
  9. Krizhevsky, A.; Sutskever, I.; Hinton, G.E. Imagenet Classification with Deep Convolutional Neural Networks. Commun. ACM 2017, 60, 84–90. [Google Scholar] [CrossRef]
  10. Gao, R.; Wang, R.; Feng, L.; Li, Q.; Wu, H. Dual-branch, efficient, channel attention-based crop disease identification. Comput. Electron. Agric. 2021, 190, 106410. [Google Scholar] [CrossRef]
  11. Chen, L.; Wang, J.; Yang, S.; He, H. A Finger Vein Image-Based Personal Identification System with Self-Adaptive Illuminance Control. IEEE Trans. Instrum. Meas. 2016, 66, 294–304. [Google Scholar] [CrossRef]
  12. Chen, L.; Chen, H.-C.; Li, Z.; Wu, Y. A fusion approach based on infrared finger vein transmitting model by using multi-light-intensity imaging. Human-Centric Comput. Inf. Sci. 2017, 7, 35. [Google Scholar] [CrossRef] [Green Version]
  13. Anas, S.; Badhusha, I.; Zaheema, O.T.; Faseela, K.; Shelly, M. Cloud based automated irrigation and plant leaf disease detection system using an android application. In Proceedings of the 2017 International conference of Electronics, Communication and Aerospace Technology (ICECA), Coimbatore, India, 20–22 April 2017; IEEE: New York, NY, USA, 2017. [Google Scholar]
  14. Sethy, P.K.; Barpanda, N.K.; Rath, A.K.; Behera, S.K. Deep feature based rice leaf disease identification using support vector machine. Comput. Electron. Agric. 2020, 175, 105527. [Google Scholar] [CrossRef]
  15. Zhao, S.; Peng, Y.; Liu, J.; Wu, S. Tomato Leaf Disease Diagnosis Based on Improved Convolution Neural Network by Attention Module. Agriculture 2021, 11, 651. [Google Scholar] [CrossRef]
  16. Verma, S.; Chug, A.; Singh, A.P. Application of convolutional neural networks for evaluation of disease severity in tomato plant. J. Discret. Math. Sci. Cryptogr. 2020, 23, 273–282. [Google Scholar] [CrossRef]
  17. Lintas, A.; Rovetta, S.; Verschure, P.F.; Villa, A.E. Artificial Neural Networks and Machine Learning–ICANN 2017. In Proceedings of the 26th International Conference on Artificial Neural Networks, Alghero, Italy, 11–14 September 2017; Proceedings, Part II; Springer: Cham, Switzerland, 2017; Volume 10614. [Google Scholar]
  18. Barbedo, J.G.A. Impact of dataset size and variety on the effectiveness of deep learning and transfer learning for plant disease classification. Comput. Electron. Agric. 2018, 153, 46–53. [Google Scholar] [CrossRef]
  19. Kamal, K.C.; Yin, Z.; Wu, M.; Wu, Z. Depthwise separable convolution architectures for plant disease classification. Comput. Electron. Agric. 2019, 165, 104948. [Google Scholar]
  20. Too, E.C.; Yujian, L.; Njuki, S.; Yingchun, L. A comparative study of fine-tuning deep learning models for plant disease identification. Comput. Electron. Agric. 2019, 161, 272–279. [Google Scholar] [CrossRef]
  21. Nandhini, S.; Ashokkumar, K. Improved crossover based monarch butterfly optimization for tomato leaf disease classification using convolutional neural network. Multimed. Tools Appl. 2021, 80, 18583–18610. [Google Scholar] [CrossRef]
  22. Wang, Q.; Qi, F.; Sun, M.; Qu, J.; Xue, J. Identification of tomato disease types and detection of infected areas based on deep convolutional neural networks and object detection techniques. Comput. Intell. Neurosci. 2019, 2019, 9142753. [Google Scholar] [CrossRef]
  23. Mim, T.T.; Sheikh, M.H.; Shampa, R.A.; Reza, M.S.; Islam, M.S. Leaves Diseases Detection of Tomato Using Image Processing. In Proceedings of the 2019 8th International Conference System Modeling and Advancement in Research Trends (SMART), Moradabad, India, 22–23 November 2019; IEEE: Piscataway, NJ, USA, 2019. [Google Scholar]
  24. Liu, J.; Wang, X. Early recognition of tomato gray leaf spot disease based on MobileNetv2-YOLOv3 model. Plant. Methods 2020, 16, 83. [Google Scholar] [CrossRef]
  25. Kaluarachchi, T.; Reis, A.; Nanayakkara, S. A Review of Recent Deep Learning Approaches in Human-Centered Machine Learning. Sensors 2021, 21, 2514. [Google Scholar] [CrossRef]
  26. Kaustubh, B. Tomato Leaf Disease Detection Tomato Leaf Disease Detection using CNN. Available online: https://www.kaggle.com/kaustubhb999/tomatoleaf (accessed on 21 September 2021).
  27. Ben, A.G. How to use the Kaggle API from Colab. Available online: https://colab.research.google.com/github/corrieann/kaggle/blob/master/kaggle_api_in_colab.ipynb (accessed on 21 September 2021).
  28. Gao, Z.; Shao, Y.; Xuan, G.; Wang, Y.; Liu, Y.; Han, X. Real-time hyperspectral imaging for the in-field estimation of strawberry ripeness with deep learning. Artif. Intell. Agric. 2020, 4, 31–38. [Google Scholar] [CrossRef]
  29. Goodfellow, I.; Bengio, Y.; Courville, A. 6.2.2.3 Softmax Units for Multinoulli Output Distributions; Deep Learning. 2016; MIT Press: Cambridge, MA, USA, 2016; pp. 180–184. ISBN 978-0-26203561-3. [Google Scholar]
  30. Kouretas, I.; Paliouras, V. Hardware implementation of a softmax-like function for deep learning. Technologies 2020, 8, 46. [Google Scholar] [CrossRef]
  31. Warden, P.; Situnayake, D. Tinyml: Machine learning with tensorflow lite on arduino and ultra-low-power microcontrollers, 2019; O’Reilly Media: Sebastopol, CA, USA, 2019; ISBN 978-1-492-05204-3. [Google Scholar]
Figure 1. Flowchart of the steps in this research.
Electronics 11 00951 g001
Figure 2. (a) Graph of Total Training Data. (b) The part of the code for tomato leaf disease detection using CNN [26].
Electronics 11 00951 g002
Figure 3. (a) The image count of each tomato leave disease in testing data. (b) The part of the code for tomato leaf disease detection using CNN [26].
Electronics 11 00951 g003
Figure 4. The AlexNet modification architecture.
Electronics 11 00951 g004
Figure 5. Mobile apps user interface. (a) Welcome page; (b) login page; (c) registry page; (d) home page; (e) disease recognition page; and (f) disease treatment page.
Electronics 11 00951 g005aElectronics 11 00951 g005b
Figure 6. Mobile apps user interface. (a) Disease detection page; (b) shop search page.
Electronics 11 00951 g006
Figure 7. The Confusion Matrix.
Electronics 11 00951 g007
Table 1. The details of tomato diseases in the dataset [26] consisting of tested dataset and trained dataset.
Tomato DiseaseTrained DataTested Data
Bacterial spot1702425
Early blight1921481
Late blight1852464
Leaves Mold1881471
Mosaic virus1791449
Yellow Leaf Curl Virus1962491
Septoria leaf spot1744436
Target spot1827457
Spider mites1741435
Healthy1926481
Total18,3454585
Table 2. AlexNet Architecture.
Layer (Type)Output ShapeParameters
Conv2D(None, 62, 62, 32)896
MaxPooling2D(None, 31, 31, 32)0
Dropout(None, 31, 31, 32)0
Conv2D_1(None, 29, 29, 64)18,496
MaxPooling2D_1(None, 14, 14, 64)0
Dropout_1(None, 14, 14, 64)0
Conv2D_2(None, 6, 6, 32)73,856
MaxPooling2D_2(None, 6, 6, 128)0
Dropout_2(None, 6, 6, 128)0
Flatten(None, 4608)0
Dense(None, 64)294,976
Dense_1(None, 128)8320
Dense_2(None, 64)8256
Dense_3(None, 10)650
Table 3. The Parameters.
Number of Epochs75
OptimizerAdam
Batch size128
Loss functionCategorical cross entropy
Learning rate0.0005
Table 4. Some parts of the test results were outputted from the built application by using the valid dataset [27].
Case 1: Through dealing with the valid testing data, this case is identifyed the tomato with Bacterial Spot disease. The result shows that the accuracy rate equals 0.9999993.
Image with JPG
Size 64 × 64
: Electronics 11 00951 i001
Classification result:Bacterial Spot
Accuracy
Remark
:
:
0.9999993
It matched to the valid data because the accuracy equals to 1.
Case 2: This case is dealing with the valid data in the testing phase for identifying the tomato with Spider mites disease. The result shows that the accuracy rate equals 0.9893751.
Image with JPG
Size 64 × 64
: Electronics 11 00951 i002
Classification result:Spider_mites (with Two-spotted_spider_mites)
Accuracy
Remark
:
:
0.9893751
It matched to the valid data because the accuracy equals to 1.
Case 3: This case is identifyed the tomato with Yellow Leaf Curl Virus disease via dealing with the valid testing data,. The result shows that the accuracy rate equals 0.99838257.
Image whit JPG
Size 64 × 64
: Electronics 11 00951 i003
Classification result:Yellow Leaf Curl Virus
Accuracy
Remark
:
:
0.99838257
It matched to the valid data because the accuracy equals to 1.
Case 4: This case is dealing with the valid data in the testing phase for identifying the tomato with no disease (Healthy). The result shows that the accuracy rate equals 1.
Image with JPG
Size 64 × 64
: Electronics 11 00951 i004
Classification result:Healthy Leaf
Accuracy
Remark
:
:
1
It matched to the valid data because the accuracy equals to 1.
Case 5: This case is identifyed the tomato with Septoria leaf spot disease through dealing with the valid testing data,. The result shows that the accuracy rate equals 1.
Image with JPG
Size 64 × 64
: Electronics 11 00951 i005
Classification result:Septoria leaf spot
Accuracy
Remark
:
:
1
It matched to the valid data because the accuracy equals to 1.
Table 5. Precision, Recall, and F1-Score Values of the Model.
NoDiseasePrecisionRecallF-MeasureAccuracy
1Bacterial Spot0.980.960.970.96
2Early blight0.940.940.94
3Late blight0.950.950.95
4Leaves mold0.980.970.97
5Septoria leaf mold0.950.950.95
6Spider mites0.950.960.96
7Target spot0.930.940.94
8Yellow leaf curl virus0.970.990.98
9Tomato mosaic virus 0.9810.99
10Healthy10.970.98
Publisher’s Note: MDPI stays neutral with regard to jurisdictional claims in published maps and institutional affiliations.

