Article

Approximate Entropy of Spiking Series Reveals Different Dynamical States in Cortical Assemblies

1
Mathematical Biology and Physiology, Department Electronics and Telecommunications, Politecnico di Torino, 10129 Torino, Italy
2
Laboratory of Integrative Physiology, Department of Neuroscience, Universitá di Torino, 10125 Torino, Italy
3
Department of Informatics, Bioengineering, Robotics and Systems Engineering, University of Genova, Via Opera Pia 13, 16145 Genova, Italy
4
National Institute for Nuclear Physics (INFN), 16146 Genova, Italy
*
Author to whom correspondence should be addressed.
Electronics 2022, 11(6), 936; https://doi.org/10.3390/electronics11060936
Submission received: 19 February 2022 / Revised: 15 March 2022 / Accepted: 16 March 2022 / Published: 17 March 2022
(This article belongs to the Special Issue Feature Papers in Computer Science & Engineering)

Abstract

:
Self-organized criticality theory proved that information transmission and computational performances of neural networks are optimal in critical state. By using recordings of the spontaneous activity originated by dissociated neuronal assemblies coupled to Micro-Electrode Arrays (MEAs), we tested this hypothesis using Approximate Entropy (ApEn) as a measure of complexity and information transfer. We analysed 60 min of electrophysiological activity of three neuronal cultures exhibiting either sub-critical, critical or super-critical behaviour. The firing patterns on each electrode was studied in terms of the inter-spike interval (ISI), whose complexity was quantified using ApEn. We assessed that in critical state the local complexity (measured in terms of ApEn) is larger than in sub- and super-critical conditions (mean ± std, ApEn about 0.93 ± 0.09, 0.66 ± 0.18, 0.49 ± 0.27, for the cultures in critical, sub-critical and super-critical state, respectively—differences statistically significant). Our estimations were stable when considering epochs as short as 5 min (pairwise cross-correlation of spatial distribution of mean ApEn of 94 ± 5%). These preliminary results indicate that ApEn has the potential of being a reliable and stable index to monitor local information transmission in a neuronal network during maturation. Thus, ApEn applied on ISI time series appears to be potentially useful to reflect the overall complex behaviour of the neural network, even monitoring a single specific location.

1. Introduction

The electrophysiological activity of neuronal networks reflects the interactions of several neurons and their flux of information, showing complex behaviour at different spatial scales [1]. Such emerging neuronal dynamics can be investigated through Micro-Electrodes Arrays (MEA) that, having electrode dimension comparable to the cell body, record the local electrical activity from few neurons [2]. Using MEAs, the electrophysiological activity can be decoded in terms of spike trains recorded by the electrodes of the array. The first approach to study MEA data consisted in the identification of patterns in the single neuron temporal series [3]. Then, the attention was moved to the synchronization of the spike trains among pairs of neurons [4] and finally towards higher order interactions [5]. However, it is still controversial which is the key to decode the neuronal communication and what is the feature optimized in a fully developed neuronal network [6].
A relatively novel (and controversial [7]) method to analyse neuronal networks exploits the theory of Self-Organized Criticality (SOC), based on the concept of “neuronal avalanches” [8]. The innovation of this approach is the integration of both temporal and spatial information obtained by the MEA system. Neuronal avalanches were defined by binning each electrode time-series with a window of few milliseconds, obtaining a binary map (called frame) marking an electrode as active if showing at least one spike and as inactive otherwise [8]. The lifetime of an avalanche (i.e., the number of consecutive active frames) and its size (i.e., the overall number of active electrodes during it) follow a power-law distribution with a specific exponent. Such a distribution is typical of systems poised at or near criticality, showing the fascinating property of being “scale free”. Criticality is a dynamical equilibrium, which reflects the optimization of the ratio between ancestor and descendant neurons (i.e., neurons that trigger a response and are triggered in the next frame, respectively [9]). The system is said to be either in a critical, sub-critical or super-critical state when this ratio (called branching parameter) is equal, lower, or larger than 1, respectively. Criticality maximizes the information transmission [9]. This property has been investigated by a spatial analysis of the network, which requires a binning of each time-series to identify a single state of the system, with the time window chosen for the analysis being assumed to be the temporal unit of neuronal communication [10].
In this work, we investigate the relationship between complexity (as a measure of information transmission) and criticality, using the maximum temporal resolution of the available time-series and considering each electrode separately. In this way, the local complexity of the neuronal system can be assessed, focusing on a single electrode or, from a biological point of view, on small groups of few neurons.
As an indicator of complexity, we considered the Approximate Entropy (ApEn; [11]), which detects recurrences of temporal patterns in a single electrode recording. ApEn found important applications in the study of biomedical time series [12,13]. Complexity of MEA recordings from cultured neural networks was estimated in terms of either ApEn or sample entropy (SampEn, which is a modification of the definition of ApEn proposed in [14]) in a few works [15,16,17]. ApEn allowed to discriminate among different typical patterns of spontaneous activity (sporadic spikes, tonic spikes, pseudo-bursts and bursts) [17]. Moreover, the complexity of a neural network was found to decrease during maturation [15,16]. However, the approach of the latter two studies leading to this conclusion, being applied to small portions of the raw data (i.e., less than a second), is questionable (as better detailed in the Discussion). In this work, we applied ApEn to the inter-spike interval (ISI) series instead of the raw data. This approach was considered also in other multielectrode studies in vivo [18,19,20], where complexity was found to be sensitive to the effect of different treatments (electrical stimulation [18], administration of apomorphine [19], lesion [20].) This allows us to reduce the computational burden (and thus to extend the observation period), while maintaining the most important information included in the spikes (i.e., their times of occurrence). Following this approach, in a preliminary work, we proved the possibility of distinguishing the different dynamical states of cultured cortical networks (from a sub-critical, to a critical state), indicating an increase in complexity and information transfer during maturation [21]. Differently from the main findings of the literature on ApEn, we found that the optimal choice for the tolerance (under which two patterns are considered recurrent) was a fixed value [21], which is related to the refractory period of neurons [20]. Here, we used the same method to compare three populations, which display either sub-critical, critical, or super-critical dynamics. Finally, the same analysis of complexity was repeated using SampEn instead of ApEn (results shown in the Appendix A).

2. Methods

2.1. Experimental Preparations

Electrophysiological activity was recorded during the mature stage of development of cortical neurons by means of 60 planar TiN/SiN microelectrodes (30 µm diameter, 200 µm spaced) arranged in an 8 × 8 grid (except the four electrodes at the corners). The experimental set-up is based on the MEA60 System (Multi-Channel Systems, MCS, Reutlingen, Germany). It consists of a mounting support with integrated 60-channel pre-amplifier and filter amplifier (gain 1200×) and a personal computer equipped with a PCI data acquisition board for real-time signal monitoring and recording. Dissociated neurons were plated over MEAs (previously coated with adhesion molecules poly-D-lysine and laminin) at the final density of about 1500 cells/mm2, and placed in a humidified incubator with an atmosphere of 5% CO2 at 37 °C. All procedures were carried out to reduce the number of animals and to minimize their suffering. The experimental protocol was approved by the European Animal Care Legislation (2010/63/EU), by the Italian Ministry of Health in accordance with the D.L. 116/1992 and by the guidelines of the University of Genova (Prot. 75F11.N.6JI, 08/08/18). Further details can be found in [22]. Recordings lasted 1 h and the sampling frequency was set to 10 kHz.

2.2. Extraction of Spiking Activity

Raw data recorded from each electrode are huge time-series. Thus, it was nearly impossible to apply directly the ApEn algorithm (introduced in the following section), being its computational cost quadratic. For this reason, a pre-processing of the raw data was performed to reduce the computational burden. Specifically, raw data were pre-processed to extract only the information related to the spikes timing by means of the Precise Timing Spike Detection algorithm [23]. The spike identification was performed by setting a differential threshold value (independently for each channel) calculated as 8 times the standard deviation of the biological and thermal noise of the signal, a peak lifetime (set at 2 ms), and a refractory period associated with the minimum interval between two consecutive events (set at 1 ms). Spikes were not sorted since during a burst a global increase in the activity produces a fast sequence of spikes with different and overlapping shapes which makes the sorting difficult [24] and unreliable [25]. After identifying the firings, the time delay between subsequent spikes was computed, obtaining the ISI time-series.

2.3. Approximate Entropy

Approximate Entropy (ApEn) was introduced to measure complexity of short and noisy epochs (i.e., in conditions in which rigorous definitions of entropy could not provide stable estimations [11]). It is defined as
A p E n ( m , r , N ) = 1 N m + 1 i = 1 N m + 1 ln C i m ( r ) 1 N m i = 1 N m ln C i m + 1 ( r )
where C i m ( r ) is the Correlation Integral, indicating the number of recurrences of the ith sample of the trajectory x ( i ) obtained by time delay embedding of the time series on a space of dimension m under a tolerance r
C i m ( r ) = no . of j N m + 1 such that d [ x ( i ) , x ( j ) ] r N m + 1
N being the number of samples of the time series and d [ x ( i ) , x ( j ) ] defined as the L norm. ApEn quantifies the unpredictability of the data studying recurrences in the time-series, when embedded in a space of dimension either m or m + 1. In this way, non-linear behaviour is investigated under the assumption that deterministic laws rule the system generating the data: this hypothesis can be tested by comparison with random surrogates [20]. ApEn depends on the choice of parameters [26], in particular the embedding dimension m and the tolerance r, indicating the distance under which two points in the phase space are considered neighbours. Stable estimations are obtained only if many recurrences can be identified to get statistically reliable information on the possible convergence or divergence of trajectories starting from neighbouring points (reflecting predictable and complex behaviours, respectively). For this reason, the number of samples was suggested to be quite large, i.e., at least among 10m and 20m [27]. Points with no recurrences would have yielded an infinite value of ApEn (due to a logarithmic function in its definition), so that self-recurrences were included (so that each point is recurrent with itself) [11]. However, a bias toward low values of complexity is introduced [14], which is more and more significant as few true recurrences are available [26]. Sample Entropy (SampEn) was introduced to avoid this problem [14]. SampEn is much more stable than ApEn, as it is only sensitive to global regularity of the time series and not to local events, which could be rare and thus poorly represented. However, in this way, events are not weighted in terms of their information content (which is higher for rare events) [26], so that the index could poorly represent the local information processed by the investigated neural networks, in which we are interested (see Discussion section for further comments).
It is worth noticing that the number of samples N cannot be chosen arbitrarily large, as the cost of the algorithm is quadratic. We considered m = 3 and the ISI time-series were divided into epochs of 2500 samples. Notice that a fixed number of samples, in our case, does not reflect a fixed duration of the epochs: this duration depends on the firing frequency of the neurons recorded by the electrode. The number of epochs per electrode (mean ± std) was 5.3 ± 5.0, 3.6 ± 3.5 and 6.7 ± 9.7 for the three representative sub-critical, critical and super-critical cultures, respectively. This reflects the mean rate of the firings identified under the electrodes: 2.14 ± 1.61 Hz, 1.60 ± 1.03 Hz, 2.57 ± 3.36 Hz (mean ± std across electrodes) for sub-critical, critical and super-critical cultures, respectively. Epochs with very limited activity were excluded, as they would not allow to get a stable estimation of ApEn: the mean firing frequency was imposed to be larger than 1 spike/s; epochs with lower activity (called silent) were excluded. After the removal of silent epochs, the mean firing rates became 2.64 ± 1.63 Hz, 2.12 ± 1.02 Hz, 4.04 ± 3.80 Hz for sub-critical, critical and super-critical cultures, respectively.
After computation of ApEn on each epoch, the values obtained from each channel were averaged. For the investigation of the complexity of the ISI time-series, we set as optimal tolerance the value of 1 ms [20,21], differently from what generally found in the literature: usually, the tolerance is a percentage of the standard deviation of the signal (among 10% and 30% [17,18,19]). In this way, ApEn is unaffected by amplitude scaling, that usually is not relevant. However, in our case, the amplitude of the ISI is related to the mean firing frequency of the spiking neurons, which is the most relevant physiological information. On this basis, fixing the tolerance to a value related to the characteristic time of the dynamics of the investigated system may be important. Indeed, this choice allowed to get better discrimination of different dynamical states of a single population [21]. Finally, such a value of tolerance is the same used in [20], where the choice was justified indicating that 1 ms is comparable with the refractory period of neurons (notice however that [20] shows a different application, as the data were recorded in vivo and the spikes were sorted).
The hypothesis that ISI time series were generated by a non-linear deterministic system was tested by using surrogate data of each epoch. Thirty surrogates were generated by the Iterative Amplitude-adjusted Fourier Transform method [28] and the mean of their ApEn values was checked to be bigger than the ApEn estimated from the original ISI epoch by a right-tailed t-test.

2.4. Statistical Analysis
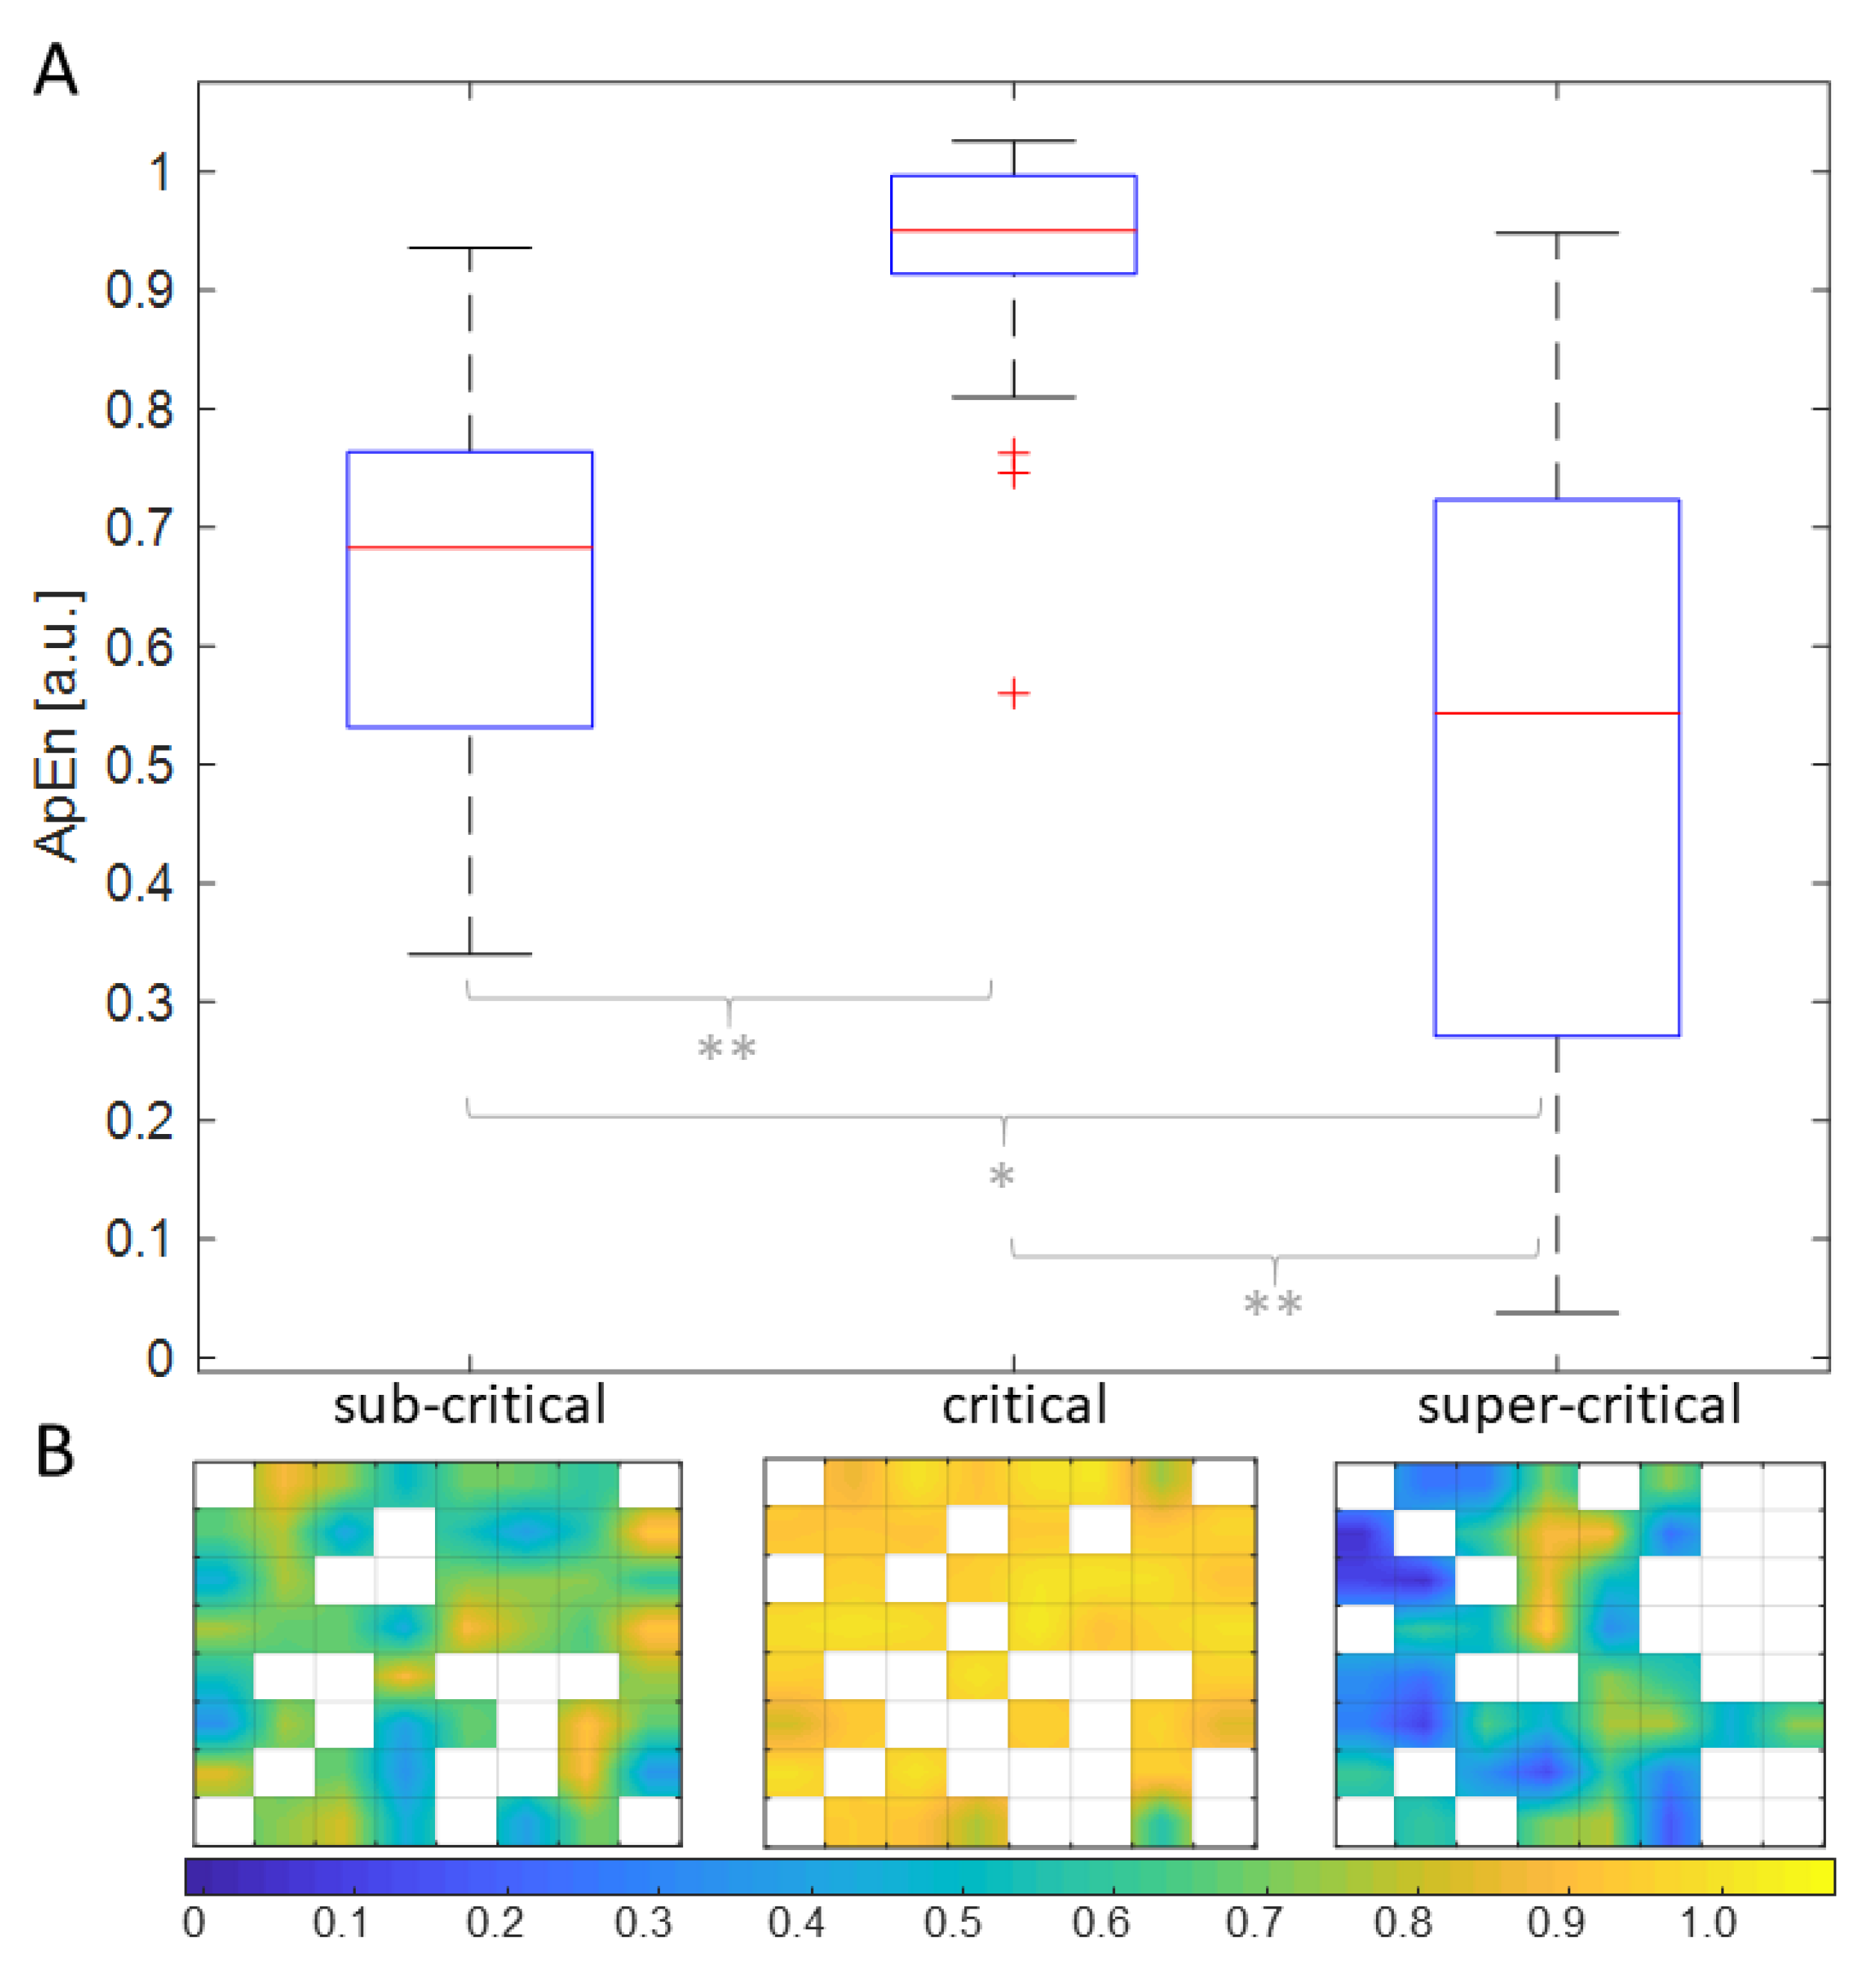
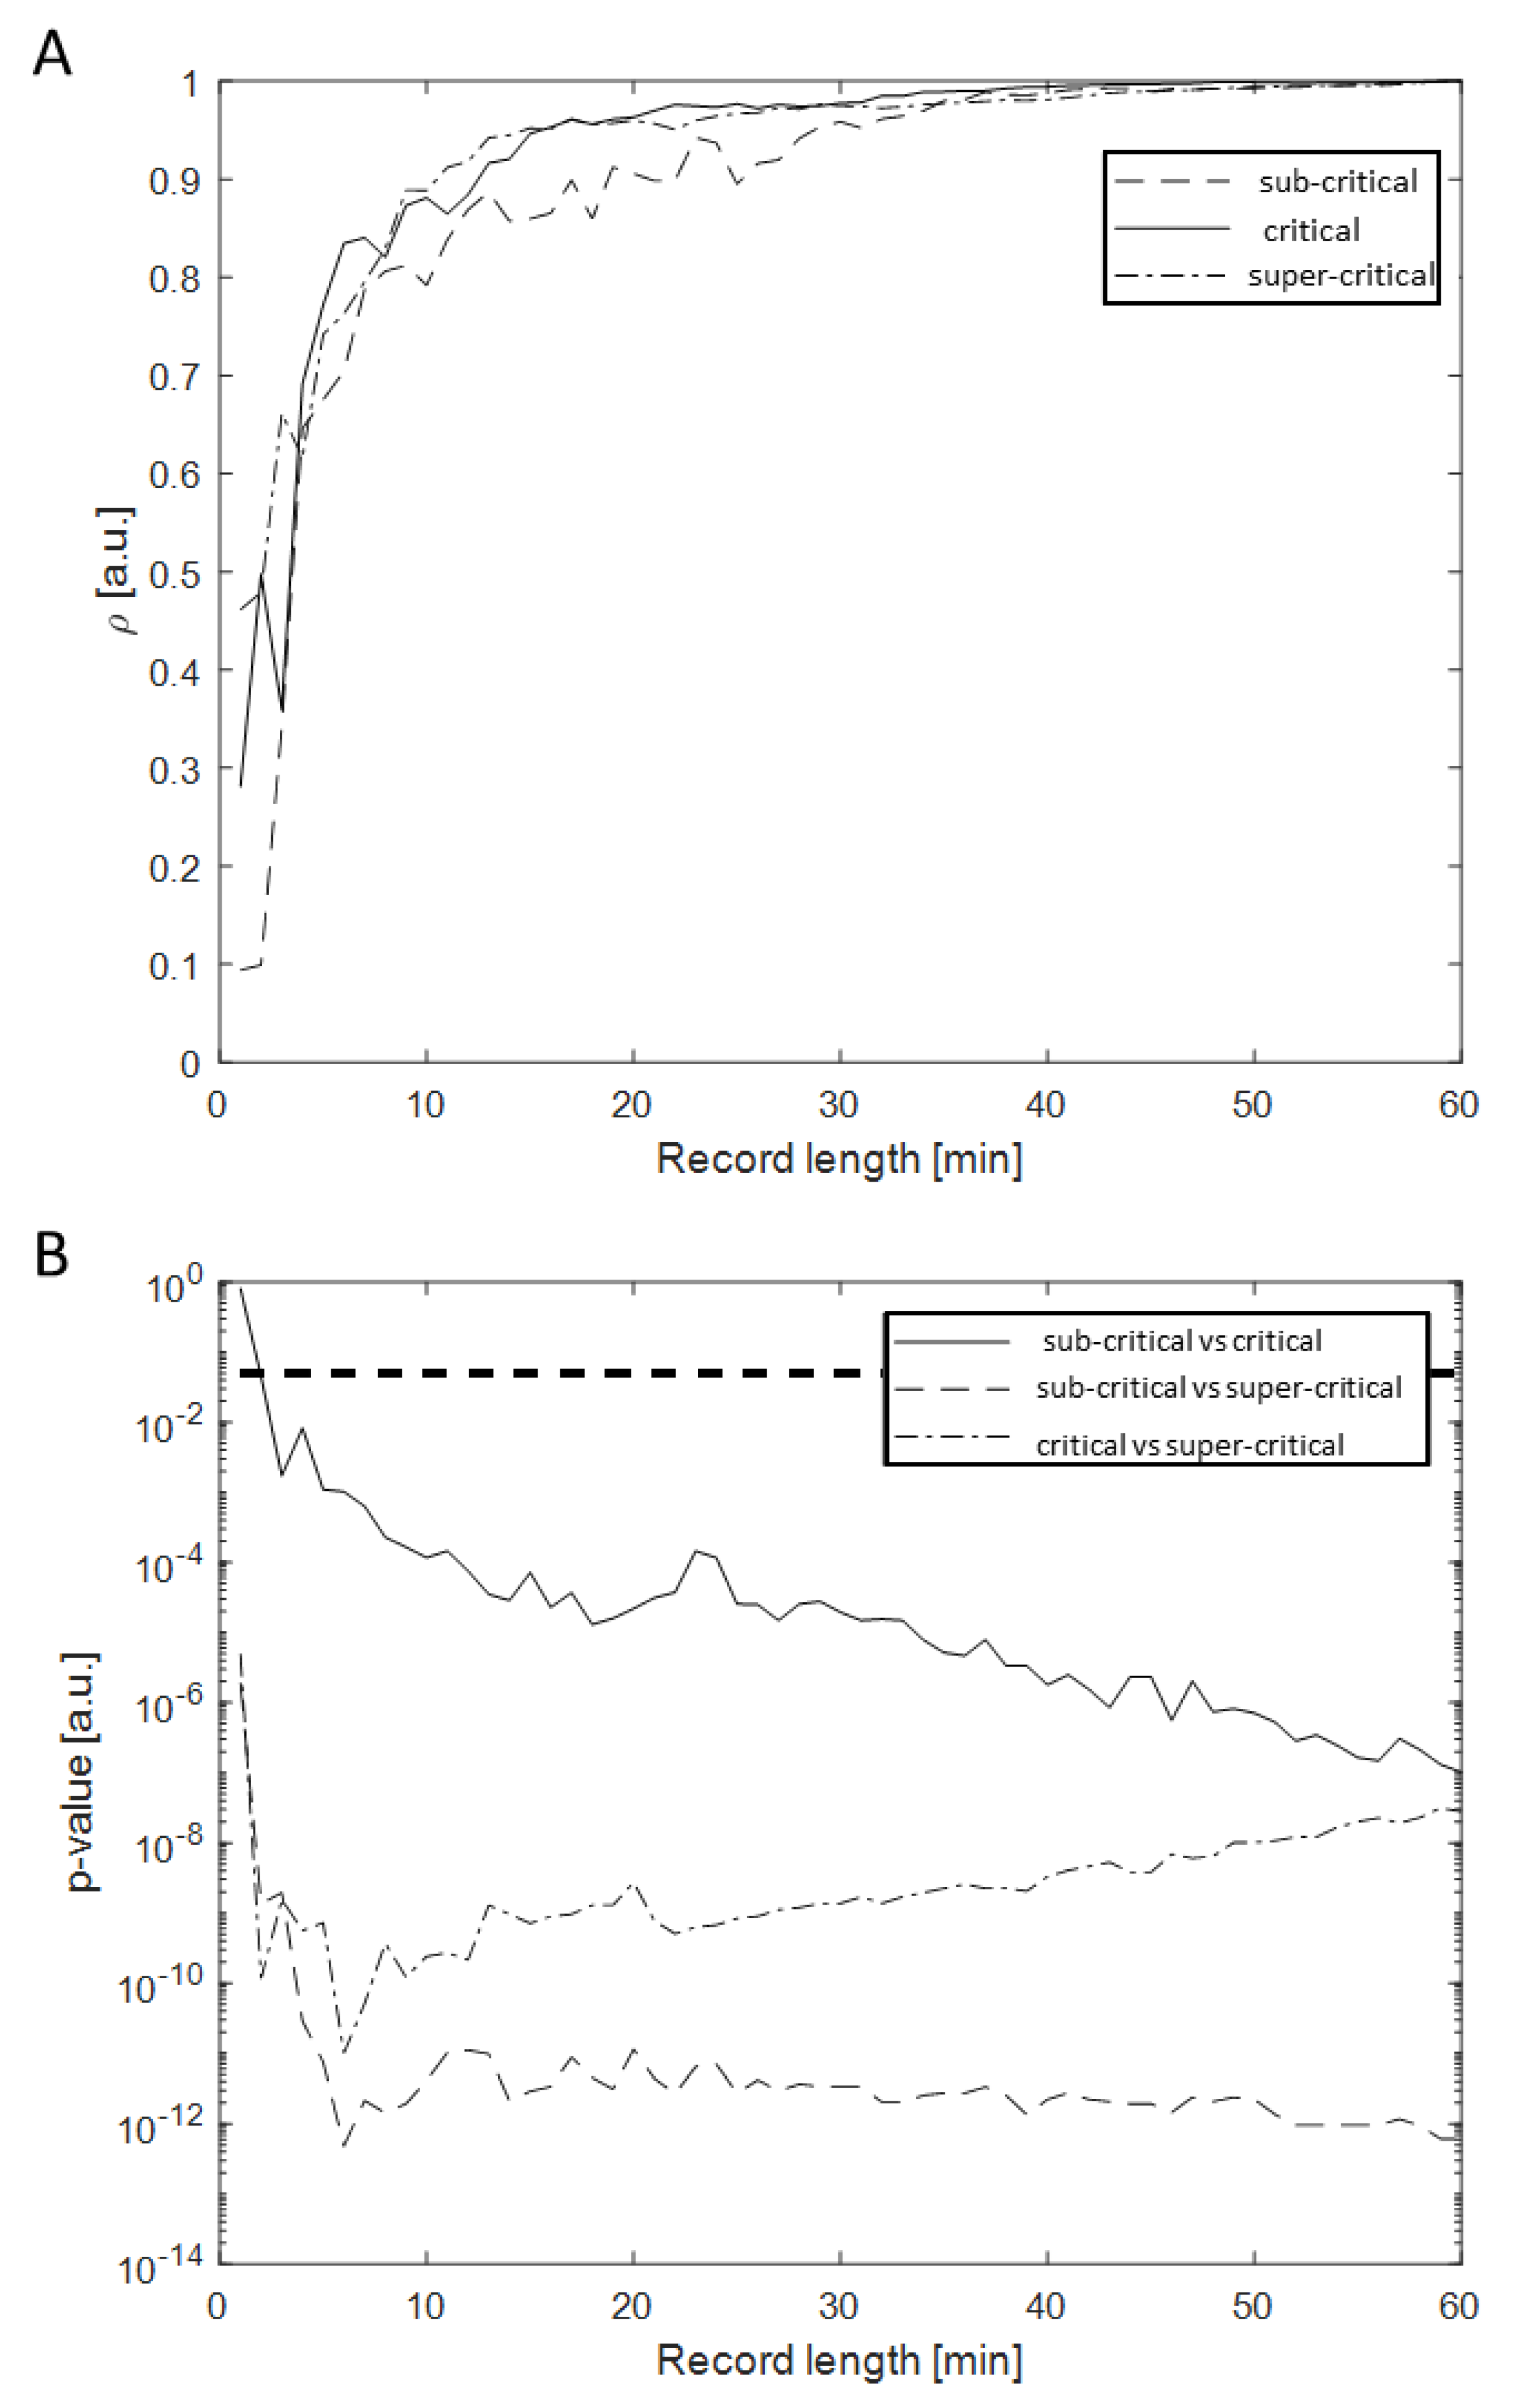
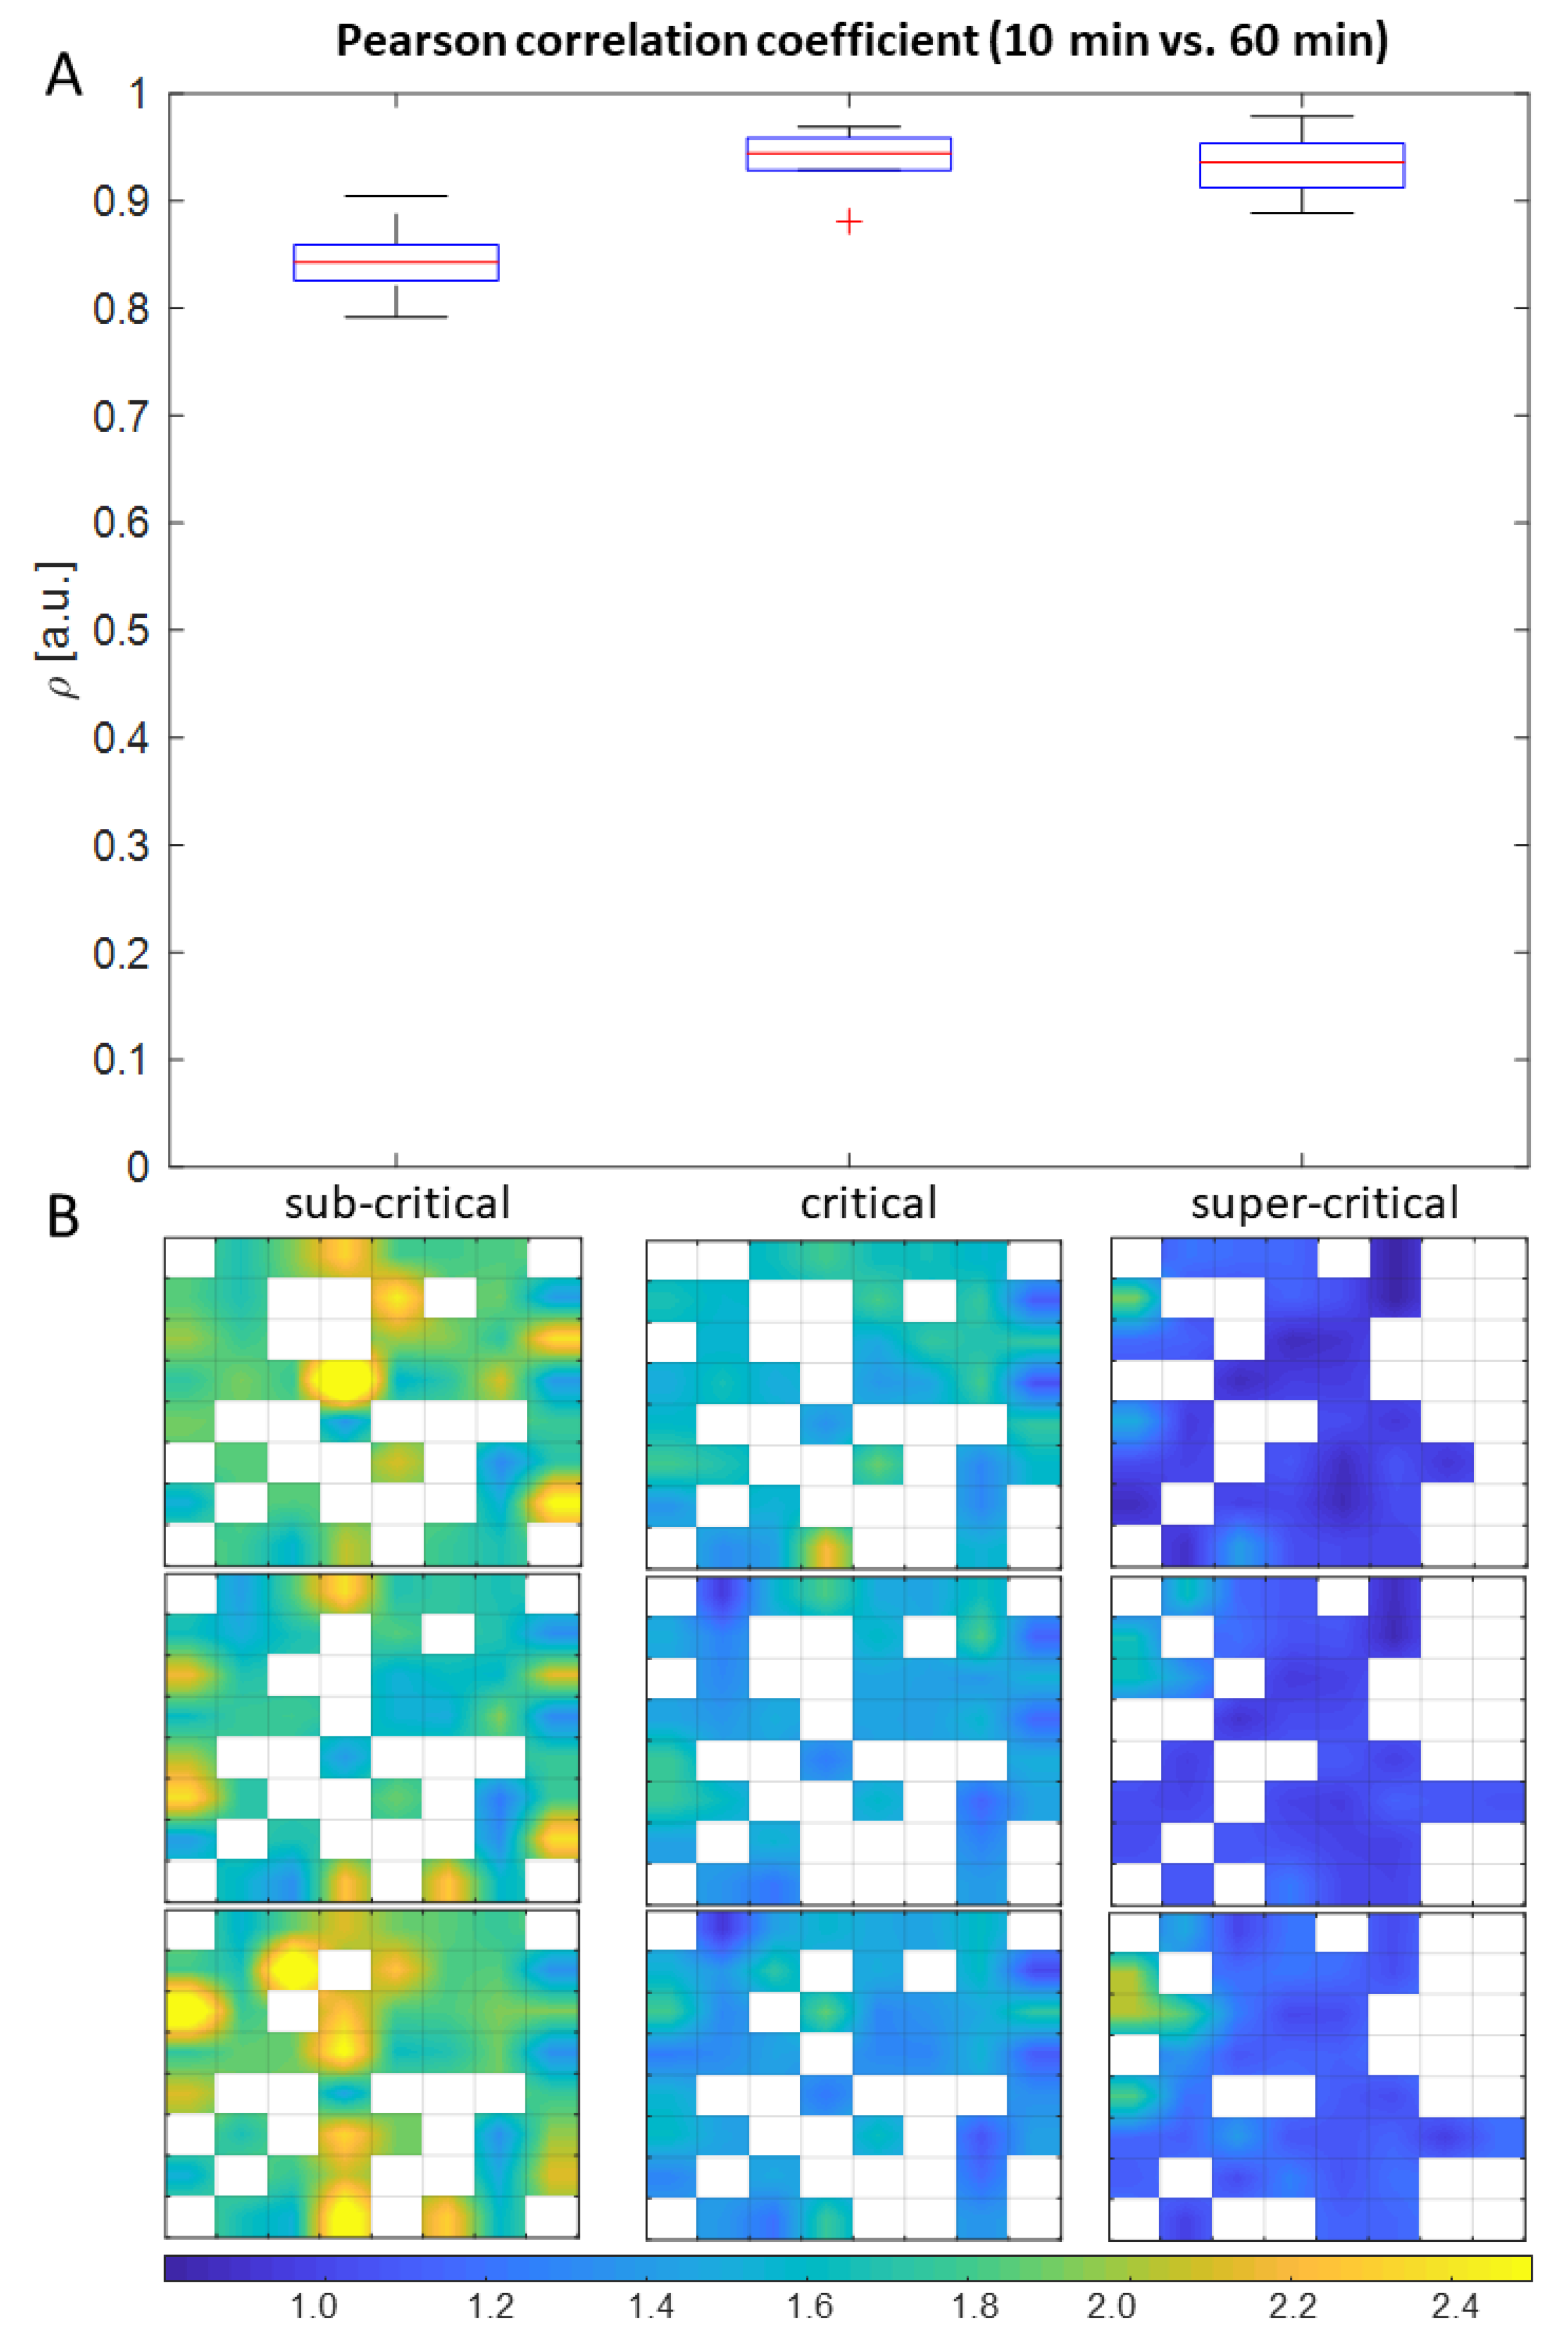
Entropy analysis applied on each culture returned at most a vector of 60 values (one for each electrode). Anyway, the effective number of ApEn values for each culture was less than 60, as some channels were silent. As the number of silent electrodes was variable among the cultures, unbalanced ANOVA was considered to infer statistical significance.
Shapiro–Wilk and Brown–Forsythe tests excluded normality of distributions and homogeneity of variances, respectively, (confidence level of 0.05 for both tests). Then, multiple comparisons analysis was performed by three single Mann–Whitney U-test, followed by Bonferroni correction of the resulted p-values: this method is very conservative, but it is useful when dealing with few comparisons, like in our case. Finally, statistical differences among sub-recordings belonging to the same culture were assessed by paired Wilcoxon signed rank tests.

3. Results

Figure 1A shows the 60-electrodes MEA used for the presented experiments and a detail of the developed network coupled to the active area of the MEA (Figure 1B). The three panels of Figure 1C display a snapshot of 60 s of electrophysiological activity relative to sub-critical, critical and super-critical cortical networks, whose correspondent distributions of avalanches size are reported in Figure 1D.
Figure 2 shows the distributions of ApEn for the three different cultures which resulted in a statistical significant difference as assessed by an unbalanced ANOVA (p < 0.01). The upper panel (Figure 2A) shows that the culture in the critical state exhibits the largest overall value of ApEn resulting statistically different from the sub-critical and super-critical culture (both p < 0.01, Mann–Whitney U-tests with Bonferroni correction). The spatial distributions of ApEn values over the MEA layout are shown in Figure 2B.
The number of electrodes that overcame the tests of significance against surrogates were 7, 27 and 11 for sub-critical, critical and super-critical state, respectively. It is worth noticing that for electrodes with a low firing activity, ApEn of surrogates is largely biased by self-recurrences. In such cases, ApEn was comparable or even statistically lower than the ApEn of the original data, so that they did not pass the test. This does not exclude that the data were generated by deterministic non-linear rules, as the result of the test was largely biased by self-recurrences. However, the three distributions of ApEn values considering only electrodes passing the test with surrogates still show the same trend as considering all electrodes: mean ± std, 0.91 ± 0.03, 0.98 ± 0.04, 0.78 ± 0.11, for the cultures in sub-critical, critical and super-critical state, respectively, (differences are statistically significant).
The reproducibility and robustness of ApEn estimation were investigated on short recordings. The entire 1 h-recording was repeatedly shortened by one minute and processed by the ApEn algorithm. All the 60 resulted sets of ApEn values were tested for correlation with those obtained processing the entire record of 60 min. Figure 3A shows the Pearson coefficient ρ over the recording length: a stream of at least 20 min is required to achieve an estimation of ApEn close to that obtained considering the entire dataset ( ρ > 0.8). Notice that, with epochs of shorter duration, many electrodes showed less than 2500 spikes, so that ApEn processed time series of various lengths when considering epochs of different durations (and the length of the time series affects the estimation of the index [26]). This result is further explored in Figure 4: in the panel A, the distribution of the Pearson coefficients among each contiguous records of 20 min and the full-length record (60 min) is reported; in B, the maps of the spatial distribution of ApEn are shown for 3 contiguous records of 20 min.
The above-mentioned set of sub-recordings was also used to test the statistical difference among the three cultures when limiting them to short durations (Figure 3B). The difference became statistically significant for all the pairwise comparisons (confidence level of 0.05) for a recording length of at least 5 min. The stability of ApEn estimation was then tested on records lasting 5 min. The entire record of 1 h was split into non-overlapping sub-recordings of 5 min, each of which underwent independently to the ApEn algorithm. The corresponding set of ApEn values was tested to be time invariant by a correlation analysis among each possible combination of the sub-records belonging to the same culture type. Figure 5 shows the distributions of the Pearson coefficients for the three cell cultures: high correlations were obtained, with a small dispersion, probably due to the different silent periods.

4. Discussion

It was claimed that the self-organized critical state of a neuronal network is sustained by “scale free” topology [29], which allows the optimization of information transmission and the maximization of the computational power [9,30]. In this work, we studied the firing dynamics of cortical assemblies (Figure 1), showing that they display a larger entropy (in terms of ApEn) when in a critical state, than either sub-critical or super-critical regimes (Figure 2). This result is in line with the hypothesis that optimal information transfer occurs in the critical state, as entropy is related to the Shannon information included in the time series. However, this interesting result should be interpreted on the basis of the significance of ApEn and in comparison with other approaches discussed in the literature.

4.1. Comparison with Literature

Differently from the literature, where the estimation of the level of complexity of MEA data by using either ApEn or SampEn has been accomplished using raw data [15,16,17], in this work we calculated such metrics on the ISI values. However, since the high computational burden, the above mentioned works in the literature processed short epochs (less than a second) and a sliding window approach was proposed [17], based on the estimation of ApEn on subsequent epochs that were as short as 20 ms. This approach is questionable, as the considered time windows can include either only noise (associated with high values of ApEn, which are not reliable) or noise with embedded a few spikes (in the range of 1 to 3; in this case, the epoch is highly non-stationary, with very few recurrences, so that ApEn estimation is not reliable [26]). Indeed, ApEn should be used to decode chaos in stationary non-linear deterministic data [26]. It should not be applied to stochastic processes. A test on surrogates (which is lacking in [17]) could indicate that noise is a random process to which ApEn should not be applied.
The same method of [17] was also applied to the electromyogram of controls and amyotrophic lateral sclerosis (ALS) patients in rest, considering sliding windows of 50 ms of duration [31]. Again, these windows included either noise only or together with a few waveforms (i.e., motor unit action potentials—MUAP—reflecting some sporadic activity, only in the case of patients). As expected, the complexity was higher for controls (i.e., for noisy data) than for patients. ApEn of epochs including spikes was also found to be related to the amplitude of MUAPs, with higher values for smaller waveforms, usually found during tonic or repetitive bursts, and lower for those that were large enough to better emerge from noise, such as those recorded during sporadic activity (reflecting the firings of large reinnervated motor units). Notice that waveform amplitude strongly depends on the relative distance between the source (a motor unit, in this case) and the recording system. This largely affects the repeatability of information extraction of the index discussed in [31]. ApEn was also estimated from epochs of 500 ms obtaining opposite results, as ApEn was simply inversely correlated with the mean firing rate: considering bursts of many MUAPs, ApEn was lower than in the case of sporadic activity, where the complexity index is expected to be more biased towards high values, due to noise. Notice also that the information extracted by the Authors is already included in the firing pattern and MUAP amplitude, so that the need of using complexity analysis does not emerge. In conclusion, some concerns arise about the interpretation of complexity of data presented in [31].
The complexity estimated in terms of SampEn was found to decrease with the maturation of a neural population in [16]. Notice that again raw data were investigated in very short windows (i.e., of half a second), thus reflecting the estimated complexity of noise and (possibly) few waveforms (but the estimation of complexity is questionable in both cases, as mentioned above).
In summary, we expect severe limitations of the above-mentioned studies, due to their short observation epochs, which did not include enough information on the dynamics of the system. Indeed, key information of spiking sources is included in the times of firings, which cannot be reliably investigated with the short epochs of raw data that can be processed in reasonable time by the ApEn algorithm.

4.2. Interpretation of Our Results

ISI series were considered here, as completed in other studies investigating in vivo neural populations [18,19,20]. This is important to enlarge the duration of the epochs and is also beneficial to remove the effect of low-amplitude noise (both problems largely affecting the studies mentioned above [16,17,31]). Each electrode of the MEA system can record the electrophysiological activity of a small assembly of neurons, up to 3 cells (considering the electrode dimension and cultures density). Thus, the ISI time-series were obtained processing the superimposition of spike trains of different neurons and the information they convey is related to the communication both within the pool and with other neurons outside the electrode sensing area.
We observed an increase in local entropy of the network in critical state (Figure 2). As reported in computational studies [29,32], this could be related to the larger diversification of the neuronal communication pathways with respect to the other (sub- or super-critical) states. This complex topological organization [29] reflects into the diversified dimensions of avalanches produced by the network in a critical state (note that the dimension of an avalanche is defined as the number of synchronous activations of neurons, where activations are considered synchronous if firings are within the time window used to bin the spike trains). In a sub-critical state, instead, each neuron fires more randomly and does not efficiently trigger any response from other neurons, so that only few recurrent patterns can be recovered (and ApEn is biased toward low values by self-recurrences). The activity appears to be randomly distributed, but not chaotic. Indeed, only few recurrences are found and there were few electrodes in which the behaviour was different from that of random surrogates, so that deterministic chaos did not emerge clearly. On the other hand, in a super-critical state each spike ideally triggers a response of the whole network, with each firing train highly dependent on the others. Synchronous, recurrent and predictable dynamics are obtained, with low complexity.
Our results are quite stable when computed on short epochs: Figure 3 shows high correlation between pairs of patterns of ApEn found in short epochs. Compared to the values extracted from the whole data (Figure 2), ApEn is a bit smaller when considering short epochs (Figure 5), due to the lower number of recurrences found on short epochs (and larger bias of self-recurrences) and the reduced possibility of finding rare and highly informative patterns.
The additional results provided in the Appendix A show the same analysis, but achieved with SampEn. The main result is that SampEn provides more stable indications than ApEn and it allows us to use shorter epochs (Figure A2). Moreover, more electrodes pass the test with surrogates. These results reflect the main advantage of SampEn (well documented in the literature [14]), which is an index not biased by self-recurrences. Indeed, the ratio of overall (not local in time) recurrences found at different embedding dimensions is considered, so that there is no risk that the index could diverge for lack of local recurrences and hence no need of compensating for that by accounting for self-recurrences. The ratio mentioned above can be interpreted as the probability that the trajectory, when recurring close to a point visited before, will not diverge in the subsequent point [26]. In this way, it is not affected by the local behaviour of the time series, which could be poorly represented in the case of rare events, leading to unstable estimations. However, for the same reason, SampEn is not related to the Shannon information contained in the time series, as it does not emphasize the most informative events, which are indeed the rarest ones [26]. In fact, SampEn is computed by applying a logarithm (i.e., a monotonic function) to the probability that the trajectory does not diverge at recurrences: it only depends on such a probability, as the logarithm does not have any role. For this reason, we choose ApEn, since it provides more precise indications on the information transferred within the neural network.
In particular, SampEn indicates that the sub-critical population shows the most complex behaviour among the three considered neural networks (Figure A1). Indeed, as mentioned above, the activity of a sub-critical population is sporadic and difficult to predict. For this reason, only few recurrences are found and only by chance, due to the lack of determinism ruling a coordinated activity of the neurons of the sub-critical population. ApEn reflects that few recurrences were found in the dynamics of sub-critical population: in fact, due to the bias of self-recurrences, it shows a lower value than for the network in critical state. On the other hand, SampEn and ApEn agree on the complexity order when comparing the critical and super-critical populations, as they find lower values for the super-critical population, which has regular and recurrent dynamics.

5. Conclusions and Further Work

ApEn is an index sensitive to the local information transfer in a network of spiking neurons. This index is able to identify the emergence of a critical state in the network, as in such a condition the measured complexity is larger than those found both in the cases of sporadic and regular firings shown by sub-critical and super-critical populations, respectively. Interestingly, a local analysis of ApEn (i.e., on a specific electrode) can provide some information on coordinated activity of the entire network.
This finding asks for further validations on an extended dataset. Additional complexity measures could also be tested [33,34]. Moreover, bivariate statistics could characterize the connections among the activities under different electrodes [35], opening the possibility of deepening the study of information transfer in the network.

Author Contributions

Conceptualization, All authors; methodology, L.E., L.M.; software, L.E., L.M.; validation, All authors; data preparation, P.M.; investigation, All authors; writing—original draft preparation, L.E., L.M.; writing—review and editing, P.M., L.M.; visualization, L.E.; supervision, L.M. All authors have read and agreed to the published version of the manuscript.

Funding

The work was supported by Interludioblu ONLUS (via Monte Nero 20, 10099, San Mauro Torinese, Turin, Italy).

Institutional Review Board Statement

The experimental protocol was approved by the European Animal Care Legislation (2010/63/EU), by the Italian Ministry of Health in accordance with the D.L. 116/1992 and by the guidelines of the University of Genova (Prot. 75F11.N.6JI, 08/08/18).

Informed Consent Statement

Not applicable.

Data Availability Statement

The peak trains of the dataset of this paper have been deposited in Zenodo. The DOI of the deposited data is https://doi.org/10.5281/zenodo.6363250 (accessed on 15 March 2022).

Conflicts of Interest

The authors declare no conflict of interest.

Abbreviations

The following abbreviations are used in this manuscript:
ApEnapproximate entropy
ISIinter-spike interval
MEAmicro-electrode array
SampEnsample entropy
SOCself-organized criticality
stdstandard deviation

Appendix A

Our data were processed using SampEn instead of ApEn (using the same parameters). Figure A1, Figure A2 and Figure A3 show the same as Figure 2, Figure 3 and Figure 4, respectively, but considering SampEn instead of ApEn.
Figure A1. Same as Figure 2, but showing SampEn instead of ApEn. (A) Single electrode SampEn distributions estimated from the three cultures used in our experiment correspondent to sub-critical, critical, and super-critical dynamics. The asterisks indicate the statistical difference assessed by a Mann–Whitney U-test followed by a Bonferroni correction (** means p < 0.01). (B) Colour maps of the Micro-Electrode Arrays, providing the spatial distribution of the ApEn values.
Electronics 11 00936 g0a1
Figure A2. Same as Figure 3, but considering SampEn instead of ApEn. (A) Pearson correlation coefficient trend w.r.t. the recording time. The correlation is computed among the vector of SampEn values estimated from the record length reported in abscissa and the vector of SampEn values estimated from the full-length record (60 min). (B) Trend of p-value, as estimated by a pairwise Wilcoxon signed rank test followed by a Bonferroni correction, w.r.t. the sub-record length. The dashed horizontal line represents the confidence level of 0.05.
Electronics 11 00936 g0a2
Figure A3. Same as Figure 4, but showing SampEn instead of ApEn and using a shorter duration of epochs (as SampEn is more stable that ApEn when considering short epochs). (A) Distributions of the Pearson correlation coefficients computed among each one of the 10 min sub-recordings constituting the full-length record (60 min) and the full length record itself. (B) Colour maps triplets (one for each culture) showing SampEn estimations on the three contiguous 20 min’ sub-records.
Electronics 11 00936 g0a3

References

  1. Abbott, L.F.; Dayan, P. Theoretical Neuroscience: Computational and Mathematical Modelling of Neural System; The MIT Press: Cambridge, MA, USA, 2001. [Google Scholar]
  2. Bove, M.; Grattarola, M.; Verreschi, G. In vitro 2D networks of neurons characterized by processing the signals recorded with a planar microtransducer array. IEEE Trans. Biomed. Eng. 1997, 44, 964–977. [Google Scholar] [CrossRef] [PubMed]
  3. Rodieck, R.W.; Kiang, N.Y.; Gerstein, G.L. Some quantitative methods for the study of spontaneous activity of single neurons. Biophys. J. 1962, 2, 351–368. [Google Scholar] [CrossRef] [Green Version]
  4. Aertsen, A.M.; Gerstein, G.L.; Habib, M.K.; Palm, G. Dynamics of neuronal firing correlation: Modulation of effective connectivity. J. Neurophysiol. 1989, 61, 900–917. [Google Scholar] [CrossRef]
  5. Brown, E.N.; Kass, R.E.; Mitra, P.P. Multiple neural spike train data analysis: State-of-the-art and future challenges. Nat. Neurosci. 2004, 7, 456–461. [Google Scholar] [CrossRef] [PubMed]
  6. Cocchi, L.; Gollo, L.L.; Zalesky, A.; Breakspear, M. Criticality in the brain: A synthesis of neurobiology, models and cognition. Prog. Neurobiol. 2017, 158, 132–152. [Google Scholar] [CrossRef] [PubMed] [Green Version]
  7. Destexhe, A.; Touboul, J.D. Is There Sufficient Evidence for Criticality in Cortical Systems? eNeuro 2021, 8, ENEURO.0551-20.2021. [Google Scholar] [CrossRef] [PubMed]
  8. Beggs, J.M.; Plenz, D. Neuronal avalanches in neocortical circuits. J. Neurosci. 2003, 23, 167–177. [Google Scholar] [CrossRef] [Green Version]
  9. Beggs, J.M. The criticality hypothesis: How local cortical networks might optimize information processing. Philos. Trans. R. Soc. A 2008, 366, 329–343. [Google Scholar] [CrossRef]
  10. Cover, T.M.; Thomas, J.A. Elements of Information Theory, 2nd ed.; Wiley-Interscience: Hoboken, NJ, USA, 2006. [Google Scholar]
  11. Pincus, S.M. Approximate entropy as a measure of system complexity. Proc. Natl. Acad. Sci. USA 1991, 88, 2297–2301. [Google Scholar] [CrossRef] [PubMed] [Green Version]
  12. Yang, H.J.; Hu, S.J.; Han, S.; Liu, G.P.; Xie, Y.; Xu, J.X. Relation between responsiveness to neurotransmitters and complexity of epileptiform activity in hippocampal CA1 neurons. Epilepsia 2002, 43, 1330–1336. [Google Scholar] [CrossRef] [Green Version]
  13. Akay, M.; Sekine, N. Investigating the complexity of respiratory patterns during recovery from severe hypoxia. J. Neural Eng. 2004, 1, 16–20. [Google Scholar] [CrossRef]
  14. Richman, J.S.; Moorman, J.R. Physiological time-series analysis using approximate entropy and sample entropy. Am. J. Physiol. Heart Circ. Physiol. 2000, 278, H2039–H2049. [Google Scholar] [CrossRef] [PubMed] [Green Version]
  15. Kapucu, F.E.; Mikkonen, J.E.; Tanskanen, J.M.; Hyttinen, J.A. Quantification and automatized adaptive detection of in vivo and in vitro neuronal bursts based on signal complexity. In Proceedings of the 2015 37th Annual International Conference of the IEEE Engineering in Medicine and Biology Society (EMBC), Milan, Italy, 25–29 August 2015; pp. 4729–4732. [Google Scholar]
  16. Kapucu, F.E.; Valkki, I.; Christophe, F.; Tanskanen, J.M.A.; Johansson, J.; Mikkonen, T.; Hyttinen, J.A.K. On electrophysiological signal complexity during biological neuronal network development and maturation. In Proceedings of the 2017 39th Annual International Conference of the IEEE Engineering in Medicine and Biology Society (EMBC), Jeju, Korea, 11–15 July 2017; pp. 3333–3338. [Google Scholar]
  17. Chen, L.; Luo, W.; Deng, Y.; Wang, Z.; Zeng, S. Characterizing the complexity of spontaneous electrical signals in cultured neuronal networks using approximate entropy. IEEE Trans. Inf. Technol. Biomed. 2009, 13, 405–410. [Google Scholar] [CrossRef]
  18. Dorval, A.D.; Russo, G.S.; Hashimoto, T.; Xu, W.; Grill, W.M.; Vitek, J.L. Deep brain stimulation reduces neuronal entropy in the MPTP-primate model of Parkinson’s disease. J. Neurophysiol. 2008, 100, 2807–2818. [Google Scholar] [CrossRef] [PubMed] [Green Version]
  19. Lafreniere-Roula, M.; Darbin, O.; Hutchison, W.D.; Wichmann, T.; Lozano, A.M.; Dostrovsky, J.O. Apomorphine reduces subthalamic neuronal entropy in parkinsonian patients. Exp. Neurol. 2010, 225, 455–458. [Google Scholar] [CrossRef] [Green Version]
  20. Darbin, O.; Jin, X.; Von Wrangel, C.; Schwabe, K.; Nambu, A.; Naritoku, D.K.; Krauss, J.K.; Alam, M. Neuronal Entropy-Rate Feature of Entopeduncular Nucleus in Rat Model of Parkinson’s Disease. Int. J. Neural Syst. 2016, 26, 1550038. [Google Scholar] [CrossRef] [PubMed] [Green Version]
  21. Ermini, L.; Mesin, L.; Massobrio, P. Approximate Entropy of Spiking Series of a Neuronal Network in either Subcritical or Critical state. In Proceedings of the 2018 IEEE Workshop on Complexity in Engineering (COMPENG), Florence, Italy, 10–12 October 2018. [Google Scholar]
  22. Brofiga, M.; Pisano, M.; Tedesco, M.; Boccaccio, A.; Massobrio, P. Functional Inhibitory Connections Modulate the Electrophysiological Activity Patterns of Cortical-Hippocampal Ensembles. Cereb. Cortex 2021, bhab318. [Google Scholar] [CrossRef] [PubMed]
  23. Maccione, A.; Gandolfo, M.; Massobrio, P.; Novellino, A.; Martinoia, S.; Chiappalone, M. A novel algorithm for precise identification of spikes in extracellularly recorded neuronal signals. J. Neurosci. Methods 2009, 177, 241–249. [Google Scholar] [CrossRef]
  24. Chiarion, G.; Mesin, L. Resolution of Spike Overlapping by Biogeography-Based Optimization. Electronics 2021, 10, 1469. [Google Scholar] [CrossRef]
  25. Wagenaar, D.A.; Nadasdy, Z.; Potter, S.M. Persistent dynamic attractors in activity patterns of cultured neuronal networks. Phys. Rev. E 2006, 73, 051907. [Google Scholar] [CrossRef] [Green Version]
  26. Mesin, L. Estimation of Complexity of Sampled Biomedical Continuous Time Signals using Approximate Entropy. Front. Physiol. 2018, 9, 710. [Google Scholar] [CrossRef]
  27. Pincus, S.M.; Goldberger, A.L. Physiological time-series analysis: What does regularity quantify? Am. J. Physiol. Heart Circ. Physiol. 1994, 266, H1643–H1656. [Google Scholar] [CrossRef]
  28. Schreiber, T.; Schmitz, A. Improved surrogate data for nonlinearity tests. Phys. Rev. Lett. 1996, 77, 635–638. [Google Scholar] [CrossRef] [PubMed] [Green Version]
  29. Massobrio, P.; Pasquale, V.; Martinoia, S. Self-organized criticality in cortical assemblies occurs in concurrent scale-free and small-world networks. Sci. Rep. 2015, 5, 10578. [Google Scholar] [CrossRef] [PubMed] [Green Version]
  30. Timme, N.M.; Marshall, N.J.; Bennett, N.; Ripp, M.; Lautzenhiser, E.; Beggs, J.M. Criticality maximizes complexity in neural tissue. Front. Physiol. 2016, 7, 425. [Google Scholar] [CrossRef] [PubMed] [Green Version]
  31. Zhou, P.; Barkhaus, P.E.; Zhang, X.; Rymer, W.Z. Characterizing the complexity of spontaneous motor unit patterns of amyotrophic lateral sclerosis using approximate entropy. J. Neural Eng. 2011, 8, 066010. [Google Scholar] [CrossRef] [PubMed]
  32. Pajevic, S.; Plenz, D. Efficient network reconstruction from dynamical cascades identifies small-world topology of neuronal avalanches. PLoS Comput. Biol. 2009, 5, e1000271. [Google Scholar] [CrossRef] [Green Version]
  33. Castiglioni, P.; Faes, L.; Valenza, G. Assessing Complexity in Physiological Systems through Biomedical Signals Analysis. Entropy 2020, 22, 1005. [Google Scholar] [CrossRef] [PubMed]
  34. Tripathy, R.K.; Deb, S.; Dandapat, S. Analysis of physiological signals using state space correlation entropy. Healthc. Technol. Lett. 2017, 4, 30–33. [Google Scholar] [CrossRef]
  35. Jamin, A.; Humeau-Heurtier, A. (Multiscale) Cross-Entropy Methods: A Review. Entropy 2020, 22, 45. [Google Scholar] [CrossRef] [Green Version]
Figure 1. (A) Micro-Electrode Array (MEA) made up of 60 electrodes. (B) Example of a cortical network coupled to a MEA. (C) Three examples of electrophysiological activity exhibited by three different cortical networks and (D) corresponding distributions of avalanches size.
Electronics 11 00936 g001
Figure 2. (A) Single electrode ApEn distributions estimated from the three cultures used in our experiment correspondent to sub-critical, critical, and super-critical dynamics. The asterisks indicate the statistical difference assessed by a Mann–Whitney U-test followed by a Bonferroni correction (* and ** mean p < 0.05 and p < 0.01, respectively). (B) Colour maps of the Micro-Electrode Arrays, providing the spatial distribution of the ApEn values.
Electronics 11 00936 g002
Figure 3. (A) Pearson correlation coefficient trend w.r.t. the recording time. The correlation is computed among the vector of ApEn values estimated from the record length reported in abscissa and the vector of ApEn values estimated from the full-length record (60 min). Each curve is relative to the different dynamical states depicted in Figure 1. (B) Trend of p-value, as estimated by a pairwise Wilcoxon signed rank test followed by a Bonferroni correction, w.r.t. the sub-record length. The dashed horizontal line represents the confidence level of 0.05.
Electronics 11 00936 g003
Figure 4. (A) Distributions of the Pearson correlation coefficients computed among each one of the 20 min sub-recordings constituting the full-length record (60 min) and the full length record itself. (B) Colour maps triplets (one for each culture) showing ApEn estimations on the three contiguous 20 min’ sub-records.
Electronics 11 00936 g004
Figure 5. (A) Distributions of the Pearson correlation coefficients computed for all the possible combinations between the ApEn distribution of the twelve sub-recordings lasting five minutes that composed each record of one hour; in the inset, an example of the ApEn distributions for a 5 min record is depicted. The asterisks indicate the statistical difference assessed by a Mann–Whitney U-test followed by a Bonferroni correction (** means p < 0.01). (B) Three triplets of maps showing ApEn estimations on different randomly chosen sub-records of 5 min, for each culture.
Electronics 11 00936 g005
Publisher’s Note: MDPI stays neutral with regard to jurisdictional claims in published maps and institutional affiliations.

