Article

IoT Monitoring and Prediction Modeling of Honeybee Activity with Alarm

1
Faculty of Technical Sciences Čačak, University of Kragujevac, Svetog Save 65, 32000 Čačak, Serbia
2
Faculty of Science, University of Kragujevac, Radoja Domanovića 12, 34000 Kragujevac, Serbia
3
Faculty of Technical Sciences, University of Novi Sad, Trg Dositeja Obradovića 6, 21000 Novi Sad, Serbia
4
Higher Education Technical School of Professional Studies, Školska 1, 21000 Novi Sad, Serbia
*
Author to whom correspondence should be addressed.
Electronics 2022, 11(5), 783; https://doi.org/10.3390/electronics11050783
Submission received: 3 February 2022 / Revised: 18 February 2022 / Accepted: 19 February 2022 / Published: 3 March 2022
(This article belongs to the Topic Computational Intelligence in Remote Sensing)

Abstract

:
A significant number of recent scientific papers have raised awareness of changes in the biological world of bees, problems with their extinction, and, as a consequence, their impact on humans and the environment. This work relies on precision beekeeping in apiculture and raises the scale of measurement and prediction results using the system we developed, which was designed to cover beehive ecosystem. It is equipped with an IoT modular base station that collects a wide range of parameters from sensors on the hive and a bee counter at the hive entrance. Data are sent to the cloud for storage, analysis, and alarm generation. A time-series forecasting model capable of estimating the volume of bee exits and entrances per hour, which simulates dependence between environmental conditions and bee activity, was devised. The applied mathematical models based on recurrent neural networks exhibited high accuracy. A web application for monitoring and prediction displays parameters, measured values, and predictive and analytical alarms in real time. The predictive component utilizes artificial intelligence by applying advanced analytical methods to find correlation between sensor data and the behavioral patterns of bees, and to raise alarms should it detect deviations. The analytical component raises an alarm when it detects measured values that lie outside of the predetermined safety limits. Comparisons of the experimental data with the model showed that our model represents the observed processes well.

1. Introduction

Although humanity is constantly advancing technologically, this development influences the environment, inevitably changing it both intentionally and unintentionally. Nature runs its course, and our influence disturbs the normal natural processes, changing the balance of natural perfection. Modern approaches in agriculture, the application of pesticides, herbicides, other chemical agents, and artificial pollinators, the flowering of nature in periods, and untimely conditions have changed the ecosystem of nature itself and bee societies, which is the topic of our research. In addition to the aforementioned, diseases of bee colonies, Varroa destructor infections, the effects of pesticides and herbicides, lack of food in hives, the loss of the queen and significant losses caused by unusual changes in the environment, meteorological conditions, and the winter season also contribute to beekeeping problems. The challenge was to design and manufacture an improved monitoring and data analysis system that would process data with advanced data analysis techniques on the basis of experience gained from previous studies.
We cannot influence events in the environment of bees occurring in nature, but we can monitor, measure. and collect data. With the methodological application of software algorithms, we can create prediction systems and learn their patterns. Artificial events and problems can be monitored, measured, and recorded, and we can influence them in order to control the outcome and prevent damage caused by human influence.
Such problems have been studied for years, and methodological approaches have changed. The development of precision microelectronics and the application of advanced methodological approaches have enabled a new way of approaching data measurement and analysis. The use of such systems enables mapping the causes of problems, and creating approaches to prevent and solve them. In this way, we come closer to solving the problems of modern apiculture.
In order to solve these problems, and relying on previous research, we created a complex system that thoroughly monitors and measures an expanded set of parameters that were proven through the mentioned research as relevant factors of influence. The created system opens possibilities for multiple and different approaches to processing and analyzing obtained results. An activity of bees (exits and entrances) represents a sequence of data points that occur in successive order over a period of time, which gives us the ability to apply algorithms for time-series forecasting. Time-series forecasting is the process of analyzing time-series data using statistics and modeling to predict and inform strategic decision making. The recent frequent use of recurrent neural networks is noticeable because they show high performance in achieving this task. Taking into consideration the data with which we work, approaches from the state of the art to more advanced and complex approaches were tested. The best results for bee activity forecasting are achieved by using recurrent neural networks (LSTM cell).
Precisely collected and processed data from such a system give insight to the beekeeper regarding the situation inside and around the hive. Obtained results by analyzing and applying the prediction model trigger alarms and inform beekeepers about a change in circumstances in the hive, suggesting the application of adequate solutions to prevent potential (predictive) problems. Thus, they can act in a timely and preventive manner on hives or bees in order to avoid a negative outcome.
Software solutions in the form of an application based on artificial intelligence must be accompanied by hardware components, which is the key to the presented management system and this work. Through the research, we realized that hive management is the next level in precision beekeeping, and the implementation of IoT MAP systems for supervising and controlling hives is inevitable for the architecture of the solution.
A comprehensive, all-inclusive discussion of the considered topic, as presented in this paper, consists of a set of parts, each one with an individual contribution. However, the system is presented as a whole with the following summary of contributions:
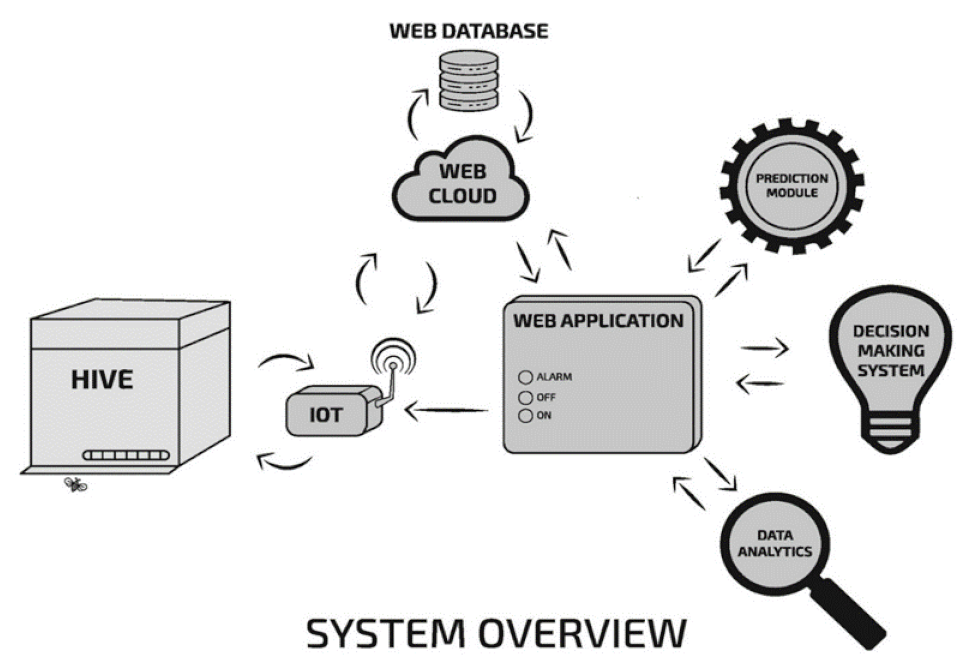
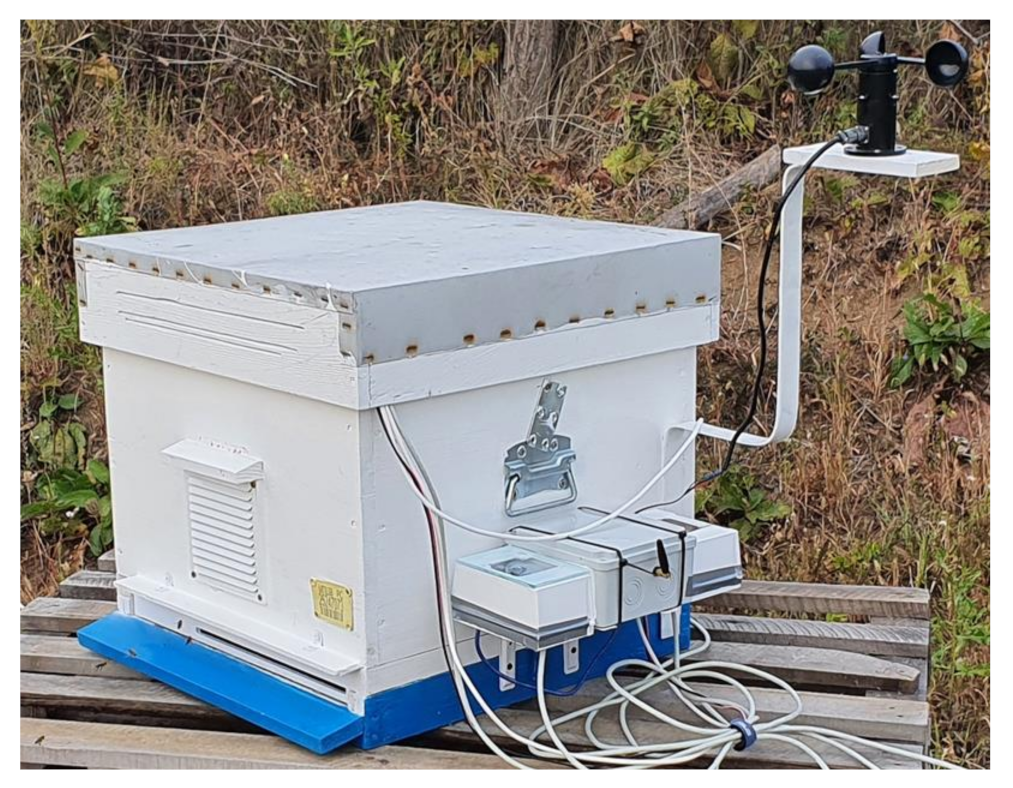
  • a system for bee movement monitoring was constructed and installed on the basis of which we could correlate independent and dependent indicators;
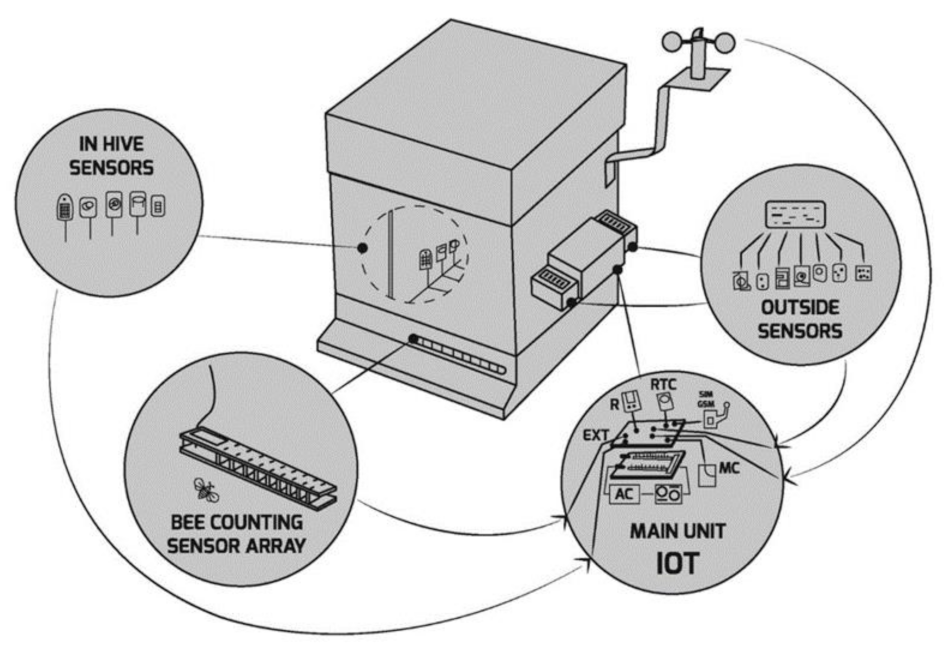
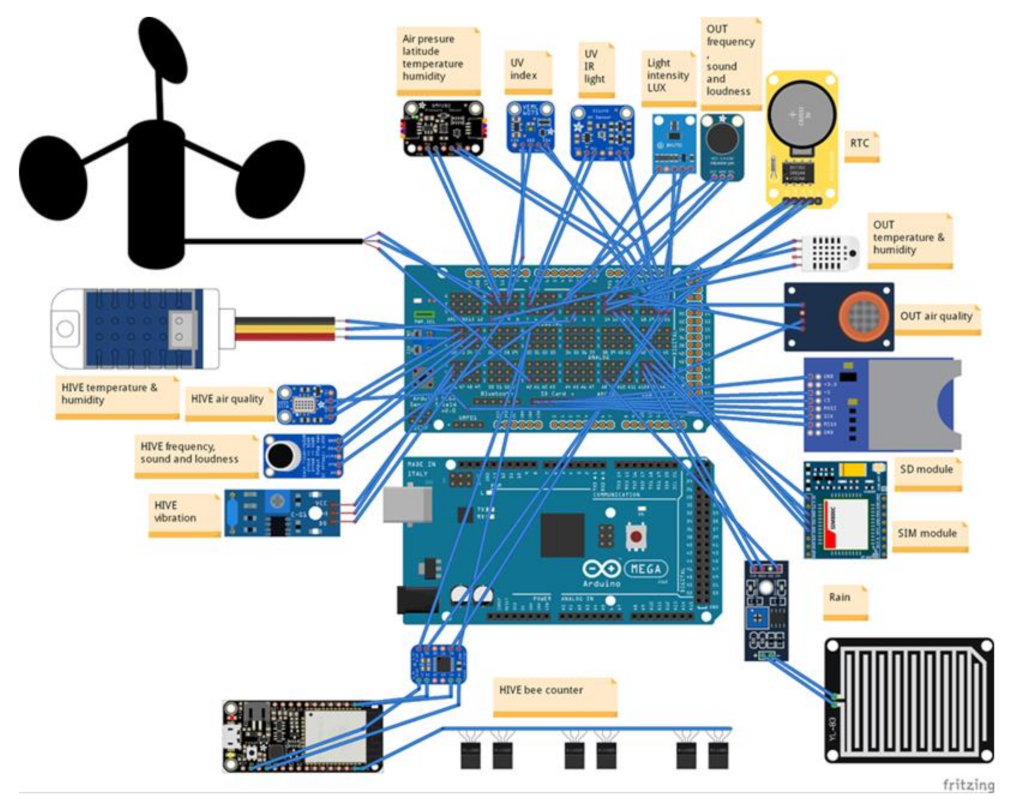
  • a large set of sensors for monitoring conditions from within and outside the hive was installed, which collects a wide array of real-time parameters;
  • a microcontroller-based IoT device was designed and constructed, which aggregates sensor readings and uploads data to the cloud;
  • an AI-based computational module was created and deployed to the cloud backend, which enables real-time analytical and predictive assessment of data uploaded from the IoT device;
  • a web frontend app was designed and created, which enables insight into real-time data from sensors at the hive and results from the AI module, namely, analytical and predictive warnings and alarms.
All listed components work as an integrated system that gives beekeepers and biologists insight into the wellbeing of bees, and allows for the monitoring of their behavioral patterns. Data are observed and analyzed depending on meteorological conditions, time of day, season, etc. Future work includes the possibility for taking actions such as hive entrance shutdown, ventilation, suggestions for hive relocation, and engagement of the automatic feeder.
All components of the proposed system are described in detail here. Section 2 lists relevant references on the topic of beekeeping that discuss various parameters impacting the behavior and wellbeing of bees. Section 3 describes the hardware of the constructed IoT microcontroller station and connected sensors. Section 4 contains the description of the web application for the real-time data monitoring and display of warnings. Section 5 describes the relevant data that were collected from the hive for the construction of the AI model. Section 6 contains the description of the applied predictive models. Section 7 contains the experimental results, and Section 8 is the conclusion.

2. Related Work

In recent years, beekeepers have encountered problems with mass bee deaths [1,2] and bee migrations due to climate change, and the impact of weather conditions on flowering disorders in nature in periods when bees should collect pollen. The use of various pesticides and herbicides in plant protection, and spraying at a time when bees are active in periods of disturbed climatic conditions due to high temperatures and humidity cause bees to be active in the later hours when spraying is performed [3]. This study indicates an advanced solution that could be applied for the intelligent monitoring of events around the bee habitat. It encompasses constant monitoring inside and outside a hive, real-time application, and artificial intelligence that includes a large number of dependent and independent factors influencing bee’s life in the analysis. Previous works [4,5,6,7,8] provide an excellent introduction to the issue and indicate a wide range of approaches, proposals, and analyses of various data, and the necessity and importance of including the influence of many factors on the movement and life of bees. The aim of most works was to fully understand the movement, work, and life of bees living in apiculture (the hive), and which beekeeper takes care of the bees, so that they can raise, nurture, and monitor them with constant insight into the condition of bees in the hive. In that way, the beekeeper could quickly react to changes through alarms that would be triggered from intelligent monitoring if situations occur with sudden changes, deviations, or potential problems predicted by the solution from this paper.
Precision beekeeping [9,10,11,12,13,14] is a term that has appeared in recent years referring to the development of online tools for the continuous monitoring and control of bee behavior using an individual approach to society, avoiding exposing bees to additional stress and unproductive activities. As monitoring each bee colony requires expensive resources and is complex, precision beekeeping offers a solution in the form of monitoring individual bee colonies and their immediate environment.
The mentioned works include important factors indicating their individual value, such as temperature and humidity, and their influence on swarming or feeding [15,16], ref. [17,18,19] vibration and sound [20,21,22,23,24,25,26], the presence of gases [27,28], rain and wind [29], the amount and intensity of daylight, and UV and IR radiation indices; this paper covers all these factors together. There are also time series of recording and data collection, which were performed in hourly or daily time series in the mentioned works. The choice of hardware solutions that affect the accuracy of data in previous analyses and approaches [15,27,30,31] differs from the approach in this paper, where we relied on advanced methods and data analysis. It is very important that analysis includes all dependent and independent influencing factors due to the complexity of the obtained results and different methods of inference.
The significance of constant monitoring [32,33,34,35,36,37,38] in terms of monitoring and measuring various parameters of influence within and immediately around the hive is shown in a large number of papers [39,40,41,42,43,44,45,46,47,48]. Most papers relied on the application of IoT technologies in designing these systems [19,49,50,51,52,53,54,55,56,57,58].
Regarding the application of artificial intelligence, the authors in [7] used a decision tree algorithm to classify the state of the hive. In order to maximize the identification of crucial colony activities, including healthy and unhealthy conditions, ten hive status classes were selected for this multi-class classification task. Our AI approach differs from the mentioned one, because we try to solve the regression problem and to draw a conclusion about the status of the hive based on the activity of the bees, i.e., whether the conditions in the hive are healthy or unhealthy. Similar approach was presented in [59,60] where the deep neural networks were used to classify bee swarm activity from audio signals.
The monitored parameters are on a broad spectrum to indicate even the slightest significance of any time element, or any deviation or disturbance in relation to the natural environment in which bees normally function.
Parameters inside and outside the hive were monitored in very precise sequences of temperature, humidity, air quality (presence of various gases, smoke, carbon monoxide, etc.), noise, presence of different frequencies of sounds, shocks, vibrations, UV factors, IR factors, intensity and variations of daylight, wind intensity, all in correlation with the frequency (entrance and exits) of bees. Furthermore, one of the goals of the research was to use this system to indicate the range of influences of different factors and parameters, their intensity, and the mutual correlation of factors.

3. System Overview

The system consists of several hardware and software components (Figure 1). The main IoT unit, located at the hive, collects data from multiple sensors in and around the hive, and from a bee counting circuit located at the hive entrance. The main unit is based on Arduino Mega 256 and ESP32 microcontroller boards. Data from the sensors and the bee counting circuit are timestamped and transmitted to the cloud database via a cellular modem. In order to prevent data loss, they are also saved on a local memory card.
A web application connects to the cloud database to enable the display of real-time and historical data. A decision-making system (DMS) also runs on the server, performing real-time data analysis and parameter prediction. This component can detect deviations from nominal parameters and accordingly generate alarms.
There are numerous solutions and tools for monitoring the movement of bees inside and outside the hive based on semiconductors, optical sensors, and photoresistors, for example [61,62], Arnia [63], Beecheck [64], the bee counter [65], and the honeybee counter [66]. Some solutions have exhibited problems due to a chosen approach to counting. The bee counting circuit presented in this work is based on a set of two photoreflecting resistors per gate, where both resistors must be triggered to detect one pass. Depending on the order of activation, the direction of movement in or out of the hive is determined. In order to avoid congestion, the circuit contains 24 gates, enabling bees to simultaneously enter and exit through all of them.
The precise measurements of bee movements are the basis for reaching conclusions about the condition of hives, and they are related to every action. However, to obtain more precise movement results, bee movement data must be tied to dependent and independent variables inside and outside the hive.
An active beehive with the IoT main unit and sensors used for data collection in this research is shown in Figure 2.

Main Unit Architecture
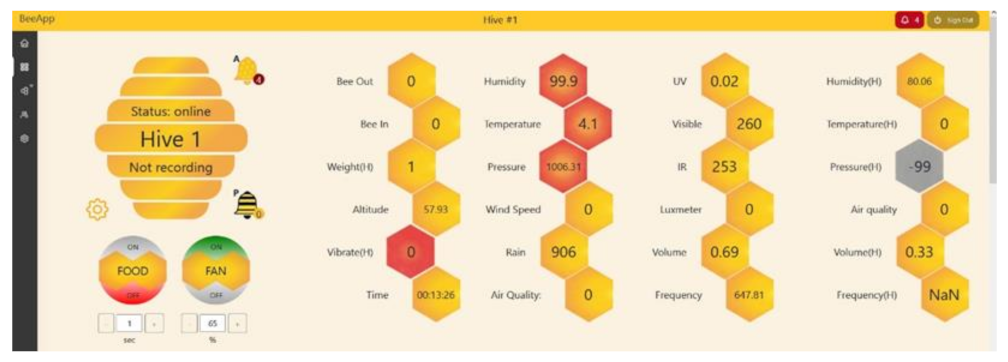
As seen in Figure 3, the scheme of the data collection system consisted of a microprocessor-controlled IoT base station.
The base station was connected to sensors for measuring parameters and data. The sensor sets in charge of the conditions in the hive were specially arranged in several levels following the structure of the frames and floor in the hive. Sensors for measuring parameters outside the hive were placed in the outer part of the system, but they are protected from direct meteorological influences that could lead to measurement errors. The bee counting sensor array is located at the entrance to the hive, where there are gates with photoresistors for the passage of bees to detect their movement. The entire system is controlled by the main unit microprocessor, which communicates with microcontrollers and initiates the collection of data that are forwarded via GPRS to the cloud system and web database. The data are also written into local storage.
The system consists of sensors and microelectronic components, preferably designed to avoid interruptions in operation, since it involves a large number of sensors and auxiliary modules operating at different voltage levels. The system was designed with low power consumption in mind, enabling a self-sustainable operation via solar power and a battery.
Figure 4 shows the schematic of the hardware and the main unit of IoT base station, where the central component is an Arduino Mega microcontroller, expanded with an extension module to accommodate all necessary electrical connections. Most sensors were attached over the industry-standard SPI and I2C buses available on the Arduino Mega.
The system was installed in such a way to avoid disturbing the bee ecosystem and prevent the impact of direct exposure to the weather in order to avoid measurement errors. For example, individual sensors that are exposed to direct sunlight are protected by clear glass without UV stabilizers to avoid measurement errors. Sensors for the detection of gases, frequencies, and noise were placed in such a way that they could record without interference and without being affected by weather conditions or direct sunlight.
The bee counting sensor array consists of devices for detecting the frequency of the movement of bees at the entrance to the hive in several corridors in order to smoothly monitor the movement of entering and leaving the hive. These are photoreflective resistors in which reflection is interrupted during movement; thus, the direction of movement is detected. The ESP32 microcontroller board controls the operation of these sensors.
Sensors inside the hive were positioned in such a way that they could function without the danger of being obstructed by bee wax, as bees wax any unknown elements inside the hive to protect the colony.
Collected data from the hive represent the microclimate of the living environment of bees and are valuable because they allow for the differences in measurements with values obtained outside the hive to be observed.
In the background of the main unit of the IoT system that collects data from the bee counting array and the measurement system with sensors there is a trained algorithm in charge of eliminating errors in measurements if they occur.

4. WebAPP for MAP

A web application was developed that shows current sensor readings from the hive (Figure 5). Measured values are stored in a web database in real time.
The web interface contains indicators for predictive and analytical alarms. The predictive alarm is activated by the prediction algorithm on the basis of bee movement (more details in the following section).
The movement of bees is most often caused by feeding, meteorological factors, daily activities in relation to the same factors, and human activity. In this way, we formulated directly and indirectly dependent factors, and their interdependence.
Cells that display values in the application are dynamic and change colors in relation to the displayed values. The analytical alarm is triggered when the measurement value approaches the critical value, for example, in the case of high temperature and high humidity. When the temperature value inside the hive exceeds 35 °C [68] or the relative humidity is nearly 90%, the alarm is triggered. A push notification is sent informing about changes in the hive.
Before the predictive modeling (AI) module is described, an overview of the collected dataset from previous steps is provided. All collected variables, and which sensor is responsible for collecting which data are described. Additionally, required data cleaning and variable transformations are described.

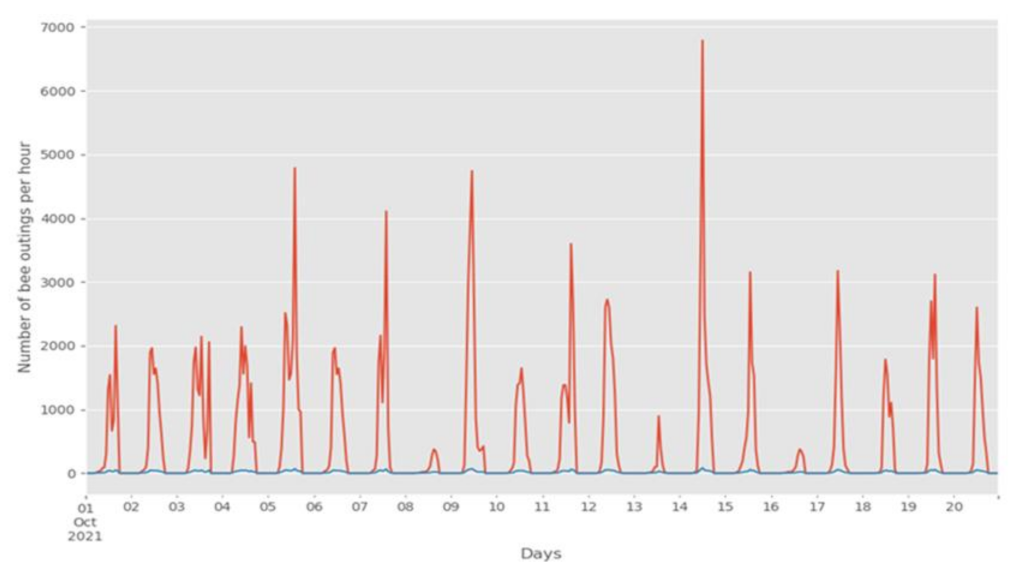
5. Dataset Description

Data were collected during fall months, but in the paper, 20 successive days in October 2021 were used for analysis. Measurements were performed in 5 min intervals. Taking into consideration a small number of exits from the hive and small changes in weather conditions in a period of 5 min, especially in the observed period, time intervals were consolidated into 24 h. Final input features were obtained as the average value of all related values that belonged to the observed hour. Output values were obtained as the sum of all exits and entrances to the hive in that hour. Table 1 shows the structure of the dataset with all used variables and their descriptions. The entire dataset and code source is publicly available at https://gitlab.com/mali_banekg/beeactivityforecast (accessed on 15 January 2022).
The BEECNT_message OUT variable represents the number of bees that came out of the hive, while BEECNT_message IN represents the number of bees that entered the hive. These two variables were used as output in our models. In this way, we connected dependent and independent indicators of bee movement.
Counting the bees’ entrances to and exits from the hive, and measuring the environmental conditions inside and outside of the hive are important for alarm initialization, and complement the results of other parameters that indicate the frequencies of movement of bees obtained from the sensory measurements of the immediate environment. Without measuring all the above factors, especially weather conditions, the number of bees in and out would not be of greater significance and would only be a statistical detail. All these variables collected from the environment to which the bees belong could be used for a model development that can very precisely predict bee movements.
Some of the used variables and output variable Bee_IN (y) are shown in Figure 6. On the basis of the time-series shape, it is obvious that some of these variables were important for our model, such as lux or outside humidity (when the humidity value is high, the bees do not leave the hive).
During the feature engineering phase, we took the advantage of the fact that there are periods during the day (24 h) when bees are not active, and a new binary variable is created that represents part of the day, daylight (5 a.m. to 6 p.m.) or night (other hours). If any activity was detected during the night period, we replaced them with the 0 value. This could usually happen around the border hours, when few exits or entries are detected.
Output columns BEE_IN and BEE_OUT were transformed by using the square root transformation (this is the so called power transformation) because in time-series analysis, this transformation is often considered to stabilize the variance of a series. Logarithmic transformation was skipped because some of the values were equal to 0. Figure 7 shows the original time series of the bee exits (red) and the time series after square root transformation is applied (blue). It is obvious that the number of outings on certain days was drastically reduced. This can be explained by the fact that weather conditions were probably worse that day, for example, it was raining or it was windy.

6. Methodology

Time series data is a collection of observations obtained through repeated measurements over time, as is the case here. Unlike regression predictive modeling, time series also adds the complexity of a sequence dependence among the input variables. The recurrent neural networks are a powerful type of neural network designed to handle sequence dependence. The principal advantage of RNN over ANN is that RNN can model a collection of records (i.e. time collection) so that each pattern can be assumed to be dependent on previous ones. On the other hand, comparisons against ETS (error, trend, seasonal) and ARIMA demonstrate that (semi-) automatic RNN models are not silver bullets, but they are nevertheless competitive alternatives in many situations [69].
In this paper, we tested above-mentioned approaches, which are the most common and the most promising methods in time-series forecasting, in order to predict bee exits from and entries to the hive. This information may be important during periods when fruits and vegetables are sprayed, so that we can close bee hives when high activity is expected. First, we started from traditional approach ARIMA [70]. ARIMA is an acronym that stands for autoregressive integrated moving average, which is a generalization of the simpler autoregressive moving average that adds the notion of integration. After that, we tested two more advanced approaches, Facebook Prophet [71] and recurrent neural networks (LSTM) [72]. In the following subsections, a short description of these techniques is given. For more details, we refer readers to the original papers.

6.1. ARIMA

An ARIMA model is a class of statistical models for analyzing and forecasting time-series data. The model is fitted to time-series data to either better understand the data or predict future points in the series, known as forecasting. The model acronym was obtained after the key aspects of the model itself:
  • AR: Autoregression. A model that uses the dependent relationship between an observation and some number of lagged observations.
  • I: Integrated. The use of the differencing of raw observations (i.e., subtracting an observation from an observation at the previous time step) in order to make the time series stationary.
  • MA: Moving average. A model that uses the dependency between an observation and a residual error from a moving average model applied to lagged observations.
A standard notation used for ARIMA is ARIMA (p,d,q), where parameters p, d, and q can only be integer numbers denoting the lag order (number of lag observations included in the model), the degree of differencing (number of times that the raw observations are differenced), and the order of moving average (size of moving average window), respectively.
ARIMA works only with stationary time series. A stationary time series is one whose properties do not depend on the time at which the series is observed. One way to more objectively determine whether differencing is required is to use a unit root test. These are statistical hypothesis tests of stationarity that were designed for determining whether differencing is required. For this purpose, the Dickey–Fuller test was used (Table 2). The results of the test for output variables BEE_OUT and BEE_IN are presented below.
We could overwhelmingly reject the null hypothesis of a unit root at all common significance levels. In other words, the observed time series were stationary.

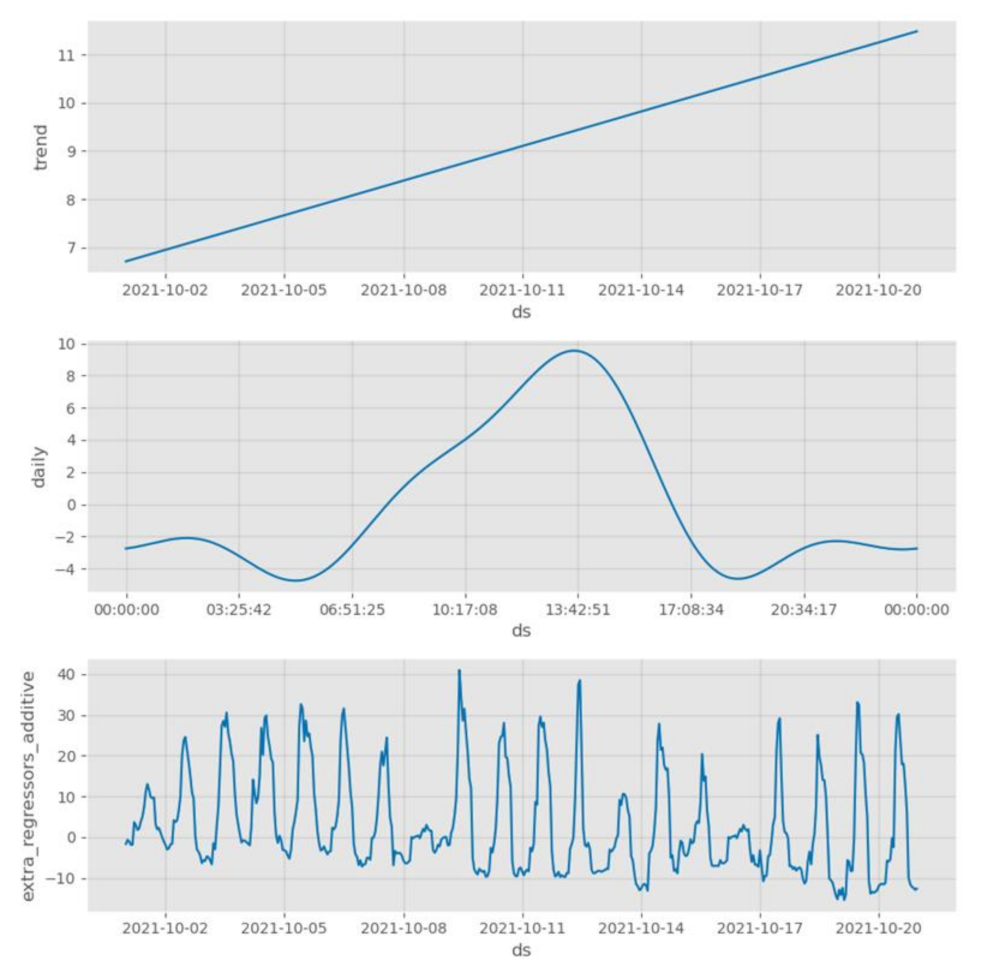
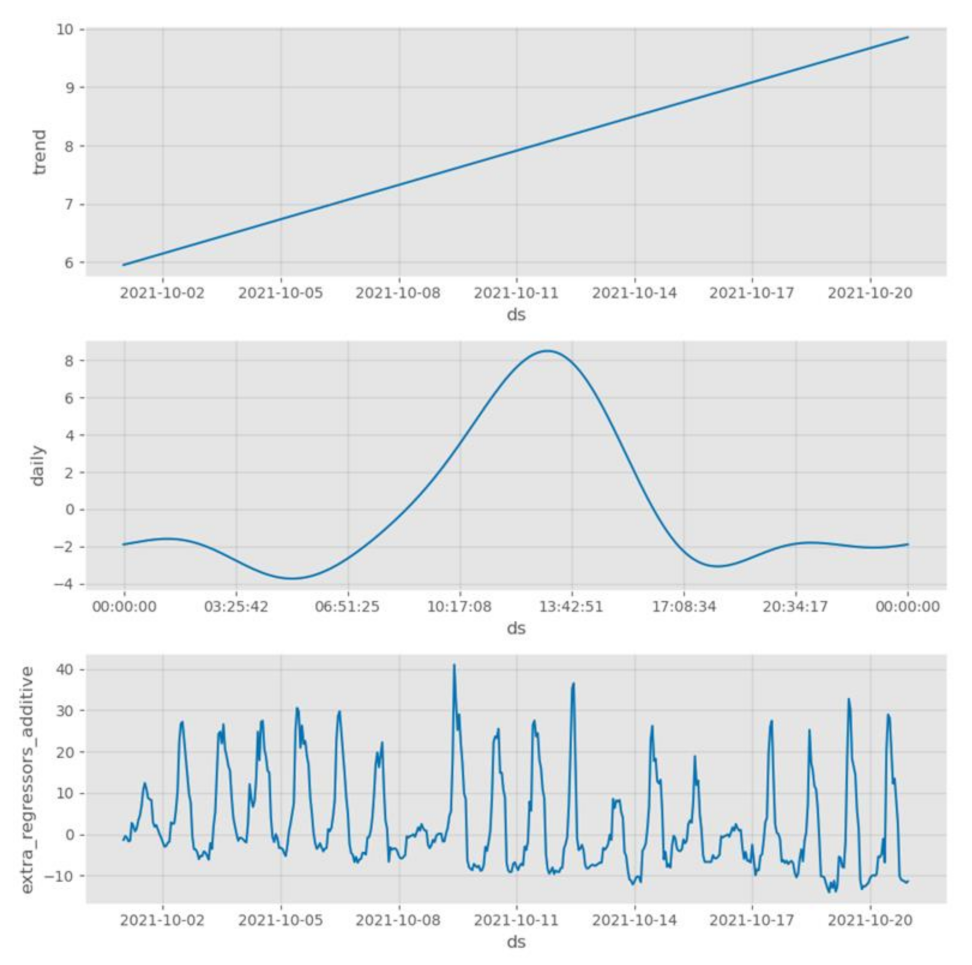
6.2. Facebook Prophet

While ARIMA is autoregressive forecasting that fits a linear regression line with the lag values and error terms, Facebook Prophet is a procedure for forecasting time-series data on the basis of an additive model where nonlinear trends are fit with yearly, weekly, and daily seasonality, plus holiday effects. It works best with time series that have strong seasonal effects and several seasons of historical data. Prophet is robust to missing data and shifts in the trend, and typically handles outliers well. This is based on generalized additive models (GAMs), which provide a general framework for extending a standard linear model by allowing for nonlinear functions of each of the variables while maintaining additivity. Just like linear models, GAMs can be applied with both quantitative and qualitative responses.
In this model, three main components were used: trend, seasonality, and holidays. They were combined in the following equation.
y t = g t + s t + h t + t ,
where g t is the trend function that models nonperiodic changes in the value of the time series,   s t represents periodic changes (e.g., weekly and yearly seasonality), and h t represents the effects of holidays that occur on potentially irregular schedules over one or more days. Error term t   represents any idiosyncratic changes not accommodated by the model. The detected components for the entire BEE_OUT time series, trend, daily behaviour, and the influence of the added regressors are shown in Figure 8. Similar graphics were obtained for the entire BEE_IN time series (Figure 9).
Facebook Prophet is very popular in time-series forecasting because it is robust to outliers, missing data, and dramatic changes in time series, whereas ARIMA is prone to white noise and nonstationary signals. The existence of outliers and missing data in such use cases is certain, bearing in mind that equipment may sometimes break down.
Here, we explore the problem of flexibly predicting Y on the basis of several predictors, X 1 ,     ,   X p . Possible input variables were carefully selected from Table 1. More information of the selected features is provided in the results section.

6.3. LSTM Model

A recurrent neural network (RNN) is a class of artificial neural networks where connections between nodes form a directed graph along a temporal sequence. This allows for it to exhibit temporal dynamic behavior. They are distinguished by their memory, as they take information from prior inputs to influence the current input and output. While traditional deep neural networks assume that inputs and outputs are independent of each other, the output of recurrent neural networks depends on prior elements within the sequence. While future events would also be helpful in determining the output of a given sequence, unidirectional recurrent neural networks cannot account for these events in their predictions.
These deep-learning algorithms are commonly used for ordinal or temporal problems such as language translation [73], natural language processing (NLP) [74], speech recognition [75], and image captioning [76].
There are three types of vanilla recurrent neural network: simple (RNN), gated recurrent unit (GRU), and long short-term memory unit (LSTM). The difference among them is shown in Figure 10, but we omit the details because they are outside the scope of this paper. Long short-term memory (LSTM) networks were invented by Hochreiter and Schmidhuber in 1997 [72], and they set accuracy records in multiple application domains. Here, LSTM cells were used for the time-series modeling.

7. Experimental Setup and Evaluation

In order to test the robustness of the models, a time-series cross-validator was used in the experiments. The TimeSeriesSplit class from scikit-learn library provides a very simple interface to split time-series data samples that are observed at fixed time intervals into training and test sets. In each split, test indices are higher than before; thus, shuffling in the cross-validator is inappropriate. In other words, this cross-validation object is a variation of Kfold, where in the k-th split, it returns the first k folds as the training set, and the (k+1)-th fold as the test set.
  • ARIMA: In our experiments, different values for the p, d, and q parameters were tested, and the ARIMA model with the smallest RMSE error was selected for further testing. For p, parameter values of 0, 1, 2, 4, 6, 8, and 10 were tested, while d and q values were tested for values ranging from 0 to 3. A combination of parameters (p, d, q) that showed the best performance of the ARIMA model for BEE_OUT and BEE_IN outputs was (p, d, q) = (10, 0, 2); for BEE_IN, the combination of (0, 0, 2) was selected.
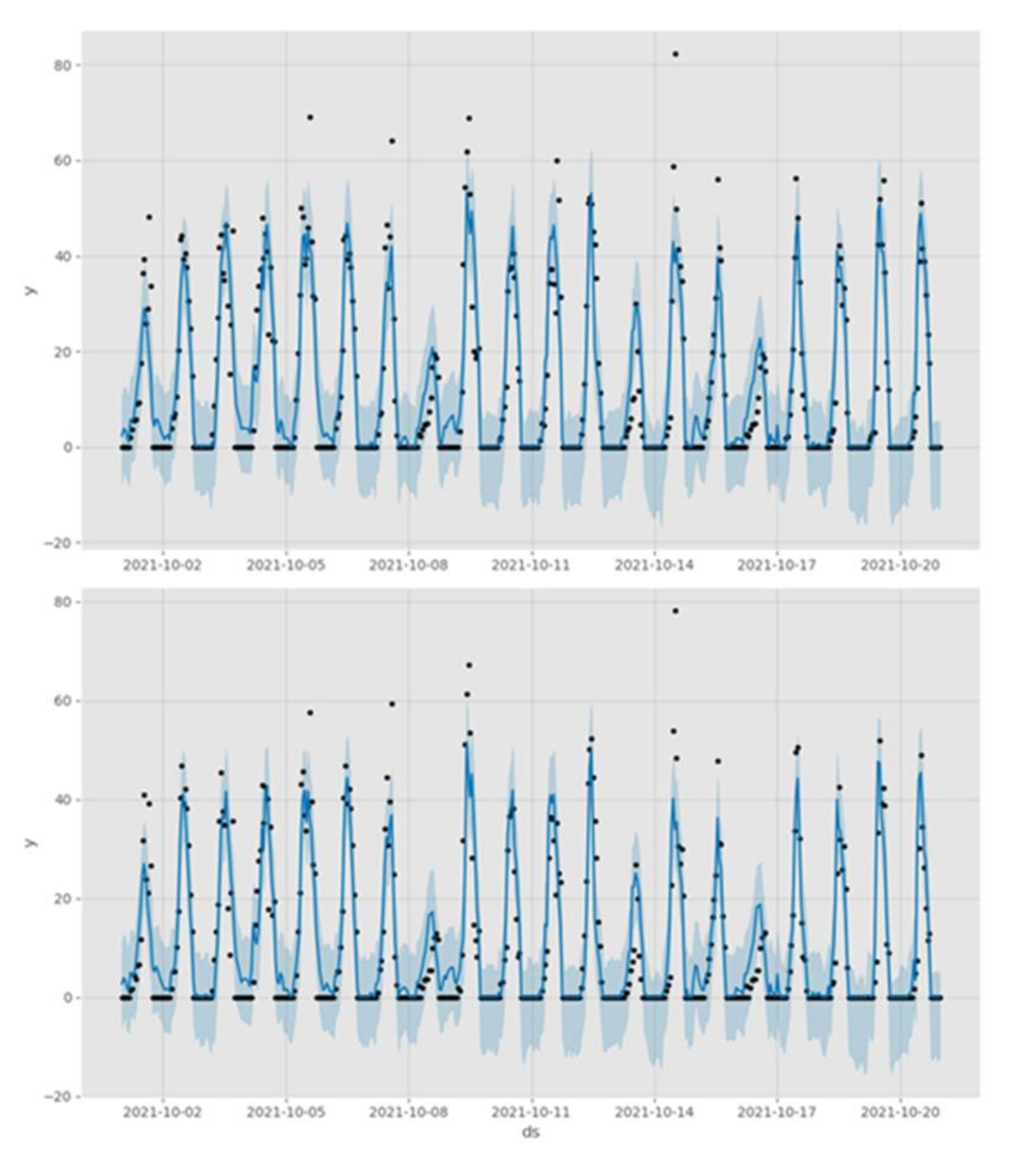
  • Facebook Prophet: Different combinations of input variables from Table 1 were tested, but the best results were obtained by using the following variables: AM2302_1_Temp, AM2302_1_Humi, AM2302_2_Temp HIVE, AM2302_2_Humi HIVE, MHRD_rain, MQ135_PPM, BH1750_lux, VEML6750_uvindex, and Day_night.
Parameters with the greatest influence on movements used to produce the prediction model were temperature and relative humidity inside and outside of the hive, the presence of rain, air quality, the range and intensity of daylight, UV radiation, and night and day shifts.
The forecast for the entire BEE_OUT time series is shown in Figure 11. This figure is given only to show that Facebook Prophet can successfully learn from the observed time series. In the results, the complete time-series forecast and presented metrics are based on previously invisible data (test dataset).
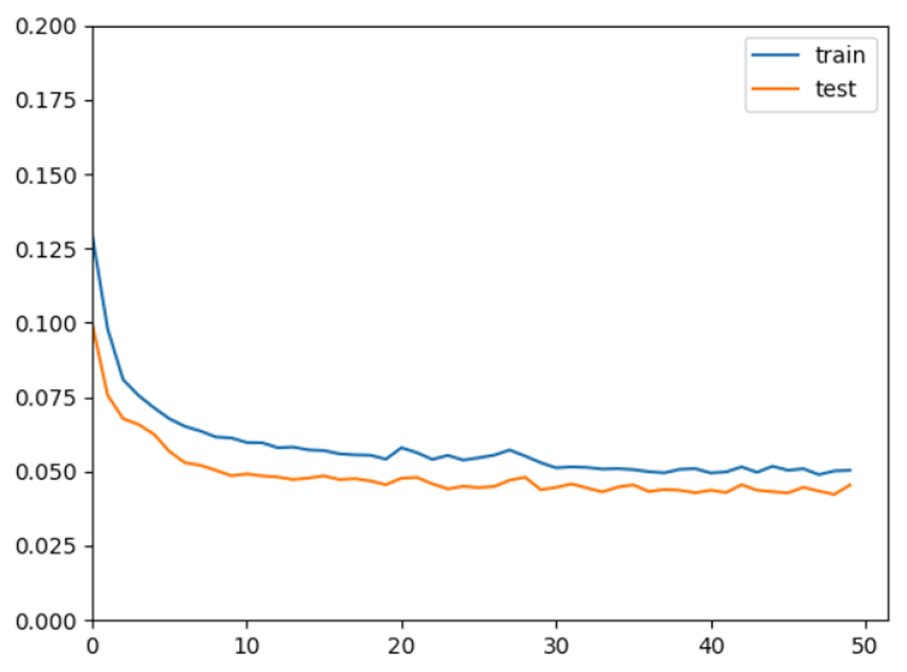
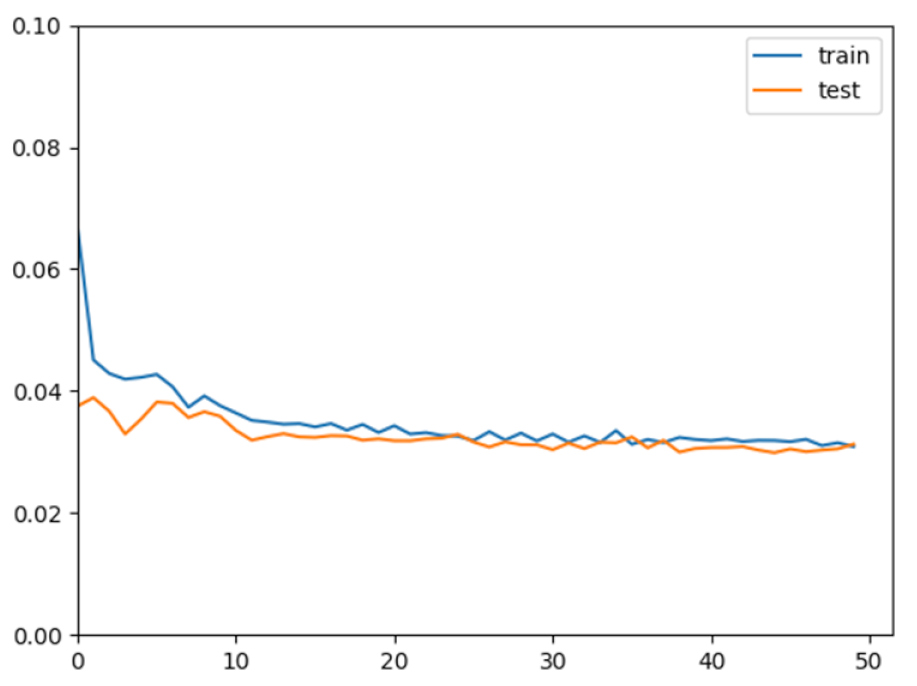
  • Recurrent neural networks: The first step is to prepare the BEE dataset for the LSTM. This involves framing the dataset as a supervised-learning problem and normalizing the input variables. The same variables used by the Facebook Prophet algorithm were also used here. The supervised-learning problem is framed as predicting the bee exit or entrance at the current hour (t) given the bee exit or entrance measurement, and weather conditions at the prior time step. After this transformation step, the ten input variables (input series) and one output variable (bee exit or entrance at the current hour) are
v a r 1 t 1 ,   v a r 1 t 1 ,   ,   v a r 10 t 1 ,   v a r 1 t  
We defined the LSTM with 50 neurons in the first hidden layer, and 1 neuron in the output layer for predicting bee activity. The input shape was one time step with 10 features. Mean absolute error (MAE) was used as the loss function and the efficient Adam version of stochastic gradient descent. The model was fit for 50 training epochs with a batch size of 20. Lastly, we monitored both training and test loss during the training phase. At the end of the run, both training and test loss were plotted. Resulting loss curves during the training and validation phases for the BEE_OUT and BEE_IN outputs are shown in Figure 12 and Figure 13, respectively.
Separate time-series forecasts on the test set for each fold are shown in Figure 14. The machine learning (ML) applied to the time-series data, in this case, recurrent neural networks, is an efficient and effective way to analyze the data, apply a forecasting algorithm, and derive an accurate forecast.
All aggregated results are shown in Table 3. The best results were achieved by using recurrent neural networks, where the average RMSE on the test sets was 426.49 for BEE_OUT time series; for the BEE_IN time series, RMSE had a value of 378.464.
Table 4 shows the summarized optimal parameters for all investigated methods.

8. Conclusions

Comparisons of the experimental data against the model showed that our model represents the observed processes well. This is indicated by the results shown in the figures. According to the obtained results, the best model could achieve reliable bee activity prediction, with an error of only 8.9 missed bees per hour for bee exits from, and 7.8 missed bees per hour for bee entrances in a hive. We expect to see higher errors per hour when measurements are produced in the spring and summer months, and that additional feature engineering can help in model improving.
Apiculture presents complex problems pertinent to the life and wellbeing of bees. This paper presented a complete system for the monitoring and predictive analysis of honeybee activity, which addresses complex problems arising in beekeeping. Our aim was to improve existing solutions and create a fully developed system that would address some existing shortcomings.
The presented system is based on the application of IoT data collection and monitoring, machine-learning algorithms for beehive activity prediction, and remote control via IoT that enables undertaking certain corrective actions inside hives.
The increased number of sensors in the presented system is an important improvement over existing solutions. Each individual parameter influences bees in a different way and amount; however, when observed together and simultaneously, they provide more complete insight in the analysis of the results.
The application of advanced MAP enables the detection of sudden deviations and disruptions to the normal life of bees, and the prediction of potential disturbing changes. We showed that, by applying advanced algorithms, high-precision predictions on a daily basis are possible. In this way, by employing a real-time monitoring application and push notifications of potential changes, the beekeeper has real-time insight into the conditions of the hives, and can react adequately to prevent unwanted outcomes.
There are some limitations to our approach. For example, the testing phase was conducted on two beehives, and the main data were collected from one hive that had not been moved during the experiment. The experiment was conducted during a period in which there was no food from flowers, and when bee activity was less than that during spring.
In future work, the system will be upgraded with appropriate weight sensors, oxygen/carbon dioxide sensors, thermal sensors, automatic bee-feeding, ventilation, and gate-closing systems, and connectivity with other applications and solutions.
In future papers, we will provide extensive research that includes analysis of the influence of microwaves and the presence of electronic components. It is also necessary to include time as a special factor in reaching conclusions because, from a longer time instance, we come to experiential conclusions, since every change, measurement, or analysis requires some time to pass for the results to be qualitative.

Author Contributions

Conceptualization, N.A. and V.U.; methodology, V.U. and B.A.; software, N.A. and D.H.; formal analysis, V.U. and B.S.; resources, N.A.; data curation, N.A., B.A. and D.H.; writing—original draft preparation, N.A. and B.A.; writing—review and editing, V.U., D.H. and B.S. All authors have read and agreed to the published version of the manuscript.

Funding

The APC was funded by [Higher Education Technical School of Professional Studies].

Conflicts of Interest

The authors declare no conflict of interest.

References

  1. Ngo, T.-N.; Rustia, D.; Yang, E.-C.; Lin, T.-T. Honey Bee Colony Population Daily Loss Rate Forecasting and an Early Warning Method Using Temporal Convolutional Networks. Sensors 2021, 21, 3900. [Google Scholar] [CrossRef]
  2. Hristov, P.; Shumkova, R.; Palova, N.; Neov, B. Factors Associated with Honey Bee Colony Losses: A Mini-Review. Vet. Sci. 2020, 7, 166. [Google Scholar] [CrossRef]
  3. Watson, K.; Stallins, J.A. Honey Bees and Colony Collapse Disorder: A Pluralistic Reframing. Geogr. Compass 2016, 10, 222–236. [Google Scholar] [CrossRef]
  4. Braga, A.R.; Gomes, D.G.; Rogers, R.; Hassler, E.E.; Freitas, B.M.; Cazier, J.A. A method for mining combined data from in-hive sensors, weather and apiary inspections to forecast the health status of honey bee colonies. Comput. Electron. Agric. 2020, 169, 105161. [Google Scholar] [CrossRef]
  5. Zabasta, A.; Zhiravetska, A.; Kunicina, N.; Kondratjevs, K. Technical Implementation of IoT Concept for Bee Colony Monitoring. In Proceedings of the 2019 8th Mediterranean Conference on Embedded Computing (MECO), Budva, Montenegro, 10–14 June 2019. [Google Scholar] [CrossRef]
  6. Muhammad, Z.; Saxena, N.; Qureshi, I.M.; Ahn, C.W. Hybrid Artificial Bee Colony Algorithm for an Energy Efficient Internet of Things based on Wireless Sensor Network. IETE Tech. Rev. 2017, 34, 39–51. [Google Scholar] [CrossRef]
  7. Edwards-Murphy, F.; Magno, M.; Whelan, P.M.; O’Halloran, J.; Popovici, E.M. b+WSN: Smart beehive with preliminary decision tree analysis for agriculture and honey bee health monitoring. Comput. Electron. Agric. 2016, 124, 211–219. [Google Scholar] [CrossRef]
  8. Clarke, D.; Robert, D. Predictive modelling of honey bee foraging activity using local weather conditions. Apidologie 2018, 49, 386–396. [Google Scholar] [CrossRef] [Green Version]
  9. Fiedler, S.; Zacepins, A.; Kviesis, A.; Komasilovs, V.; Wakjira, K.; Nawawi, M.; Hensel, O.; Purnomo, D. Implementation of the Precision Beekeeping System for Bee Colony Monitoring in Indonesia and Ethiopia. In Proceedings of the 2020 21th International Carpathian Control Conference (ICCC), High Tatras, Slovakia, 27–29 October 2020. [Google Scholar]
  10. Komasilovs, V.; Zacepins, A.; Kviesis, A.; Fiedler, S.; Kirchner, S. Modular sensory hardware and data processing solution for implementation of the precision beekeeping. Agron. Res. 2019, 17, 509–517. [Google Scholar] [CrossRef]
  11. Catania, P.; Vallone, M. Design of an innovative system for precision beekeeping. In Proceedings of the 2019 IEEE International Workshop on Metrology for Agriculture and Forestry (MetroAgriFor), Portici, Italy, 24–26 October 2019; pp. 323–327. [Google Scholar]
  12. Zacepins, A.; Brusbardis, V.; Meitalovs, J.; and Stalidzans, E. Challenges in the development of precision beekeep-ing. Biosyst. Eng. 2015, 130, 60–71. [Google Scholar] [CrossRef]
  13. Catania, P.; Vallone, M. Application of A Precision Apiculture System to Monitor Honey Daily Production. Sensors 2020, 20, 2012. [Google Scholar] [CrossRef] [Green Version]
  14. Henry, E.; Adamchuk, V.; Stanhope, T.; Buddle, C.; Rindlaub, N. Precision apiculture: Development of a wireless sensor network for honeybee hives. Comput. Electron. Agric. 2018, 156, 138–144. [Google Scholar] [CrossRef] [Green Version]
  15. Kviesis, A.; Komasilovs, V.; Komasilova, O.; Zacepins, A. Application of fuzzy logic for honey bee colony state detection based on temperature data. Biosyst. Eng. 2020, 193, 90–100. [Google Scholar] [CrossRef]
  16. Abou-Shaara, H.F.; Owayss, A.A.; Ibrahim, Y.Y.; Basuny, N.K. A review of impacts of temperature and relative humidity on various activities of honey bees. Insectes Sociaux 2017, 64, 455–463. [Google Scholar] [CrossRef]
  17. Meikle, W.G.; Weiss, M.; Maes, P.W.; Fitz, W.; Snyder, L.A.; Sheehan, T.; Mott, B.M.; Anderson, K.E. Internal hive temperature as a means of monitoring honey bee colony health in a migratory beekeeping operation before and during winter. Apidologie 2017, 48, 666–680. [Google Scholar] [CrossRef] [Green Version]
  18. Zacepins, A. Application of bee hive temperature measurements for recognition of bee colony state. In Proceedings of the 5th International Scientific Conference on Applied Information and Communication Technologies, Jelgava, Latvia, 26–27 April 2012; pp. 216–221. [Google Scholar]
  19. Rybin, V.G.; Rodionova, E.A.; Karimov, A.I.; Kopets, E.E.; Chernetskiy, E.S. Remote Data Acquisition System for Apiary Monitoring. In Proceedings of the 2021 IEEE Conference of Russian Young Researchers in Electrical and Electronic Engineering (ElConRus), St. Petersburg, Russia, 26–29 January 2021; pp. 1059–1062. [Google Scholar]
  20. Du, N.H.; Dong, N.D.; Luu, V.T.; Van Hoang, N.; Thai, P.H.; Ngoc, P.T.; Long, N.V.; Hong, P.T.T. Toward Audio Beehive Monitoring Based on IoT-AI techniques: A Survey and Perspective. Vietnam J. Agric. Sci. 2020, 3, 530–540. [Google Scholar] [CrossRef]
  21. Craig, L.M.; Parry, R.M.; Tashakkori, R.; Watts, I. BeePhon: A Web-Application for Beehive Audio Exploration. In Proceedings of the 2019 SoutheastCon, Huntsville, AL, USA, 11–14 April 2019. [Google Scholar] [CrossRef]
  22. Cecchi, S.; Terenzi, A.; Orcioni, S.; Riolo, P.; Ruschioni, S.; Isidoro, N. A Preliminary Study of Sounds Emitted by Honey Bees in a Beehive. In Audio Engineering Society Convention 144; Audio Engineering Society: Milan, Italy, 2018. [Google Scholar]
  23. Murphy, F.E.; Srbinovski, B.; Magno, M.; Popovici, E.M.; Whelan, P.M. An automatic, wireless audio recording node for analysis of beehives. In Proceedings of the 2015 26th Irish Signals and Systems Conference (ISSC), Carlow, Ireland, 24–25 June 2015; pp. 1–6. [Google Scholar]
  24. Kulyukin, V.; Mukherjee, S.; Amlathe, P. Toward Audio Beehive Monitoring: Deep Learning vs. Standard Machine Learning in Classifying Beehive Audio Samples. Appl. Sci. 2018, 8, 1573. [Google Scholar] [CrossRef] [Green Version]
  25. Anand, N.; Raj, V.B.; Ullas, M.S.; Srivastava, A. Swarm Detection and Beehive Monitoring System using Auditory and Microclimatic Analysis. In Proceedings of the 2018 3rd International Conference on Circuits, Control, Communication and Computing (I4C), Bangalore, India, 3–5 October 2018; pp. 1–4. [Google Scholar]
  26. Robles-Guerrero, A.; Saucedo-Anaya, T.; González-Ramérez, E.; Galván-Tejada, C.E. Frequency Analysis of Honey Bee Buzz for Automatic Recognition of Health Status: A Preliminary Study. Res. Comput. Sci. 2017, 142, 89–98. [Google Scholar] [CrossRef]
  27. Szczurek, A.; Maciejewska, M.; Bąk, B.; Wilde, J.; Siuda, M. Semiconductor gas sensor as a detector of Varroa destructor infestation of honey bee colonies—Statistical evaluation. Comput. Electron. Agric. 2019, 162, 405–411. [Google Scholar] [CrossRef]
  28. Bromenshenk, J.J.; Henderson, C.B.; Seccomb, R.A.; Welch, P.M.; Debnam, S.E.; Firth, D.R. Bees as Biosensors: Chemosensory Ability, Honey Bee Monitoring Systems, and Emergent Sensor Technologies Derived from the Pollinator Syndrome. Biosensors 2015, 5, 678–711. [Google Scholar] [CrossRef] [Green Version]
  29. Hennessy, G.; Harris, C.; Eaton, C.; Wright, P.; Jackson, E.; Goulson, D.; Ratnieks, F.F. Gone with the wind: Effects of wind on honey bee visit rate and foraging behaviour. Anim. Behav. 2020, 161, 23–31. [Google Scholar] [CrossRef]
  30. da Silva, D.; Rodrigues, Í.; Braga, A.; Nobre, J.; Freitas, B.; Gomes, D. An Autonomic, Adaptive and High-Precision Statistical Model to Determine Bee Colonies Well-Being Scenarios. In Anais do XI Workshop de Computação Aplicada à Gestão do Meio Ambiente e Recursos Naturais; SBC: Porto Alegre, Brazil, 2020. [Google Scholar] [CrossRef]
  31. Rybin, V.G.; Butusov, D.N.; Karimov, T.I.; Belkin, D.A.; Kozak, M.N. Embedded data acquisition system for beehive monitoring. In Proceedings of the 2017 IEEE II International Conference on Control in Technical Systems (CTS), Saint Petersburg, Russia, 25–27 October 2017; pp. 387–390. [Google Scholar]
  32. Cecchi, S.; Spinsante, S.; Terenzi, A.; Orcioni, S. A Smart Sensor-Based Measurement System for Advanced Bee Hive Monitoring. Sensors 2020, 20, 2726. [Google Scholar] [CrossRef] [PubMed]
  33. Murphy, F.E.; Magno, M.; Whelan, P.; Vici, E.P. b+WSN: Smart beehive for agriculture, environmental, and honey bee health monitoring—Preliminary results and analysis. In Proceedings of the 2015 IEEE Sensors Applications Symposium (SAS), Zadar, Croatia, 13–15 April 2015; pp. 1–6. [Google Scholar]
  34. Meikle, W.G.; Holst, N. Application of continuous monitoring of honeybee colonies. Apidologie 2014, 46, 10–22. [Google Scholar] [CrossRef] [Green Version]
  35. Marchal, P.; Buatois, A.; Kraus, S.; Klein, S.; Gómez-Moracho, T.; Lihoreau, M. Automated monitoring of bee behaviour using connected hives: Towards a computational apidology. Apidologie 2020, 51, 356–368. [Google Scholar] [CrossRef]
  36. Ngo, T.N.; Wu, K.C.; Yang, E.-C.; Lin, T.T. A real-time imaging system for multiple honey bee tracking and activity moni-toring. Comput. Electron. Agric. 2019, 163, 104841. [Google Scholar] [CrossRef]
  37. Cousin, P.; Cauia, E.; Siceanu, A.; de Cledat, J. The Development of an Efficient System to Monitor the Honeybee Colonies Depopulations. In Proceedings of the 2019 Global IoT Summit (GIoTS), Aarhus, Denmark, 17–21 June 2019. [Google Scholar]
  38. Kridi, D.S.; de Carvalho, C.G.N.; Gomes, D.G. Application of wireless sensor networks for beehive monitoring and in-hive thermal patterns detection. Comput. Electron. Agric. 2016, 127, 221–235. [Google Scholar] [CrossRef]
  39. Sachin, K.; Gagana, M.R.; Rubab, H.; Jalaja, G.S.; Jayanand, J. Monitoring of Honey Bee Hiving System using Sensor Networks. Int. J. Eng. Res. Technol. 2020, 9, 527–530. [Google Scholar] [CrossRef]
  40. Zacepins, A.; Kviesis, A.; Komasilovs, V.; Muhammad, F.R. Monitoring System for Remote Bee Colony State Detection. Balt. J. Mod. Comput. 2020, 8, 461–470. [Google Scholar] [CrossRef]
  41. Gil-Lebrero, S.; Quiles-Latorre, F.J.; Ortiz-López, M.; Sánchez-Ruiz, V.; Gámiz-López, V.; Luna-Rodríguez, J.J. Honey bee colonies remote monitoring system. Sensors 2017, 17, 55. [Google Scholar] [CrossRef] [Green Version]
  42. Jiang, J.-A.; Wang, C.-H.; Chen, C.-H.; Liao, M.-S.; Su, Y.-L.; Chen, W.-S.; Huang, C.-P.; Yang, E.-C. A WSN-based automatic monitoring system for the foraging behavior of honey bees and environmental factors of beehives. Comput. Electron. Agric. 2016, 123, 304–318. [Google Scholar] [CrossRef]
  43. Vidrascu, M.G.; Svasta, P.M.; Vladescu, M. High reliability wireless sensor node for bee hive monitoring. In Proceedings of the 2016 IEEE 22nd International Symposium for Design and Technology in Electronic Packaging (SIITME), Oradea, Romania, 20–23 October 2016; pp. 134–138. [Google Scholar]
  44. Chen, W.-S.; Wang, C.-H.; Jiang, J.-A.; Yang, E.-C. Develpment of a Monitoring System for Honeybee Activities. In Proceedings of the 2015 Minth International Conference on Sensing Technology, Auckland, New Zealand, 8–10 December 2015; pp. 745–750. [Google Scholar]
  45. Cecchi, S.; Terenzi, A.; Orcioni, S.; Spinsante, S.; Primiani, V.M.; Moglie, F.; Ruschioni, S.; Mattei, C.; Riolo, P.; Isidoro, N. Multi-sensor platform for real time measurements of honey bee hive parameters. IOP Conf. Series Earth Environ. Sci. 2019, 275, 012016. [Google Scholar] [CrossRef]
  46. Dogan, S.; Akbal, E.; Ozmen Koca, G.; Balta, A. Design of a remote Controlled Beehive for Improving Efficiency of Beekeeping Activities. In Proceedings of the 8th International Advanced Technologies Symposium (IATS’17), Elazig, Turkey, 19–22 October 2017; Firat Universites: Elazığ, Turkey, 2017; pp. 1084–1090. [Google Scholar]
  47. Balta, A.; Dogan, S.; Ozmen Koca, G.; Akbal, E. Software Modeling of Remote Controlled Beehive Design. In Proceedings of the International Conference on Advances and Innovations in Engineering (ICAIE), Elazig, Turkey, 10–12 May 2017; pp. 1133–1137. [Google Scholar]
  48. Giammarini, M.; Concettoni, E.; Zazzarini, C.C.; Orlandini, N.; Albanesi, M.; Cristalli, C. BeeHive Lab project-Sensorized hive for bee colonies life study. In Proceedings of the 2015 12th International Workshop on Intelligent Solutions in Embedded Systems (WISES), Ancona, Italy, 29–30 October 2015; pp. 121–125. [Google Scholar]
  49. Hong, W.; Xu, B.; Chi, X.; Cui, X.; Yan, Y.; Li, T. Long-Term and Extensive Monitoring for Bee Colonies Based on Internet of Things. IEEE Internet Things J. 2020, 7, 7148–7155. [Google Scholar] [CrossRef]
  50. Ochoa, I.Z.; Gutiérrez, S.; Rodriguez, F. Internet of Things: Low Cost Monitoring BeeHive System using Wireless Sensor Network. In Proceedings of the 2019 IEEE International Conference on Engineering Veracruz, ICEV 2019, Boca del Rio, Veracruz, 14–17 October 2019; pp. 1–7. [Google Scholar] [CrossRef]
  51. Kontogiannis, S. An Internet of Things-Based Low-Power Integrated Beekeeping Safety and Conditions Monitoring System. Inventions 2019, 4, 52. [Google Scholar] [CrossRef] [Green Version]
  52. Pešović, U.; Marković, D.; Đurašević, S.; Ranđić, S. Remote monitoring of beehive activity. Acta Agric. Serbica 2019, 24, 157–165. [Google Scholar] [CrossRef] [Green Version]
  53. Debauche, O.; El Moulat, M.; Mahmoudi, S.; Boukraa, S.; Manneback, P.; Lebeau, F. Web monitoring of bee health for re-searchers and beekeepers based on the internet of things. Procedia Comput. Sci. 2018, 130, 991–998. [Google Scholar] [CrossRef]
  54. Dineva, K. Computer system using internet of things for monitoring of bee hives. Int. Multidiscip. Sci. GeoConference SGEM 2017, 17, 27. [Google Scholar] [CrossRef]
  55. Lyu, X.; Zhang, S.; Wang, Q. Design of Intelligent Beehive System based on Internet of Things Technology. In Proceedings of the 3rd International Conference on Computer Engineering, Information Science & Application Technology (ICCIA 2019), Chongqing, China, 30–31 May 2019. [Google Scholar]
  56. Zabasta, A.; Kunicina, N.; Kondratjevs, K.; Ribickis, L. IoT Approach Application for Development of Autonomous Beekeeping System. In Proceedings of the 2019 International Conference in Engineering Applications (ICEA), Sao Miguel, Portugal, 8–11 July 2019; pp. 1–6. [Google Scholar]
  57. Vidrascu, M.G.; Svasta, P.M. Embedded software for IOT bee hive monitoring node. In Proceedings of the 2017 IEEE 23rd International Symposium for Design and Technology in Electronic Packaging (SIITME), Constanța, Romania, 26–29 October 2017; pp. 183–188. [Google Scholar]
  58. Zacepins, A.; Kviesis, A.; Pecka, A.; Osadcuks, V. Development of Intrenet of Things concept for Precission bee-keeping. In Proceedings of the 2017 18th International Carpathian Control Conference (ICCC), Sinaia, Romania, 28–31 May 2017; pp. 28–31. [Google Scholar]
  59. Kviesis, A.; Zacepins, A. Application of neural networks for honey bee colony state identification. In Proceedings of the 2016 17th International Carpathian Control Conference (ICCC), High Tatras, Slovakia, 29 May–1 June 2016; pp. 413–417. [Google Scholar]
  60. Zgank, A. IoT-Based Bee Swarm Activity Acoustic Classification Using Deep Neural Networks. Sensors 2021, 21, 676. [Google Scholar] [CrossRef]
  61. Chen, C.; Yang, E.-C.; Jiang, J.-A.; Lin, T.-T. An imaging system for monitoring the in-and-out activity of honey bees. Comput. Electron. Agric. 2012, 89, 100–109. [Google Scholar] [CrossRef]
  62. Bermig, S.; Odemer, R.; Gombert, A.; Frommberger, M.; Rosenquist, R.; Pistorius, J. Experimental validation of an electronic counting device to determine flight activity of honey bees (Apis mellifera L.). J. Cultiv. Plants 2020, 72, 132–140. [Google Scholar] [CrossRef]
  63. Arnia: Remote Beehive Monitoring. Available online: https://www.arnia.co/ (accessed on 28 January 2022).
  64. Beecheck. Available online: https://beecheck.org/ (accessed on 28 January 2022).
  65. Bee Counter. Available online: https://www.beehivemonitoring.com/en/ (accessed on 28 January 2022).
  66. Honey Bee Counter. Available online: https://www.instructables.com/Honey-Bee-Counter/ (accessed on 28 January 2022).
  67. Fritzing Open-Source Software. Available online: https://fritzing.org (accessed on 28 January 2022).
  68. Supandi; Arkan, F.; Gusa, R.F.; Jumnahdi, M.; Kurniawan, R. Design of system for setting the temperature and monitoring bees in and out the hive. IOP Conf. Series: Earth Environ. Sci. 2020, 599, 012050. [Google Scholar] [CrossRef]
  69. Hewamalage, H.; Bergmeir, C.; Bandara, K. Recurrent Neural Networks for Time Series Forecasting: Current status and future directions. Int. J. Forecast. 2021, 37, 388–427. [Google Scholar] [CrossRef]
  70. Box, G.E.P.; Jenkins, G.M.; Reinsel, G.C.; Ljung, G.M. Time Series Analysis: Forecasting and Control, 5th ed.; John Wiley & Sons: Hoboken, NJ, USA, 2015; ISBN 9781118674925. [Google Scholar]
  71. Taylor, S.J.; Letham, B. Forecasting at scale. Am. Stat. 2018, 72, 37–45. [Google Scholar] [CrossRef]
  72. Hochreiter, S.; Schmidhuber, J. Long short-term memory. Neural Comput. 1997, 9, 1735–1780. [Google Scholar] [CrossRef] [PubMed]
  73. Wu, Y.; Schuster, M.; Chen, Z.; Le, Q.V.; Norouzi, M.; Macherey, W.; Dean, J. Google’s neural machine transla-tion system: Bridging the gap between human and machine translation. arXiv 2016, arXiv:1609.08144. [Google Scholar]
  74. Otter, D.W.; Medina, J.R.; Kalita, J.K. A Survey of the Usages of Deep Learning for Natural Language Processing. IEEE Trans. Neural Networks Learn. Syst. 2021, 32, 604–624. [Google Scholar] [CrossRef] [Green Version]
  75. Nassif, A.B.; Shahin, I.; Attili, I.; Azzeh, M.; Shaalan, K. Speech recognition using deep neural networks: A sys-tematic review. IEEE Access 2019, 7, 19143–19165. [Google Scholar] [CrossRef]
  76. Sharma, H.; Agrahari, M.; Singh, S.K.; Firoj, M.; Mishra, R.K. Image captioning: A comprehensive survey. In Proceedings of the 2020 International Conference on Power Electronics & IoT Applications in Renewable Energy and its Control (PARC), Mathura, India, 28–29 February 2020; pp. 325–328. [Google Scholar]
Figure 1. System overview.
Electronics 11 00783 g001
Figure 2. Experimental hive setup with sensor electronics.
Electronics 11 00783 g002
Figure 3. Schematic of data collection system.
Electronics 11 00783 g003
Figure 4. System schematic (created in Fritzing [67]).
Electronics 11 00783 g004
Figure 5. Application interface.
Electronics 11 00783 g005
Figure 6. Shape of seven time series corresponding to output and inputs.
Electronics 11 00783 g006
Figure 7. Number of bees counted per hour for 20 days.
Electronics 11 00783 g007
Figure 8. Results of training phase of Facebook Prophet algorithm for BEE_OUT variable.
Electronics 11 00783 g008
Figure 9. Results of training phase of Facebook Prophet algorithm for BEE_IN variable.
Electronics 11 00783 g009
Figure 10. Network structure of RNN, LSTM, and GRU.
Electronics 11 00783 g010
Figure 11. Forecast for the entire (20 days) BEE_OUT and BEE_IN time series.
Electronics 11 00783 g011
Figure 12. Bee OUT training phase.
Electronics 11 00783 g012
Figure 13. Bee IN training phase.
Electronics 11 00783 g013
Figure 14. (blue) Original segment of BEE_OUT time series; (red) prediction for each fold (fivefold time-series split).
Electronics 11 00783 g014
Table 1. Sensors, control sensors, and description of measurements.
Column NameDescriptionColumn NameDescription
DateDate of measuringBME280_humiOutside humidity control
HourTime of measuringBME280_pressureAir pressure
AM2302_1_TempOutside air temperatureBME280_altAltitude
AM2302_1_HumiOutside humiditySI1145_visibleDaylight intensity
AM2302_2_Temp HIVETemperature in a hiveSI1145_IRInfrared intensity
AM2302_2_Humi HIVEHumidity in a hiveSI1145_UVUV index control
SW420_Vibrate HIVEVibrations in a hiveANEM_voltageWind force
MHRD_rainRain sensorANEM_windSpeedWind speed
MQ135_PPMAir quality sensorMIC1_freqFrequency spectrum
MICS6814_PPMAir quality sensorMIC1_volumeSound level and loudness
MICS5524_PPM HIVEAir quality sensor in a hiveMIC2_freq HIVEFrequency spectrum in a HIVE
BH1750_luxDay light and lux intensityMIC2_volume HIVESound level and loudness in a HIVE
VEML6750_uvindexUV indexBEECNT_message OUTBee counter OUT HIVE
BME280_tempOuside temperature controlBEECNT_message INBee counter IN HIVE
DateDate of measuringBME280_humiOutside humidity control
HourTime of measuringBME280_pressureAir pressure
AM2302_1_TempOutside air temperatureBME280_altAltitude
AM2302_1_HumiOutside humiditySI1145_visibleDaylight intensity
AM2302_2_Temp HIVETemperature in a hiveSI1145_IRInfrared intensity
Table 2. Results of Dickey–Fuller test.
BEE_OUTBEE_IN
Results of Dickey–Fuller Test:Results of Dickey–Fuller Test:
Test Statistic−8.410Test Statistic−9.169
p-value2.112 × 10−13p-value2.406 × 10−15
#Lags Used14#Lags Used3
Number of Observations Used465Number of Observations Used476
Critical Value (1%)−3.444Critical Value (1%)−3.444
Critical Value (5%)−2.867Critical Value (5%)−2.867
Critical Value (10%)−2.570Critical Value (10%)−2.570
Table 3. Results using recurrent neural network.
MODELCV Test RMSE OUTCV Test RMSE IN
ARIMA894.92511.77
Facebook Prophet589.97475.25
LSTM426.49378.464
Table 4. Comparison of summarized optimal parameters for all investigated methods.
Algorithm ParametersBEE OUT/IN
ARIMAFor BEE OUT
(p, d, q): (10, 0, 2)
For BEE IN
(p, d, q): (0, 0, 2)
Facebook ProphetYearly seasonality: false
Weekly seasonality: false
Daily seasonality: true
Recurrent Neural NetworksRNN cell type: LSTM
LSTM number: 50
Loss function: mean absolute error
Batch size: 20
Optimizer: Adam
Learning rate: 1 × 10⁻³
Epochs: 50
Publisher’s Note: MDPI stays neutral with regard to jurisdictional claims in published maps and institutional affiliations.

