
A Novel Path Voting Algorithm for Surface Crack Detection


Abstract
:1. Introduction
2. Related Work
2.1. Crack Detection Using 2D Images
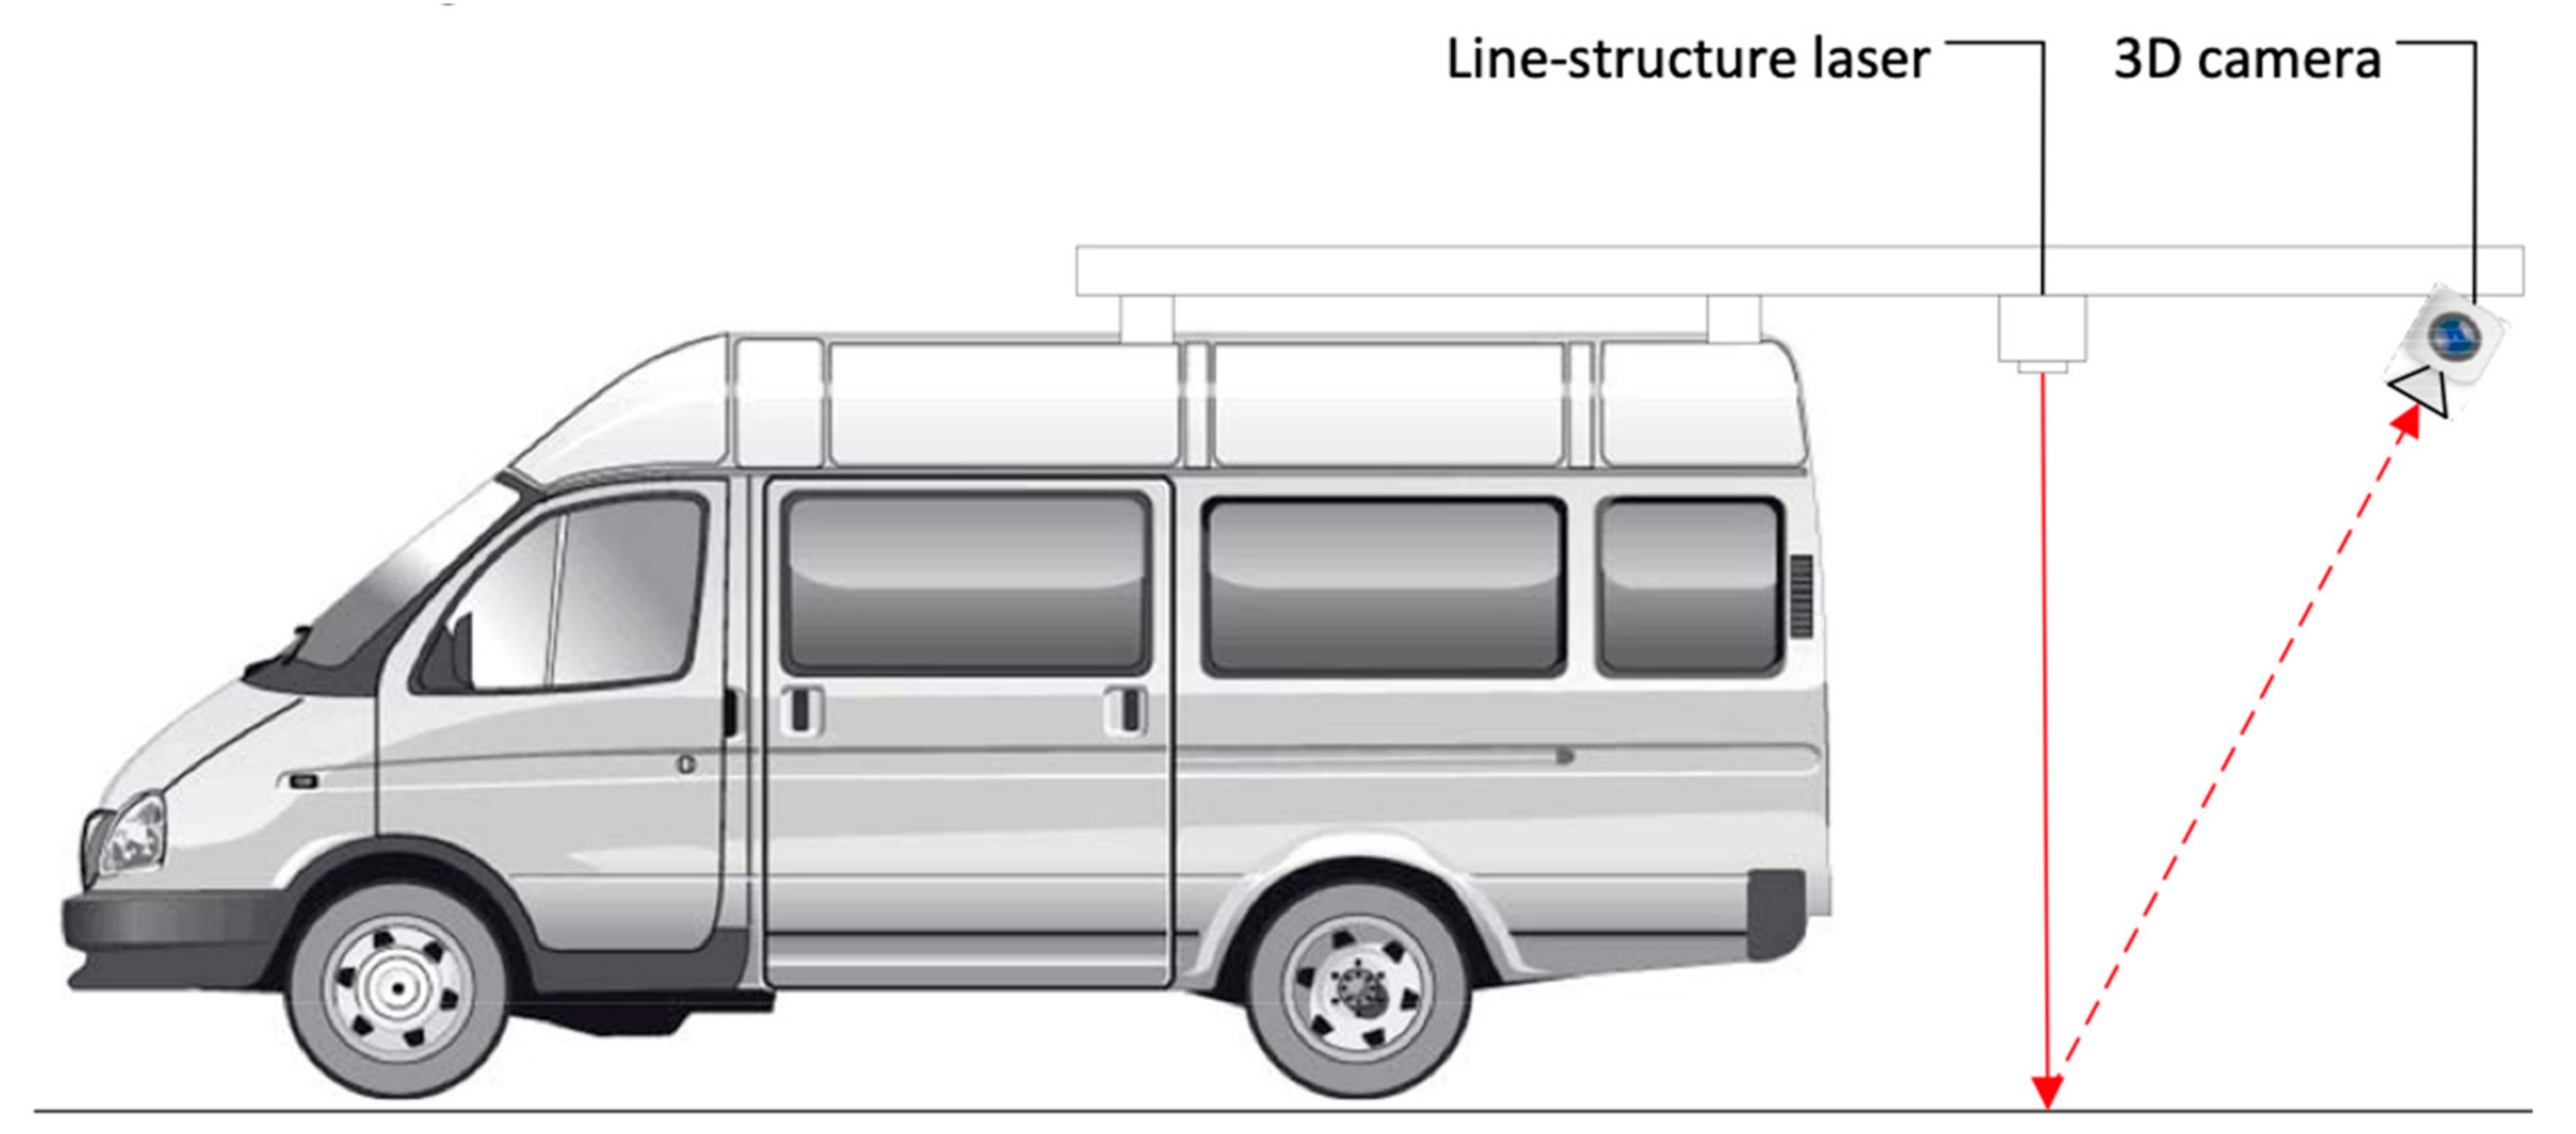
2.2. Crack Detection Using 3D Images
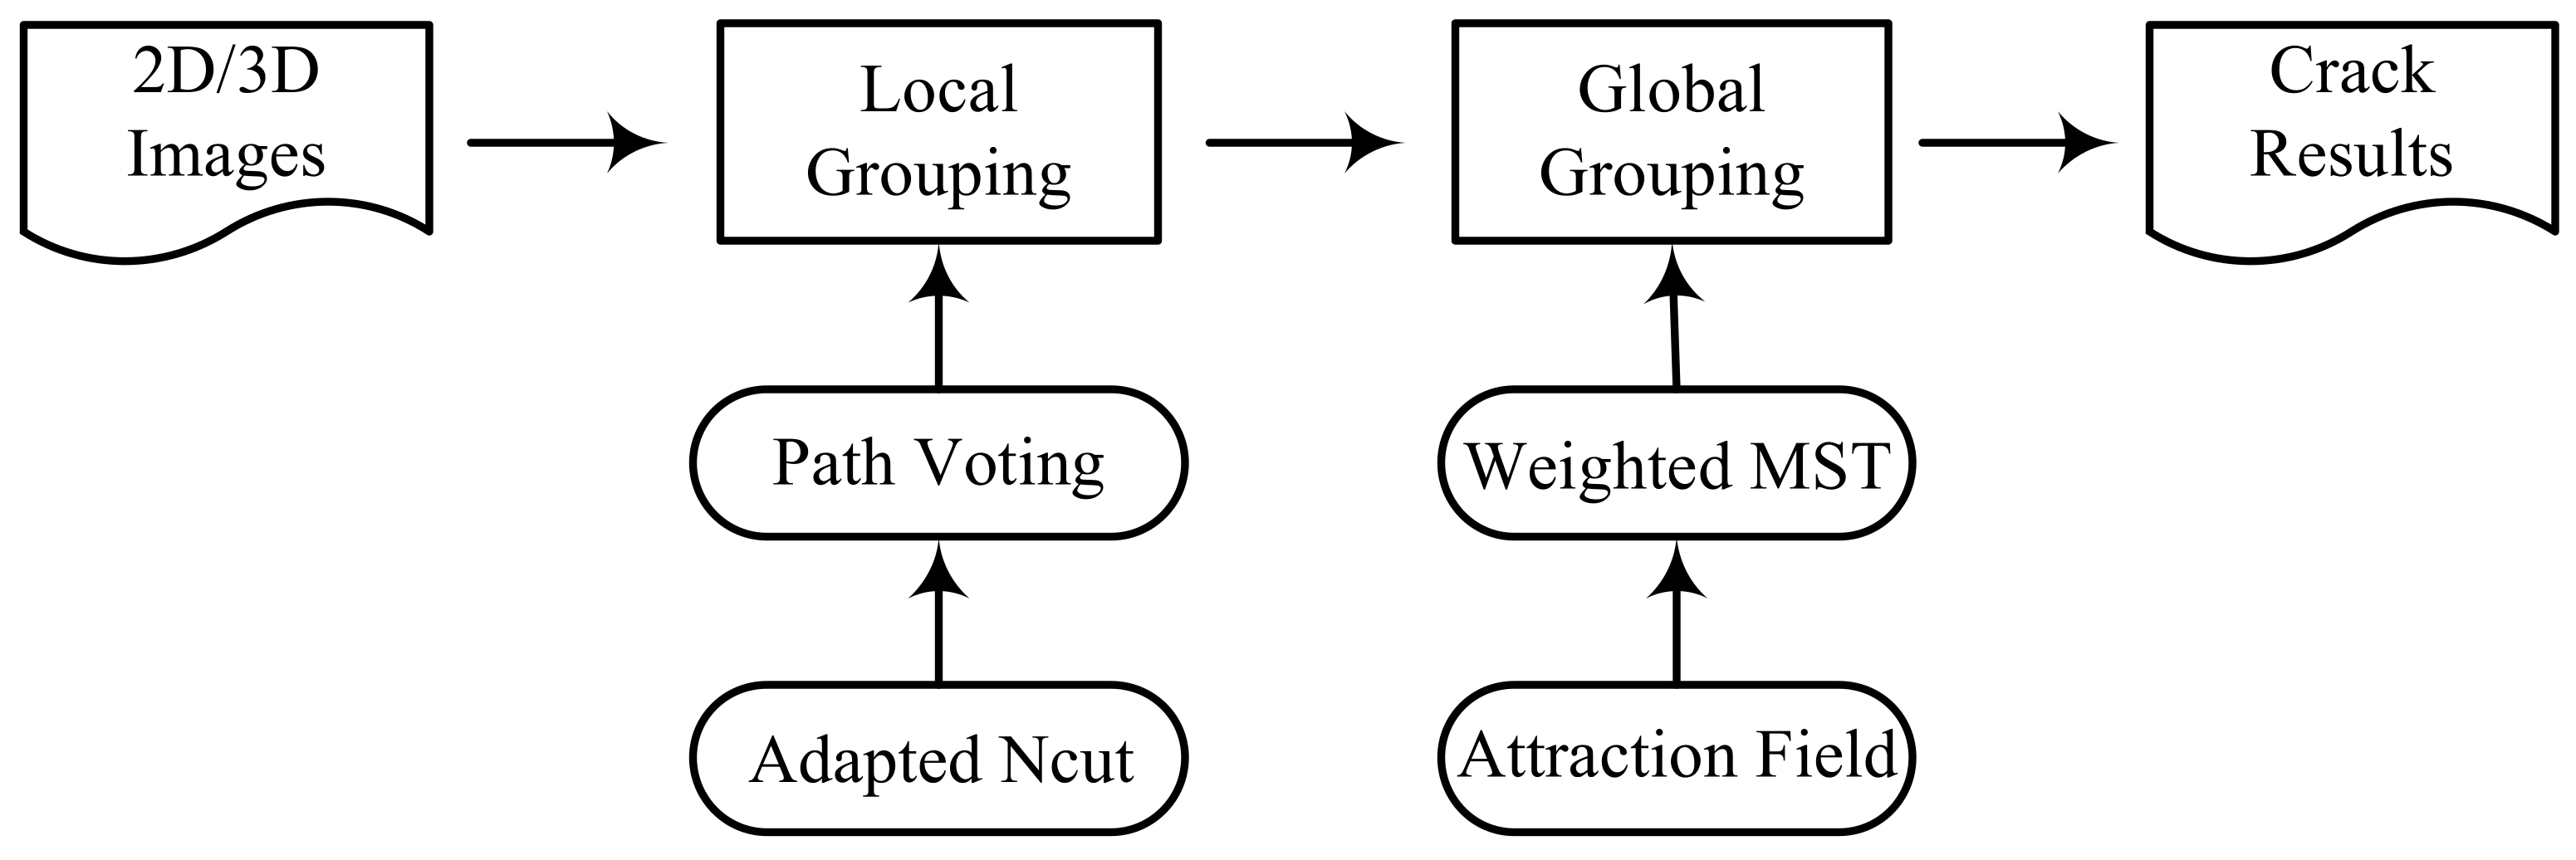
3. Crack Detection Method
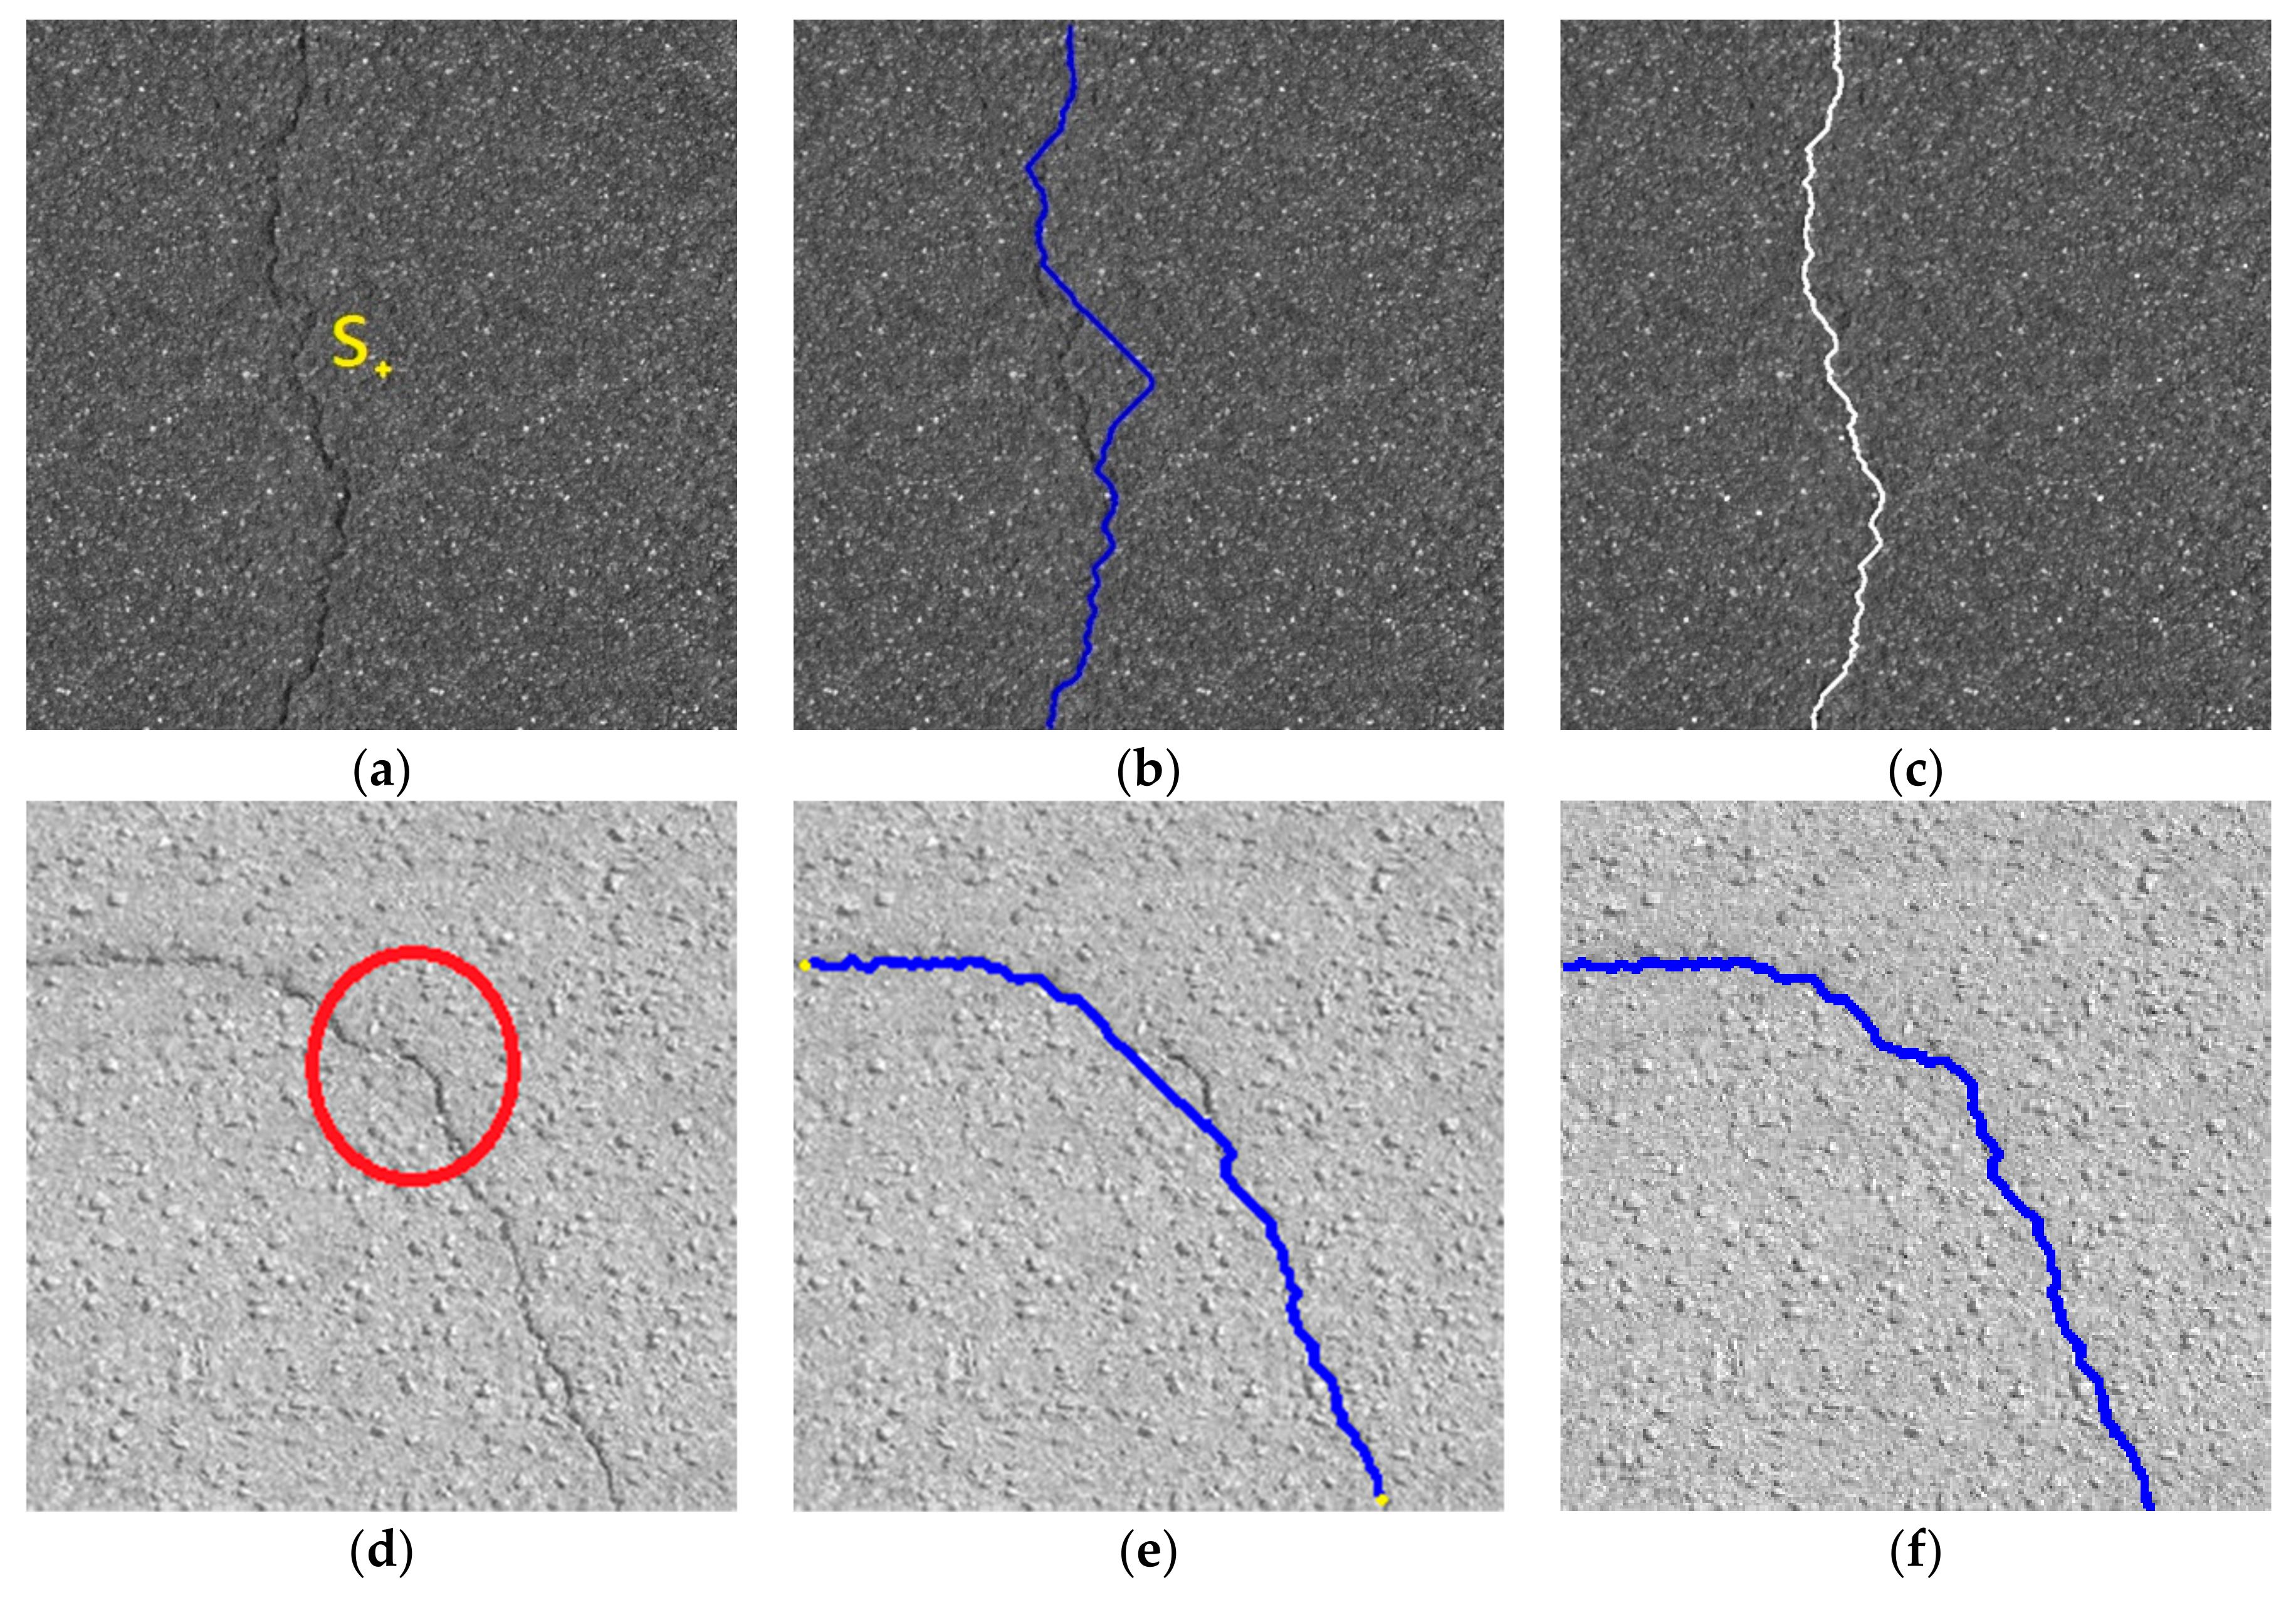
3.1. Local Grouping
3.2. Global Grouping
4. Experiments and Results
4.1. Metrics
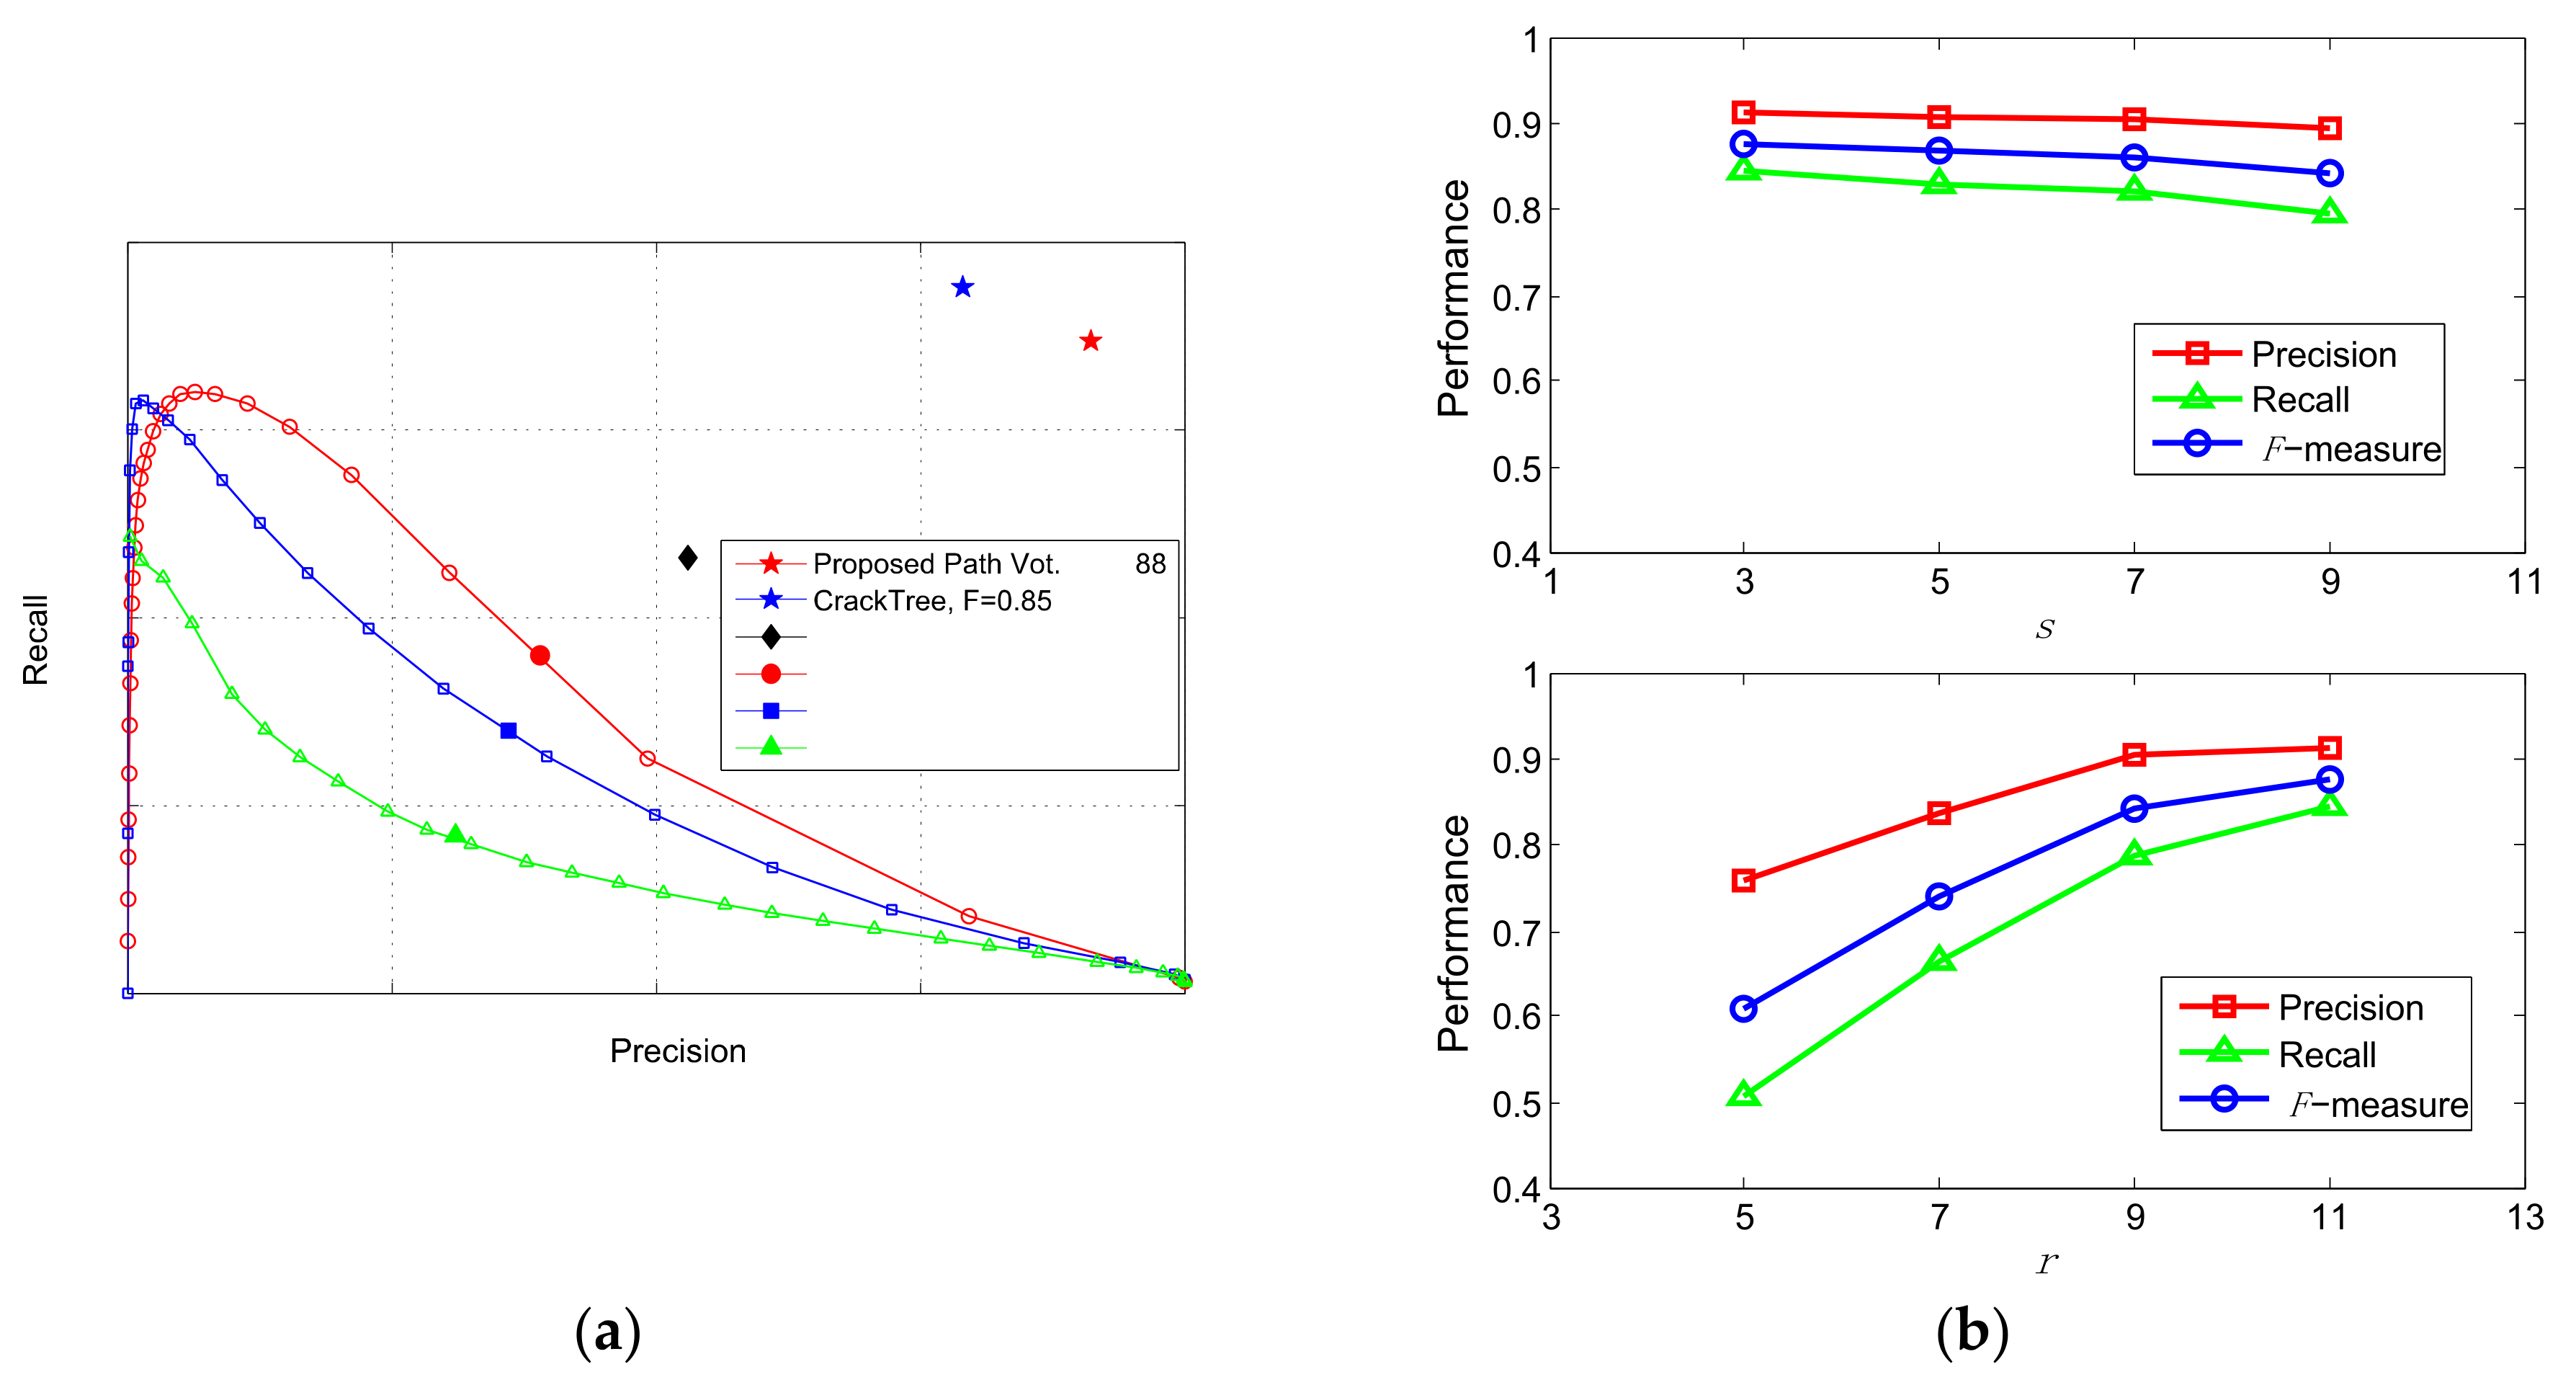
4.2. Results on CrackTree206 Dataset
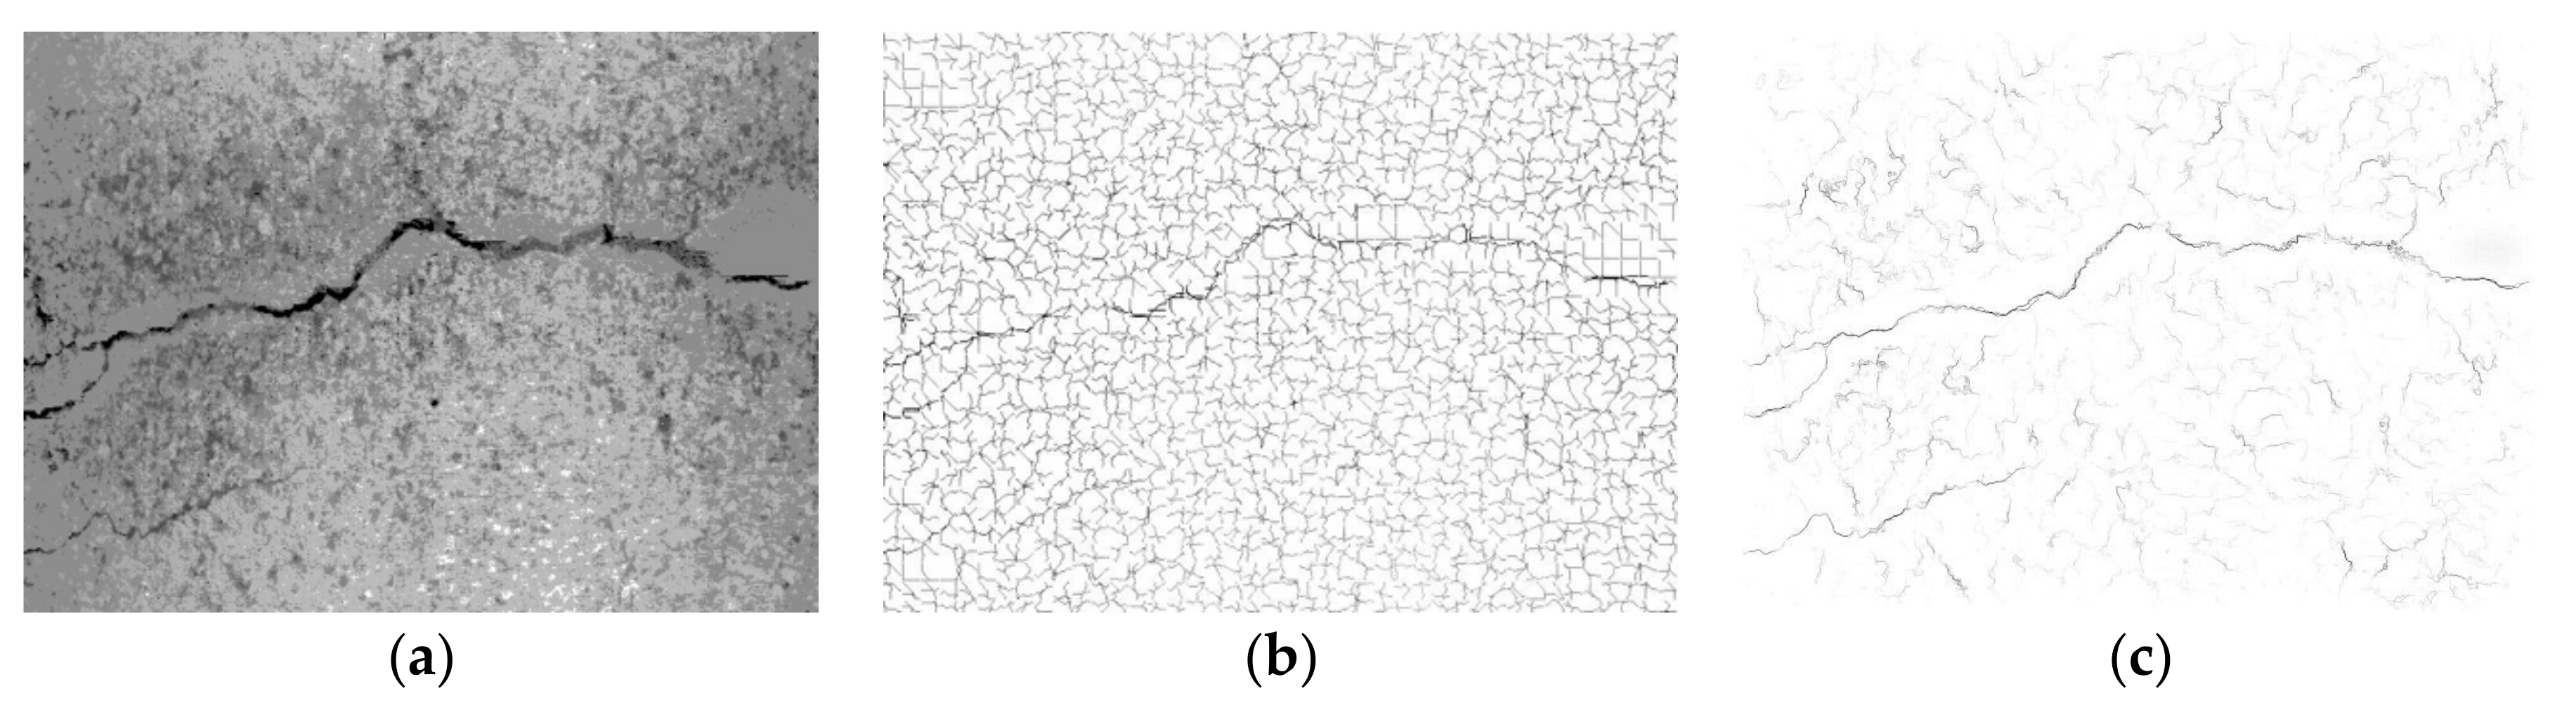
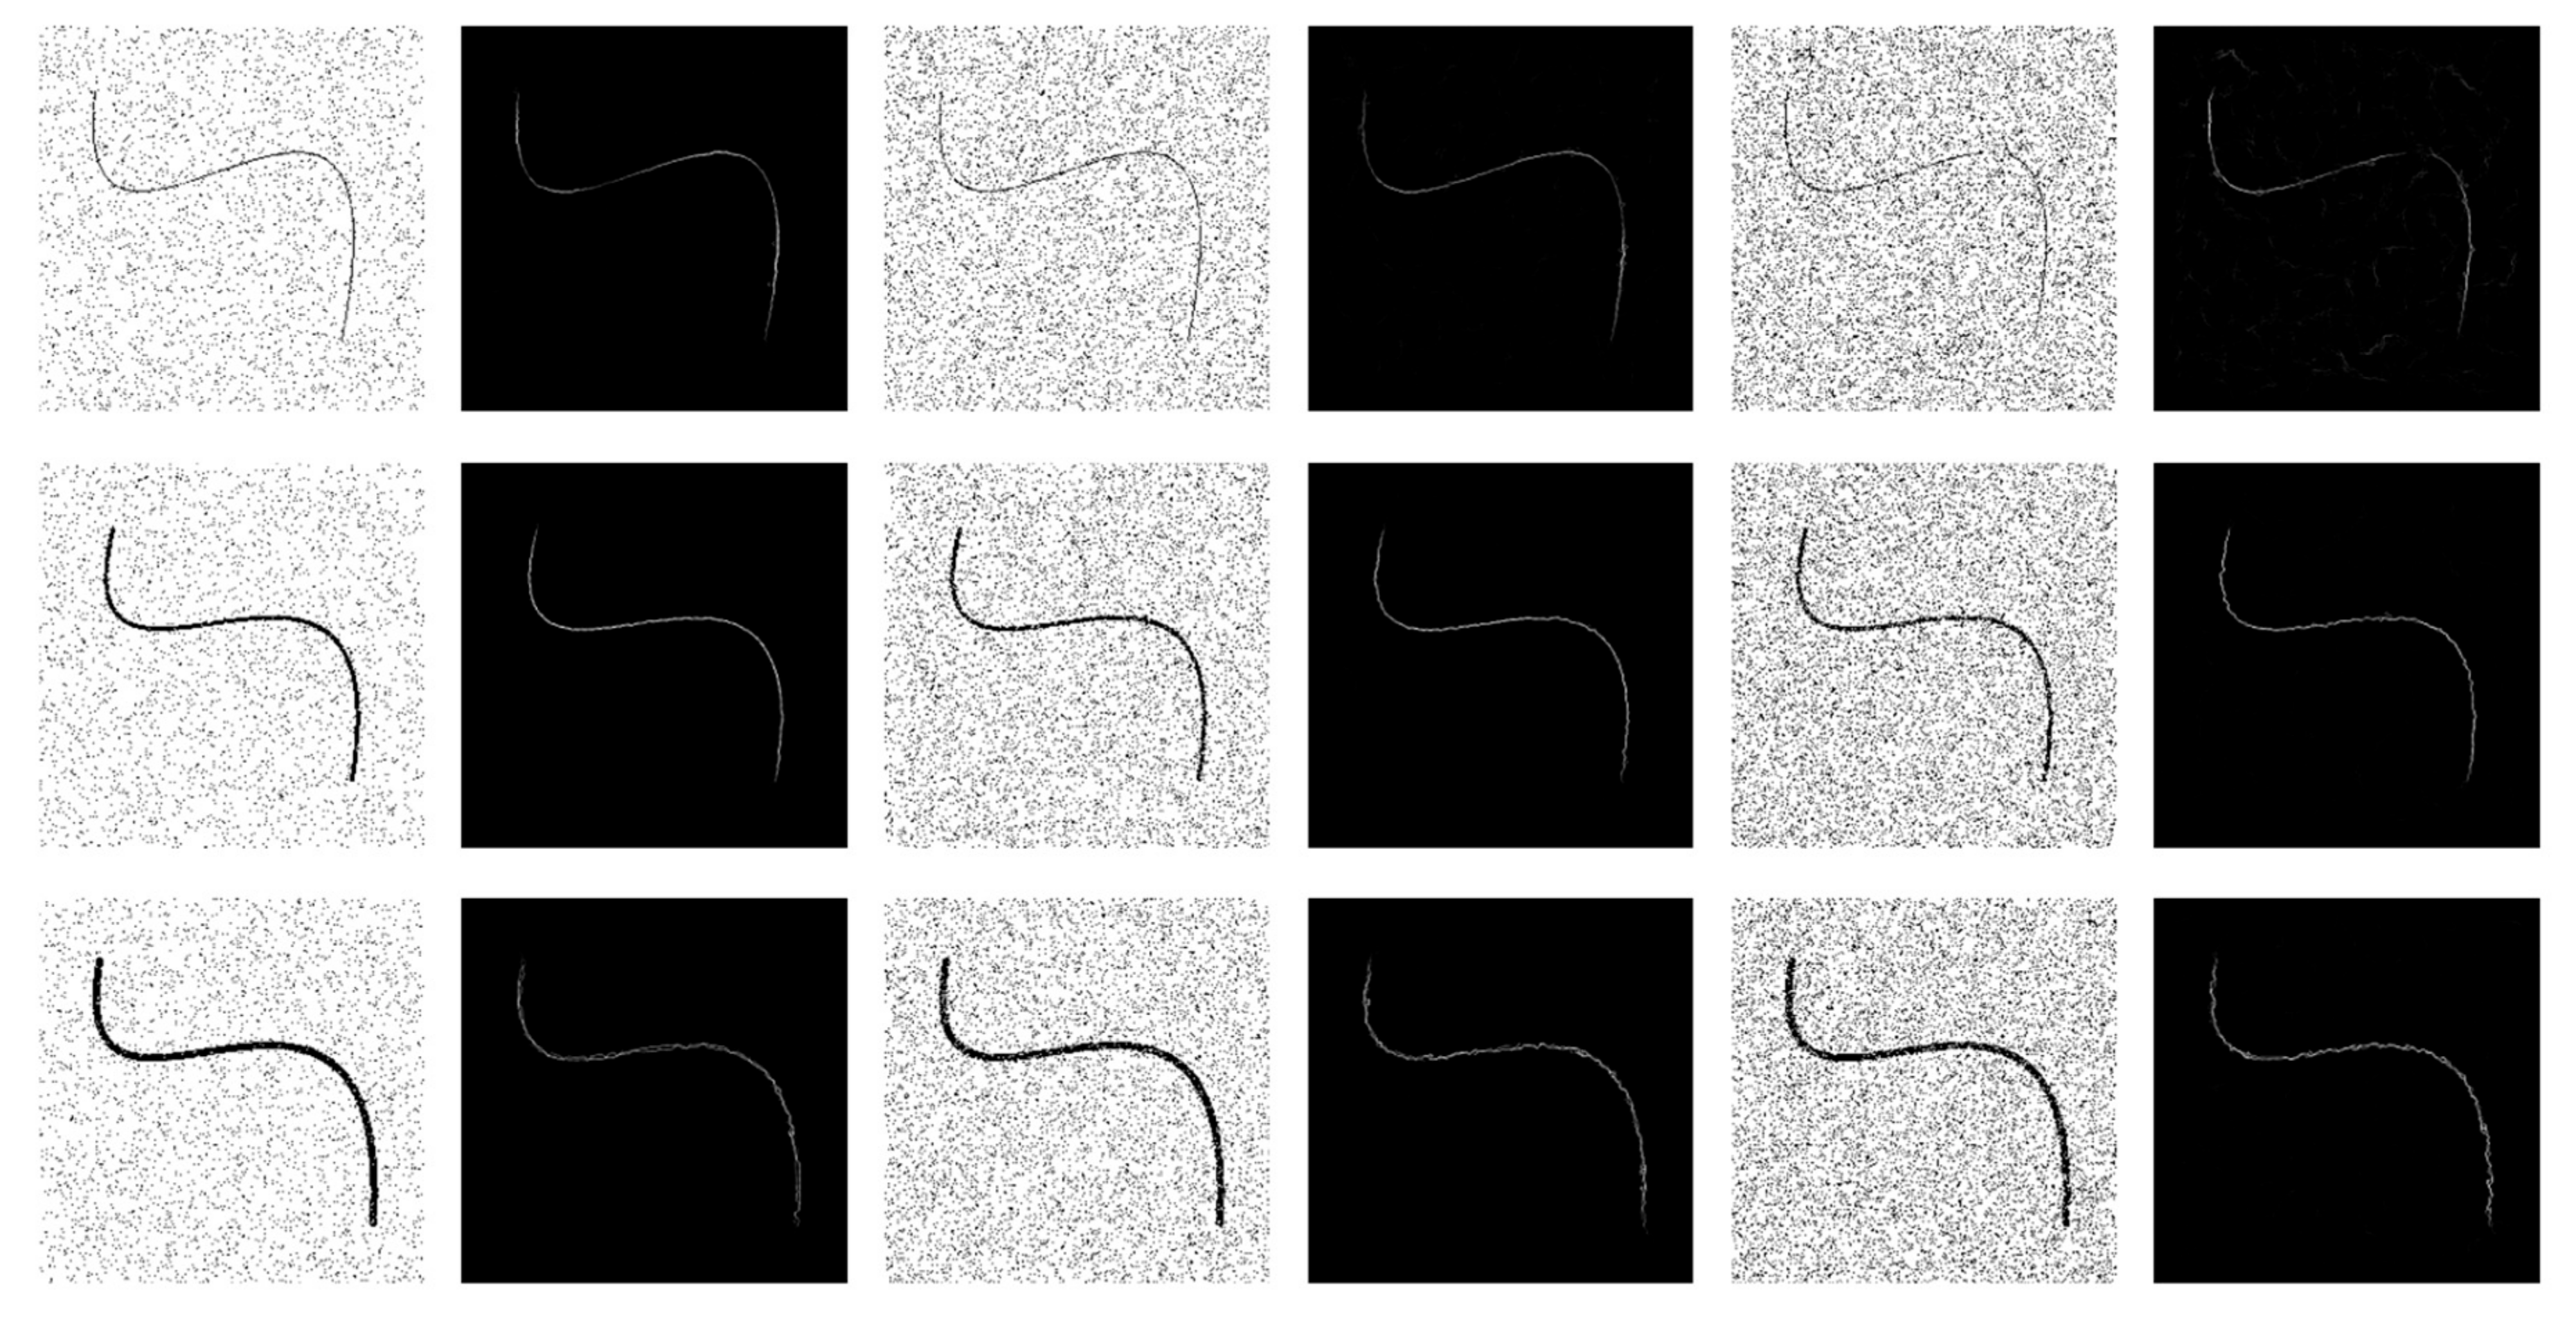
4.3. Results on StoneCrack50 Dataset
4.4. Results on CrackPV14 Dataset
5. Conclusions and Future Directions
Author Contributions
Funding
Data Availability Statement
Conflicts of Interest
References
- Koch, C.; Georgieva, K.; Kasireddy, V.; Akinci, B.; Fieguth, P. A review on computer vision based defect detection and condition assessment of concrete and asphalt civil infrastructure. Adv. Eng. Inform. 2015, 29, 196–210. [Google Scholar] [CrossRef] [Green Version]
- Qu, Z.; Bai, L.; An, S.Q.; Ju, F.R.; Liu, L. Lining seam elimination algorithm and surface crack detection in concrete tunnel lining. J. Electron. Imaging 2016, 25, 063004. [Google Scholar] [CrossRef]
- Huang, Y.; Xu, B. Automatic inspection of pavement cracking distress. J. Electron. Imaging 2006, 15, 013017. [Google Scholar] [CrossRef]
- Zou, Q.; Cao, Y.; Li, Q.; Mao, Q.; Wang, S. CrackTree: Automatic crack detection from pavement images. Pattern Recognit. Lett. 2012, 33, 227–238. [Google Scholar] [CrossRef]
- Oliveira, H.; Correia, P. Automatic road crack detection and characterization. IEEE Trans. Intell. Transp. Syst. 2013, 14, 155–168. [Google Scholar] [CrossRef]
- Aldea, E.; Le Hégarat-Mascle, S. Robust crack detection for unmanned aerial vehicles inspection in an a-contrario decision framework. J. Electron. Imaging 2015, 24, 061119. [Google Scholar] [CrossRef] [Green Version]
- Zhang, D.; Li, Q.; Chen, Y.; Cao, M.; He, L.; Zhang, B. An efficient and reliable coarse-to-fine approach for asphalt pavement crack detection. Image Vis. Comput. 2017, 57, 130–146. [Google Scholar] [CrossRef]
- Guan, H.; Li, J.; Yu, Y.; Chapman, M.; Wang, H.; Wang, C.; Zhai, R. Iterative tensor voting for pavement crack extraction using mobile laser scanning data. IEEE Trans. Geosci. Remote Sens. 2015, 53, 1527–1537. [Google Scholar] [CrossRef]
- Jiang, C.; Tsai, Y.J. Enhanced crack segmentation algorithm using 3d pavement data. J. Comput. Civ. Eng. 2015, 30, 04015050. [Google Scholar] [CrossRef]
- Zou, Q.; Li, Q.; Zhang, F.; Xiong, Z.; Wang, Q. Path voting based pavement crack detection from laser range images. In Proceedings of the 2016 IEEE International Conference on Digital Signal Processing, Beijing, China, 16–18 October 2016; pp. 211–215. [Google Scholar]
- Nguyen, T.S.; Begot, F.; Duculty, F.; Avila, M. Freeform anisotropy: A new method for crack detection on pavement surface images. In Proceedings of the 2011 18th IEEE International Conference on Image Processing (ICIP), Brussels, Belgium, 11–14 September 2011. [Google Scholar]
- Xu, W.; Tang, Z.; Zhou, J.; Ding, J. Pavement crack detection based on saliency and statistical features. In Proceedings of the IEEE International Conference on Image Processing, Melbourne, Australia, 15–18 September 2013; pp. 4093–4097. [Google Scholar]
- Mathavan, S.; Rahman, M.; Kamal, K. Use of a self-organizing map for crack detection in highly textured pavement images. J. Infrastruct. Syst. 2015, 21, 04014052. [Google Scholar] [CrossRef]
- Zalama, E.; Gómez-García-Bermejo, J.; Medina, R.; Llamas, J. Road crack detection using visual features extracted by gabor filters. Comput. Aided Civ. Infrastruct. Eng. 2014, 29, 342–358. [Google Scholar] [CrossRef]
- Medina, R.; Llamas, J.; Zalama, E.; Gomez-Garcia-Bermejo, J.; Medina, R.; Llamas, J. Enhanced automatic detection of road surface cracks by combining 2d/3d image processing techniques. In Proceedings of the IEEE International Conference on Image Processing (ICIP), Paris, France, 27–30 October 2014; pp. 778–782. [Google Scholar]
- Jahanshahi, M.; Jazizadeh, F.; Masri, S.; Becerik-Gerber, B. Unsupervised approach for autonomous pavement-defect detection and quantification using an inexpensive depth sensor. J. Comput. Civ. Eng. 2013, 27, 743–754. [Google Scholar] [CrossRef]
- Sun, X.; Huang, J.; Liu, W.; Xu, M. Pavement crack characteristic detection based on sparse representation. EURASIP J. Adv. Signal Process. 2012, 2012, 191. [Google Scholar] [CrossRef] [Green Version]
- Ouyang, W.; Xu, B. Pavement cracking measurements using 3d laser scan images. Meas. Sci. Technol. 2013, 24, 113–119. [Google Scholar] [CrossRef]
- Schmugge, S.J.; Rice, L.; Lindberg, J.; Grizziy, R.; Joffey, C.; Shin, M.C. Crack segmentation by leveraging multiple frames of varying illumination. In Proceedings of the IEEE Winter Conference on Applications of Computer Vision, Santa Rosa, CA, USA, 24–31 March 2017; pp. 1045–1053. [Google Scholar]
- Kamaliardakani, M.; Sun, L.; Ardakani, M.K. Sealed-crack detection algorithm using heuristic thresholding approach. J. Comput. Civ. Eng. 2016, 30, 04014110. [Google Scholar] [CrossRef]
- Subirats, P.; Dumoulin, J.; Legeay, V.; Barba, D. Automation of pavement surface crack detection using the continuous wavelet transform. In Proceedings of the IEEE International Conference on Image Processing, Atlanta, GA, USA, 8–11 October 2006; pp. 3037–3040. [Google Scholar]
- Li, Q.; Zou, Q.; Zhang, D.; Mao, Q. FoSA: F* seed-growing approach for crack-line detection from pavement images. Image Vis. Comput. 2011, 29, 861–872. [Google Scholar] [CrossRef]
- Kaul, V.; Yezzi, A.; Tsai, Y. Detecting curves with unknown endpoints and arbitrary topology using minimal paths. IEEE Trans. Pattern Anal. Mach. Intell. 2012, 34, 1952–1965. [Google Scholar] [CrossRef]
- Amhaz, R.; Chambon, S.; Idier, J.; Baltazart, V. Automatic crack detection on two-dimensional pavement images: An algorithm based on minimal path selection. IEEE Trans. Intell. Transp. Syst. 2016, 17, 2718–2729. [Google Scholar] [CrossRef] [Green Version]
- Strisciuglio, N.; Azzopardi, G.; Petkov, N. Robust inhibition augmented operator for delineation of curvilinear structures. IEEE Trans. Image Process. 2019, 28, 5852–5866. [Google Scholar] [CrossRef]
- Strisciuglio, N.; Azzopardi, G.; Petkov, N. Detection of curved lines with b-cosfire filters: A case study on crack delineation. In Proceedings of the International Conference on Computer Analysis of Images and Patterns, Ystad, Sweden, 22–24 August 2017; pp. 108–120. [Google Scholar]
- Bismuth, V.; Vaillant, R.; Talbot, H.; Najman, L. Curvilinear structure enhancement with the polygonal path image–application to guidewire segmentation in X-ray fluoroscopy. In Proceedings of the International Conference on Medical Image Computing and Computer Assisted Intervention (MICCAI), Nice, France, 1–5 October 2012; pp. 9–16. [Google Scholar]
- Carlotto, M. Enhancement of low-contrast curvilinear features in imagery. IEEE Trans. Image Process. 2007, 16, 221–228. [Google Scholar] [CrossRef] [Green Version]
- Cho, H.W.; Yoon, H.J.; Yoon, J.C. Analysis of crack image recognition characteristics in concrete structures depending on the illumination and image acquisition distance through outdoor experiments. Sensors 2016, 16, 1646. [Google Scholar] [CrossRef] [Green Version]
- Li, Q.; Liu, X. Novel approach to pavement image segmentation based on neighboring difference histogram method. In Proceedings of the International Congress on Image and Signal Processing, Sanya, China, 27–30 May 2008; pp. 792–796. [Google Scholar]
- Oliveira, H.; Correia, P. Automatic road crack segmentation using entropy and image dynamic thresholding. In Proceedings of the European Signal Processing Conference (EUSIPCO’09), Glasgow, UK, 24–28 August 2009; pp. 622–626. [Google Scholar]
- Zou, Q.; Hu, Z.; Chen, L.; Wang, Q.; Li, Q. Geodesic-based pavement shadow removal revisited. In Proceedings of the IEEE International Conference on Acoustics, Speech and Signal Processing (ICASSP), Shanghai, China, 20–25 March 2016; pp. 1761–1765. [Google Scholar]
- Ayenu-Prah, A.; Attoh-Okine, N. Evaluating pavement cracks with bidimensional empirical mode decomposition. EURASIP J. Adv. Signal Process. 2008, 2008, 861701. [Google Scholar] [CrossRef] [Green Version]
- Zhao, G.; Wang, T.; Ye, J. Anisotropic clustering on surfaces for crack extraction. Mach. Vis. Appl. 2015, 26, 675–688. [Google Scholar] [CrossRef]
- Salman, M.; Mathavan, S.; Kamal, K.; Rahman, M. Pavement crack detection using the gabor filter. In Proceedings of the IEEE Conference on Intelligent Transportation Systems, The Hague, The Netherlands, 6–9 October 2013; pp. 2039–2044. [Google Scholar]
- Chou, J.; O’Neill, W.; Cheng, H. Pavement distress evaluation using fuzzy logic and moments invariants. Transp. Res. Rec. 1995, 1505, 39–46. [Google Scholar]
- Zhang, L.; Yang, F.; Zhang, Y.D.; Zhu, Y.J. Road crack detection using deep convolutional neural network. In Proceedings of the IEEE International Conference on Image Processing, Phoenix, AZ, USA, 25–28 September 2016; pp. 3708–3712. [Google Scholar]
- Li, G.; Zhao, X.; Du, K.; Ru, F.; Zhang, Y. Recognition and evaluation of bridge cracks with modified active contour model and greedy search based support vector machine. Autom. Constr. 2017, 78, 51–61. [Google Scholar] [CrossRef]
- Shi, Y.; Cui, L.; Qi, Z.; Meng, F.; Chen, Z. Automatic road crack detection using random structured forests. IEEE Trans. Intell. Transp. Syst. 2016, 17, 3434–3445. [Google Scholar] [CrossRef]
- Doycheva, K.; Koch, C.; König, M. Implementing textural features on GPUs for improved real-time pavement distress detection. J. Real-Time Image Process. 2019, 16, 1383–1394. [Google Scholar] [CrossRef] [Green Version]
- Sollazzo, G.; Wang, K.; Bosurgi, G.; Li, J. Hybrid procedure for automated detection of cracking with 3d pavement data. J. Comput. Civ. Eng. 2016, 30, 04016032. [Google Scholar] [CrossRef]
- Rätsch, G.; Onoda, T.; Müller, K.R. Soft margins for adaboost. Mach. Learn. 2001, 42, 287–320. [Google Scholar] [CrossRef]
- Viola, P.; Jones, M.J. Robust real-time face detection. Int. J. Comput. Vis. 2004, 57, 137–154. [Google Scholar] [CrossRef]
- Li, L.; Wang, K.C. Bounding box-based technique for pavement crack classification and measurement using 1 mm 3d laser data. J. Comput. Civ. Eng. 2016, 30, 04016011. [Google Scholar] [CrossRef]
- Yuan, J.; Zheng, Y.; Zhang, C.; Xie, X.; Sun, G.Z. An interactive-voting based map matching algorithm. In Proceedings of the 2010 Eleventh International Conference on Mobile Data Management, Kansas City, MS, USA, 23–26 May 2010; pp. 43–52. [Google Scholar]
- Cohen, L.; Kimmel, R. Global minimum for active contour models: A minimal path approach. Int. J. Comput. Vis. 1997, 24, 57–78. [Google Scholar] [CrossRef]
- Vincent, L. Minimal path algorithms for the robust detection of linear features in gray images. In Proceedings of the International Symposium in Mathematic Morphology (ISMM), Amsterdam, The Netherlands, 3–5 June 1998; pp. 331–338. [Google Scholar]
- Geusebroek, J.; Smeulders, A.; Geerts, H. A minimum cost approach for segmenting networks of lines. Int. J. Comput. Vis. 2001, 43, 99–111. [Google Scholar] [CrossRef]
- Rouchdy, Y.; Cohen, L. The shading zone problem in geodesic voting and its solutions for the segmentation of tree structures. application to the seg-mentation of microglia extensions. In Proceedings of the IEEE CVPR Workshop, Miami, FL, USA, 20–25 June 2009; pp. 66–71. [Google Scholar]
- Avila, M.; Begot, S.; Duculty, F.; Nguyen, T.S. 2d image based road pavement crack detection by calculating minimal paths and dynamic programming. In Proceedings of the IEEE International Conference on Image Processing, Paris, France, 27–30 October 2014; pp. 783–787. [Google Scholar]
- Shi, J.; Malik, J. Normalized cuts and image segmentation. IEEE Trans. Pattern Anal. Mach. Intell. 2000, 22, 888–905. [Google Scholar]
- Liu, F.; Xu, G.; Yang, Y.; Niu, X.; Pan, Y. Novel approach to pavement cracking automatic detection based on segment extending. In Proceedings of the IEEE International Symposium on Knowledge Acquisition and Modeling, Wuhan, China, 21–22 December 2008; pp. 610–614. [Google Scholar]
- Arbelaez, P.; Maire, M.; Fowlkes, C.; Malik, J. Contour detection and hierarchical image segmentation. IEEE Trans. Pattern Anal. Mach. Intell. 2011, 33, 898–916. [Google Scholar] [CrossRef] [Green Version]
- Bradshaw, G. Noncontact Surface Geometry Measurement Techniques; Image Synthesis Group; Trinity College: Dublin, Ireland, 1999. [Google Scholar]
- Li, Q.; Zhang, D.; Zou, Q.; Lin, H. 3D laser imaging and sparse points grouping for pavement crack detection. In Proceedings of the 2017 25th European Signal Processing Conference (EUSIPCO), Kos Island, Greece, 28 August–2 September 2017; p. 20362040. [Google Scholar]
- Zou, Q.; Zhang, Z.; Li, Q.; Qi, X.; Wang, Q.; Wang, S. Deepcrack: Learning hierarchical convolutional features for crack detection. IEEE Trans. Image Process. 2018, 28, 14981512. [Google Scholar] [CrossRef]
- Liao, J.; Yue, Y.; Zhang, D.; Tu, W.; Cao, R.; Zou, Q.; Li, Q. Automatic Tunnel Crack Inspection Using an Efficient Mobile Imaging Module and a Lightweight CNN. IEEE Trans. Intell. Transp. Syst. 2022. [Google Scholar] [CrossRef]


| Method | CrackTree | Minimal-Path Path Voting | The Proposed Path Voting |
|---|---|---|---|
| Precison | 0.8725 | 0.8218 | 0.9182 |
| Recall | 0.5562 | 0.5236 | 0.5697 |
| FMeasure | 0.6793 | 0.6397 | 0.7031 |
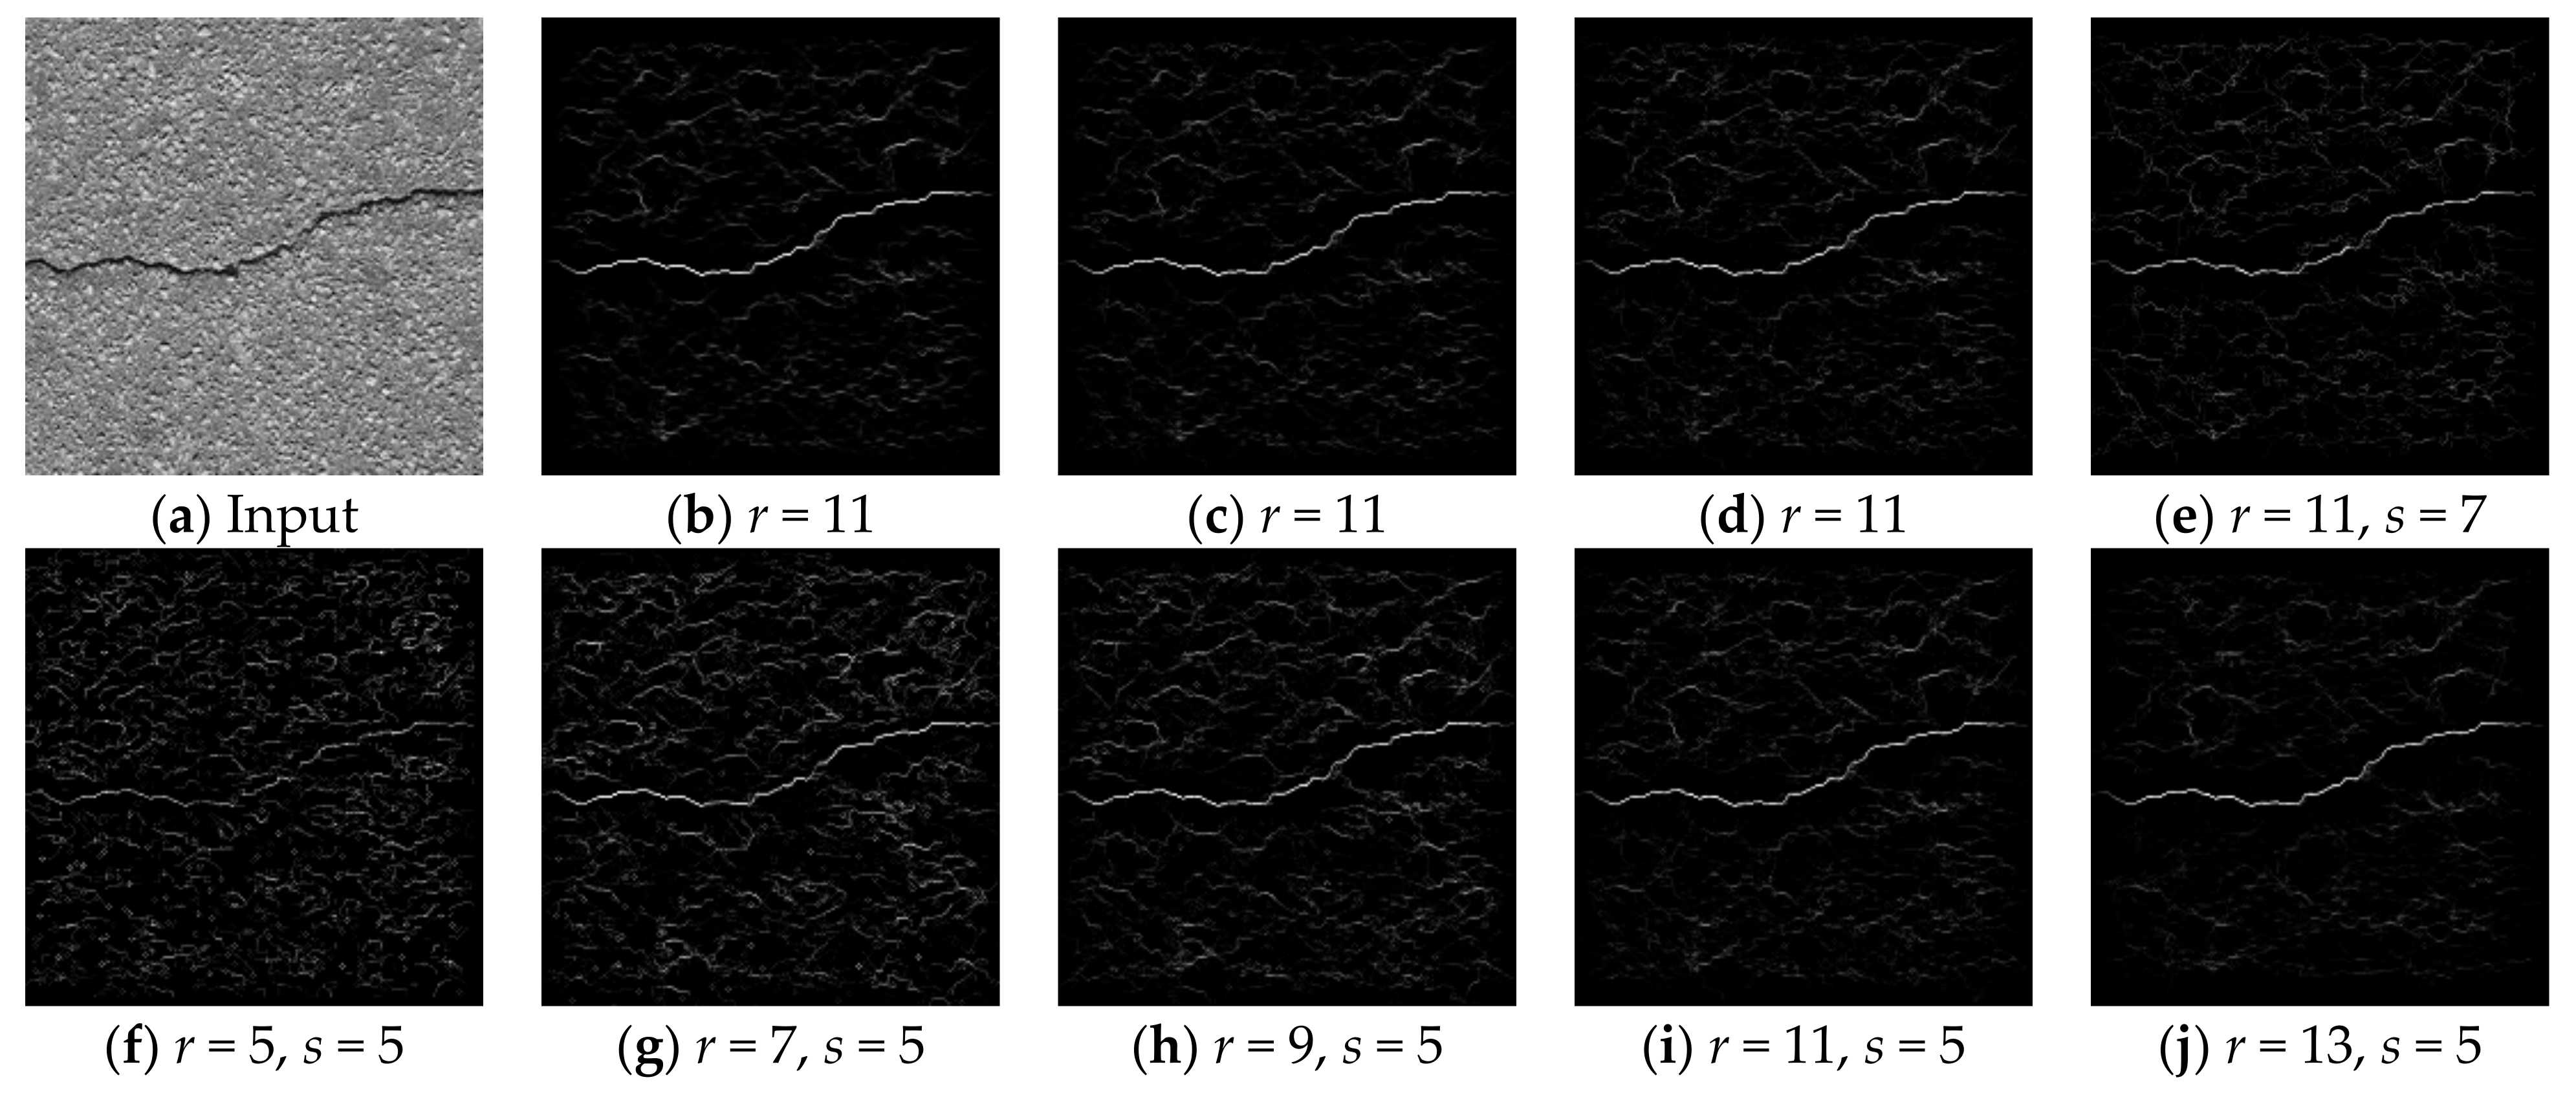
| Location | s = 5 | s = 7 | s = 9 | s = 11 | |
|---|---|---|---|---|---|
| Precison | r = 5 | 0.9522 | 0.9521 | 0.9490 | 0.9823 |
| Recall | 0.0645 | 0.0663 | 0.0635 | 0.0607 | |
| FMeasure | 0.1208 | 0.1240 | 0.1190 | 0.1144 | |
| Precison | r = 7 | 0.9581 | 0.9668 | 0.9424 | 0.9112 |
| Recall | 0.1782 | 0.1382 | 0.1026 | 0.0689 | |
| FMeasure | 0.3005 | 0.2418 | 0.1851 | 0.1281 | |
| Precison | r = 9 | 0.9247 | 0.9116 | 0.8751 | 0.9064 |
| Recall | 0.4274 | 0.3517 | 0.2328 | 0.1517 | |
| FMeasure | 0.5846 | 0.5076 | 0.3678 | 0.2599 | |
| Precison | r = 11 | 0.9182 | 0.9284 | 0.8735 | 0.8612 |
| Recall | 0.5696 | 0.4908 | 0.4403 | 0.2103 | |
| FMeasure | 0.7031 | 0.6421 | 0.5855 | 0.3381 |
| Method | Prop | CrTr | FoSA | Prop | CrTr | FoSA | Prop | CrTr | FoSA | Prop | CrTr | FoSA |
|---|---|---|---|---|---|---|---|---|---|---|---|---|
| img. #1 | img. #2 | img. #3 | img. #4 | |||||||||
| Precison | 0.872 | 0.821 | 0.845 | 0.842 | 0.625 | 0.733 | 0.846 | 0.885 | 0.897 | 0.793 | 0.753 | 0.756 |
| Recall | 0.965 | 0.691 | 0.628 | 0.904 | 0.605 | 0.568 | 0.905 | 0.713 | 0.612 | 0.903 | 0.776 | 0.691 |
| FMeasure | 0.916 | 0.751 | 0.721 | 0.872 | 0.614 | 0.640 | 0.874 | 0.790 | 0.728 | 0.845 | 0.764 | 0.722 |
| img. #5 | img. #6 | img. #7 | img. #8 | |||||||||
| Precison | 0.949 | 0.845 | 0.860 | 0.671 | 0.780 | 0.836 | 0.960 | 0.698 | 0.716 | 0.846 | 0.696 | 0.749 |
| Recall | 0.939 | 0.600 | 0.557 | 0.843 | 0.649 | 0.647 | 0.915 | 0.605 | 0.552 | 0.929 | 0.668 | 0.654 |
| FMeasure | 0.994 | 0.700 | 0.691 | 0.747 | 0.708 | 0.729 | 0.937 | 0.648 | 0.623 | 0.886 | 0.682 | 0.698 |
| img. #9 | img. #10 | img. #11 | img. #12 | |||||||||
| Precison | 0.767 | 0.722 | 0.779 | 0.833 | 0.927 | 0.811 | 0.833 | 0.839 | 0.792 | 0.997 | 0.847 | 0.868 |
| Recall | 0.996 | 0.669 | 0.636 | 0.961 | 0.860 | 0.805 | 0.993 | 0.967 | 0.937 | 0.823 | 0.923 | 0.805 |
| FMeasure | 0.867 | 0.695 | 0.700 | 0.892 | 0.892 | 0.808 | 0.906 | 0.898 | 0.858 | 0.893 | 0.883 | 0.835 |
| img. #13 | img. #14 | Average | ||||||||||
| Precison | 0.449 | 0.775 | 0.696 | 0.848 | 0.948 | 0.925 | ||||||
| Recall | 0.890 | 0.706 | 0.663 | 0.988 | 0.985 | 0.880 | ||||||
| FMeasure | 0.639 | 0.739 | 0.679 | 0.931 | 0.966 | 0.901 | 0.867 | 0.766 | 0.738 | |||
Publisher’s Note: MDPI stays neutral with regard to jurisdictional claims in published maps and institutional affiliations. |
© 2022 by the authors. Licensee MDPI, Basel, Switzerland. This article is an open access article distributed under the terms and conditions of the Creative Commons Attribution (CC BY) license (https://creativecommons.org/licenses/by/4.0/).
Share and Cite
Yu, J.; Chen, Z.; Xiong, Z. A Novel Path Voting Algorithm for Surface Crack Detection. Electronics 2022, 11, 501. https://doi.org/10.3390/electronics11030501
Yu J, Chen Z, Xiong Z. A Novel Path Voting Algorithm for Surface Crack Detection. Electronics. 2022; 11(3):501. https://doi.org/10.3390/electronics11030501
Chicago/Turabian StyleYu, Jianwei, Zhipeng Chen, and Zhiming Xiong. 2022. "A Novel Path Voting Algorithm for Surface Crack Detection" Electronics 11, no. 3: 501. https://doi.org/10.3390/electronics11030501