Article

Solar Energy Compensation for Building Energy Saving with Thermal Comfort in a Cold Climate

1
School of Electrical Engineering, Guizhou University, Guiyang 550025, China
2
Electric Power Research Institute of Guizhou Power Grid Co., Ltd., Guiyang 550002, China
*
Authors to whom correspondence should be addressed.
Electronics 2022, 11(3), 491; https://doi.org/10.3390/electronics11030491
Submission received: 21 November 2021 / Revised: 28 January 2022 / Accepted: 2 February 2022 / Published: 8 February 2022
(This article belongs to the Special Issue Advancement in Smart Building Technologies)

Abstract

:
This paper proposes an energy-saving strategy with assistance from solar thermal compensation for building energy systems. The target of the control strategy was to minimize energy consumption under thermal comfort constraints in buildings. First, the factors influential to indoor temperature in building environments were analyzed. Secondly, the internal and external factors, such as building materials; building orientation; window size; heating, ventilation, and air conditioning (HVAC) facilities; blinding device; solar irradiation; wind speed; and outdoor temperature were used to construct a building model on the platform ENERGYPLUS (E+). A controller aiming to regulate the amount of solar irradiation was developed with the Building Controls Virtual Test Bed (BCVTB) tool. Afterward, the building performance under different strategies was tested by co-simulation using both the computational platforms, E+ and BCVTB. The optimum scheme achieved 30.6% energy savings while meeting the same comfort criterion of its competition strategy. The study verified that the proposed strategy of combined heating, ventilation, and air conditioning and blind control could realize the energy savings and comfort satisfaction at the same time. The proposed method provides a reference to the development of low-/zero-energy building concepts in the field.

1. Introduction

Tremendous attention has been given to the issues of energy saving and energy utilization in a clean way. On average, buildings have accounted for 40% of overall energy consumption across the world [1], while buildings account for 27% of energy consumption in China [2]. Moreover, there exists a 1% [2,3] increase in building energy consumption along with the economic development each year in China. Public buildings contribute the most, accounting for 34% [4] of energy consumption among all types of buildings. Therefore, reducing energy consumption in public buildings is regarded as the most effective way to reach the targets of energy savings and emission reduction. In buildings, the highest amount of energy is used by heating, ventilation, and air condition (HVAC) systems. They account for 60% of consumption in buildings [5], since most energy supplies rely heavily on HVAC systems at present. Researchers, industrial partners, and stakeholders strive to find alternatives to reduce building consumption while maintaining building performance in a decent way. Among these attempts, using renewable energy as a supplement to or as replacement of HVAC systems is becoming popular, since renewable resources are abundant, clean, and sustainable. These applications commonly take renewable energy as heating resources or convert renewable energy into electricity to facilitate energy supplies in buildings. The concept of the low-/zero-consumption building [6,7,8] has emerged, and has been adopted in newly constructed buildings. Moreover, optimal energy management by integrating renewable resources and the associated facilities is a key [9,10]. For instance, the researchers in [11] developed an energy-management system assisted by historical climate data, including the outdoor temperature, solar radiation, and the surrounding conditions of the neighborhood, to forecast the heating energy while reducing the duty time of the HVAC in the building. Korkas et al. [12] investigated the relationship between occupant comfort and the thermal gain from solar. They pointed out thermal comfort and energy consumption had a close relationship with solar radiation. Li [13] discussed the various effects on indoor temperature caused by solar radiation using different types of building architecture and materials. Abd-Ur-Rehman et al. [14] investigated variations in building environments with a focus on lighting and heating energy control facilitated by solar radiation. Ma and Maurer [15,16] set up mathematical models of different regions under various climate environments. They investigated the comprehensive relationship between solar irradiation and cooling and heating effects in diverse regions with dissimilar climates. Researchers from Germany investigated the thermal gain from solar in a passive building and discussed how to improve energy efficiency in buildings through numerical simulation by monitoring indoor and outdoor environmental data around the targeted buildings. The above investigations indicated that solar irradiation/energy has the potential to change indoor climates. However, few discussions were found in the past investigations with a specific focus on maximizing the use of solar energy while minimizing HVAC supplies without compromising occupant comfort. The American Society of Heating, Refrigerating, and Air-Conditioning Engineers (ASHRAE) proposed a series of standards to measure building performance, especially the predicted percentage of dissatisfied (PPD) and predicted mean vote (PMV), which are used as convincing indicators to evaluate thermal comfort.
Unlike previous investigations, this study proposed an innovative strategy that was subject to a joint target of reducing energy consumption, as well as maintaining occupant comfort, by incorporating solar radiation with HVAC operation. For this purpose, a numerical model built on a joint platform of ENERGYPLUS [17] and the Building Control Virtual Test Bed (BCVTB) [18] was simulated and tested, in which the performance indicators of both thermal comfort and energy savings were evaluated. This study also compared the results of the proposed strategies with their counterparts of common HVAC operation without consideration of solar gain. The results indicated that the proposed strategy could realize a maximum value of 69.95% energy reduction while maintaining both PPD and PMV within a permitted range. In the study, solar gain was controlled by a blind in cooperation with HVAC operation.

2. Influential Factors on Building Energy Performance

There exist many influential factors in relation to energy consumption in building environments; for instance, heating loss from the building envelope, air transmission, or indoor heat disturbances. On the other hand, heat gains can be achieved by heat irradiation from electrical devices such as personal computers, lighting systems, and heaters, as well as solar radiation. These influential factors are generally divided into two groups, including internal factors and external factors.

2.1. External FACTORS

The building envelope results in more energy loss than other factors. The overall loss related to the building envelope is associated with walls, roofs, windows, and floors. In general, heat transmission from walls affects the indoor temperature the most due to the larger area occupied by walls compared to floors, windows, and roofs. Indoor temperature is also affected by heat transmission in the form of convection or radiation.

2.2. Internal Factors

Occupants, lighting, and heating devices contribute a heat effect to spaces in buildings. It is commonly recognized that the number of occupants, thickness of their clothes, and indoor facilities bring about heat gains. Especially in indoor facilities, factors such as computers, printers, and projectors contribute obvious heat to indoor spaces. In addition, HVAC and solar radiation are the main controllable resources for heating as well. They will be discussed in detail in the later sections.

3. Methodologies

This study aimed to find a favorable operational strategy for energy management in buildings with the objectives of minimizing energy consumption while maintaining occupant comfort. A joint model was developed as shown in Figure 1. The architecture of a building with the desired physical properties and facility parameters was established on the ENERGYPLUS platform. A controller with an operational strategy was programmed on the BCVTB platform. In the study, ENERGYPLUS could interact with BCVTB, in that the exports of the BCVTB model were fed into the imports of the ENERGYPLUS model. The strategy was tested via numerical simulation. The following sections will introduce the modeling process.

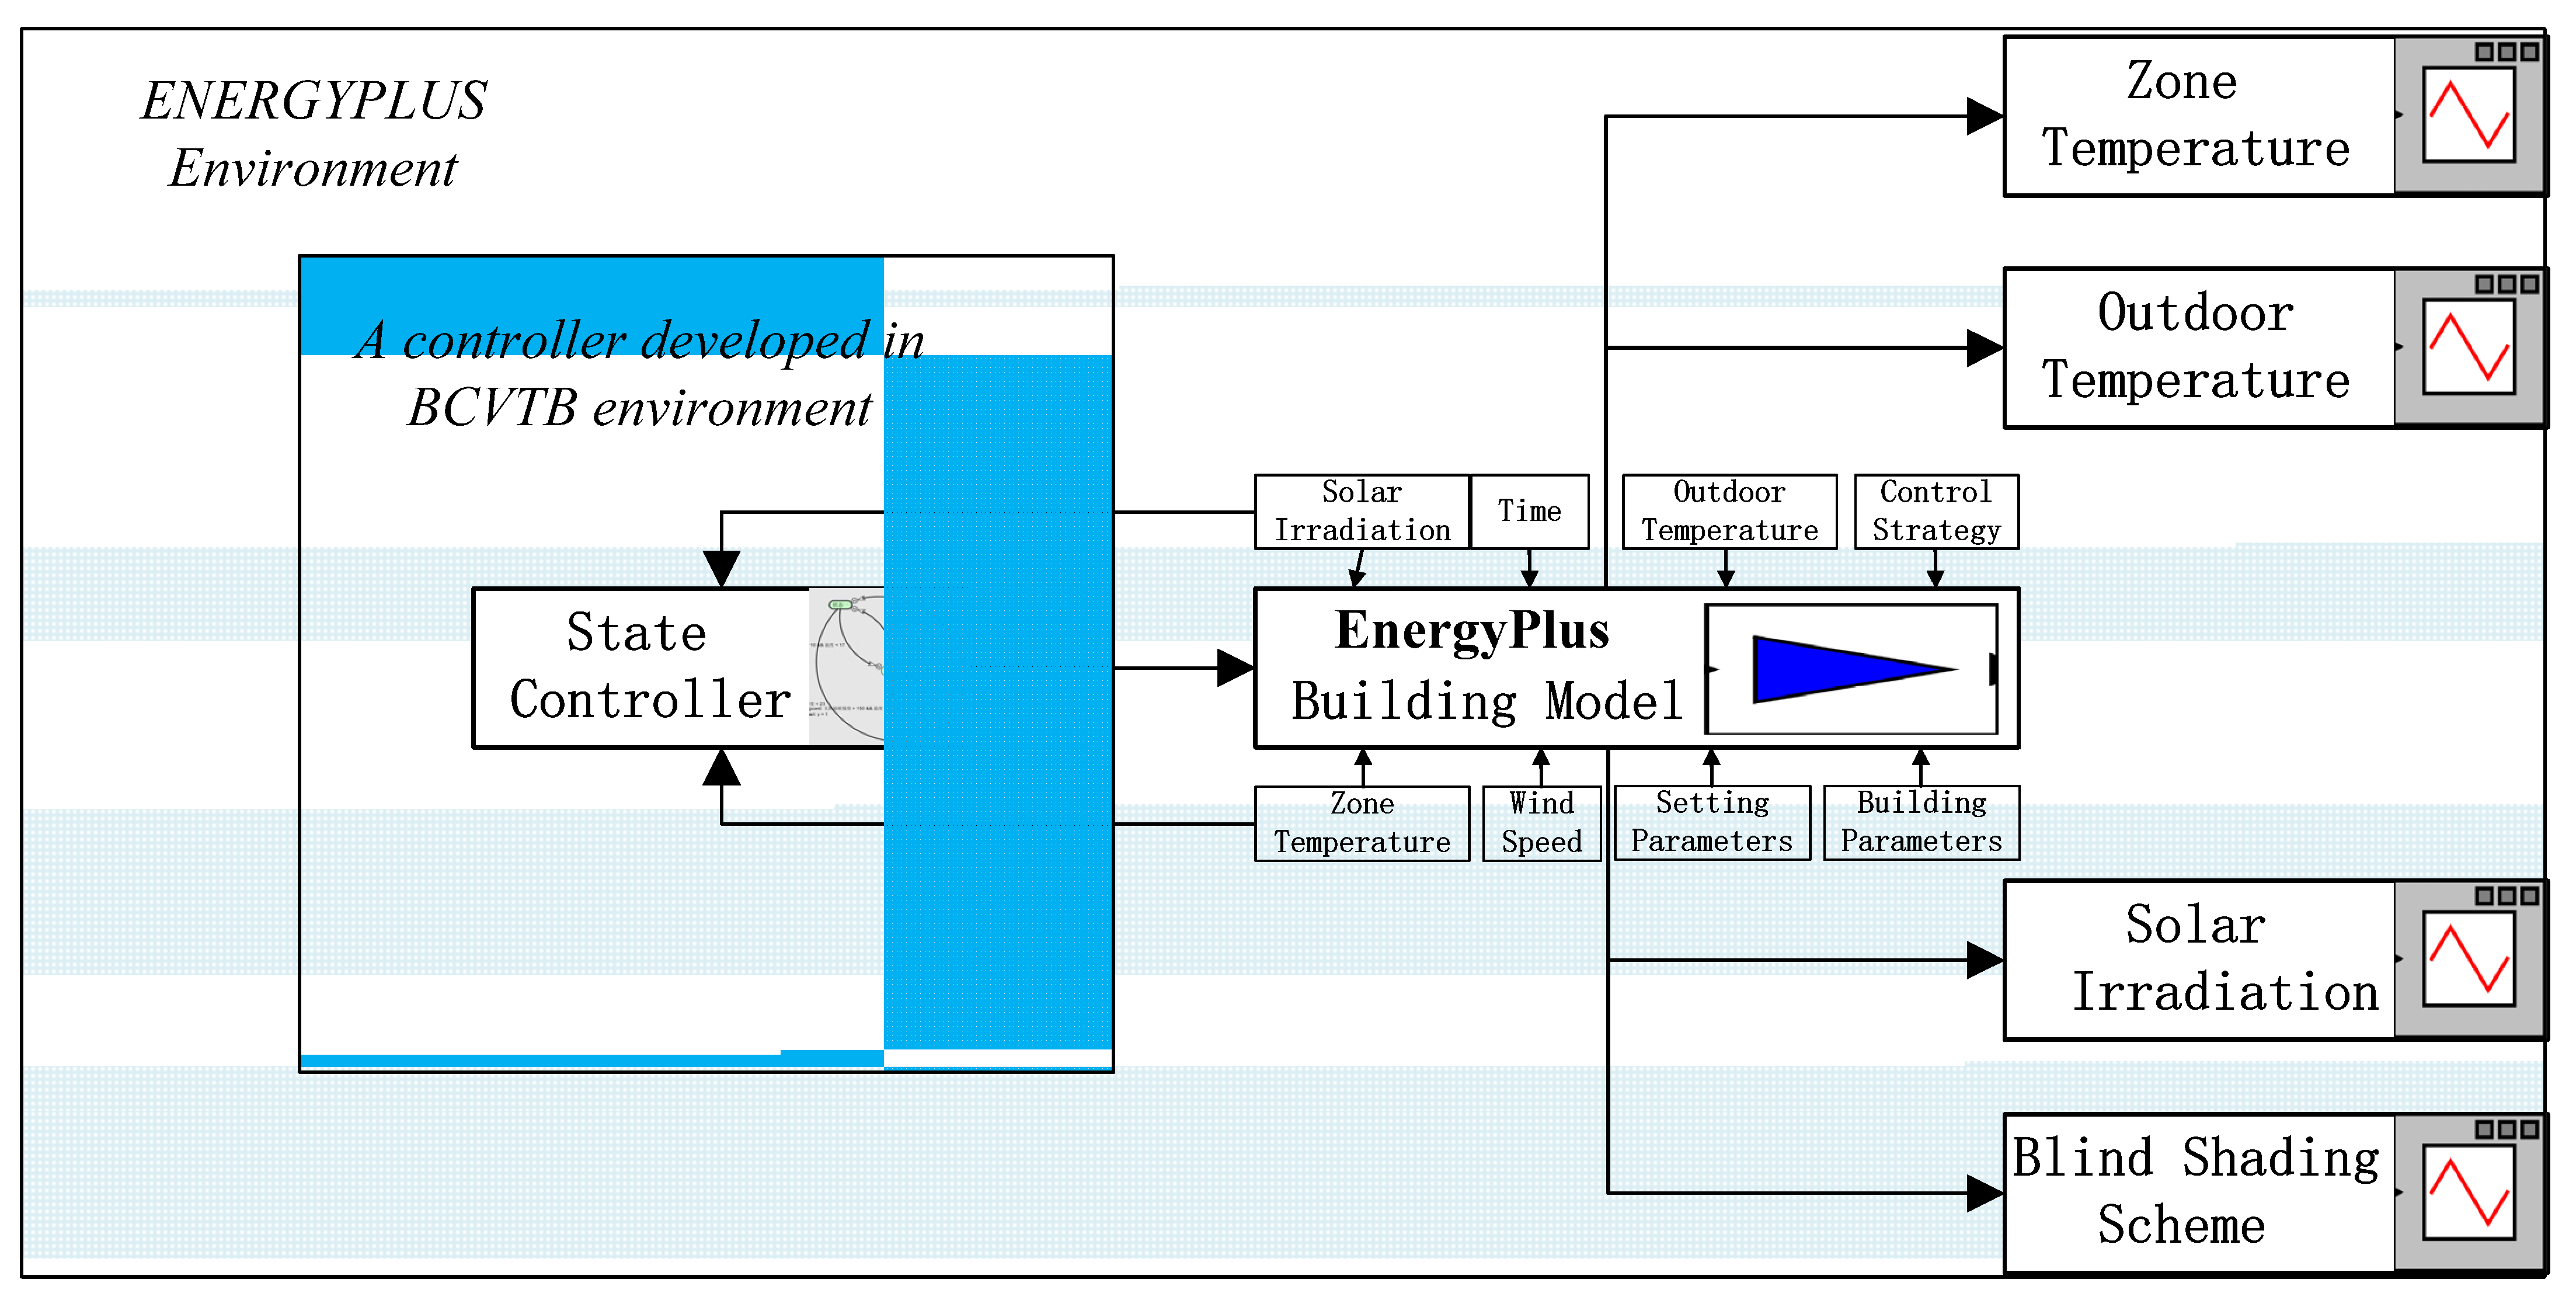
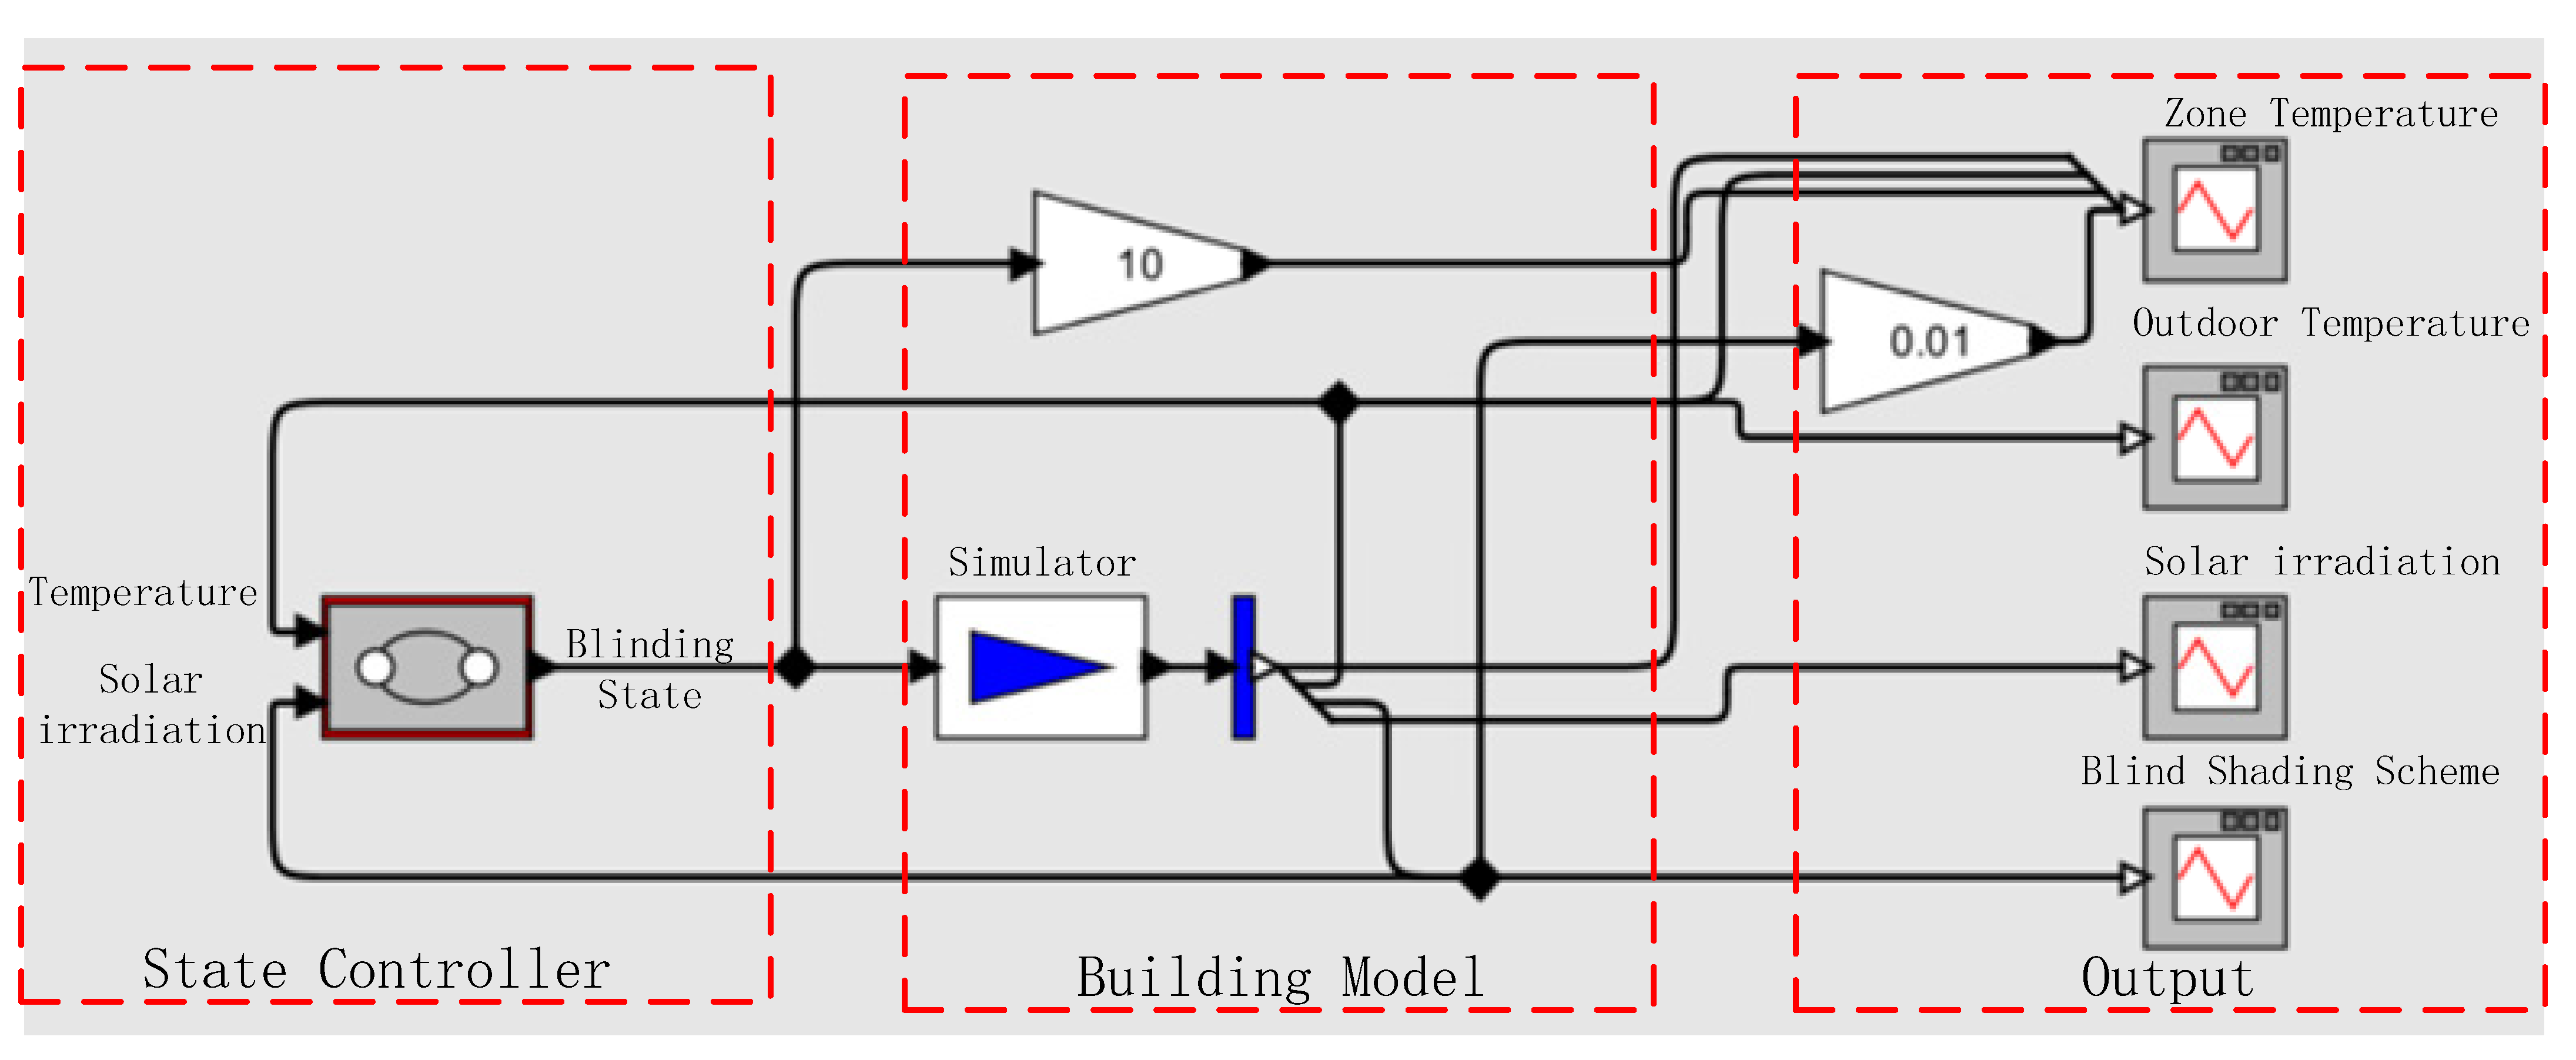
3.1. Joint Modeling by ENERGYPLUS and BCVTB

The targeted building model was primarily built on the ENERGYPLUS platform using physical properties, including materials, size, orientation, number of rooms, location, and types of HVAC devices. Moreover, the number of occupants and people activities were also defined in the ENERGYPLUS model. Table 1, Table 2, Table 3 and Table 4 give the details of the parameters for the building model. The simulated building was supposed to represent an office building. Therefore, it was supposed that the occupants worked from 9:00 to 17:00 on weekdays. The lighting and other devices were scheduled accordingly. The HVAC operation was implemented in the BCVTB platform, in which the developed controller interacted with the ENERGYPLUS model [19,20]. In this case, the building model in ENERGYPLUS was packed as a module and interacted with the BCVTB environment. In this study, an increasing or decreasing heat gain from solar radiation was realized by blind control, which was programmed as a controller on the BCVTB platform. The relationship and interaction between BCVTB and ENERGYPLUS are demonstrated in Figure 1 and Figure 2. As Figure 1 shows, a state controller developed by BCVTB and packed as a module interacted with a building model in the ENERGYPLUS environment. Climate condition signals, including solar irradiation and indoor temperature, were shared by both the BCVTB model and the ENERGYPLUS model. The control signal produced by the BCVTB was fed into a building model on the ENERGYPLUS platform in which the rest of physical parameters were used for calculation in the ENERGYPLUS environment. We could see the inside environment of the BCVTB when a controller was developed and coped with a building model in which the building model by ENERGYPLUS was packed as a simulator, and was linked with the controller on the BCVTB platform. Table 1, Table 2 and Table 3 provide the physical properties and environmental parameters of the modeling. Table 4 gives the lighting schedule for the building.

3.2. Thermal Storage Effect

Buildings have properties resembling those of a thermal storage facility. They receive and maintain thermal energy for a period of time before releasing thermal energy as requested as the environment changes. As solar radiation is strong, for instance, heat is transmitted into storage materials, such as walls, floors, and other equivalent storage constituent in buildings, via windows. In this case, heat gain from solar energy is more than the loss, leading to a rise in indoor temperature while excessive thermal energy is stored. In contrast, weaker solar radiation occurs in some circumstances, such as on cloudy or rainy days or nights. Heat loss is retarded by fully closing a curtain or a blind while maintaining the indoor temperature by the thermal storage effect in buildings.

4. Case Studies

In order to evaluate the proposed method, case studies were executed. A cosimulation based on both ENERGYPLUS and BCVTB was adopted. The tested was supposed to be performed from 1–4 March in Chicago, IL, USA (41. 78° N, 87. 75° W). The plan of the tested zones is demonstrated in Figure 3. Three zones were located at a level in an office building. The tested zones were the three connected offices. In order to evaluate energy savings and the performance of blinding, all performance indicators were referred to the western zone, which had a window and blinding device.

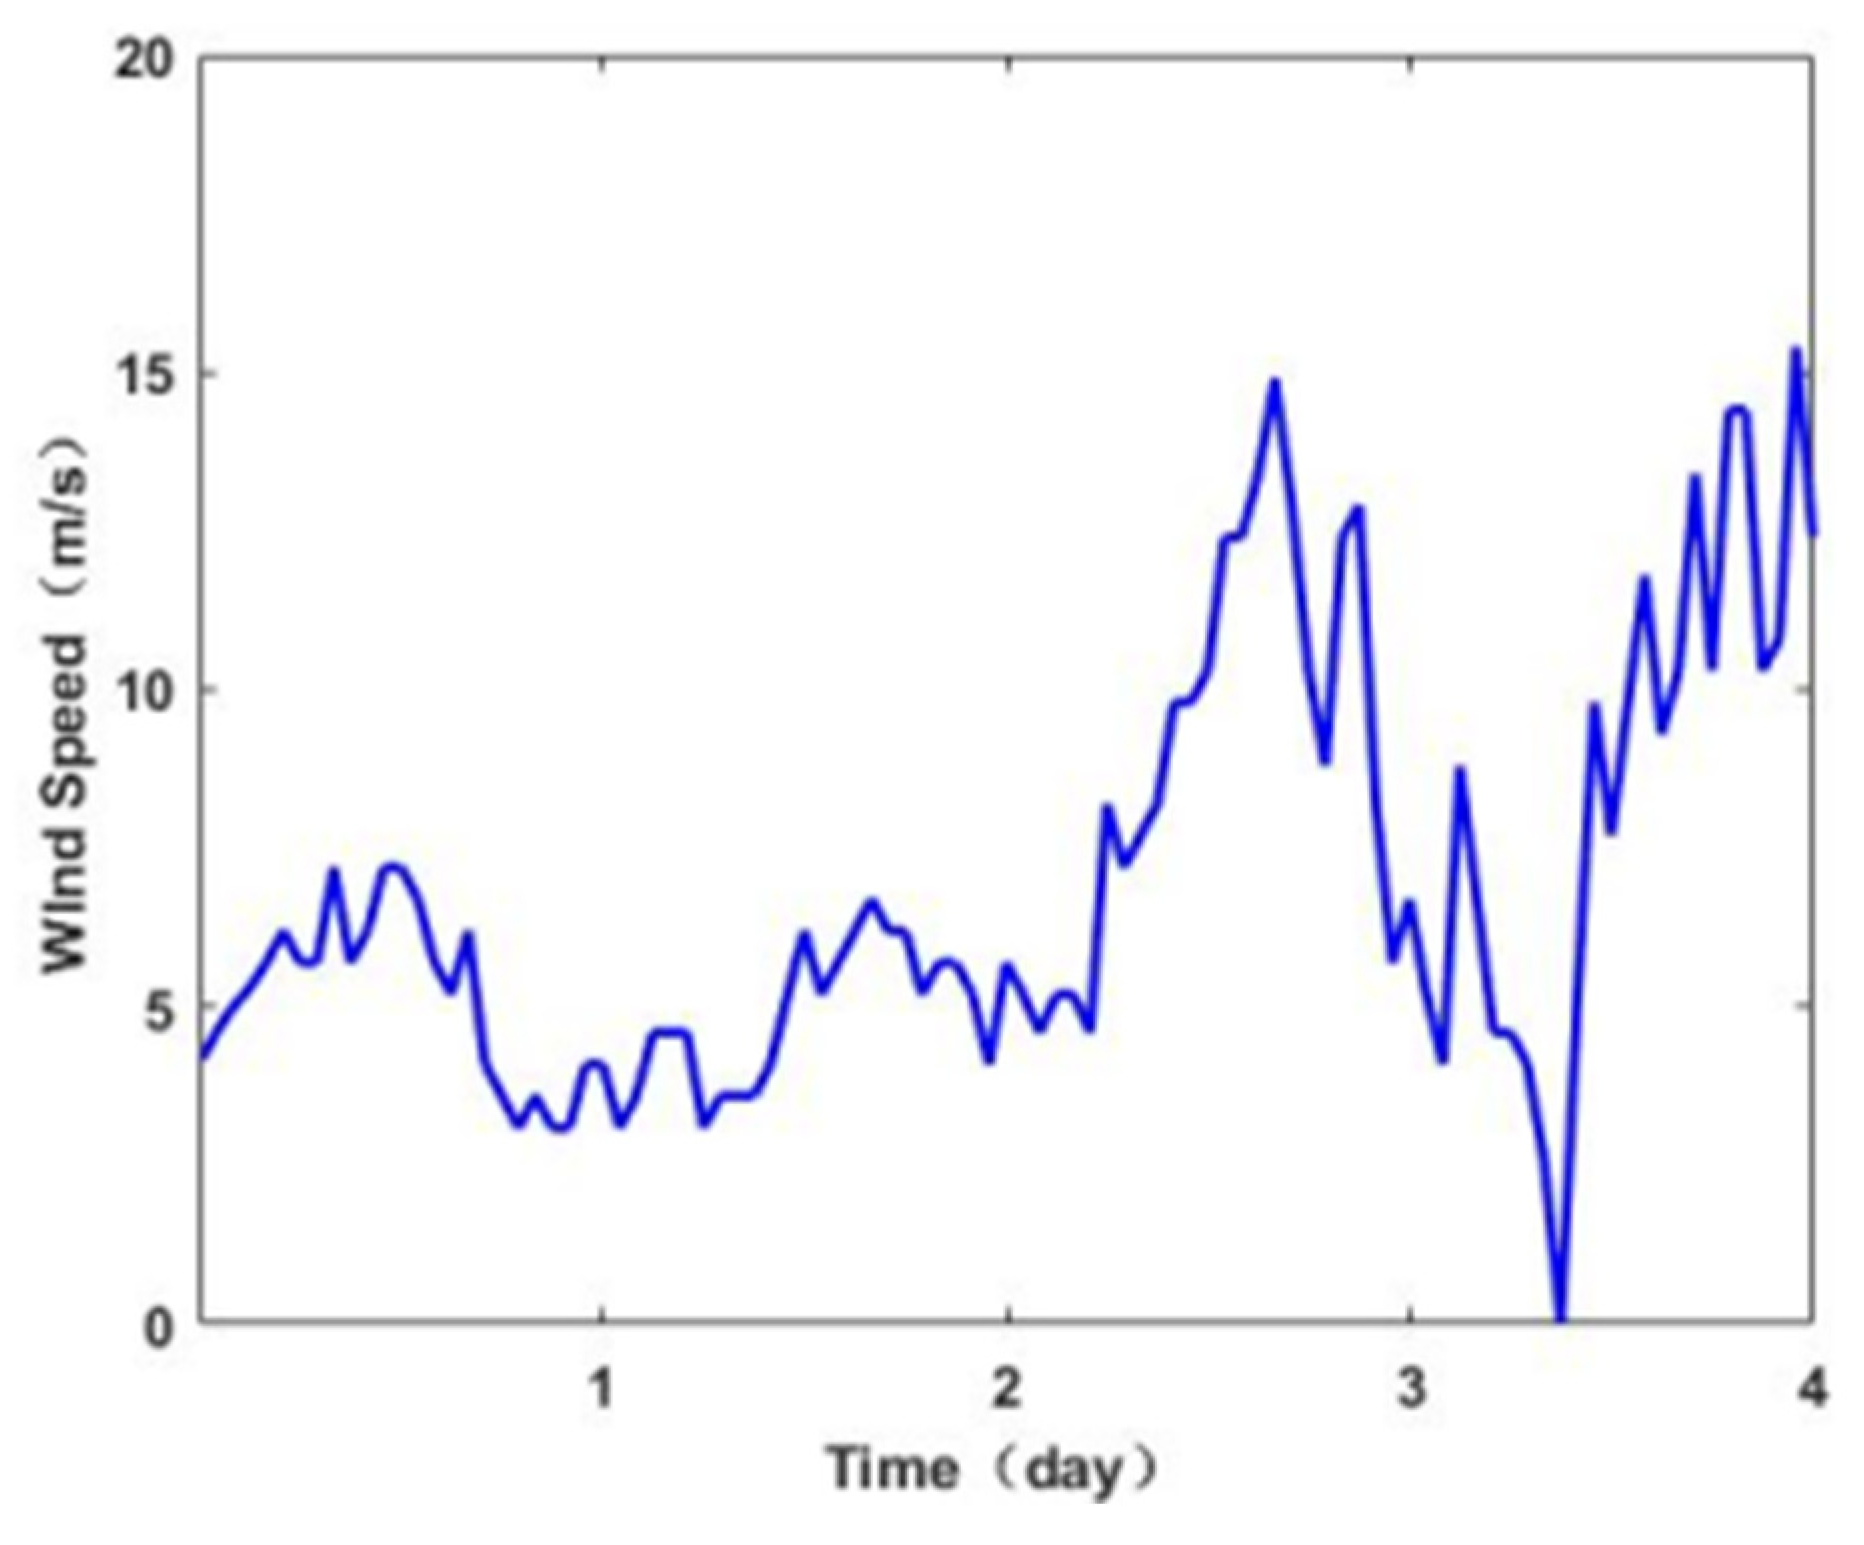
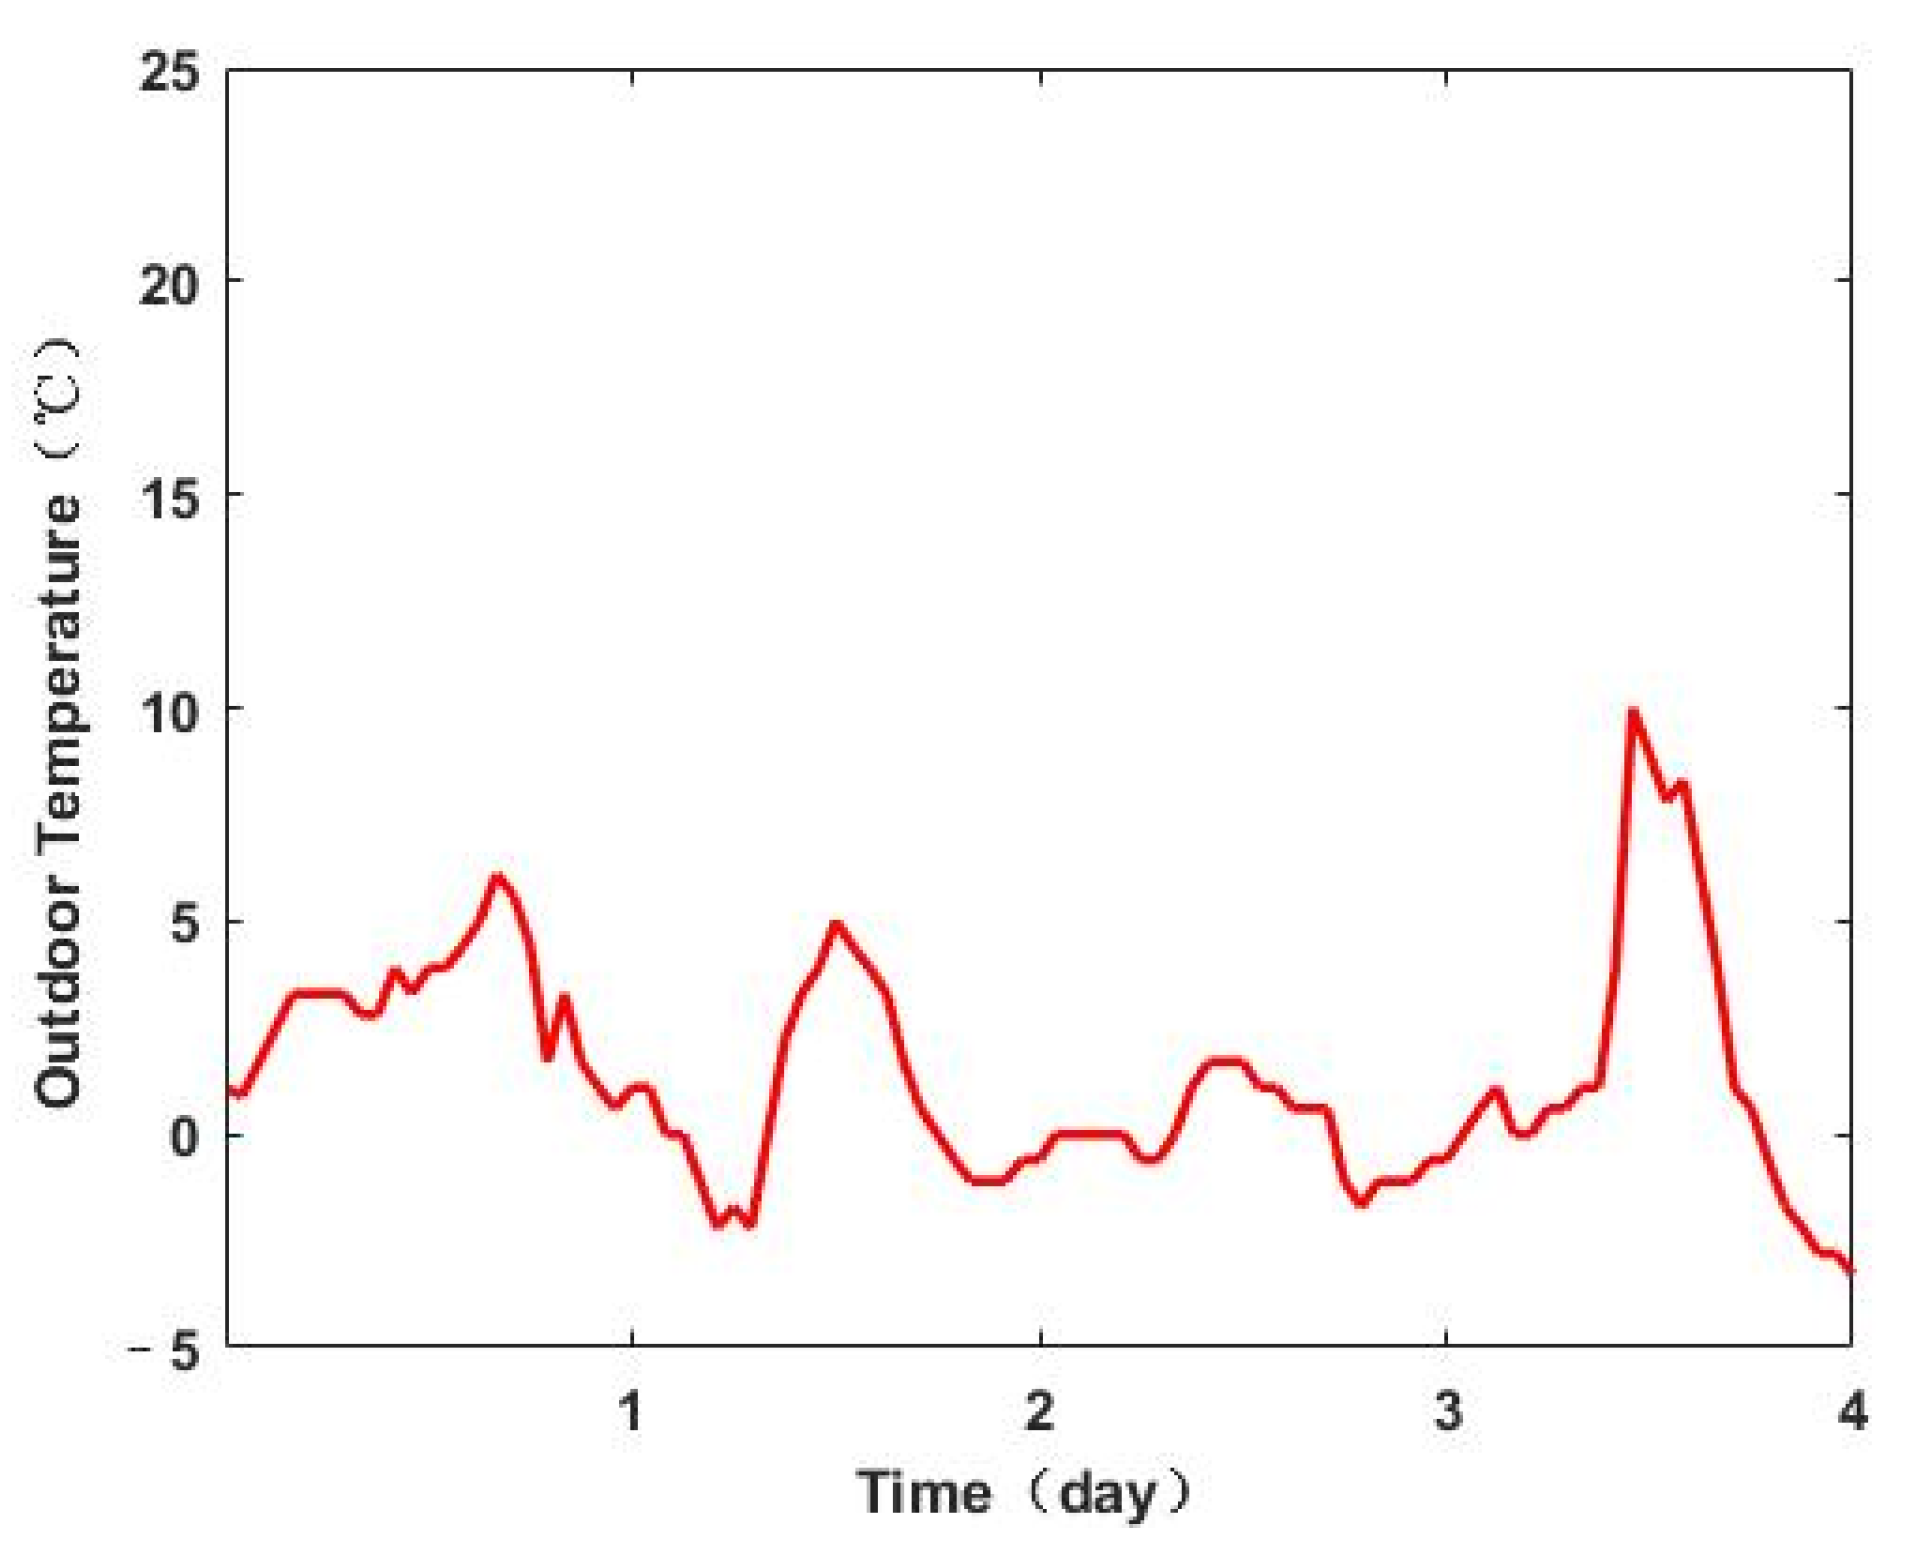
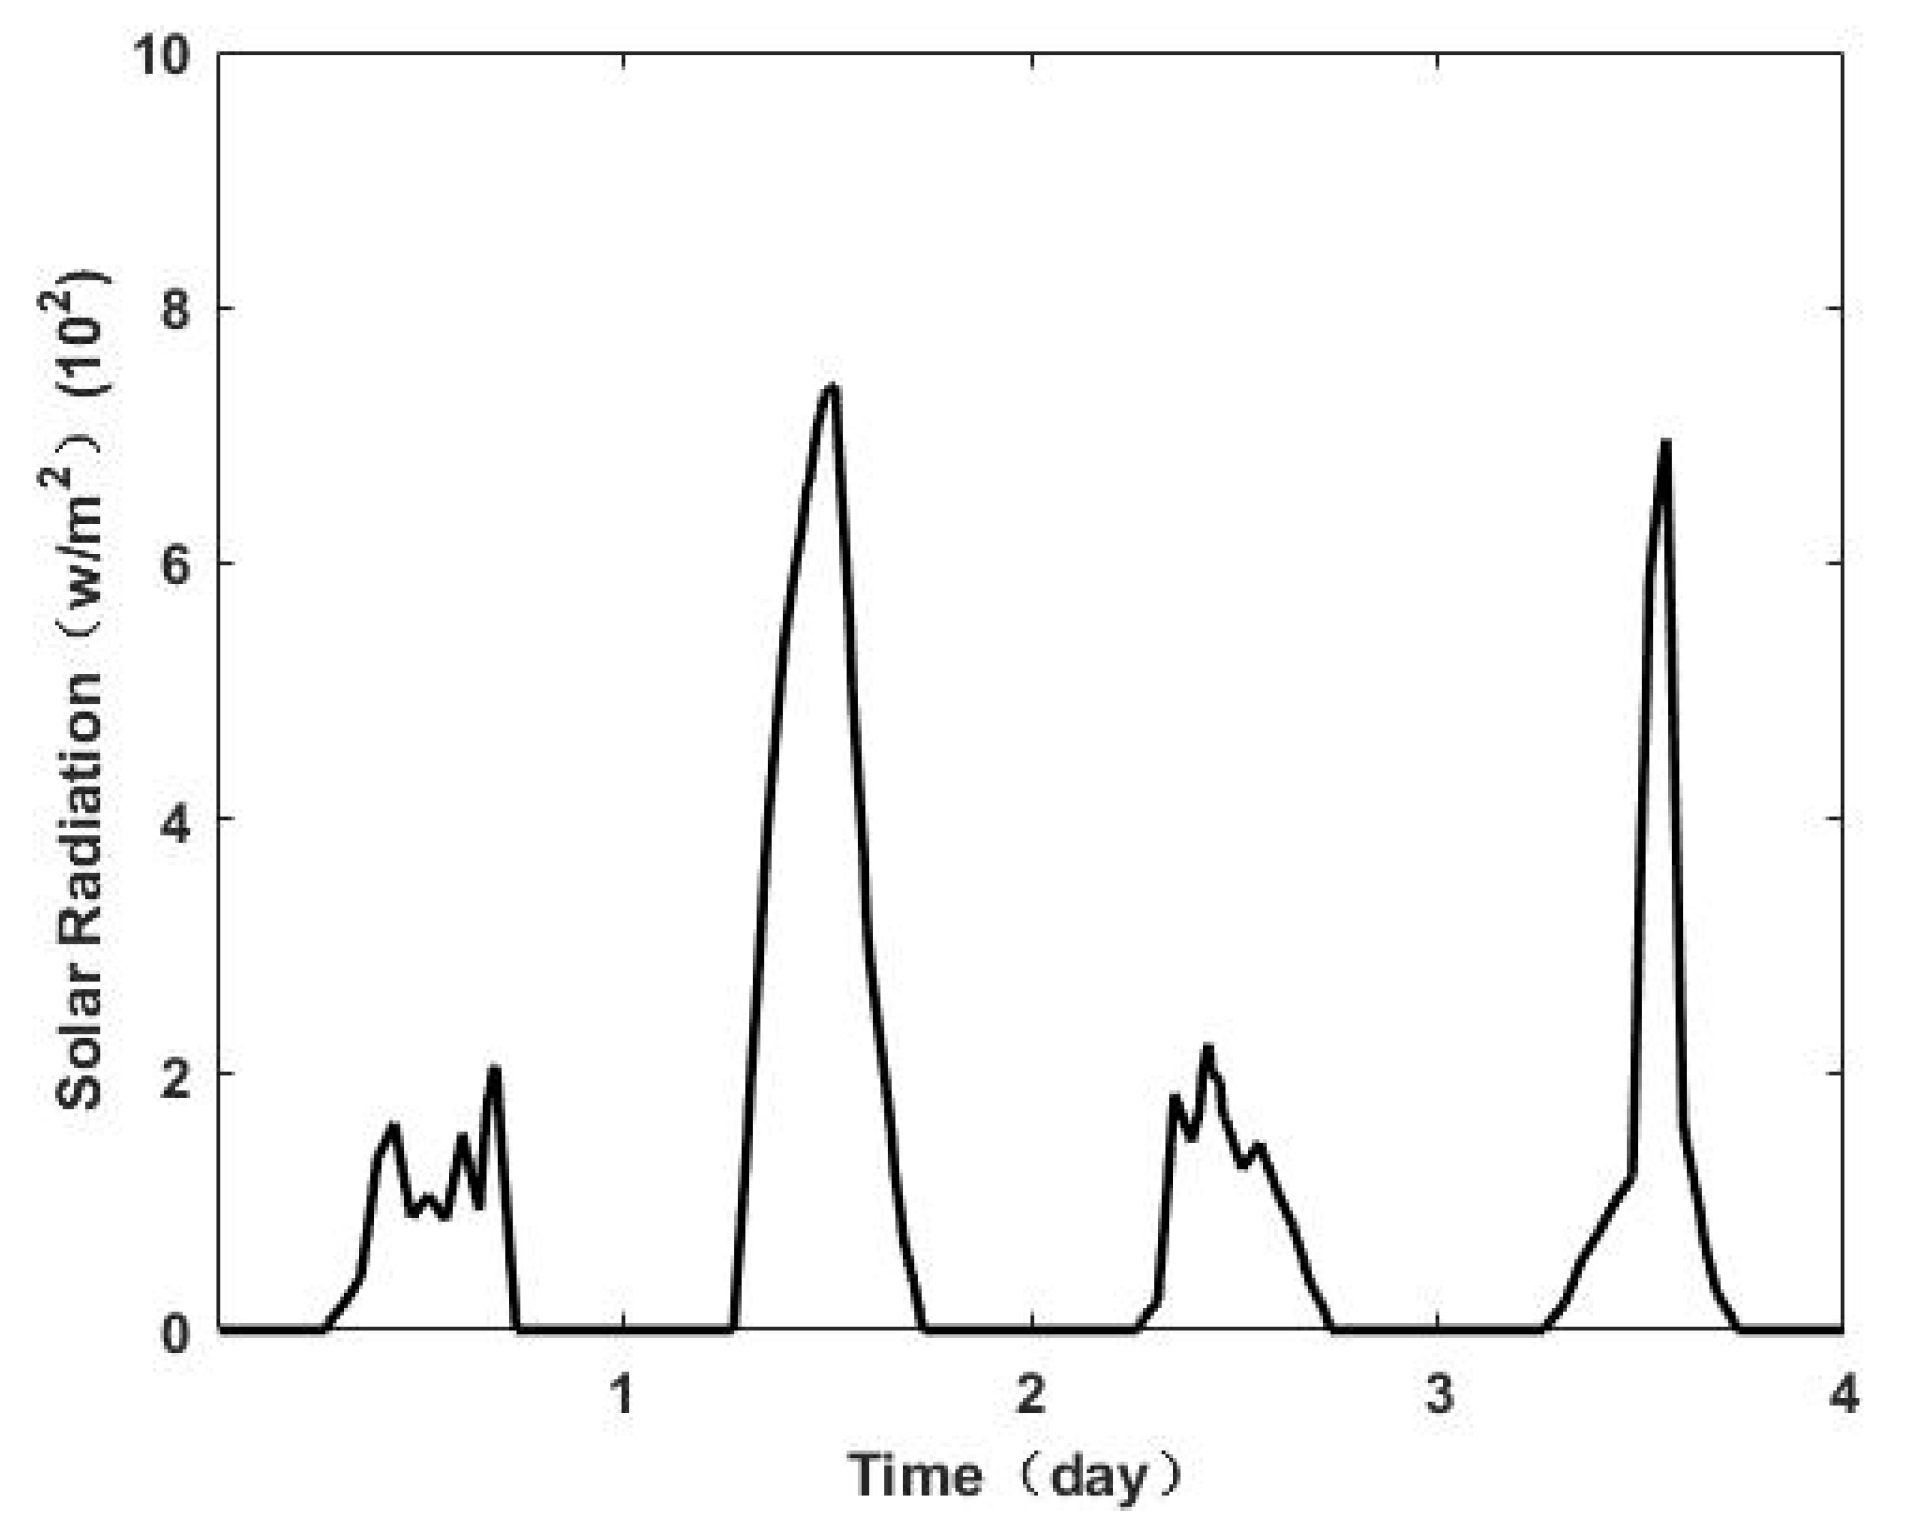
4.1. External Environment

Three zones were included, which were the north, west, and east individually. It was assumed that the windows were installed in the west zone facing south, as the diagram shows. The study aimed to test the combination of heating, cooling, and blinding devices in a single or a combined way. In the tests, there were four days with relatively different scenarios that had a diverse variation in both ambient temperature and solar irradiation. The four days were selected for no specific reasons, but they showed enough complicated variation for testing the effectiveness of the methods to some extent. The testing period was from 1–4 March during the transition period between winter and spring. Other environmental parameters included: altitude of 190 m, wind speed of 4.9 m·s−1, wind direction of 270°, and outdoor air pressure of 9.9 kPa. The wind speed varied over the four days, as shown in Figure 4. The variations in outdoor temperature and solar radiation are demonstrated in Figure 5 and Figure 6. As Figure 5 shows, the outdoor temperature varied during the entire four days, while daytime showed a higher outdoor temperature than during the night. Moreover, Day 4 showed the highest temperature over the rest of the three days on average. The highest and lowest temperatures were 6.6 °C and −3.1 °C, respectively. In terms of solar radiation, the second and fourth days showed stronger scenarios than their counterparts on Days 1 and 2, as shown in Figure 6.

4.2. HVAC Operation

During the work hours of 9:00 to 17:00, the comfort temperature was between 20 and 24 °C. The HVAV system’s operational schedule is shown in Table 5.

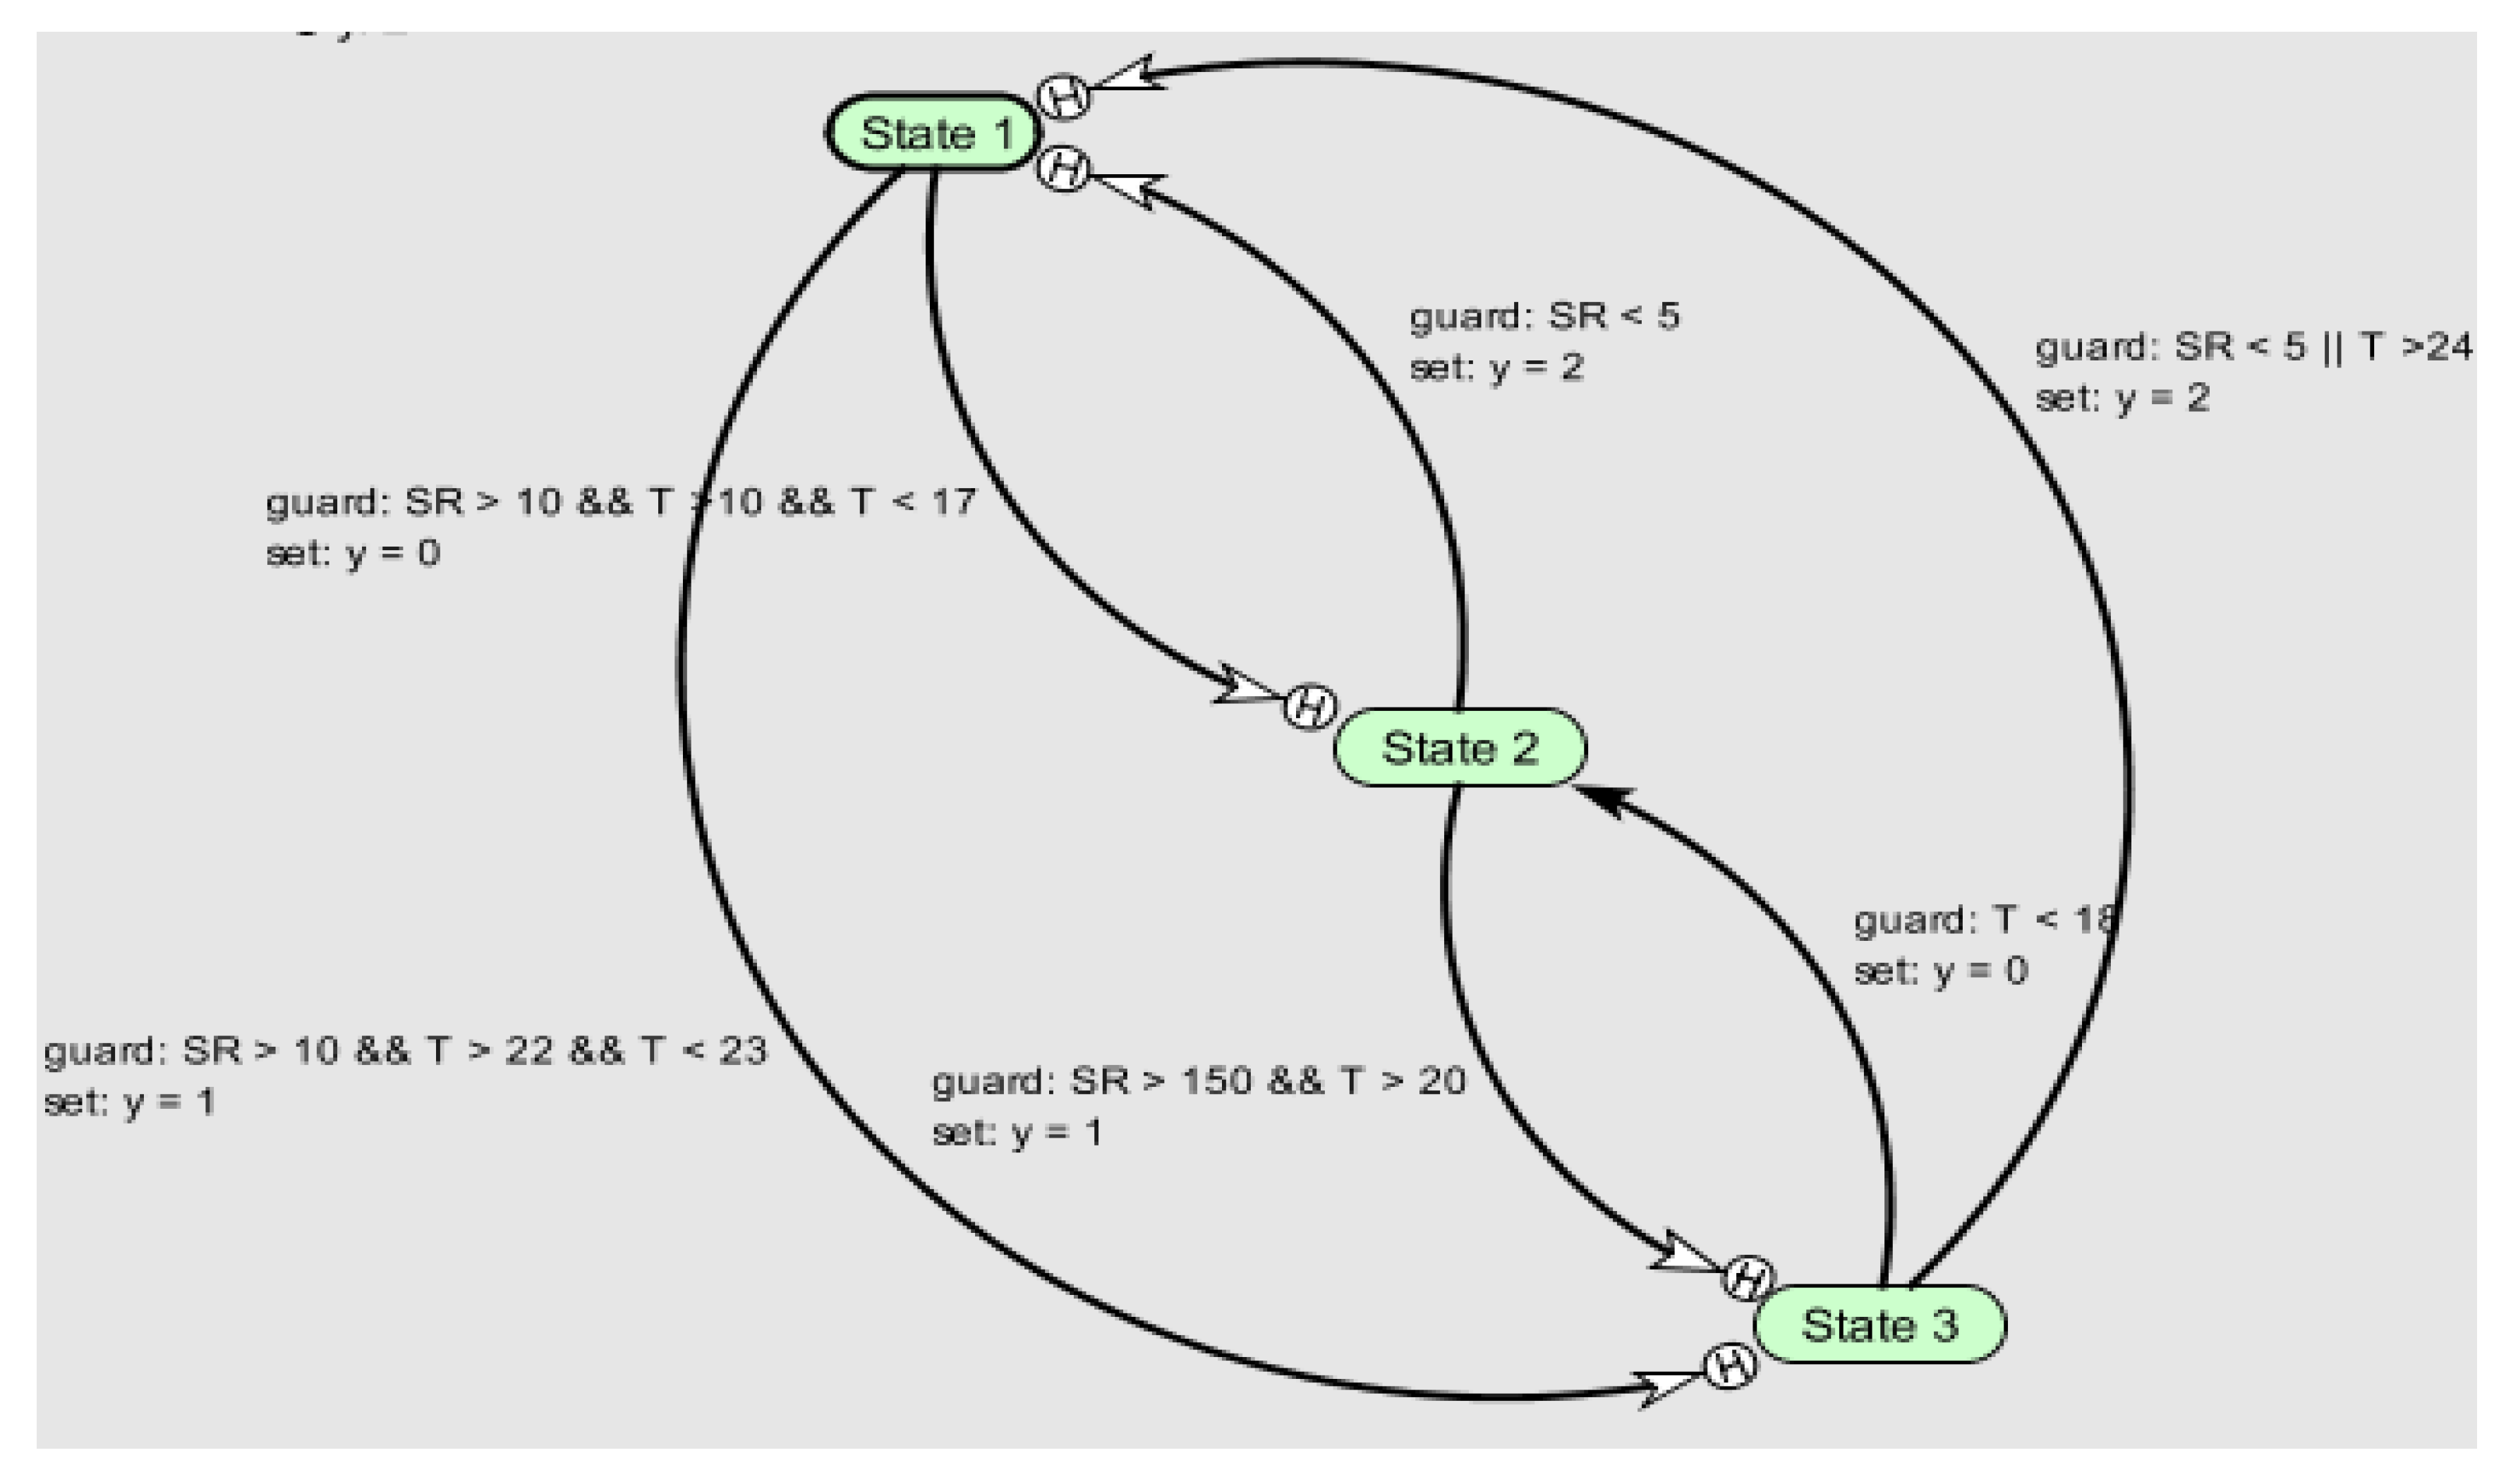
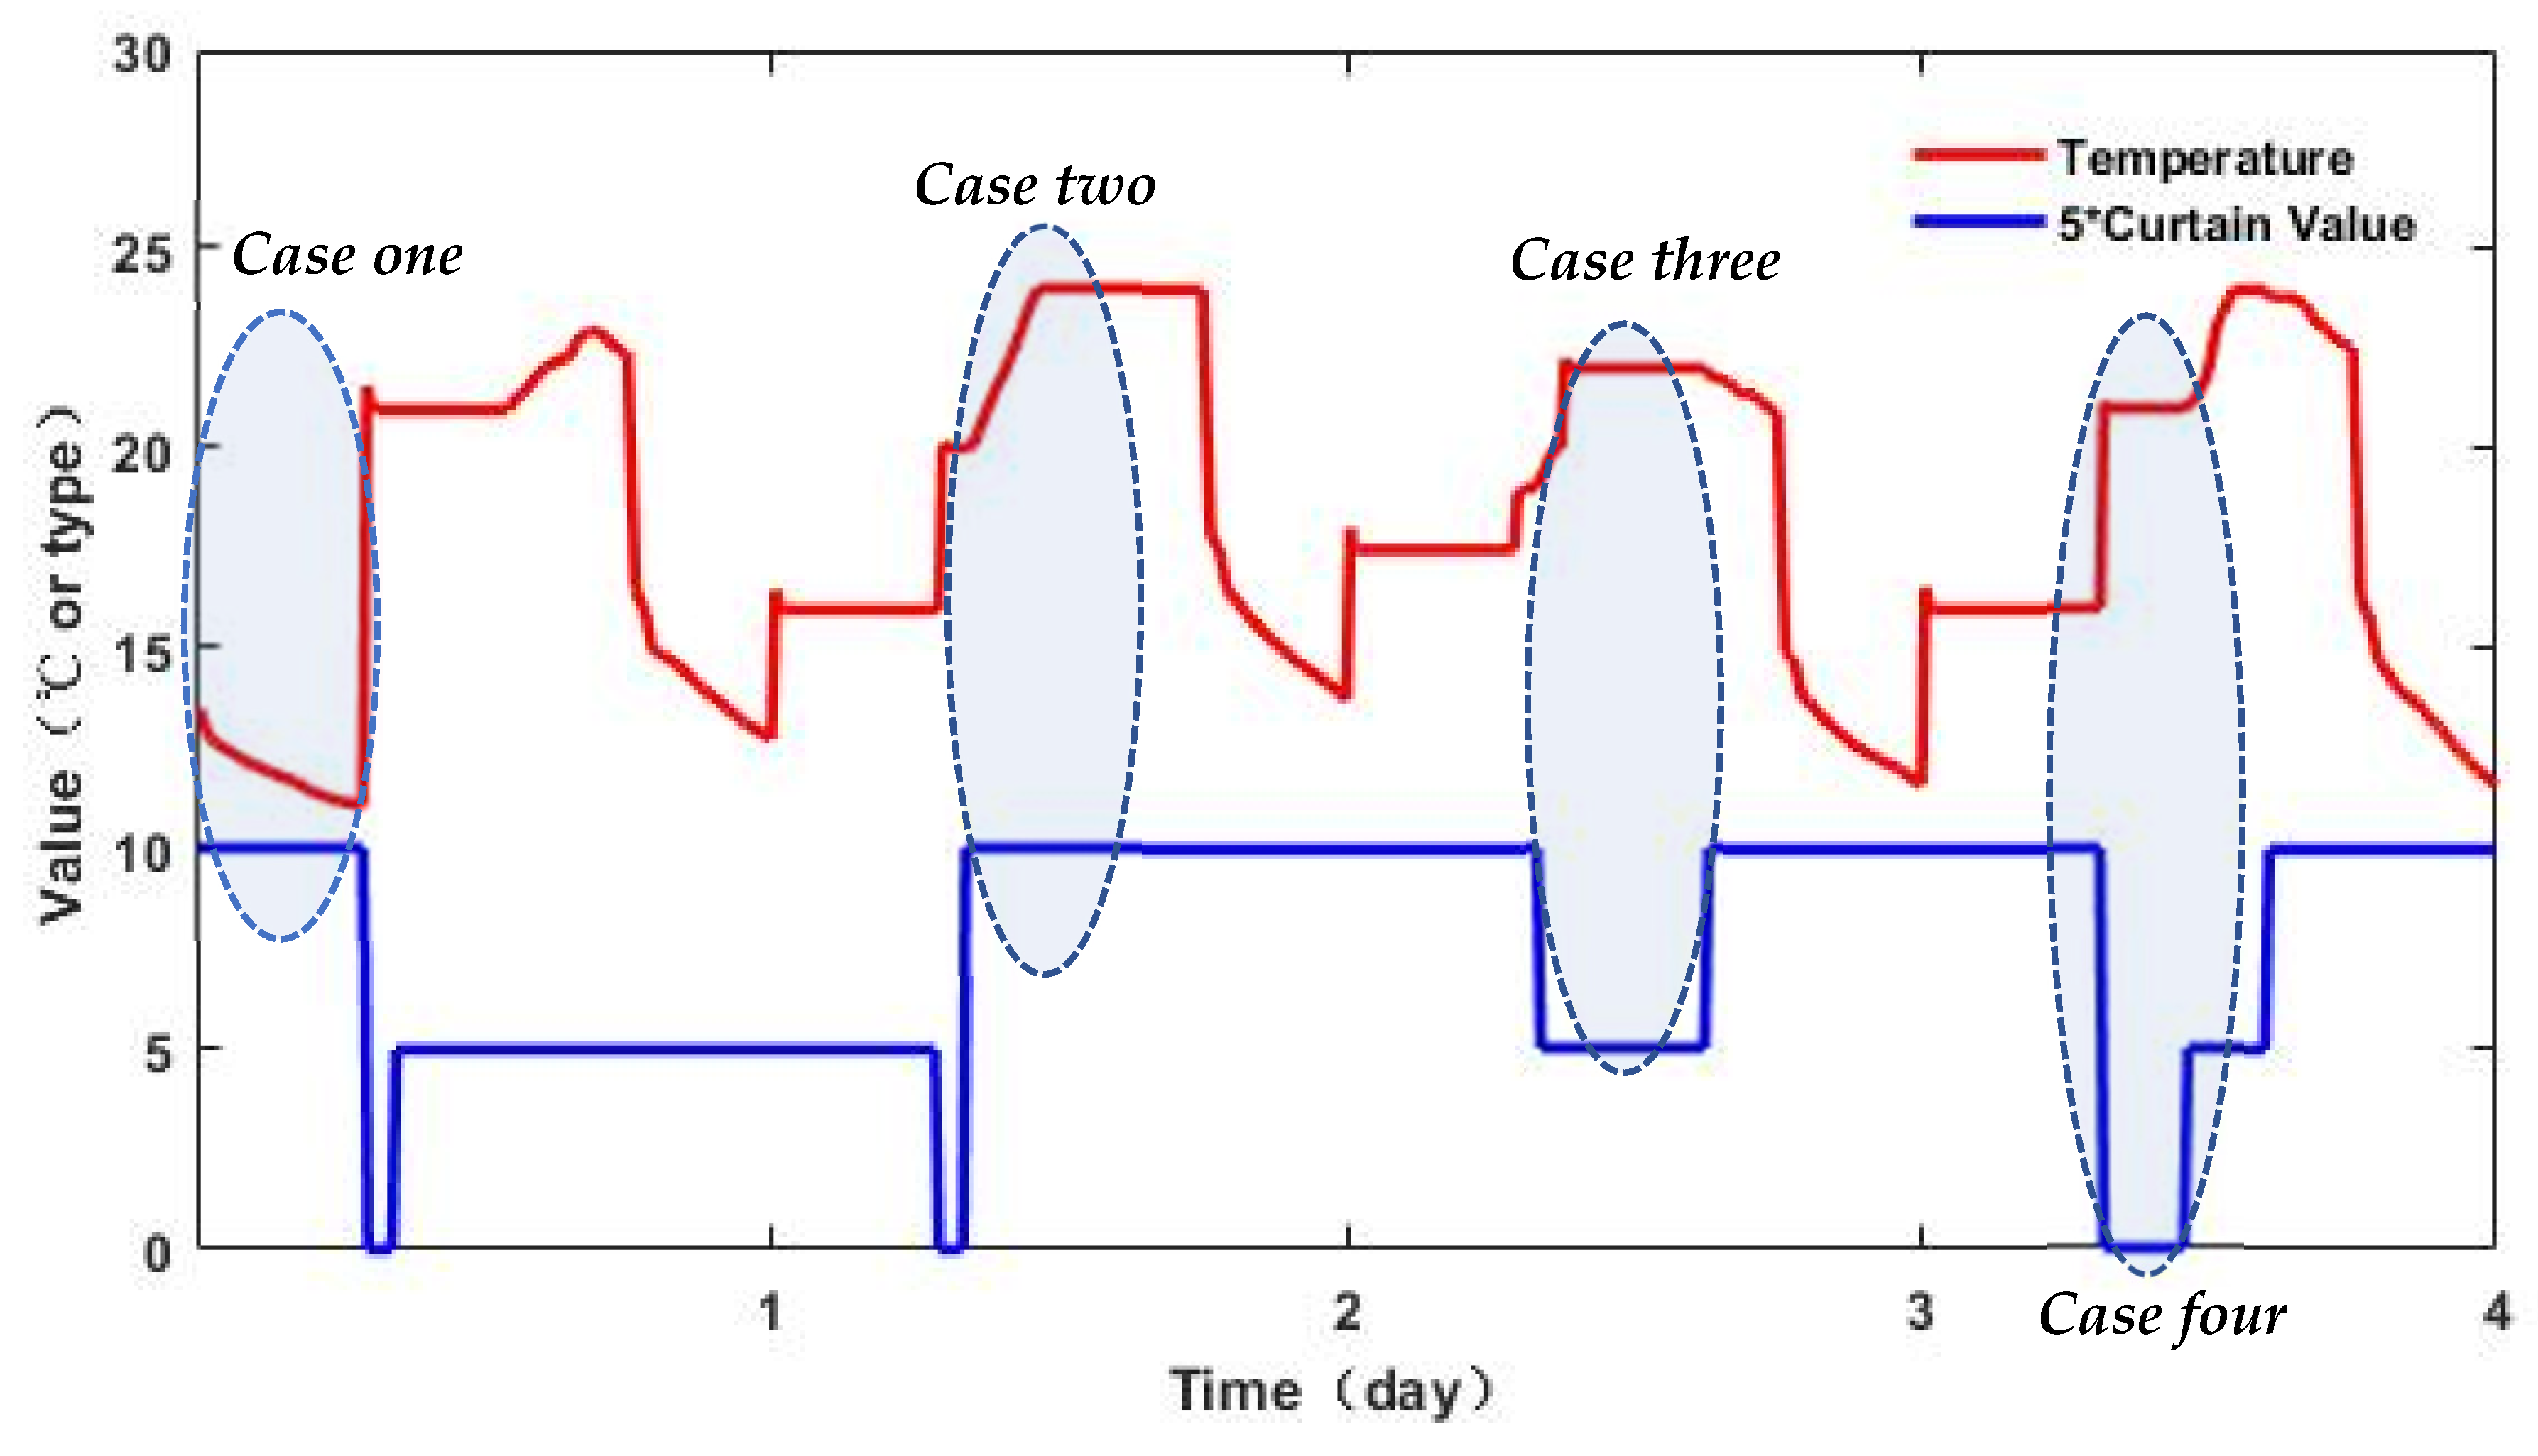
4.3. Blind Operation

The key part of the study lay in blind control that was executed using a state-transmission method. Figure 7 provides a state-transmitting chart for blind operation. Three states were used in the operation: States 1, 2, 3, which refer to full blinding, no blinding, and half blinding, respectively.
Starting from State 1, the blind fully covered the window. As the radiation rose to 10 W·m2 and the indoor temperature ranged from 10 to 17 °C, it moved to State 2, which led to the temperature increasing by receiving as much radiation as possible. Afterward, the system transmitted to State 3 if the radiation continuously rose until it reached 150 W·m2 with an indoor temperature higher than 20 °C.
In this case, the blind covered half of the window. Therefore, less heat was transferred into the spaces, and the rate of temperature increase slowed. The system then proceeded to State 2. When the radiation went down to 5 w·m−2 or the indoor temperature rose to 24 °C, the blind returned to fully covering the window to maintain the indoor temperature or reduce heat via radiation. In this case, the temperature rise or fall was slowed down. In other cases; for instance, for radiation higher than 10 w·m−2 and an indoor temperature from 21 to 23 °C, the blind covered half the window. Or, if the indoor temperature was less than 18 °C, the blind fully opened to boost the heat gain into the space, leading to a temperature increase. In the case of a temperature lower than 5 °C, the blind went into State 1. The state-transmitting chart confirmed the blind operation within a closed loop while keeping the indoor temperature as close to the comfort range as needed.
By following the operation of the state chart in Figure 7, Figure 8 demonstrates the waveform in line with the indoor temperature variation under the three types of operation. The indoor temperature from 9:00 to 17:00 each day was always higher than 21 °C for the HVAC system, as defined in Table 5. However, the temperature fell to lower than 15 °C in most of the overnight periods. Moreover, the indoor temperature rose to higher than 23 °C at some time points since the fully covered window could not prevent the temperature increase. Cases with a temperature over 23 °C or below 15 °C breached the comfort standards defined by ASHRAE. In other words, the problems could not be fully solved by solo blind operation. Therefore, heating or cooling by the HVAC facilities was necessary for our purpose.

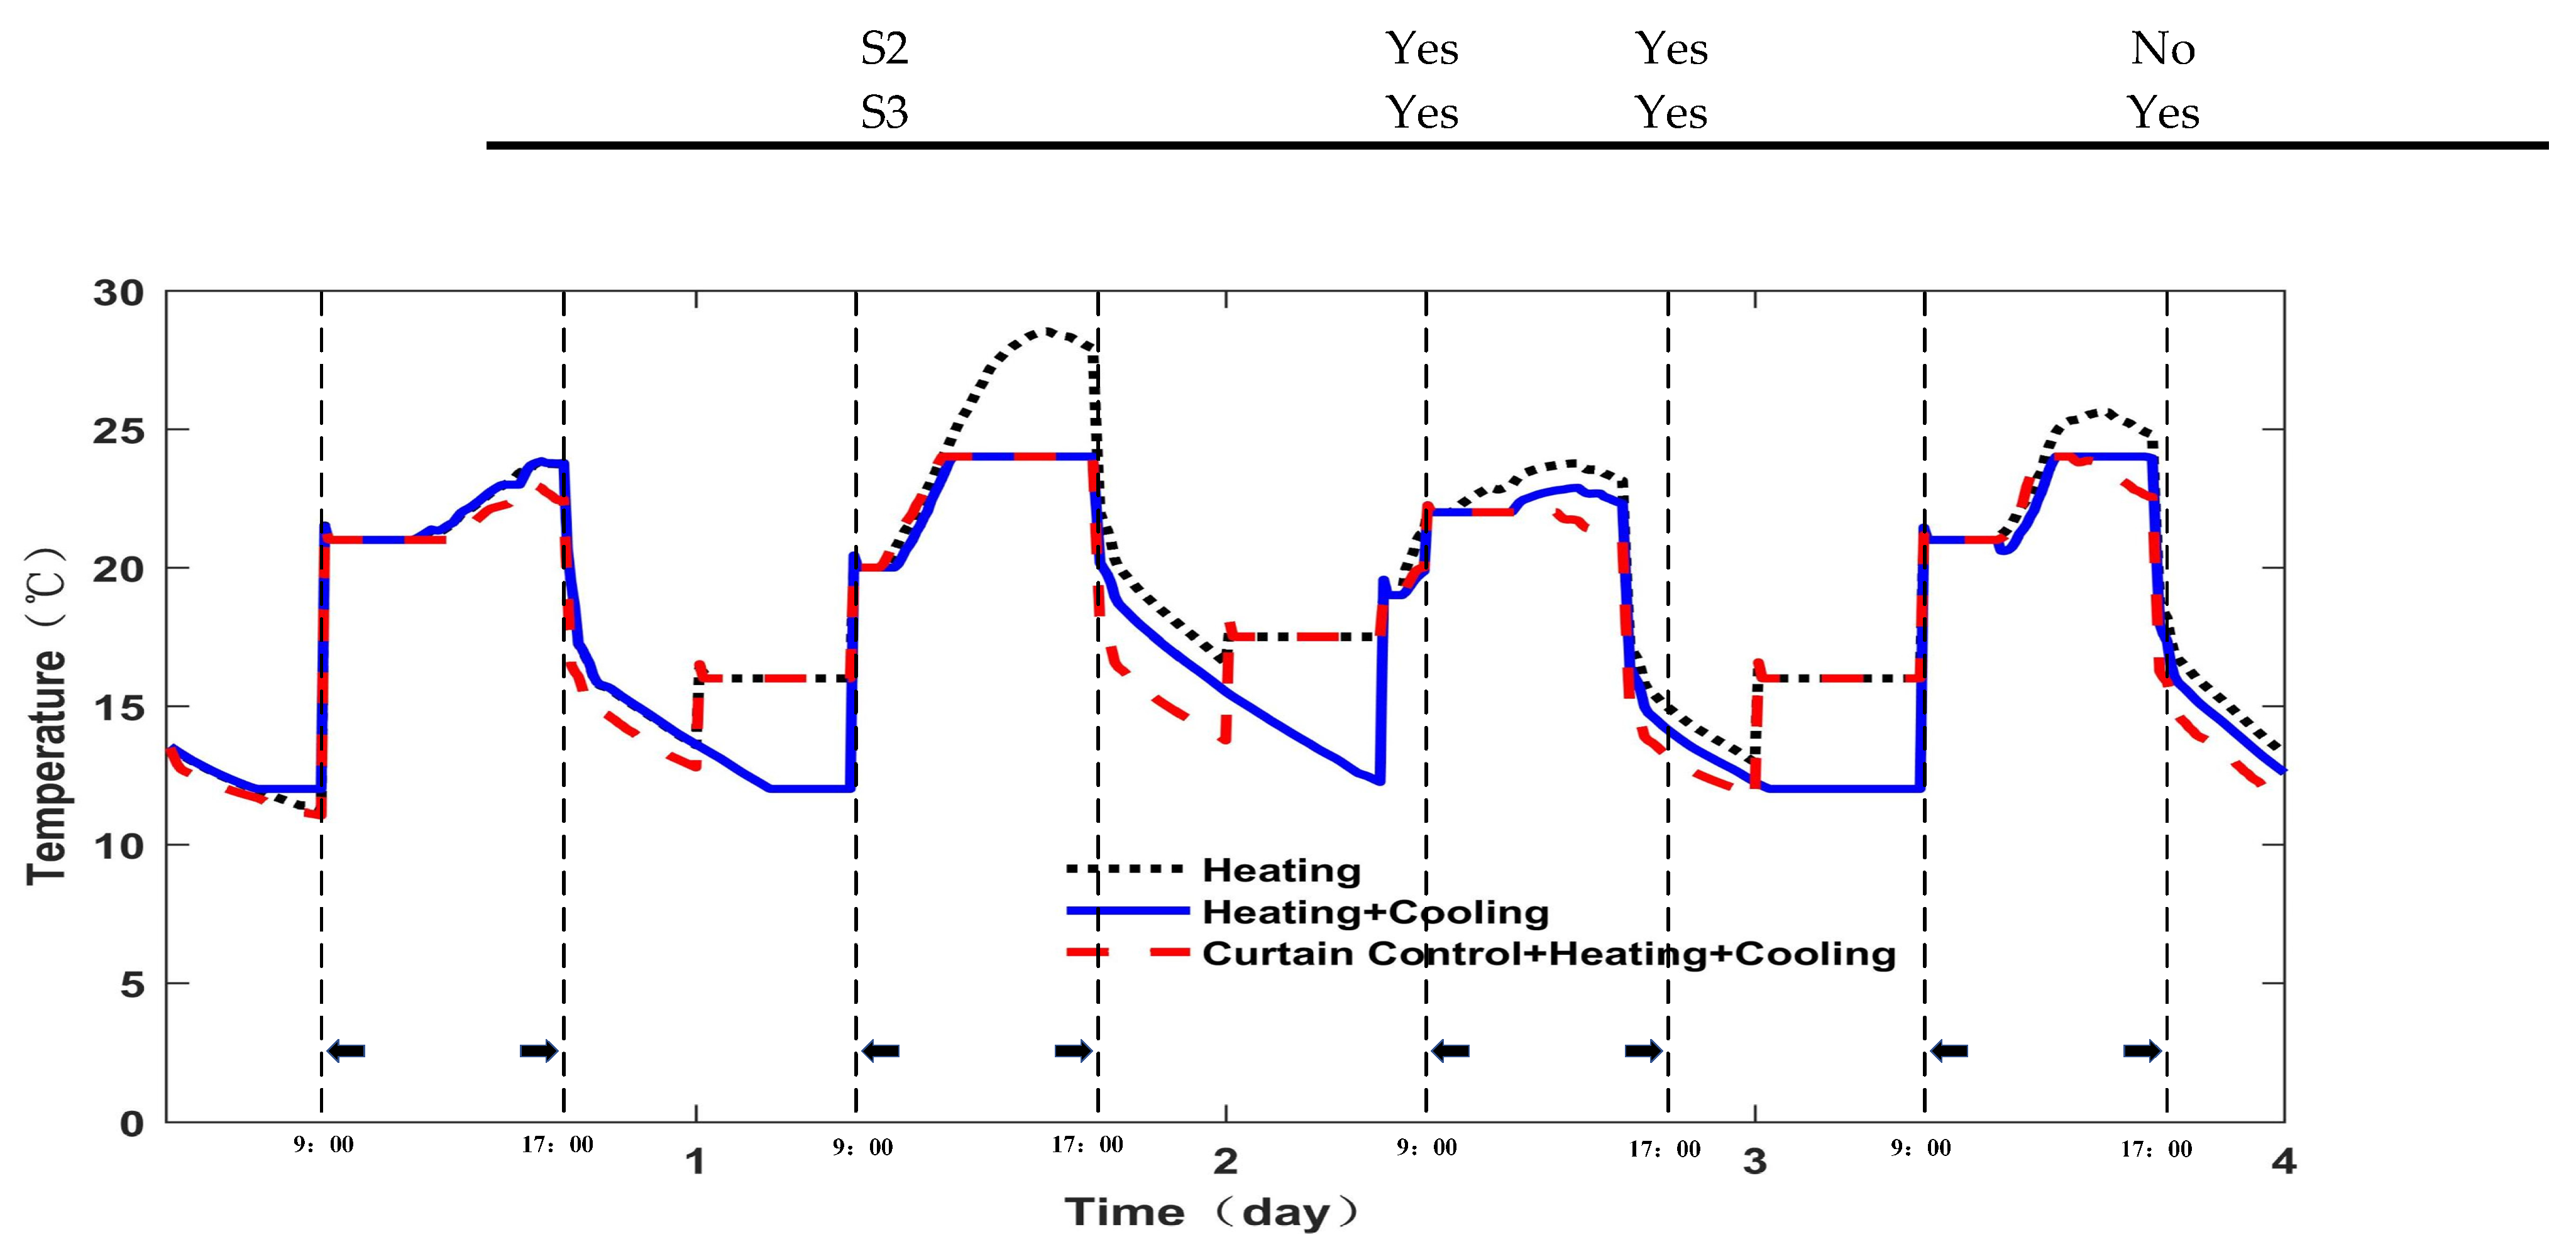
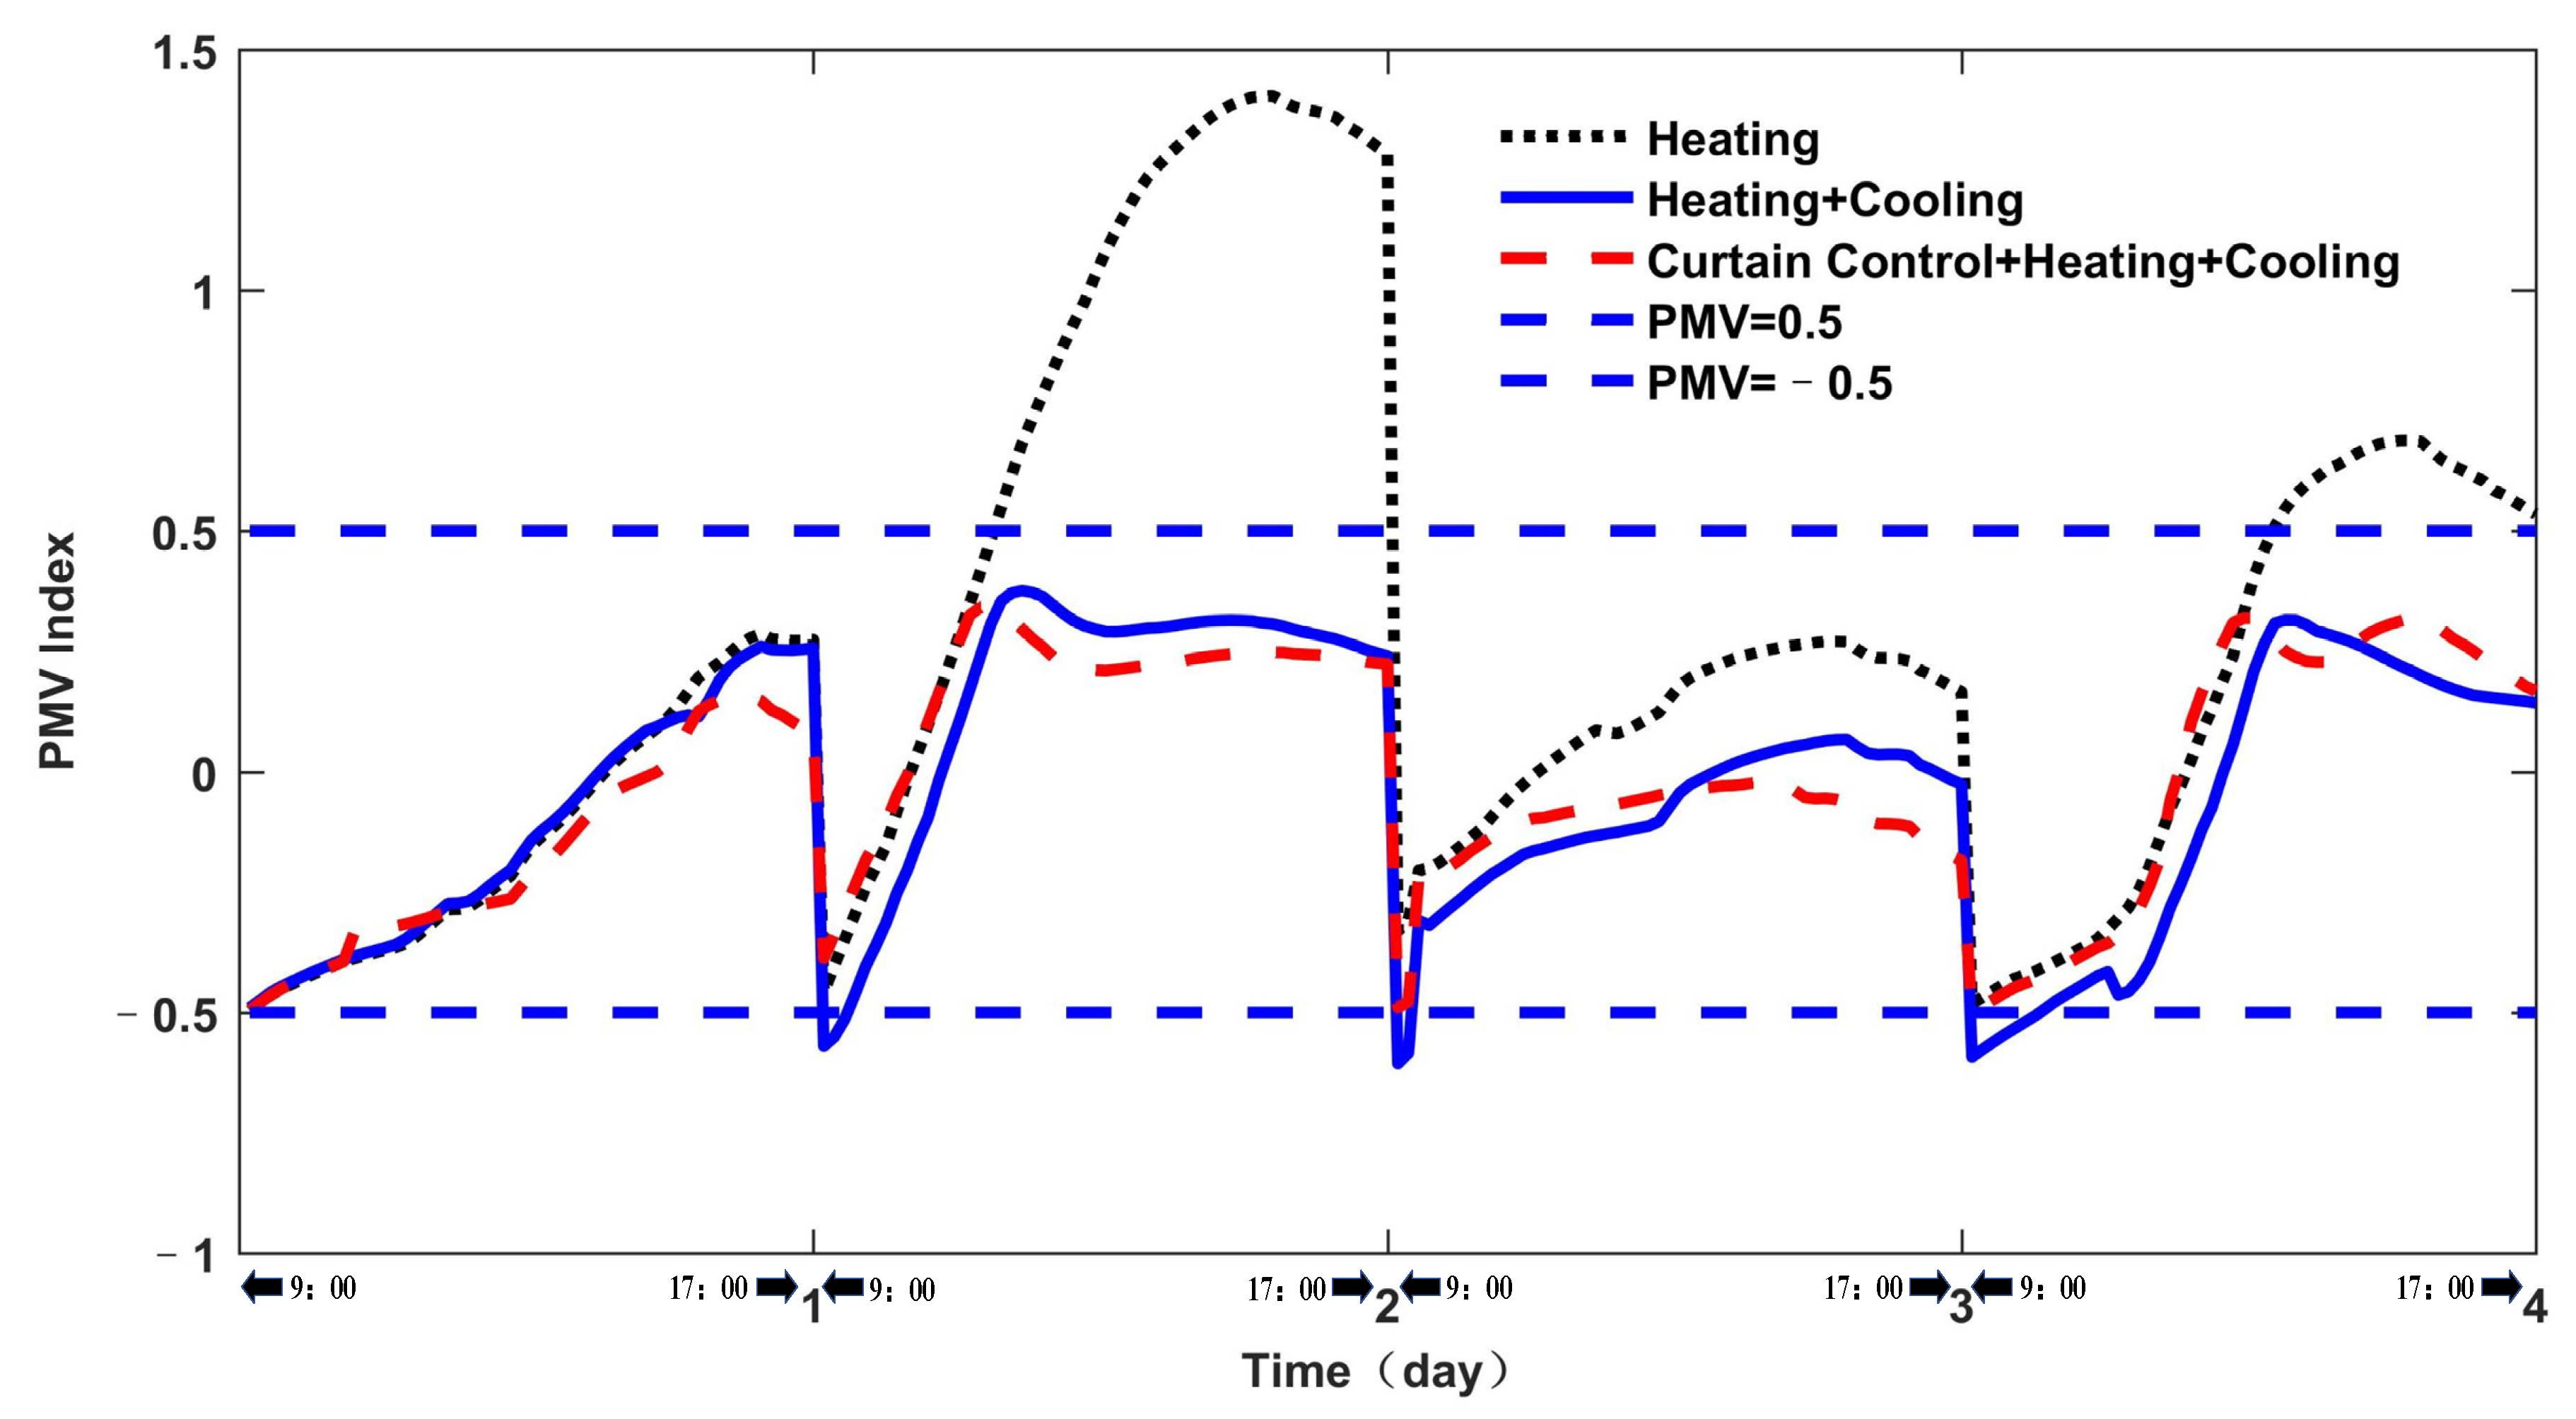
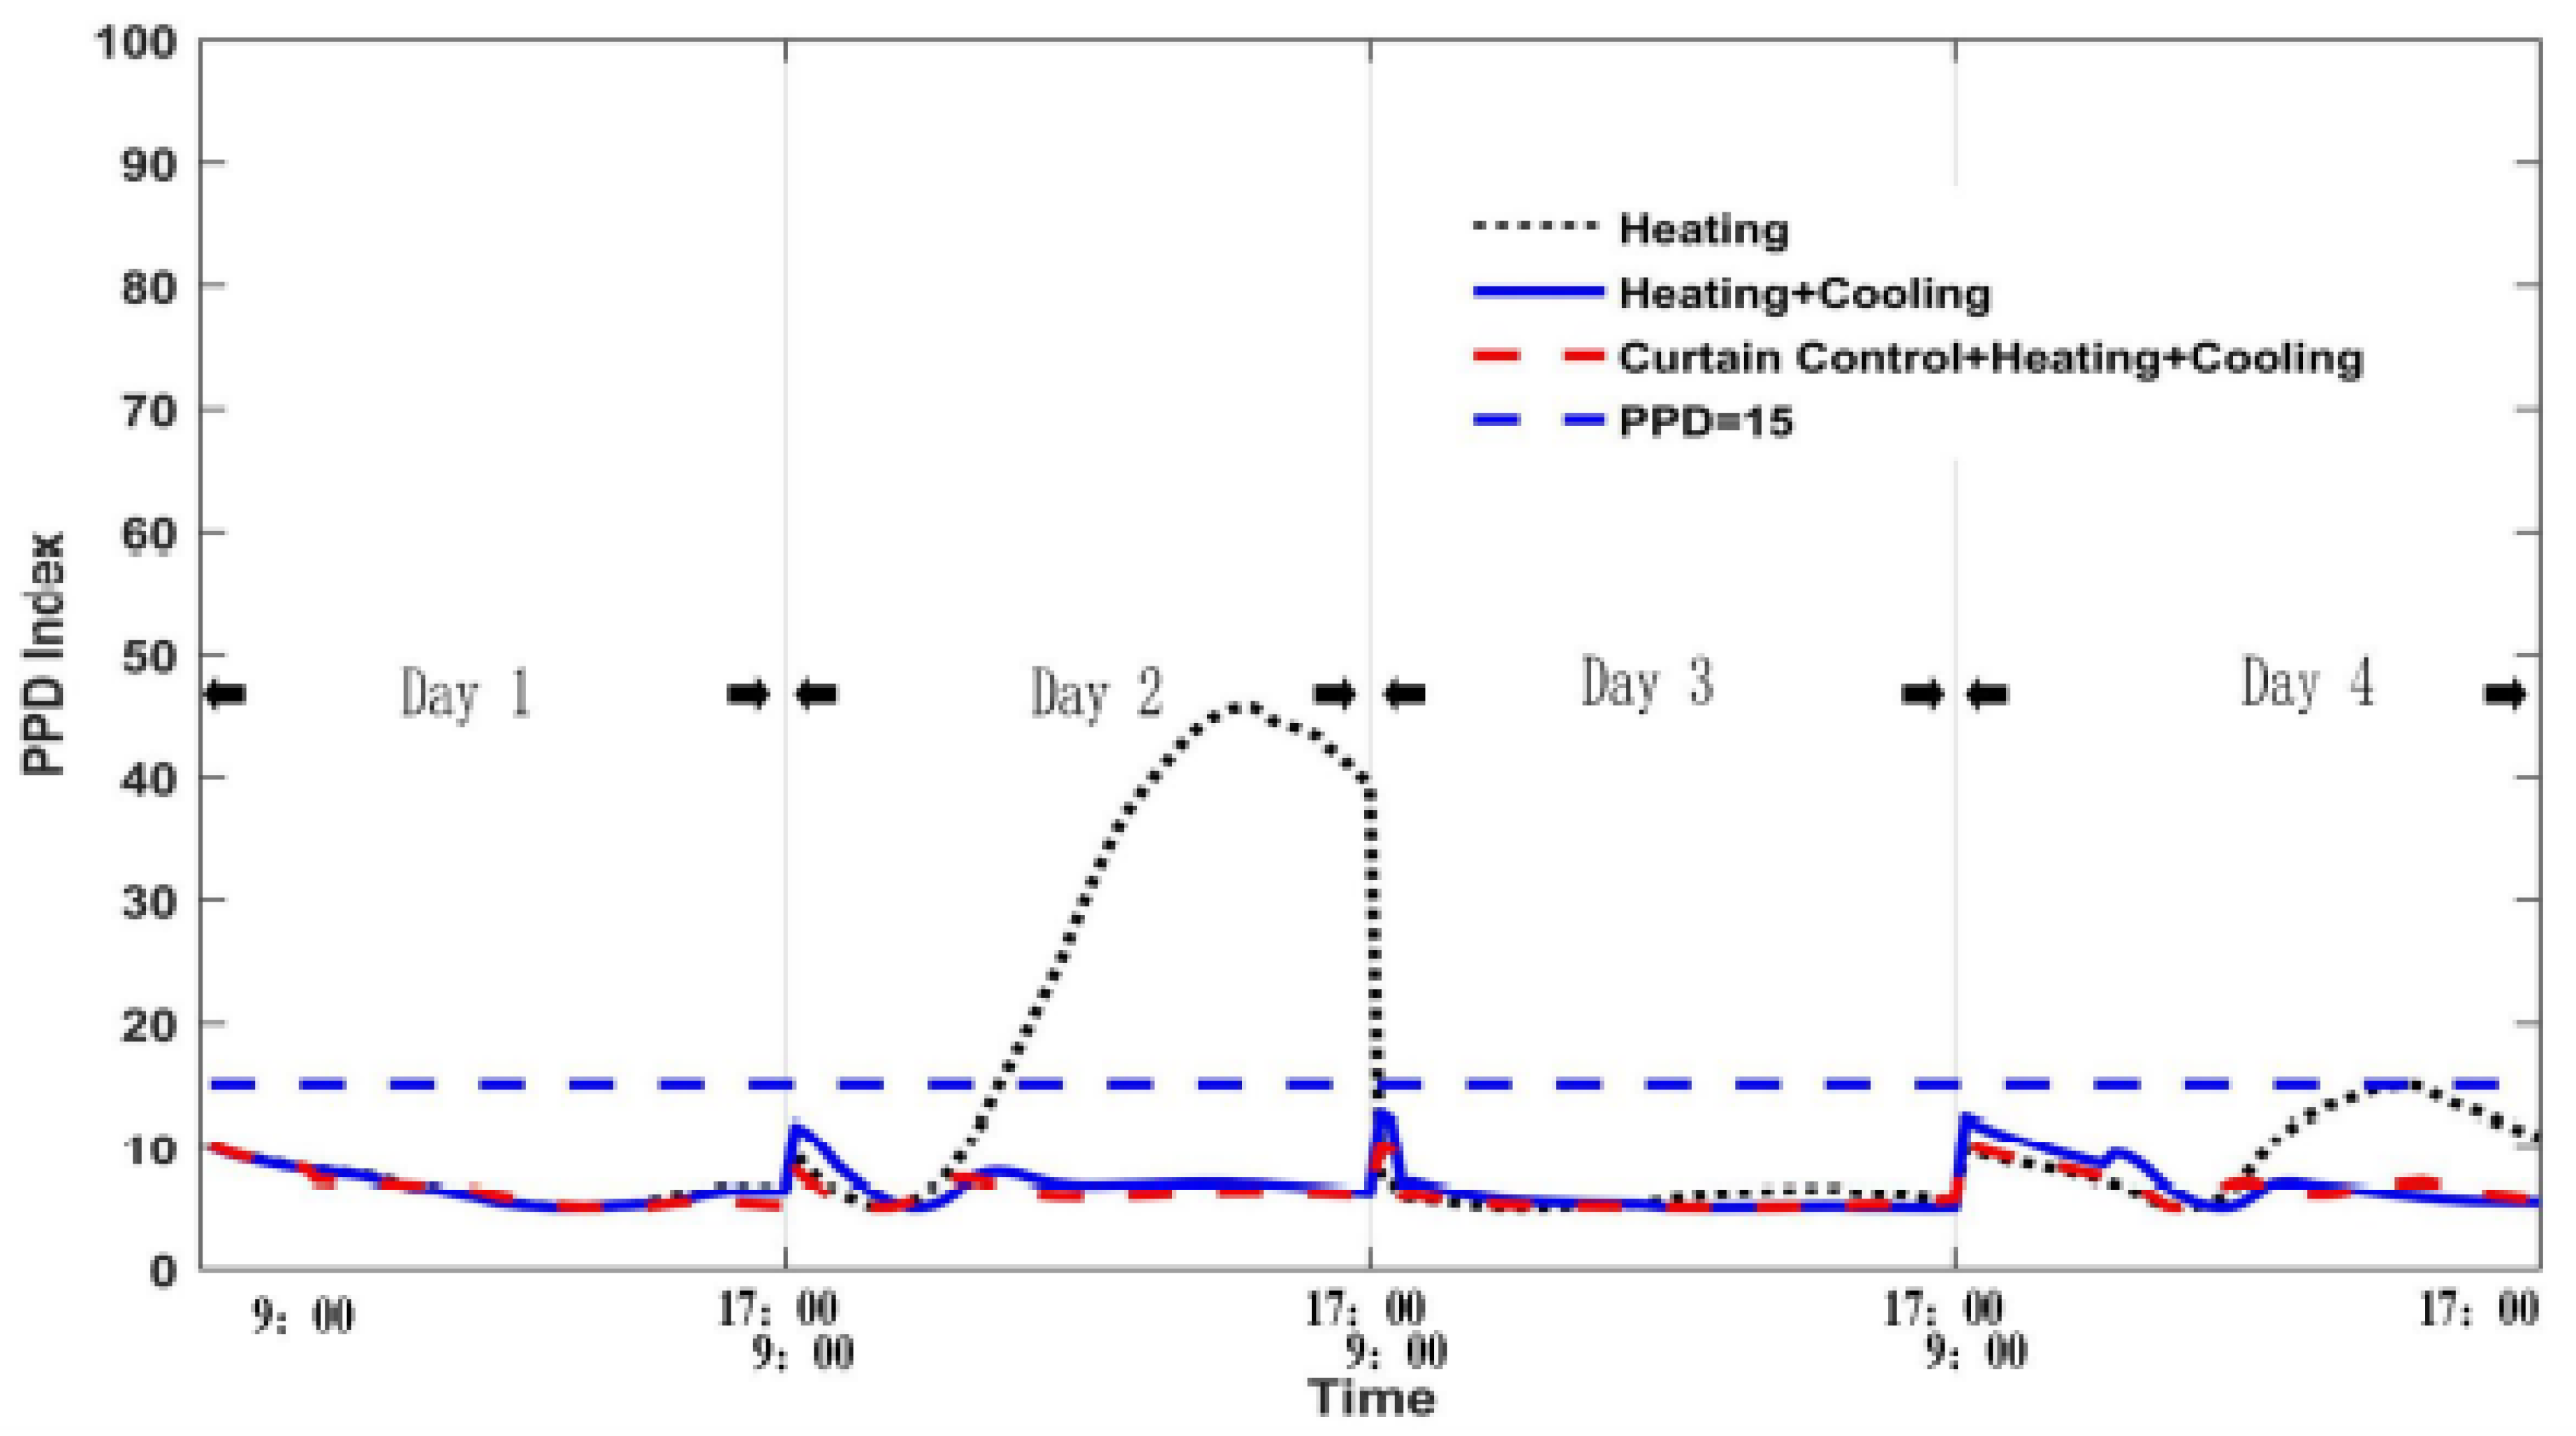
4.4. Comparison with Different Operation

We tested the performance under different operational strategies. In Case S1, an operation plan with heating only was used. Case S2 employed both heating and cooling devices to regulate the indoor temperature without the blind. In Case S3, blind operation was incorporated with both heating and cooling. These strategies are summarized in Table 6.
As Figure 8 indicates, the indoor temperature in Case S1 operation was generally higher than for other counterparts in the same period. In particular, the indoor temperature was far higher than for the others during the day with strong solar radiation, since the temperature rose fast without the blind. After the radiation diminished, the indoor temperature gradually fell. The indoor temperature in this case tended to vary in a similar way to that of the radiation. The high temperature was maintained for a while, which led to occupants being uncomfortable at the same time. With the heating and cooling operation, high temperatures were obviously restrained due to the assistance from cooling. However, cooling consumed more energy, which was not a desirable solution for our purposes. Moreover, it led to low temperatures for a while, as the blue line shows. In the third operation, blind operation with both heating and cooling resulted in a decent temperature range over the longest period, as the red dotted line shows. The temperature rose by following the radiation growth during the daytime on Day 1, as the cycled part shows in the cases of both the red and blue lines. The temperature fell thereafter. However, the blue line shows the cooling effect from the HVAC device, while the red line shows the results of the fully covered window to reduce energy loss when the radiation was weakened. Obviously, the red line shows a lower consumption of energy than the counterpart of the blue line, while similar indoor temperature variation was reached. Comparing the red (with blind) to the blue line (without blind), the former shows a slower variation than the latter. Similar scenarios can be seen in the cycled part shown in Figure 8. Moreover, the red line shows less time in low temperatures than does the blue line, in general. When both the radiation and outdoor temperature were low, the fully covered window enabled the indoor temperature to vary more slowly, which was evidenced by the period of the nights. Overall, blind operation was useful in saving energy while maintaining a temperature within a decent range.

4.5. Comfort Indicators: PMV and PPD

Predicted mean vote (PMV) is a common indicator for comfort evaluation in building environments [21,22]. This complicated indicator involves six parameters in the targeted environment, including air temperature, humidity, solar irradiation, air flow, metabolism rate, and thermal resistance of cloth. It represents occupant comfort on average, and is divided into seven grades, including the feelings of cold, cool, minor cool, medium, minor warm, warm, and hot. Their values are −3, −2, −1, 0, +1, +2, and +3, respectively. Another indicator, predicted percentage of dissatisfied (PPD) [23], was also proposed to assess occupant dissatisfaction with the thermal environment around them. The following equation represents the relationship between PMV and PPD:
PPD = 100 95 × e ( 0.003353 × PMV 4 + PMV 2 )
PMV performance under the various operational strategies is illustrated in Figure 9. Since it was an office building, work hours between 9.00 to 17:00 were considered to be when the room was occupied each workday. Thus, both PMV and PPD were calculated, and are shown in Figure 9 and Figure 10 for the time range of 9:00 to 17:00. PMV was calculated based on parameters including air temperature, humidity, solar irradiation, air flow, metabolism rate, and thermal resistance of cloth. Air velocity was equal to 0.137 m/s; relative humidity ranged from 55% to 100%; metabolic activity was equal to 1.2 met; clothing insulation was equal to 1 clo; solar irradiation ranged from 0 to 712 W/m2, and the indoor temperature varied from 0 to 24 °C. Table A1 in the Appendix A gives the details.
The black, blue, and red lines in Figure 9 refer to the performances of the Case 1, Case 2, and Case 3 strategies, respectively. As the waveform shows, only the red line was within the range of −0.5 to 0.5, which meant only comfort satisfaction was met by the Case 3 operation. The operation of heating only brought about the most discomfort during the second day due to solar radiation being high during the day. Without blind or cooling assistance, the indoor temperature kept climbing, which led to the increase in the PPD. Until the radiation receded, the PMV remained at the top for a while before falling. Afterward, the PMV shown by the black dotted line returned to the comfort range. The red and blue lines display similar changes in operation, except the blue line went lower than −0.5 occasionally due to the cooling operation causing the temperature to be low for a few moments. Figure 10 shows the PPD variation. As in Figure 9, PPD reached a high value during the second day, which presented discomfort during the daytime of this day due to no blind being used to prevent strong radiation. Without blinding, the indoor temperature during the nighttime fell and the PPD rose, as the blue line indicates. In contrast, the red line varied smoothly, since the blind regulated the variation in thermal energy loss or heat gain, while the fully covered window strengthened the storage capability of the room. As Figure 9 and Figure 10 indicate, only in the combined blinding and HVAC system could the indicators of PMV and PPD reach the comfort requirement. The operation with heating only breached the comfort limits of both the PMV and PPD, as Figure 9 and Figure 10 show, while the operation with heating and cooling breached the PMV limit, as Figure 9 shows.

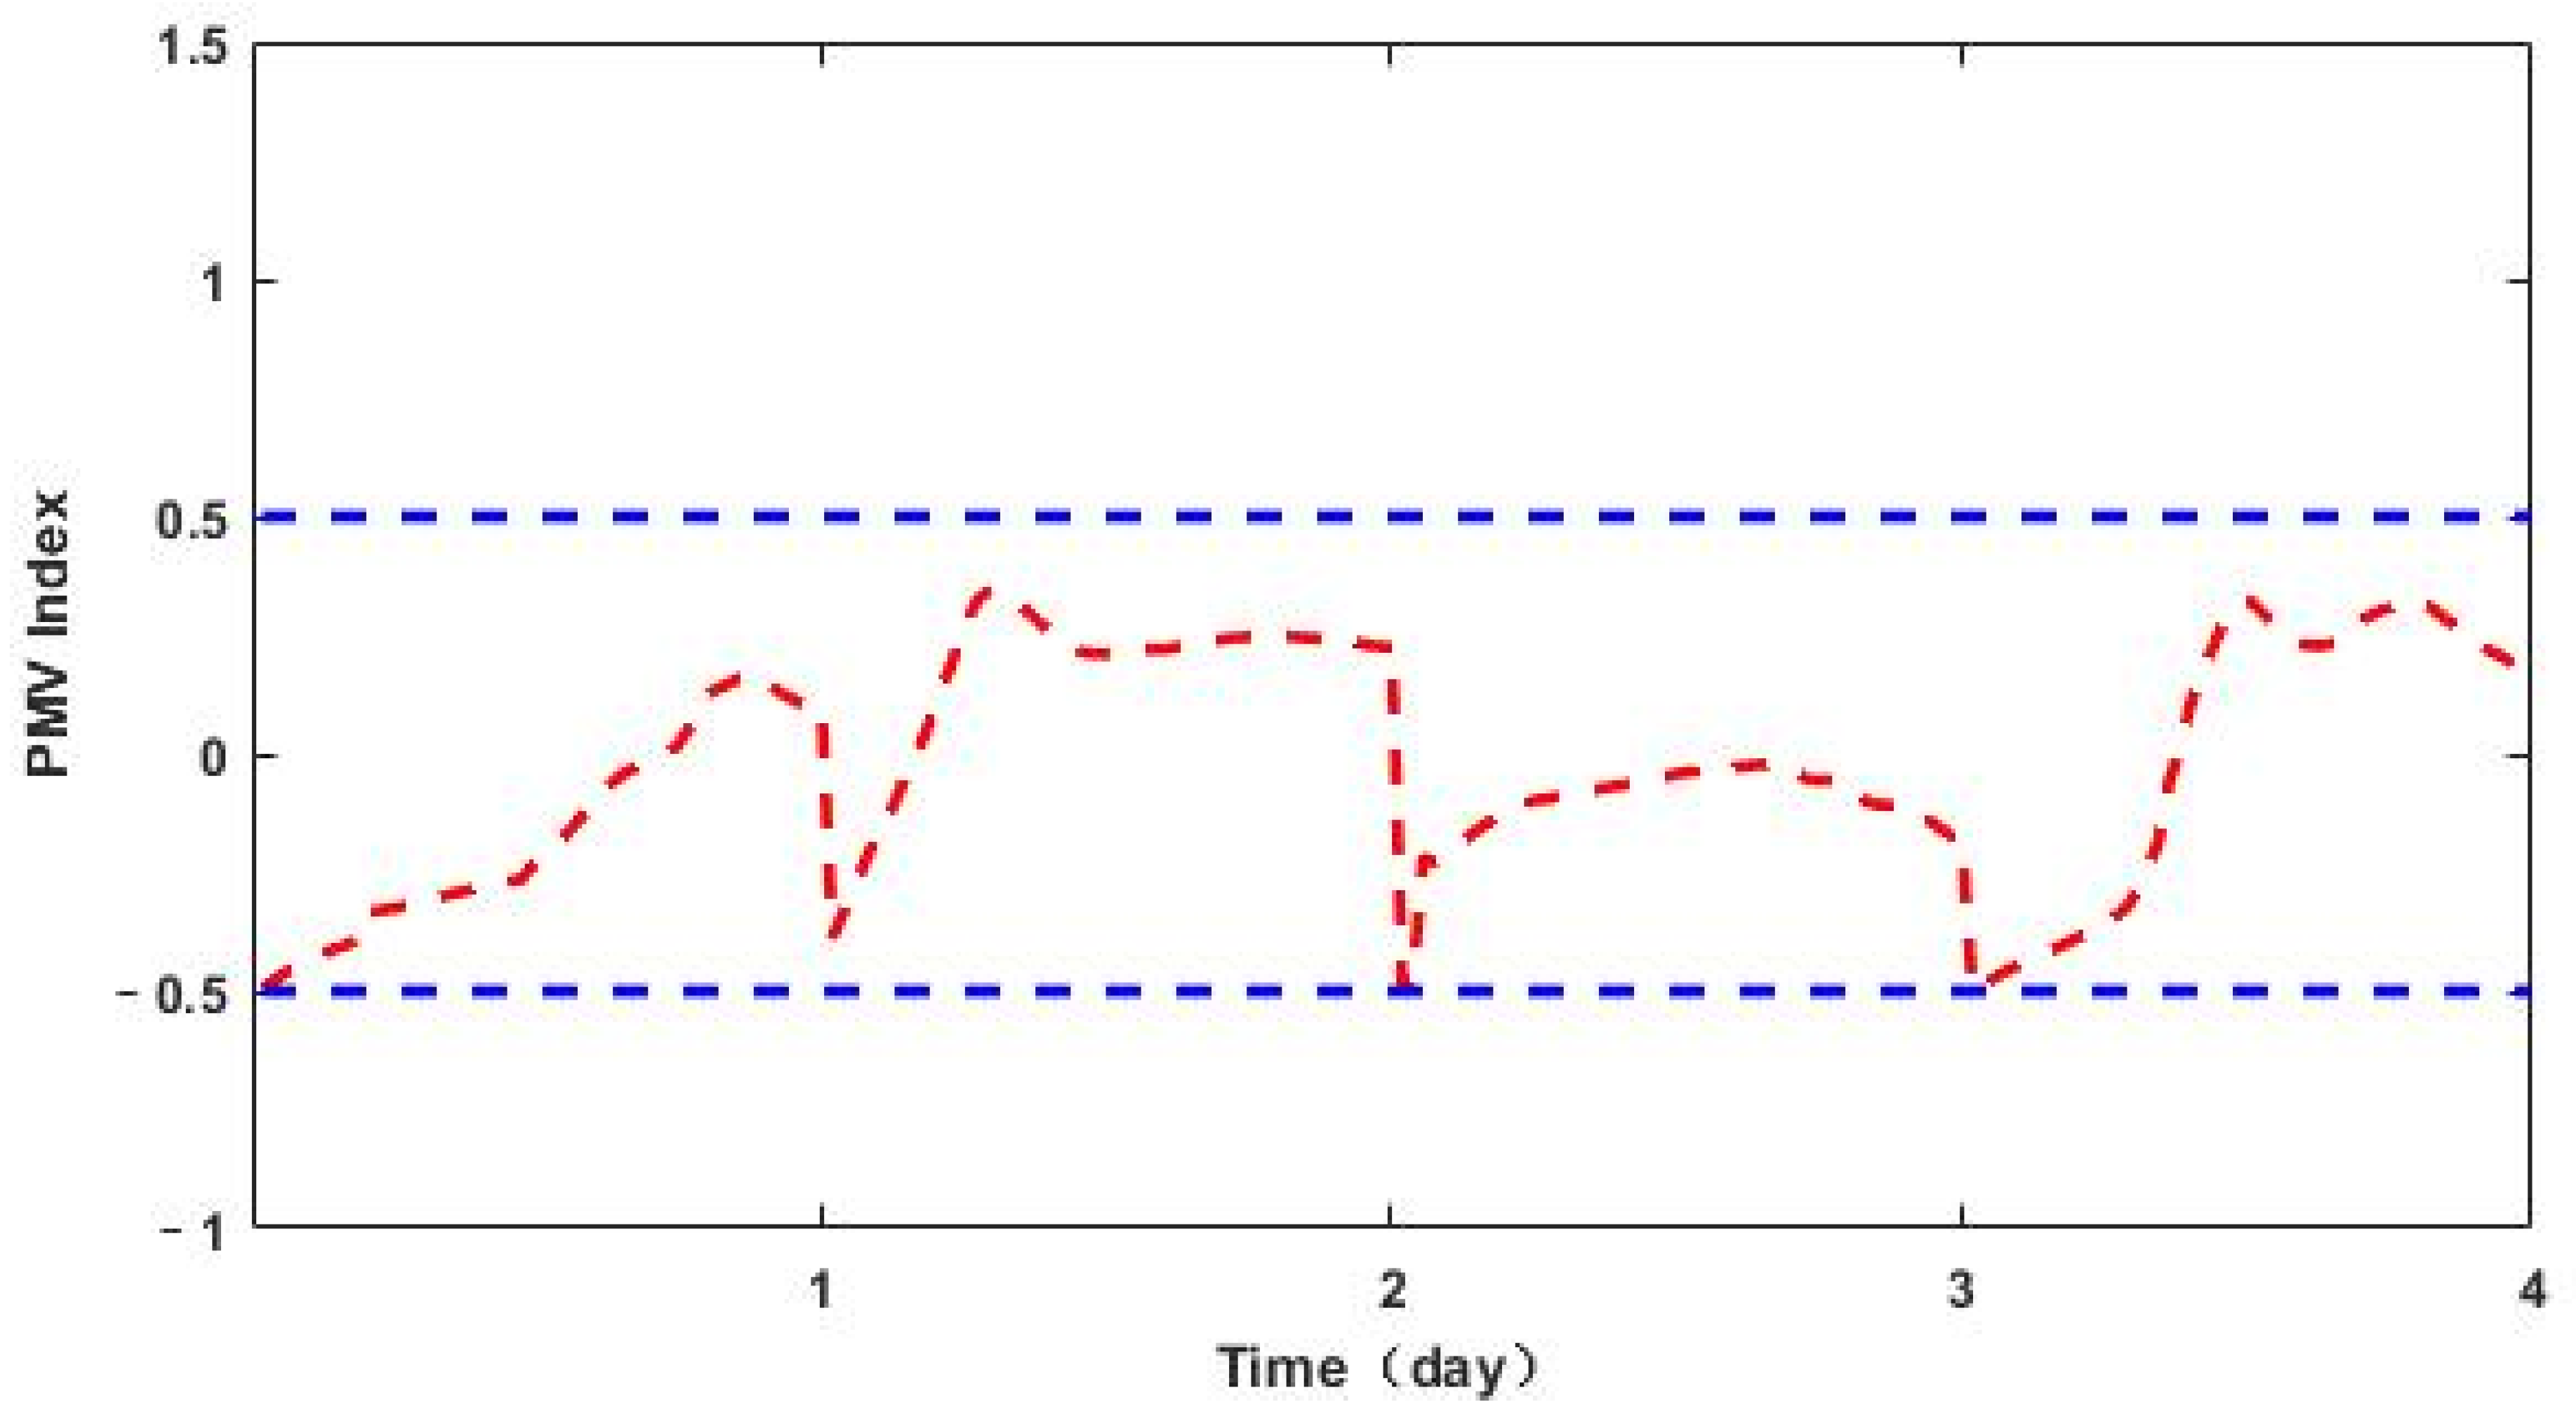
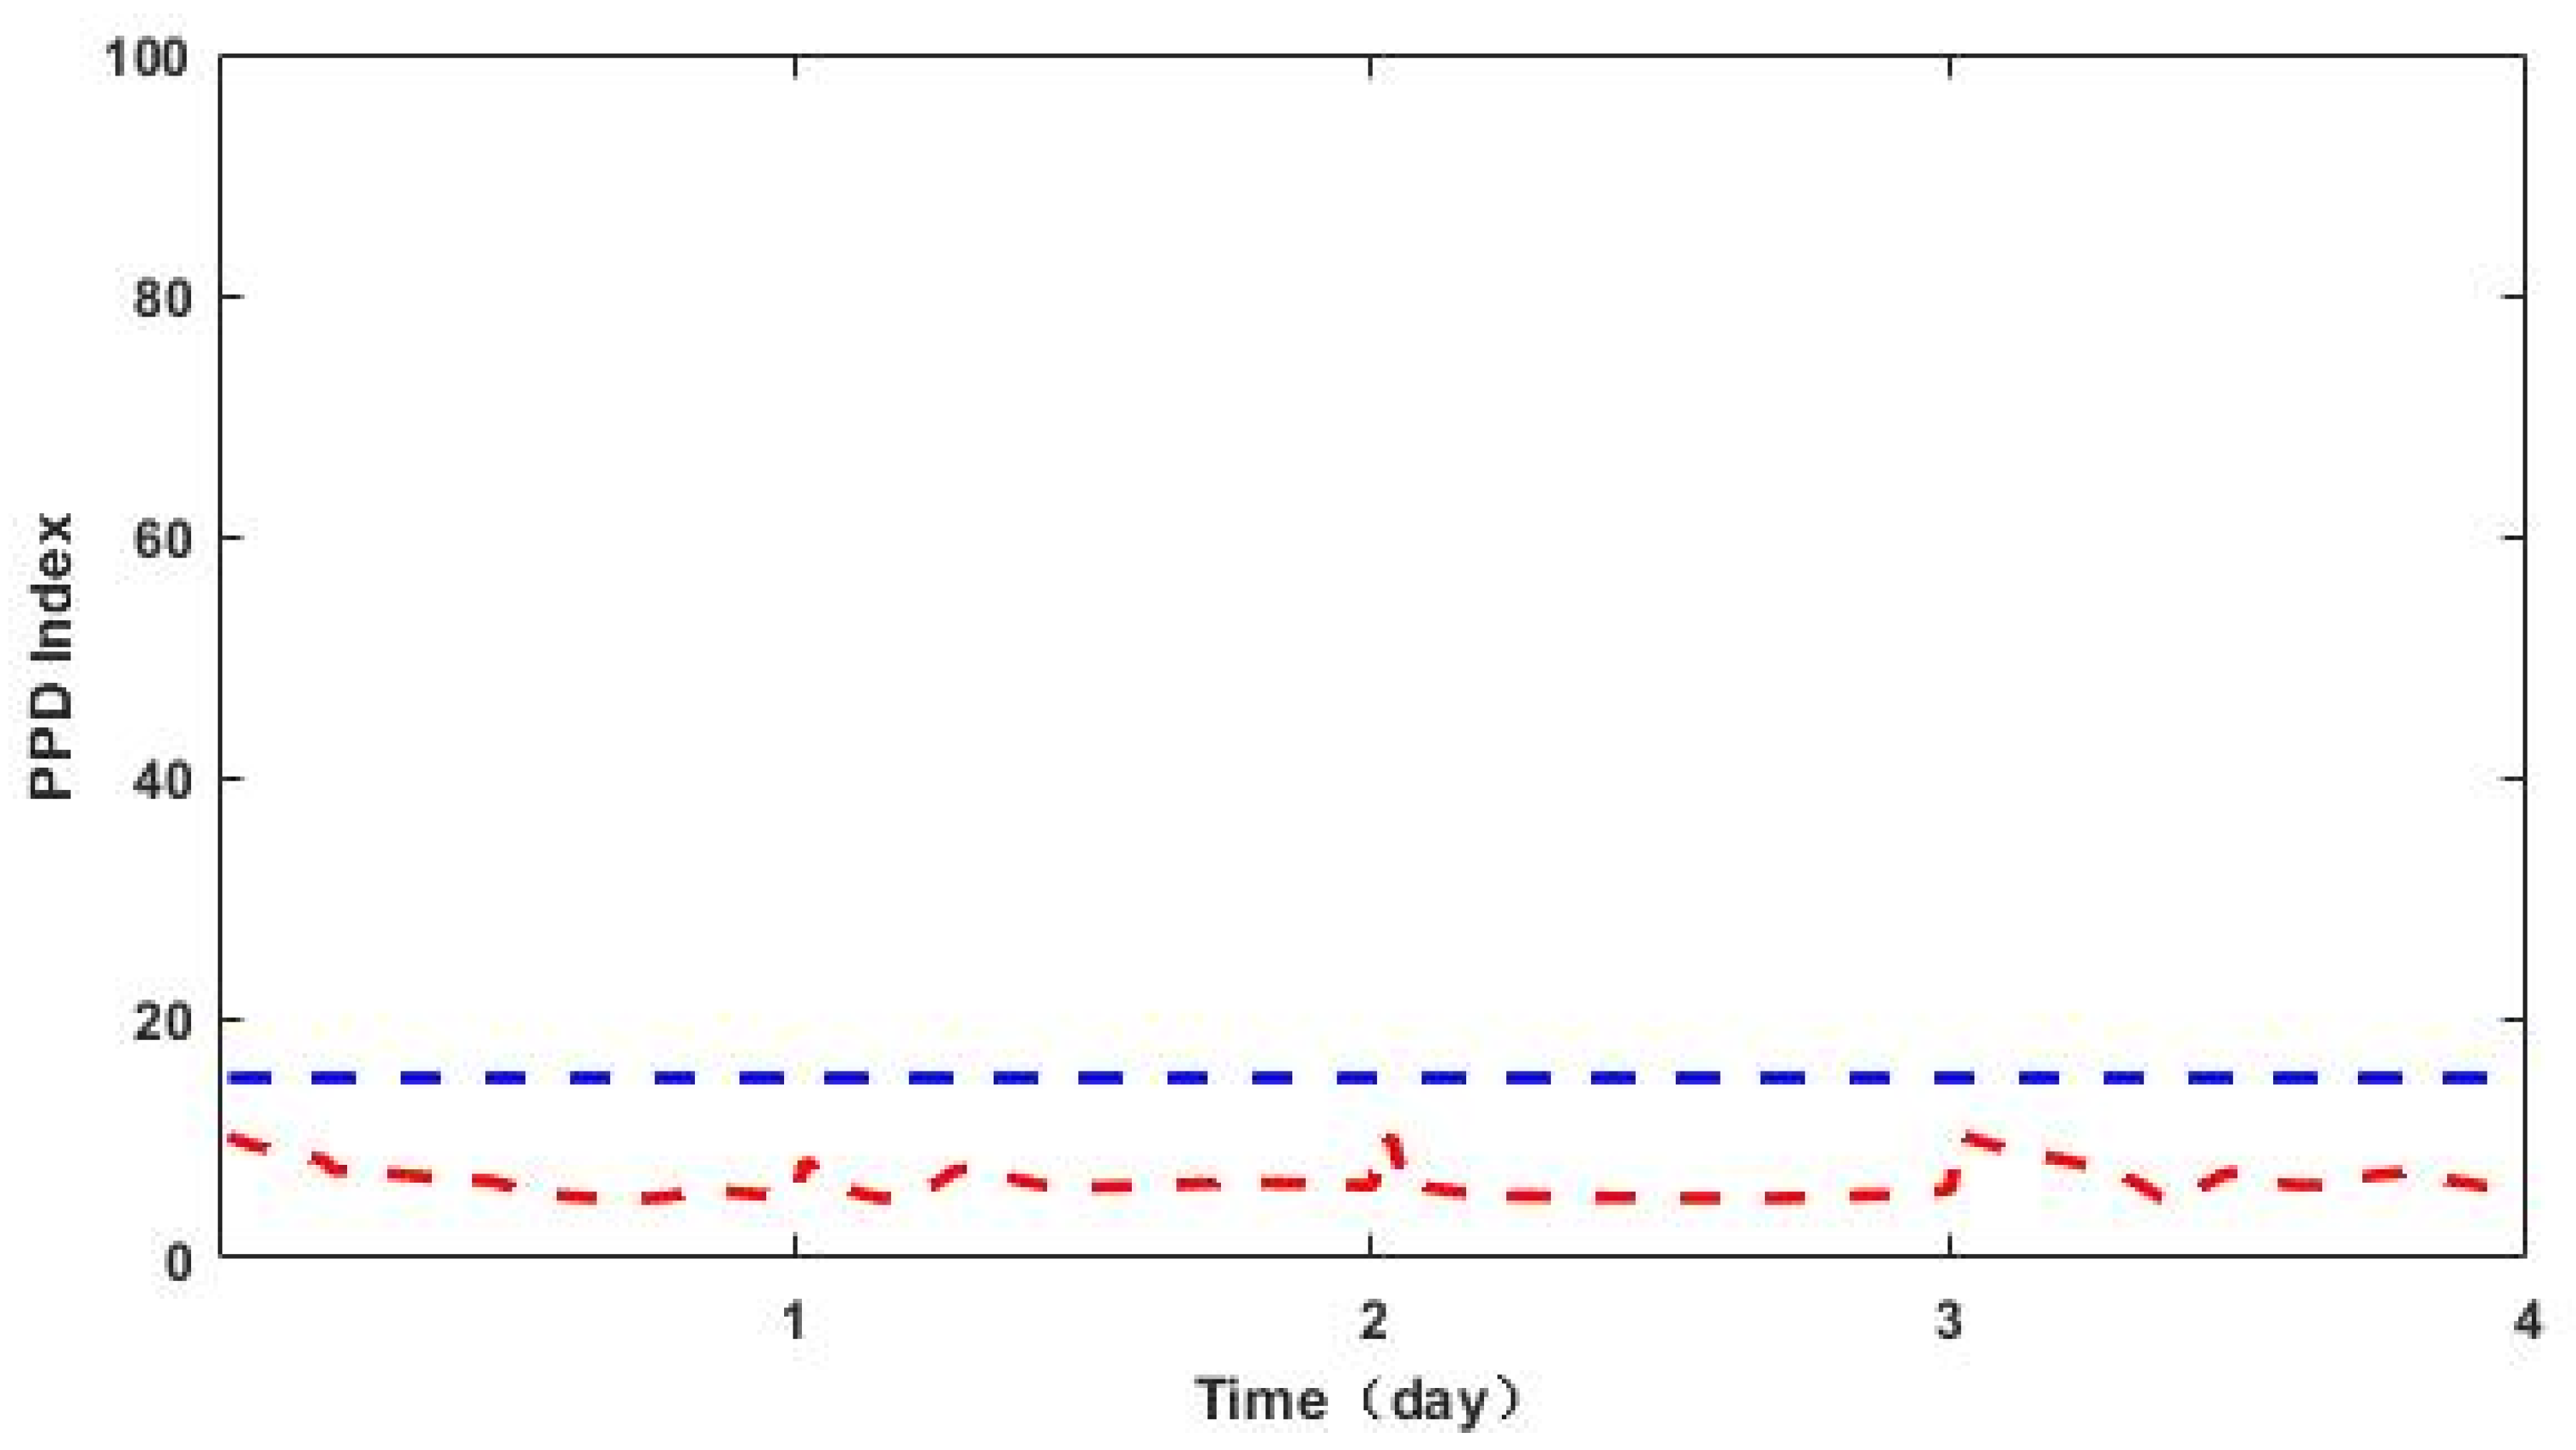
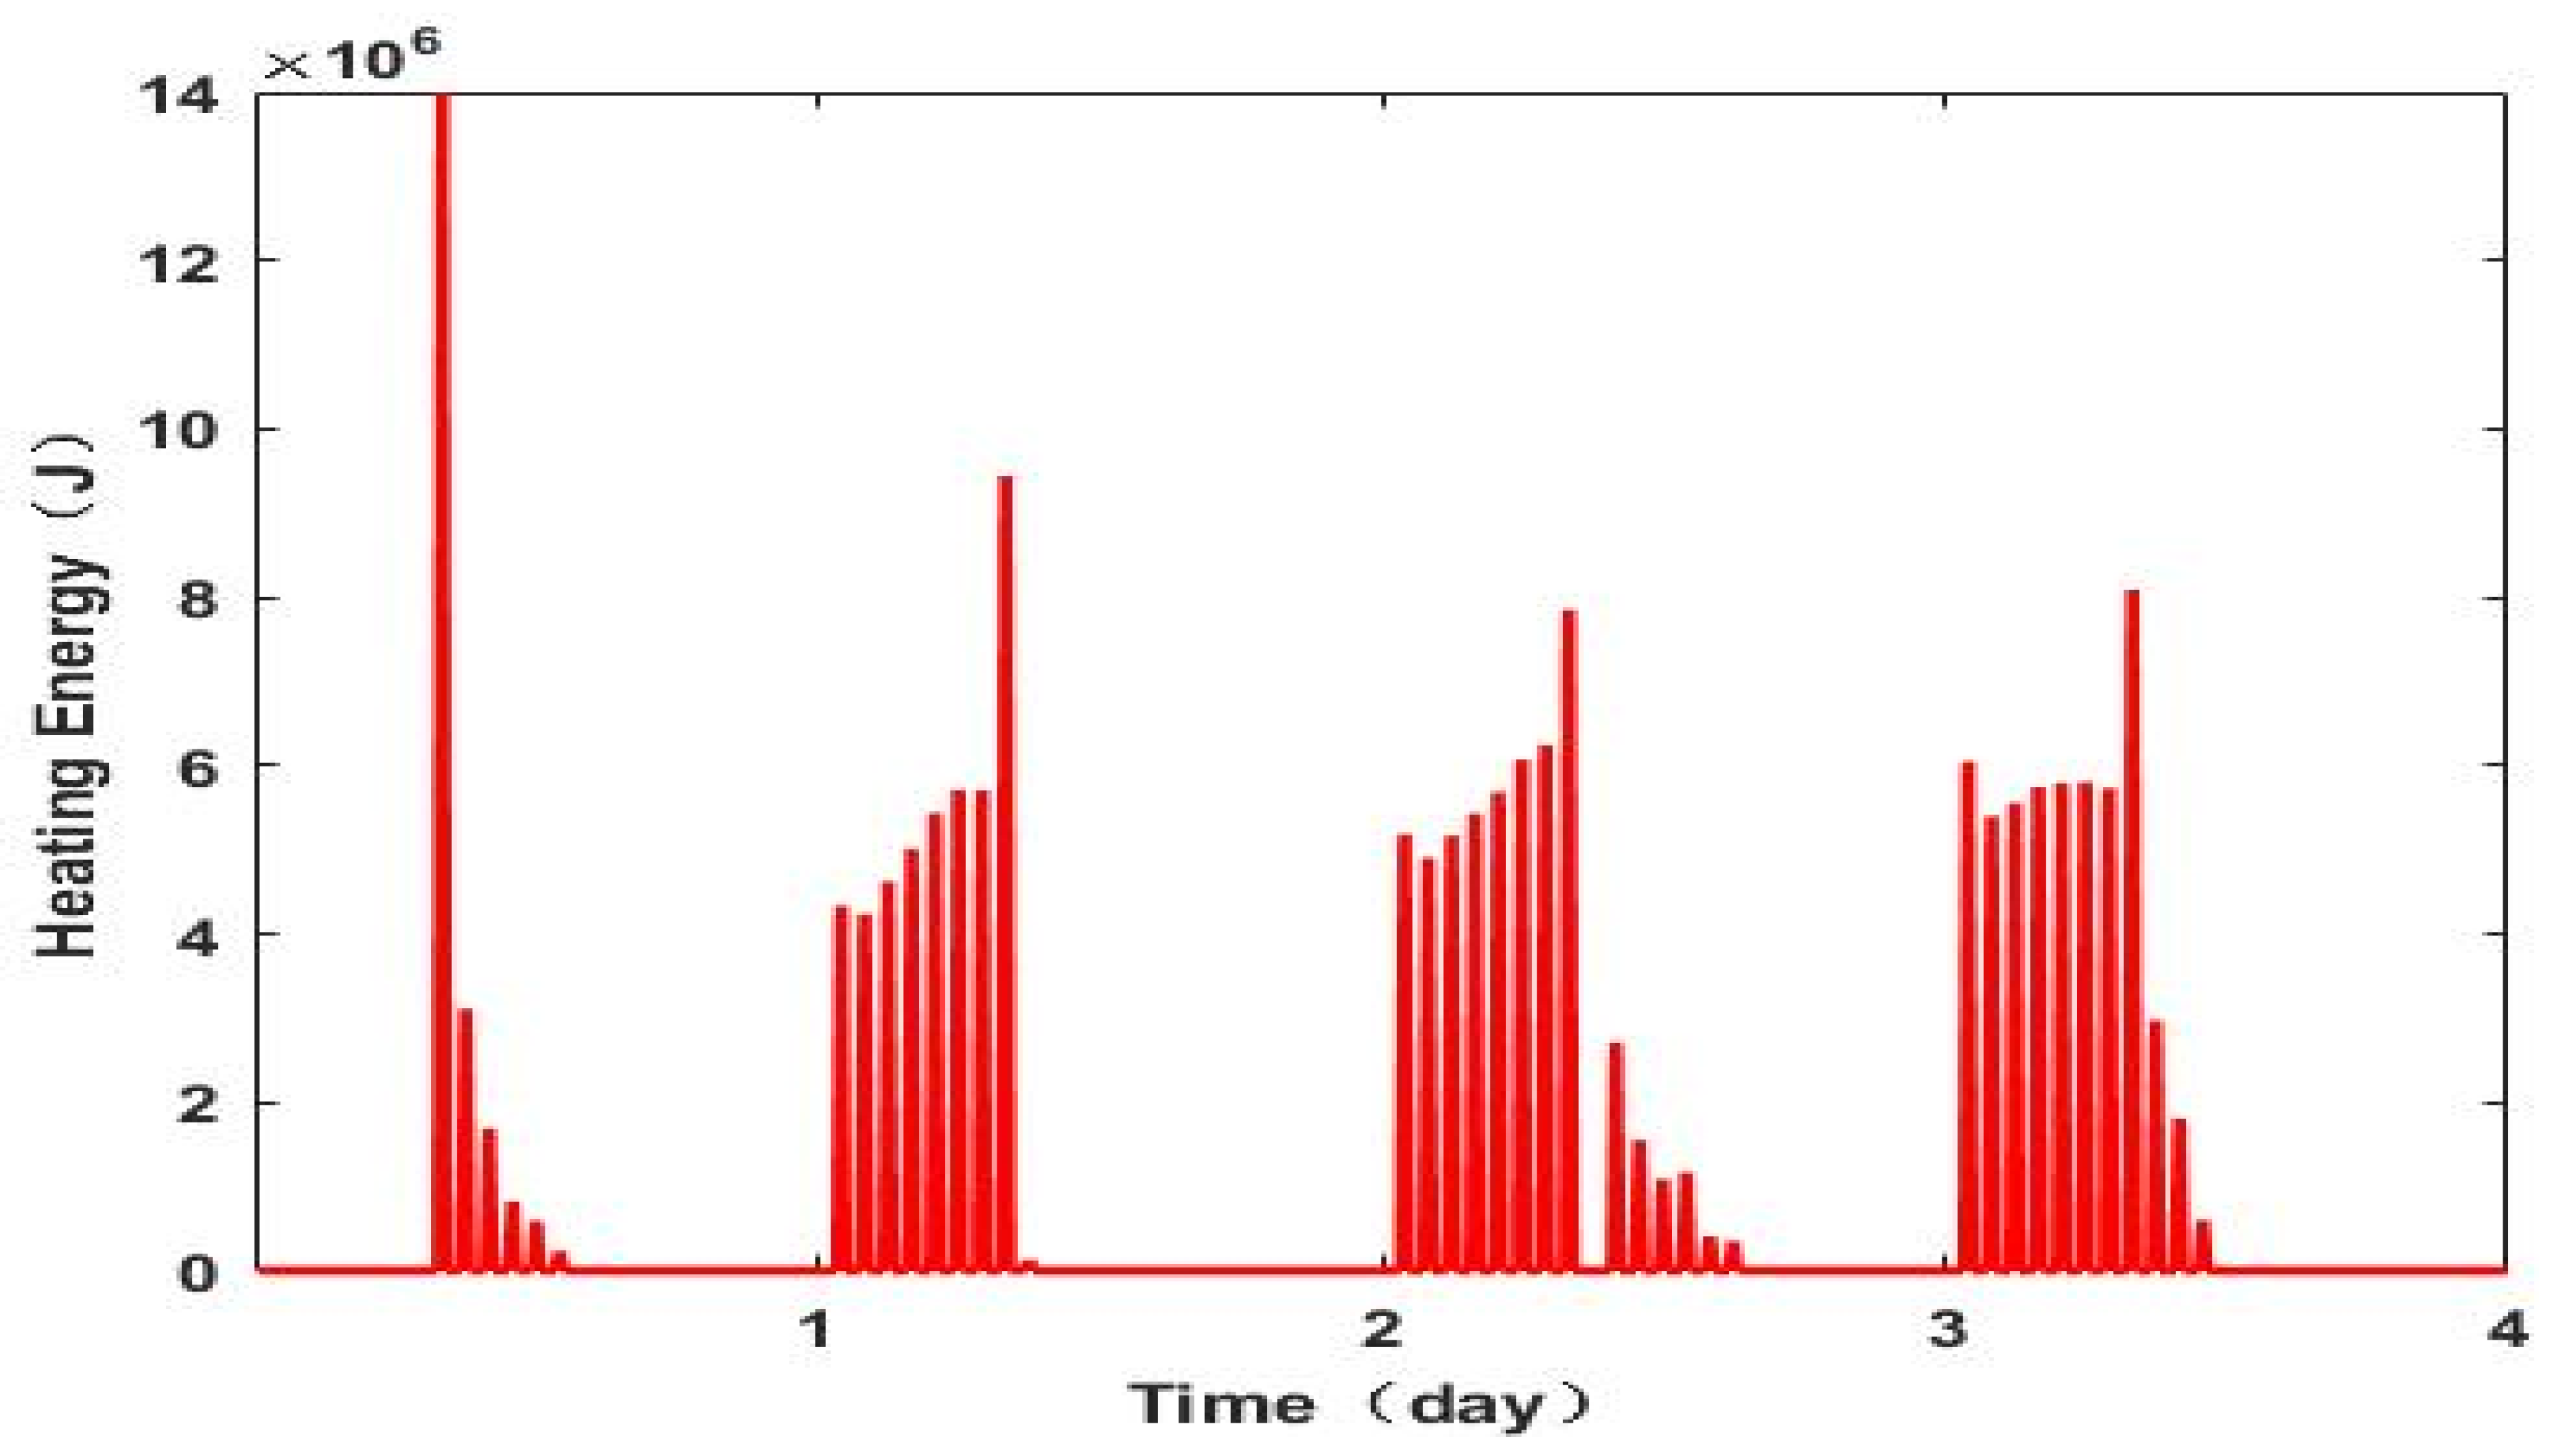
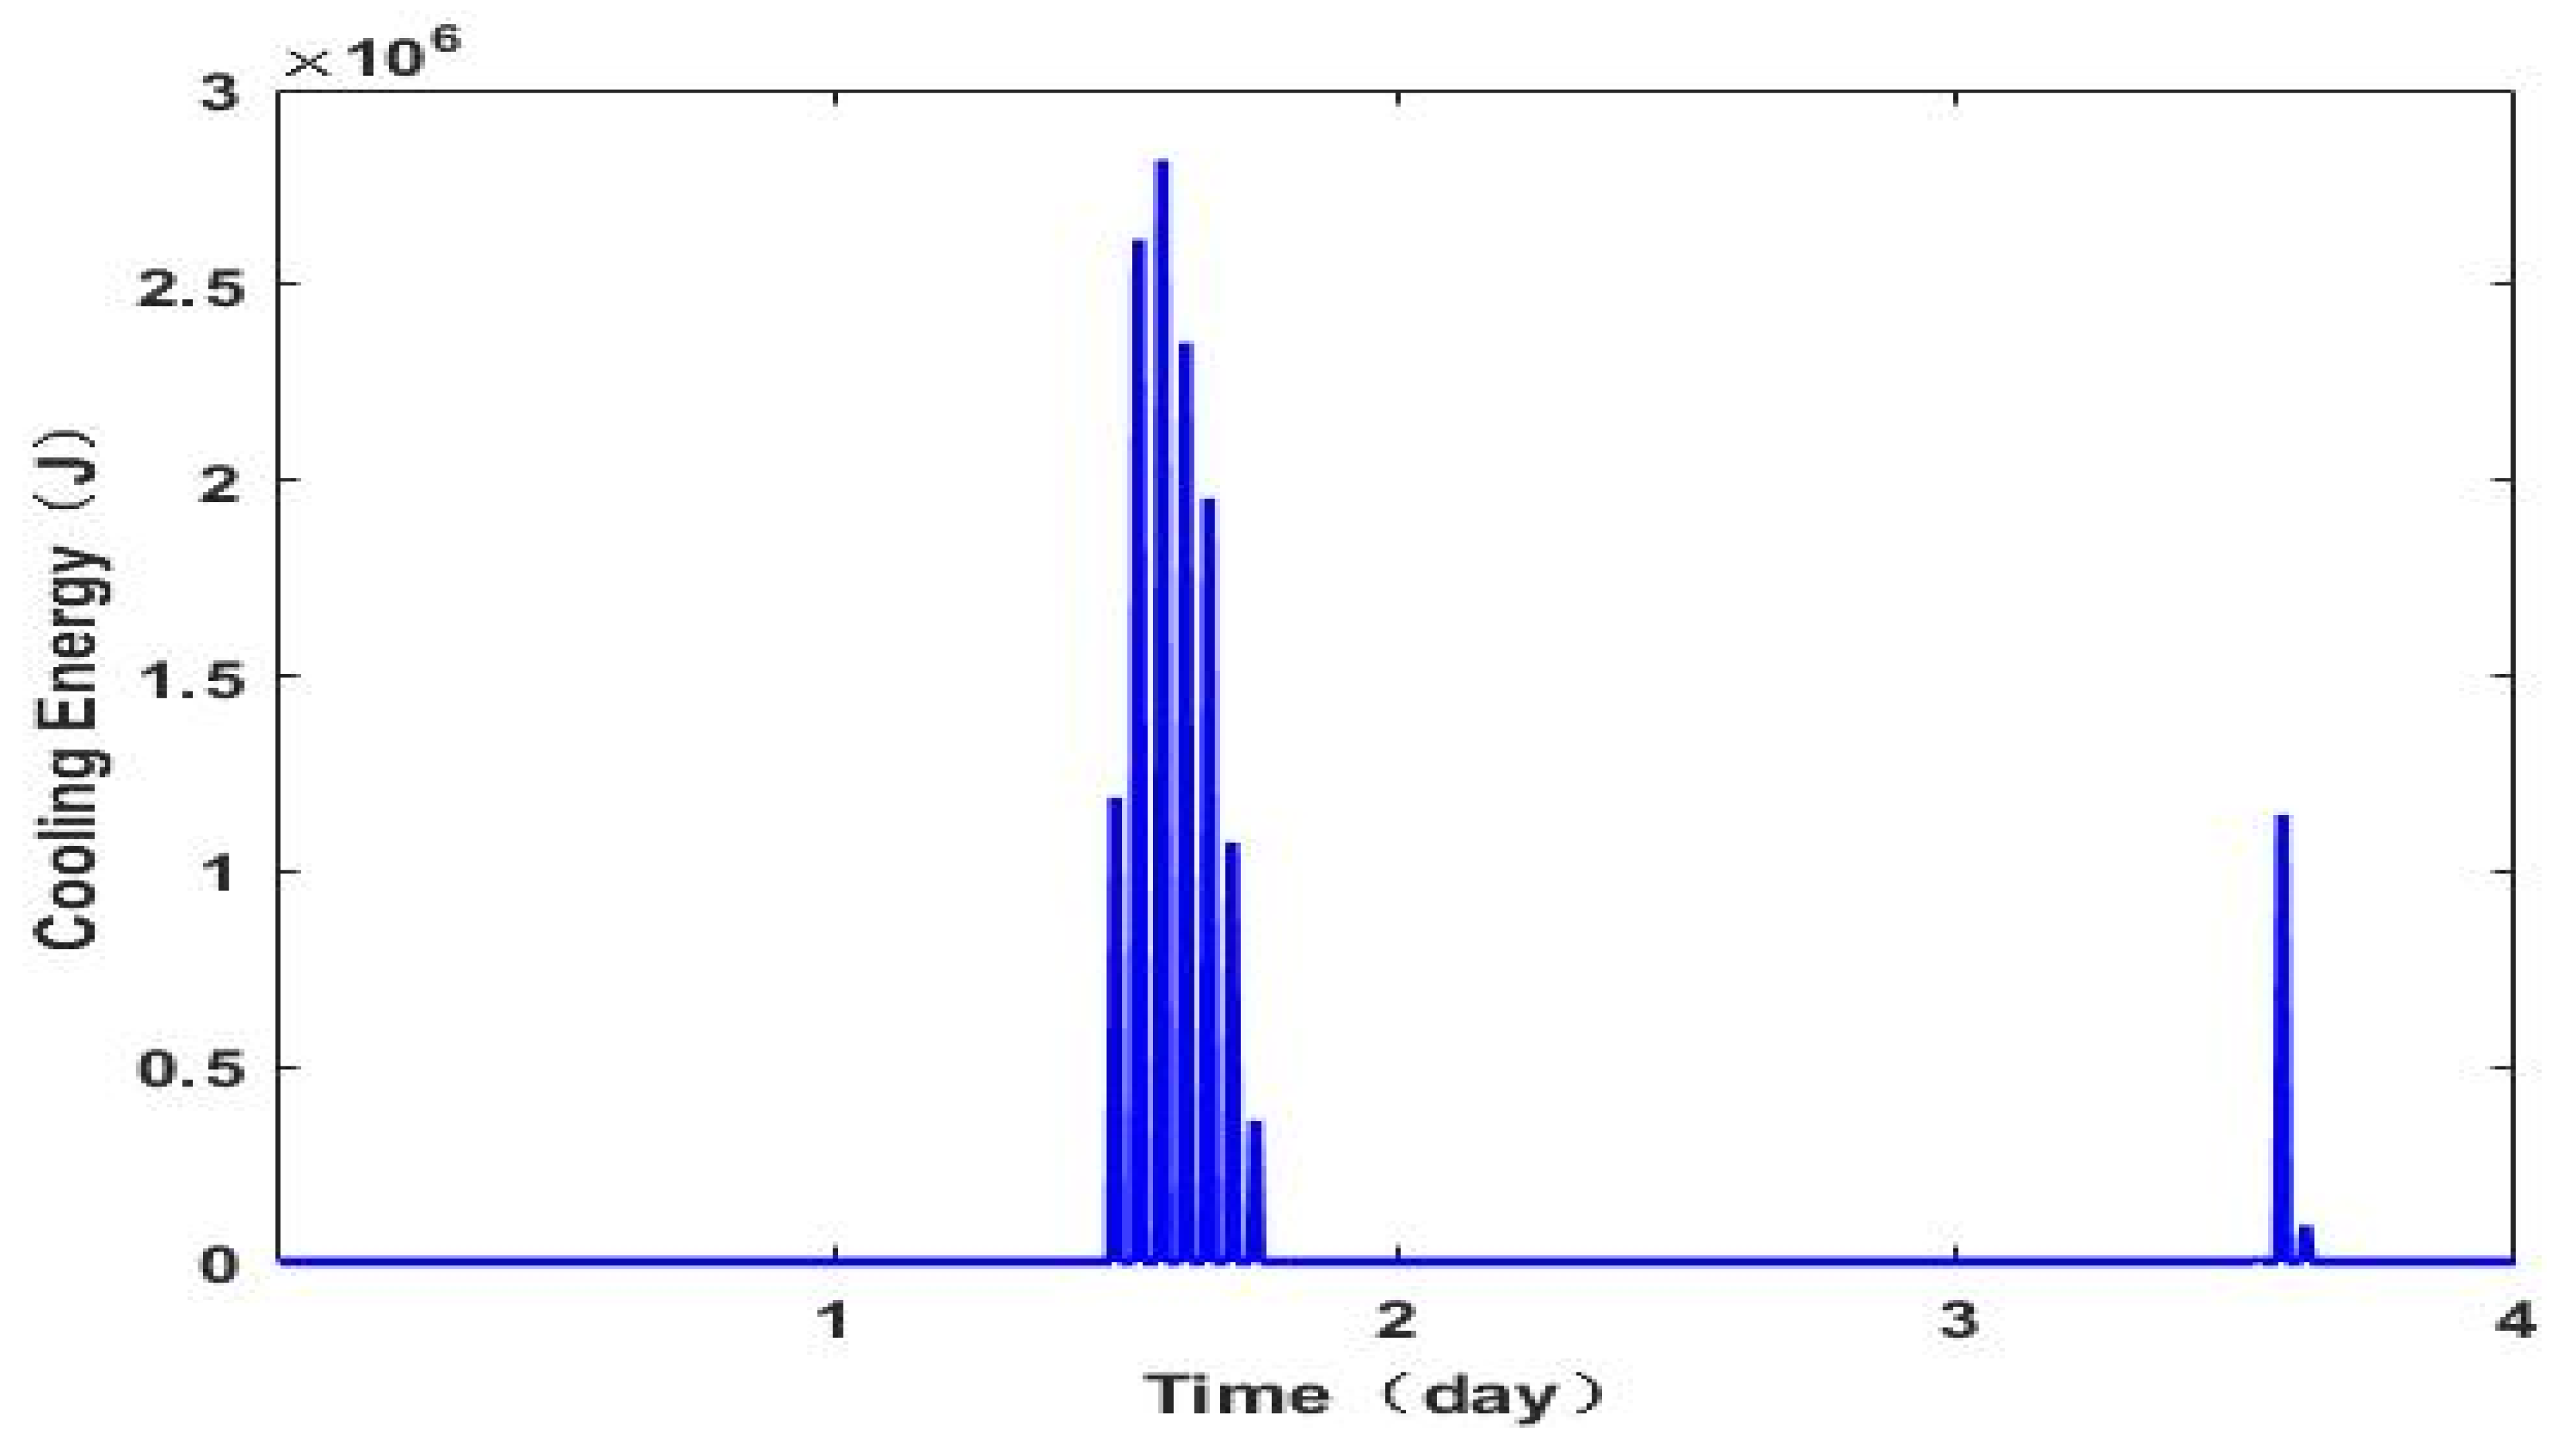
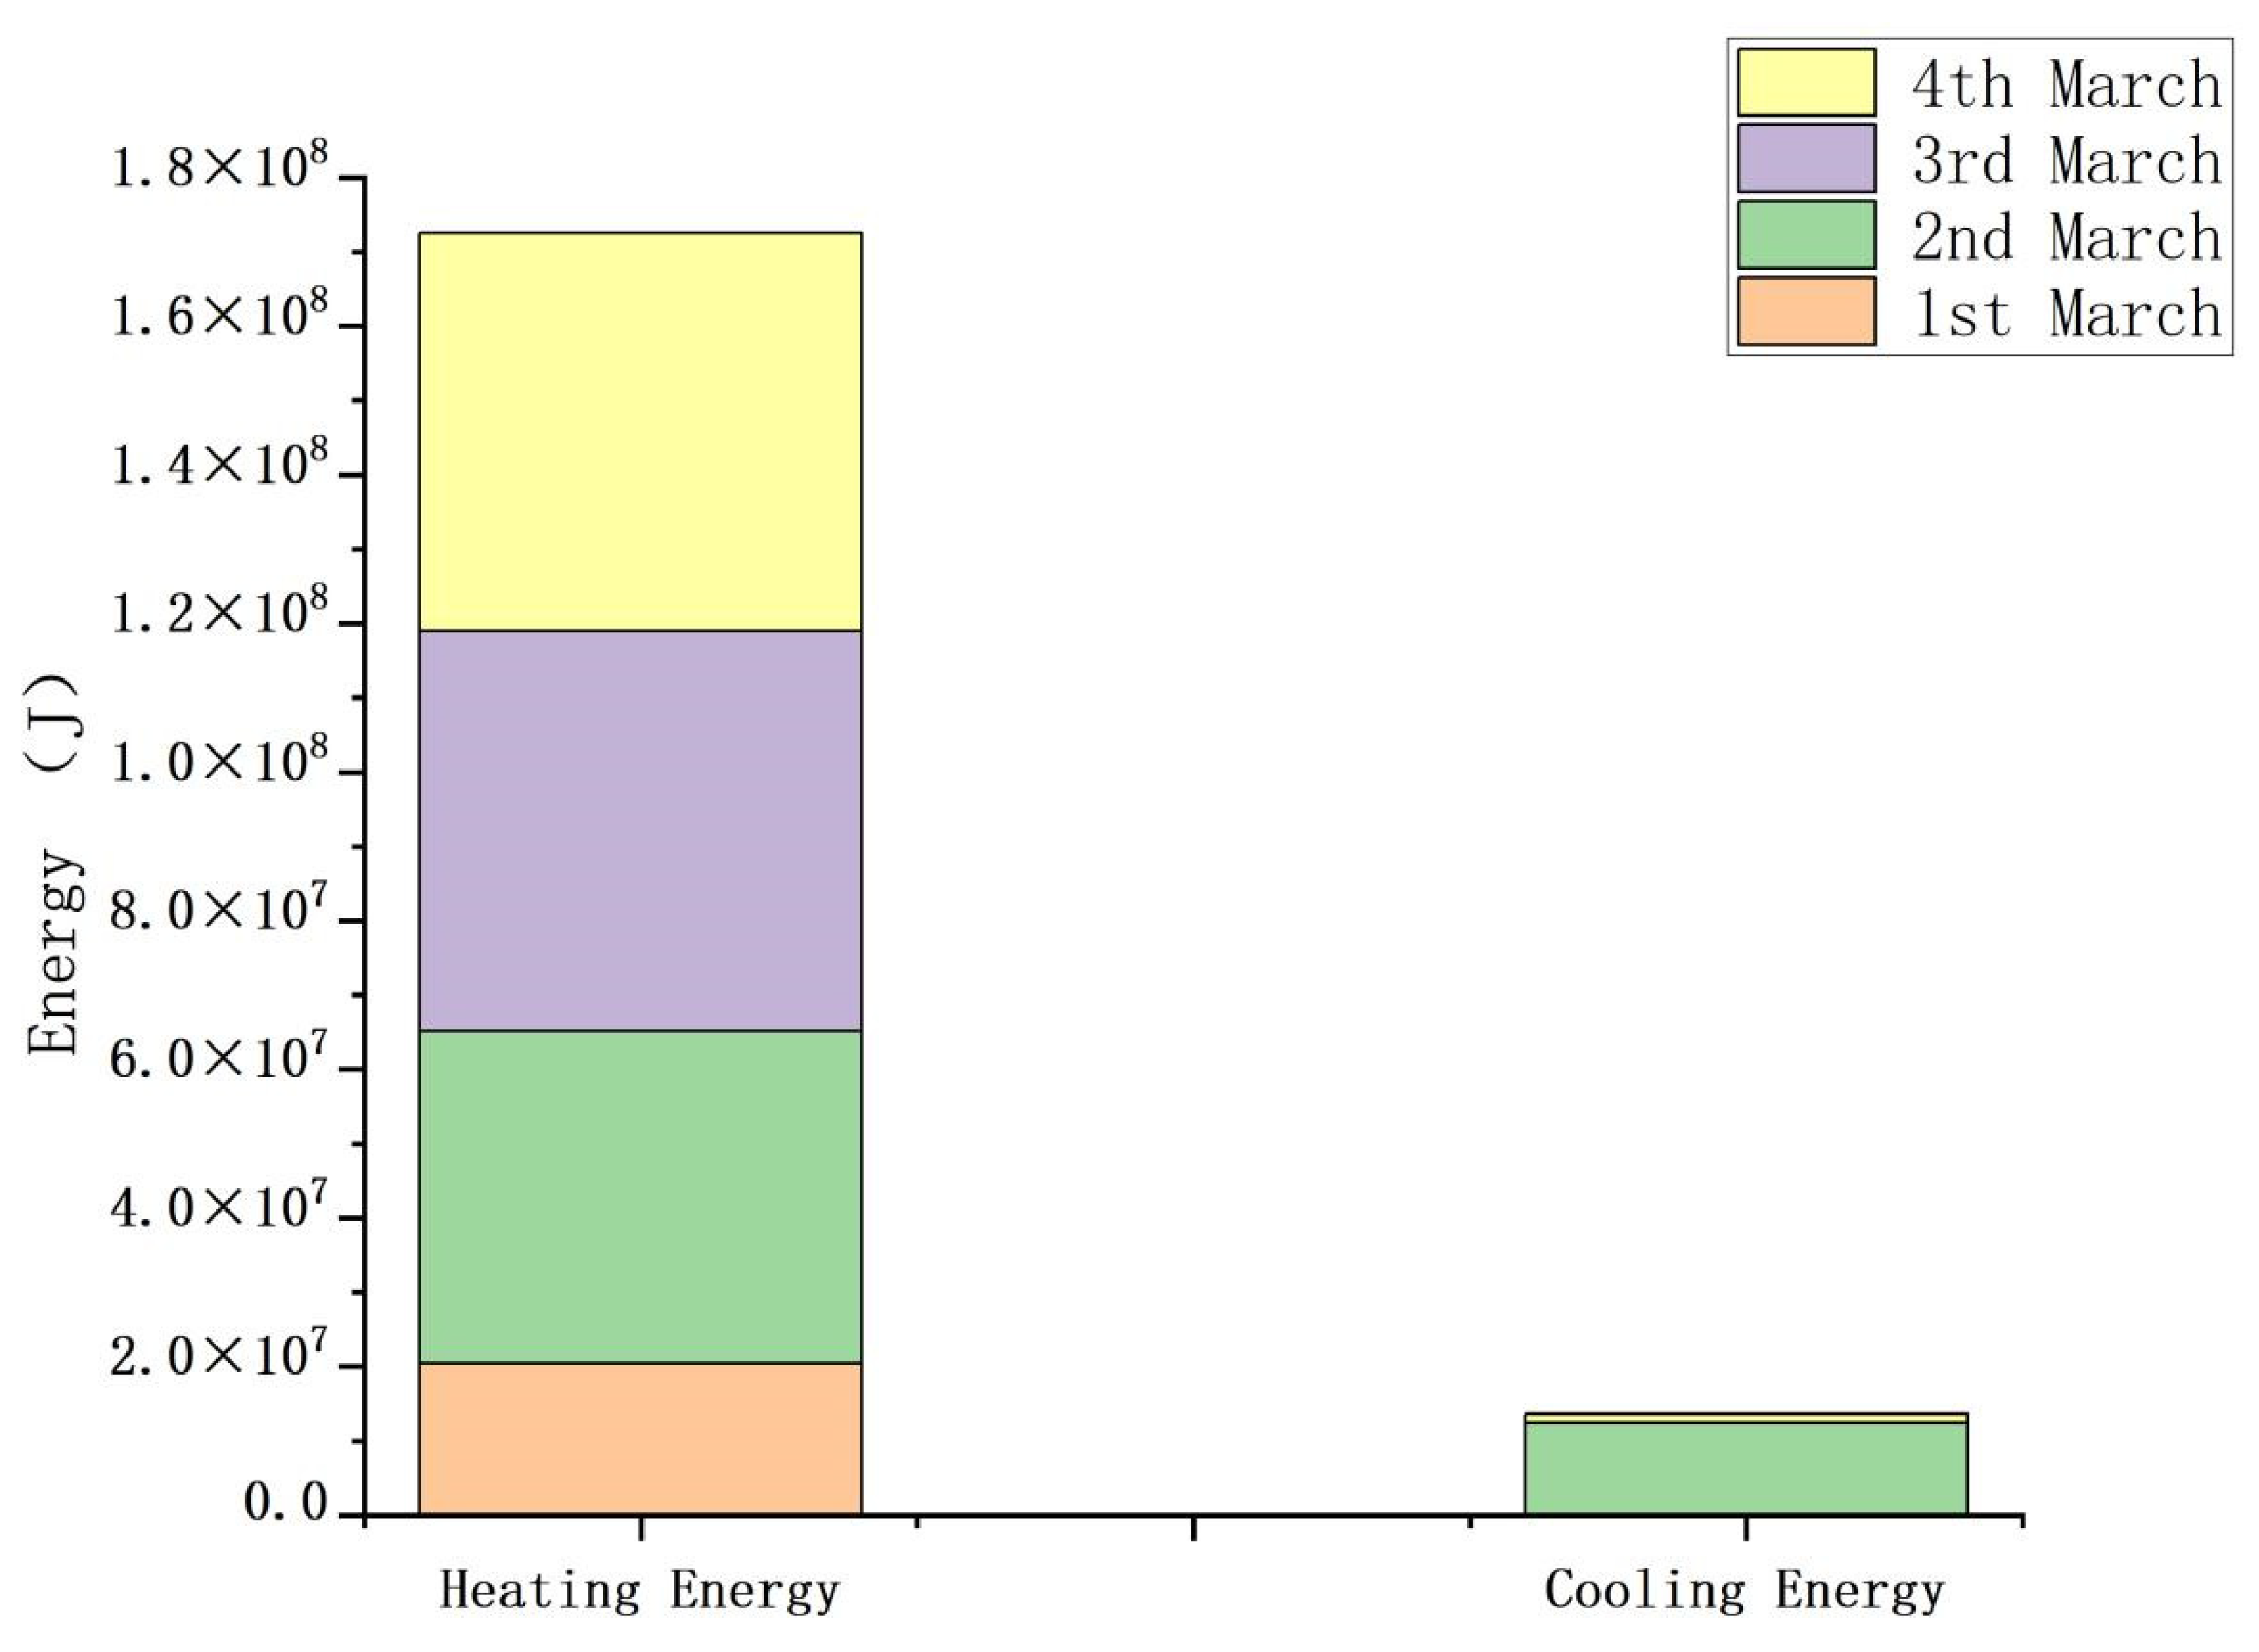
4.6. Test Results under the Optimal Operation Conditions

The performance of indoor temperature vs. blind operation are shown in Figure 11. PMV, PPD, and energy consumption for heating and for cooling are shown in Figure 12, Figure 13, Figure 14 and Figure 15, respectively. Figure 16 shows the accumulative energy consumption for the four days. Figure 11 gives two waveforms for the indoor temperature (red) and the blind-shading schemes (blue). The operational signals were multiplied by 5 to accommodate the plot area, as the blue line shows. Thus, the values of 0, 5, 10 in the blue line represent the operation of the blind with the window uncovered, half-covered, and fully covered. During the nighttime, the window was fully covered to keep the room warm, as Case 1 shows. The blind also fully covered the window when the indoor temperature rose and the solar radiation was strong, as Case 2 shows. In this case, most sun glazing was blocked to prevent the room from overheating. When the temperature reached a certain level, the blind kept the window half-covered to slow the indoor temperature variation, as Case 3 shows. To boost the indoor temperature, the window was generally uncovered while receiving the highest amount of solar irradiation, as Case 4 shows.
As shown in Figure 11, the temperature remained within the range of 12 °C to 25 °C, which allowed the PMV to vary within the comfort range between −0.5 to 0.5, as Figure 12 indicates. The PPD given in Figure 13 showed a small dissatisfaction under the optimal operation, in which the blind control incorporated with heating and cooling was used. It realized a dissatisfaction lower than 15% during the test. Figure 14 demonstrates energy consumption for heating the room. Each single day showed similarities. Heating was turned on during a low outdoor temperature or weak solar irradiation. On each single day, the first half of the day required more energy than the other half, since the room was required to be warmed up during the first half of the day when the room was occupied. After the temperature rose, both solar irradiation and strengthened thermal storage due to the covered window maintained the temperature. Therefore, less energy was requested. Cooling was occasionally needed as both the solar irradiation and outdoor temperature rose, which led to the indoor temperature rising quickly or overheating.
Table 7 summarizes the values of the key indicators of the performance. S1, S2, and S3 represent the operational strategies with heating, heating and cooling, and heating and cooling and blind shading, respectively. In operation S3, the comfort requirement was satisfied, with energy consumption of 31.70 kWh of electricity for heating and cooling. S3 saved 30.6% of energy overall, while 59.2% of cooling was saved compared to S2. S2 consumed more energy, 45.71 kWh of electricity, compared to the other counterpart strategies. However, operation S2 occasionally breached the limit of the PMV line shown in Figure 9, which meant S2 could not satisfy the comfort requirements during the entire process. The least energy was consumed by S1. However, the comfort satisfaction with the PMV index was broken under S1, as the black dotted line in Figure 9 shows. The maximum value of the black dotted line was close to 1.5, which meant extreme discomfort in this situation. This was due to both the high outdoor temperature and the strong glazing over Day 2, as shown in Figure 4 and Figure 5. The PPD index shown in Figure 10 worsened during Day 2 if S1 was used. Therefore, only S3 could meet the demand of both energy saving and comfort satisfaction. S3 was the optimum scheme for operation.
Figure 13 illustrates the variation in the PPD index under S3 operation. As can been seen, the PPD index varied within the limit, which meant comfort requirements were satisfied. Figure 14 and Figure 15 demonstrate the heating and cooling consumption, respectively, under operation S3. Heating displayed similarity over the four days. The first half of the day showed the highest consumption of heating energy during Day 1 operation due to a low ambient temperature and weak irradiation. Heating was also requested during the second half of the day on Day 3 when both temperature and solar irradiation were weak, as Figure 5 and Figure 6 show. Cooling was occasionally needed, as shown in Figure 15, when the ambient temperature was high with strong irradiation during some periods on Days 2 and 4, as Figure 5 and Figure 6 show. Figure 16 gives the accumulative energy consumption for these four days. Day 1 required the least amount of energy for heating, while no cooling was needed during the day. In contrast, Day 2 showed the highest consumption, since both heating and cooling were needed.

5. Conclusions

This paper proposed an innovative strategy for energy management in buildings while simultaneously realizing both energy savings and occupant comfort. The study began by analyzing the influential factors on the indoor temperature, including building materials, structure, outdoor temperature, wind speed, building orientation, solar irradiation, etc. A mathematical model of a building was constructed on the ENERGYPLUS platform. A controller for blind shading was defined using the BCVTB. The purpose of the study was to use solar energy in a flexible way when indoor and outdoor conditions changed. For testing the effectiveness of the optimal scheme proposed, the study compared three strategies: heating-only operation; heating and cooling operation; and heating, cooling, and blinding operation. The optimal method was to the combination of heating, cooling, and blind shading to keep the zone temperature within the comfort range. The test results showed that the optimal strategy saved more than half of the cooling energy and 30.6% of the overall energy compared to the counterpart strategy without blinding. Heating-only operation consumed the least energy, but it could not meet the occupant comfort requirements, as it breached the PPD limit three times. Therefore, the results verified the effectiveness of the proposed strategy to reach the joint target of both energy savings and occupant comfort. This will encourage the acceptance of the concept of low-/zero-energy buildings in which energy conservation is realized without compromising occupant comfort.

Author Contributions

Conceptualization, X.C. and Y.C.; methodology, X.X. and Y.Z.; software, X.C. and A.Y.; data curation, X.C. and A.Y.; writing—original draft preparation, X.C. and Y.C.; writing—review and editing, X.C. and Y.C.; investigation, Y.C. and X.X.; visualization, X.X. and Y.Z.; supervision, Y.C. and X.X.; resource, Y.C., Y.Z. and Y.C; validation, X.C. and A.Y.; funding acquisition, Y.C., Y.Z. and X.X. All authors have read and agreed to the published version of the manuscript.

Funding

This study is supported by National Natural Science Foundation of China (grant number: 51867007) and Technology Project of Southern Power Grid Corporation of China for the purpose of power supply quality improvement and energy saving for village power grid under load fluctuation.

Data Availability Statement

Data are contained within the article.

Conflicts of Interest

The authors declare no conflict of interest.

Appendix A

Table A1. Parameters for PMV calculation.
Date/TimeSolar Radiation Rate per Area (W/m2) (Hourly)Zone Air Temperature (°C) (Hourly)Zone Air Relative Humidity (%) (Hourly)Air Flow(m/s)Metabolism RateClothing Insulation
03/01 01:00:00012.921000.1371.21
03/01 02:00:00012.371000.1371.21
03/01 03:00:00012.051000.1371.21
03/01 04:00:00011.801000.1371.21
03/01 05:00:00011.521000.1371.21
03/01 06:00:00011.261000.1371.21
03/01 07:00:004.7911.1199.990.1371.21
03/01 08:00:0022.5821.1081.360.1371.21
03/01 09:00:0054.6221.0096.170.1371.21
03/01 10:00:00131.1721.0099.950.1371.21
03/01 11:00:00146.6521.001000.1371.21
03/01 12:00:0097.0121.001000.1371.21
03/01 13:00:00100.88211000.1371.21
03/01 14:00:0098.1921.4299.990.1371.21
03/01 15:00:00137.3322.041000.1371.21
03/01 16:00:00128.9322.461000.1371.21
03/01 17:00:00171.0622.931000.1371.21
03/01 18:00:0029.5322.5699.960.1371.21
03/01 19:00:00016.481000.1371.21
03/01 20:00:00014.831000.1371.21
03/01 21:00:00014.341000.1371.21
03/01 22:00:00013.861000.1371.21
03/01 23:00:00013.331000.1371.21
03/01 24:00:00012.931000.1371.21
03/02 01:00:00016.0994.580.1371.21
03/02 02:00:000161000.1371.21
03/02 03:00:000161000.1371.21
03/02 04:00:000161000.1371.21
03/02 05:00:000161000.1371.21
03/02 06:00:000161000.1371.21
03/02 07:00:0032.57161000.1371.21
03/02 08:00:00207.4121.0389.530.1371.21
03/02 09:00:00401.7721.0998.580.1371.21
03/02 10:00:00543.2721.8299.420.1371.21
03/02 11:00:00634.1823.2898.830.1371.21
03/02 12:00:00712.2624.0090900.1371.21
03/02 13:00:00699.282463.660.1371.21
03/02 14:00:00492.562455.760.1371.21
03/02 15:00:00293.712455.940.1371.21
03/02 16:00:00177.292456.800.1371.21
03/02 17:00:0072.022457.130.1371.21
03/02 18:00:0011.412456.490.1371.21
03/02 19:00:00017.9981.840.1371.21
03/02 20:00:00016.1591.560.1371.21
03/02 21:00:00015.4995.470.1371.21
03/02 22:00:00014.9498.790.1371.21
03/02 23:00:00014.491000.1371.21
03/02 24:00:00014.031000.1371.21
03/03 01:00:00017.5992.640.1371.21
03/03 02:00:00017.51000.1371.21
03/03 03:00:00017.51000.1371.21
03/03 04:00:00017.51000.1371.21
03/03 05:00:00017.51000.1371.21
03/03 06:00:00017.51000.1371.21
03/03 07:00:006.9117.51000.1371.21
03/03 08:00:0046.7221.0291.450.1371.21
03/03 09:00:00163.862198.820.1371.21
03/03 10:00:00159.44211000.1371.21
03/03 11:00:00206.6121.131000.1371.21
03/03 12:00:00164.5021.331000.1371.21
03/03 13:00:00132.8921.241000.1371.21
03/03 14:00:00138.9121.6599.990.1371.21
03/03 15:00:00108.3921.701000.1371.21
03/03 16:00:0075.8621.671000.1371.21
03/03 17:00:0036.1521.371000.1371.21
03/03 18:00:007.3621.021000.1371.21
03/03 19:00:00015.021000.1371.21
03/03 20:00:00013.461000.1371.21
03/03 21:00:00012.881000.1371.21
03/03 22:00:00012.441000.1371.21
03/03 23:00:00012.121000.1371.21
03/03 24:00:00011.761000.1371.21
03/04 01:00:00016.1093.900.1371.21
03/04 02:00:000161000.1371.21
03/04 03:00:000161000.1371.21
03/04 04:00:000161000.1371.21
03/04 05:00:000161000.1371.21
03/04 06:00:000161000.1371.21
03/04 07:00:005.93161000.1371.21
03/04 08:00:0025.3818.5391.980.1371.21
03/04 09:00:0055.592194.220.1371.21
03/04 10:00:0078.632199.450.1371.21
03/04 11:00:00102.17211000.1371.21
03/04 12:00:00202.1021.4099.980.1371.21
03/04 13:00:00568.3723.3193.830.1371.21
03/04 14:00:00601.2824.0083.430.1371.21
03/04 15:00:00194.5323.8780.990.1371.21
03/04 16:00:0084.0723.7591.860.1371.21
03/04 17:00:0029.6423.1799.840.1371.21
03/04 18:00:005.1322.671000.1371.21
03/04 19:00:00016.271000.1371.21
03/04 20:00:00014.301000.1371.21
03/04 21:00:00013.6899.990.1371.21
03/04 22:00:00013.061000.1371.21
03/04 23:00:00012.371000.1371.21
03/04 24:00:00011.801000.1371.21

References

  1. Department of Energy (DOE). EnergyPlus. Reference Book. 2016. Available online: http://www.energyplus.net/ (accessed on 30 January 2022).
  2. Li, D.; Zhang, T.H.; Ma, L.Y.; Zhang, X.; Li, Q.; Zhu, Y.J. Energy saving and glass optimization analysis of sunspace in rural houses in server cold regions. J. Therm. Sci. Technol. 2020, 19, 601–605. (In Chinese) [Google Scholar]
  3. Tang, W.J. The state of the art of building energy consumption in China. City Archit. 2010, 25, 86. (In Chinese) [Google Scholar]
  4. Chinese building energy saving association. 2019 building energy consumption report. Industry 2020, 7, 30–39. (In Chinese) [Google Scholar]
  5. da Guarda, E.L.; Domingos, R.M.A.; Jorge, S.H.M.; Durante, L.C.; Sanches, J.C.M.; Leão, M.; Callejas, I.J.A. The influence of climate change on renewable energy systems designed to achieve zero energy buildings in the present: A case study in the Brazilian Savannah. Sustain. Cities Soc. 2020, 52, 101843. [Google Scholar] [CrossRef]
  6. Zheng, H.F.; Liang, Y.H.; Fan, X.W.; Tian, G.J. Analysis of affecting factors of dynamic indoor thermal comfort. J. Therm. Sci. Technol. 2015, 14, 259–266. (In Chinese) [Google Scholar]
  7. Endo, N.; Shimoda, E.; Goshome, K.; Yamane, T.; Nozu, T.; Maeda, T. Construction and operation of hydrogen energy utilization system for a zero emission building. Int. J. Hydrogen Energy 2019, 44, 14596–14604. [Google Scholar] [CrossRef]
  8. Yousefi, M.; Hajizadeh, A.; Soltani, M.N.; Hredzak, B. Predictive Home Energy Management System with Photovoltaic Array, Heat Pump, and Plug-In Electric Vehicle. IEEE Trans. Ind. Inform. 2021, 17, 430–440. [Google Scholar] [CrossRef]
  9. Schnieders, J.; Eian, T.D.; Filippi, M. Design and realisation of the Passive House concept in different climate zones. Energy Effic. 2020, 8, 1561–1604. [Google Scholar] [CrossRef]
  10. Rodriguez, V.I.; Otaegi, J.; Oregi, X. Thermal Comfort in NZEB Collective Housing in Northern Spain. Sustainability 2020, 12, 9630. [Google Scholar] [CrossRef]
  11. Dewurtel, F.; Parisio, A.; Jones, C.N.; Gyalistras, D.; Gwerder, M.; Stauch, V.; Lehmann, B.; Morari, M. Use of model predictive control and weather forecasts for energy efficient building climate control. Energy Build. 2012, 45, 15–27. [Google Scholar] [CrossRef] [Green Version]
  12. Korkas, C.D.; Baldi, S.; Michailidis, I.; Kosmatopoulos, E.B. Occupancy-based demand response and thermal comfort optimization in microgrids with renewable energy sources and energy storage. Appl. Energy 2016, 163, 93–104. [Google Scholar] [CrossRef]
  13. Li, B.F. The Research o Climate-Active Design Strategy of Building Skin in Hot-Summer and Cold-Winter Zone. Ph.D. Thesis, Tsinghua University, Beijing, China, 2004. [Google Scholar]
  14. Abd-Ur-Rehman, H.M.; Al-Sulaiman, F.A.; Mehmood, A.; Shakir, S.; Umer, M. The potential of energy savings and the prospects of cleaner energy production by solar energy integration in the residential buildings of saudi arabia. J. Clean. Prod. 2018, 183, 1122–1130. [Google Scholar] [CrossRef]
  15. Ma, Y.; Li, Y.; Zhu, B. Analysis of the thermal properties of air-conditioning-type building materials. Sol. Energy 2012, 86, 2967–2974. [Google Scholar] [CrossRef]
  16. Maurer, C. Progress in building-integrated solar thermal systems. Sol. Energy 2017, 154, 158–186. [Google Scholar] [CrossRef]
  17. Coakley, D.; Raftery, P.; Keane, M. A review of methods to match building energy simulation models to measured data. Renew. Sustain. Energy Rev. 2014, 37, 123–141. [Google Scholar] [CrossRef] [Green Version]
  18. Wetter, M. Co-simulation of building energy and control systems with the building controls virtual test bed. J. Build. Perform. Simul. 2011, 4, 185–203. [Google Scholar] [CrossRef] [Green Version]
  19. Zhang, L. Data-driven building energy modeling with feature selection and active learning for data predictive control. Energy Build. 2021, 252, 111436. [Google Scholar] [CrossRef]
  20. Sun, Y.; Luo, X.; Liu, X. Optimization of a university timetable considering building energy efficiency: An approach based on the building controls virtual test bed platform using a genetic algorithm. J. Build. Eng. 2021, 35, 102095. [Google Scholar] [CrossRef]
  21. Fanger, P. Thermal Confort; McGraw-Hill, Book Company: New York, NY, USA, 1973. [Google Scholar]
  22. Fanger, P. Thermal Comfort-Analysis and Applications in Environmental Engineering; Danish Technical Press: Copenhagen, Denmark, 1970. [Google Scholar]
  23. ISO7730; Ergonomics of the Thermal Environment-Analytical Determination and Interpretation of Thermal Comfort Using Calculation of PMV and PPD Indices and Local Thermal Comfort Criteria. International Organization for Standardization: Geneva, Switzerland, 2005.
Figure 1. A controller in BCVTB interacts with ENERGYPLUS environment.
Electronics 11 00491 g001
Figure 2. Model structure in BCVTB environment.
Electronics 11 00491 g002
Figure 3. A simple building plan.
Electronics 11 00491 g003
Figure 4. Wind speed variation over the four days.
Electronics 11 00491 g004
Figure 5. Outdoor temperature variation over the four days.
Electronics 11 00491 g005
Figure 6. Solar radiation over the four days.
Electronics 11 00491 g006
Figure 7. State-transmitting chart for blinding operation.
Electronics 11 00491 g007
Figure 8. The waveform of indoor temperature under different strategies.
Electronics 11 00491 g008
Figure 9. PMV variation under different operations.
Electronics 11 00491 g009
Figure 10. PPD variation under different operations.
Electronics 11 00491 g010
Figure 11. Indoor temperature variation vs. blind-shading scheme.
Electronics 11 00491 g011
Figure 12. PMV variation during optimal operation.
Electronics 11 00491 g012
Figure 13. PMV variation during optimal operation.
Electronics 11 00491 g013
Figure 14. Energy consumption during heating by HVAC.
Electronics 11 00491 g014
Figure 15. Energy consumption during cooling by HVAC.
Electronics 11 00491 g015
Figure 16. Accumulative energy consumption.
Electronics 11 00491 g016
Table 1. Key parameters of the targeted building model.
Lighting (watts)Equipment (watts)OccupantsProportion (m2)
West zone0.002928.75355.74
East zone878.622928.75455.74
North zone1464.381464.38355.74
In total2343.007323.0010167.23
Table 2. Heat transfer coefficient of enclosure structures.
Enclosure StructureHeat Transfer Coefficient(w·m−2)Thickness (mm)
External wall0.72145.94
Partition0.67241.40
Floor slab1.73203.30
Roof0.4398.54
Win-con-single pane0.903.00
Win-con-single pane with interior blind0.5021.75
Table 3. U-values for the objective buildings.
Envelope Element U-Value (W/m2 K)
Walls0.45
Roofs0.25
Floors0.45
Windows3.3
Table 4. Lighting schedule.
TimeLighting Rate
WeekdayUntil 6:000.05
Until 7:000.2
Until 17:001
Until 18:000.5
Until 24:000.05
WeekendUntil 24:000.05
Table 5. Heating and cooling operation schedule.
TimeHeating Operation
Target Temperature (°C)
Cooling Operation
Target Temperature (°C)
Until 7:001024
Until 9:002124
Until 17:002124
Until 24:00024
Table 6. Different operational strategies.
Operational StrategyHeatingCoolingBlind Operation
S1YesNoNo
S2YesYesNo
S3YesYesYes
Table 7. Energy consumption under the three strategies.
Strategy NumberFacilitiesHeating Consumption (J)Cooling Consumption (J)Electricity (Kw)Comfort Requirement Satisfied
S1Heating1.25 × 108014.70No
S2Heating + Cooling1.31 × 1083.33 × 10745.71No
S3Blind + Heating + Cooling1.73 × 1081.36 × 10731.70Yes
Publisher’s Note: MDPI stays neutral with regard to jurisdictional claims in published maps and institutional affiliations.

