
Driver Cardiovascular Disease Detection Using Seismocardiogram

 , , , and
Abstract
:1. Introduction
2. Materials and Methods
2.1. Related Works
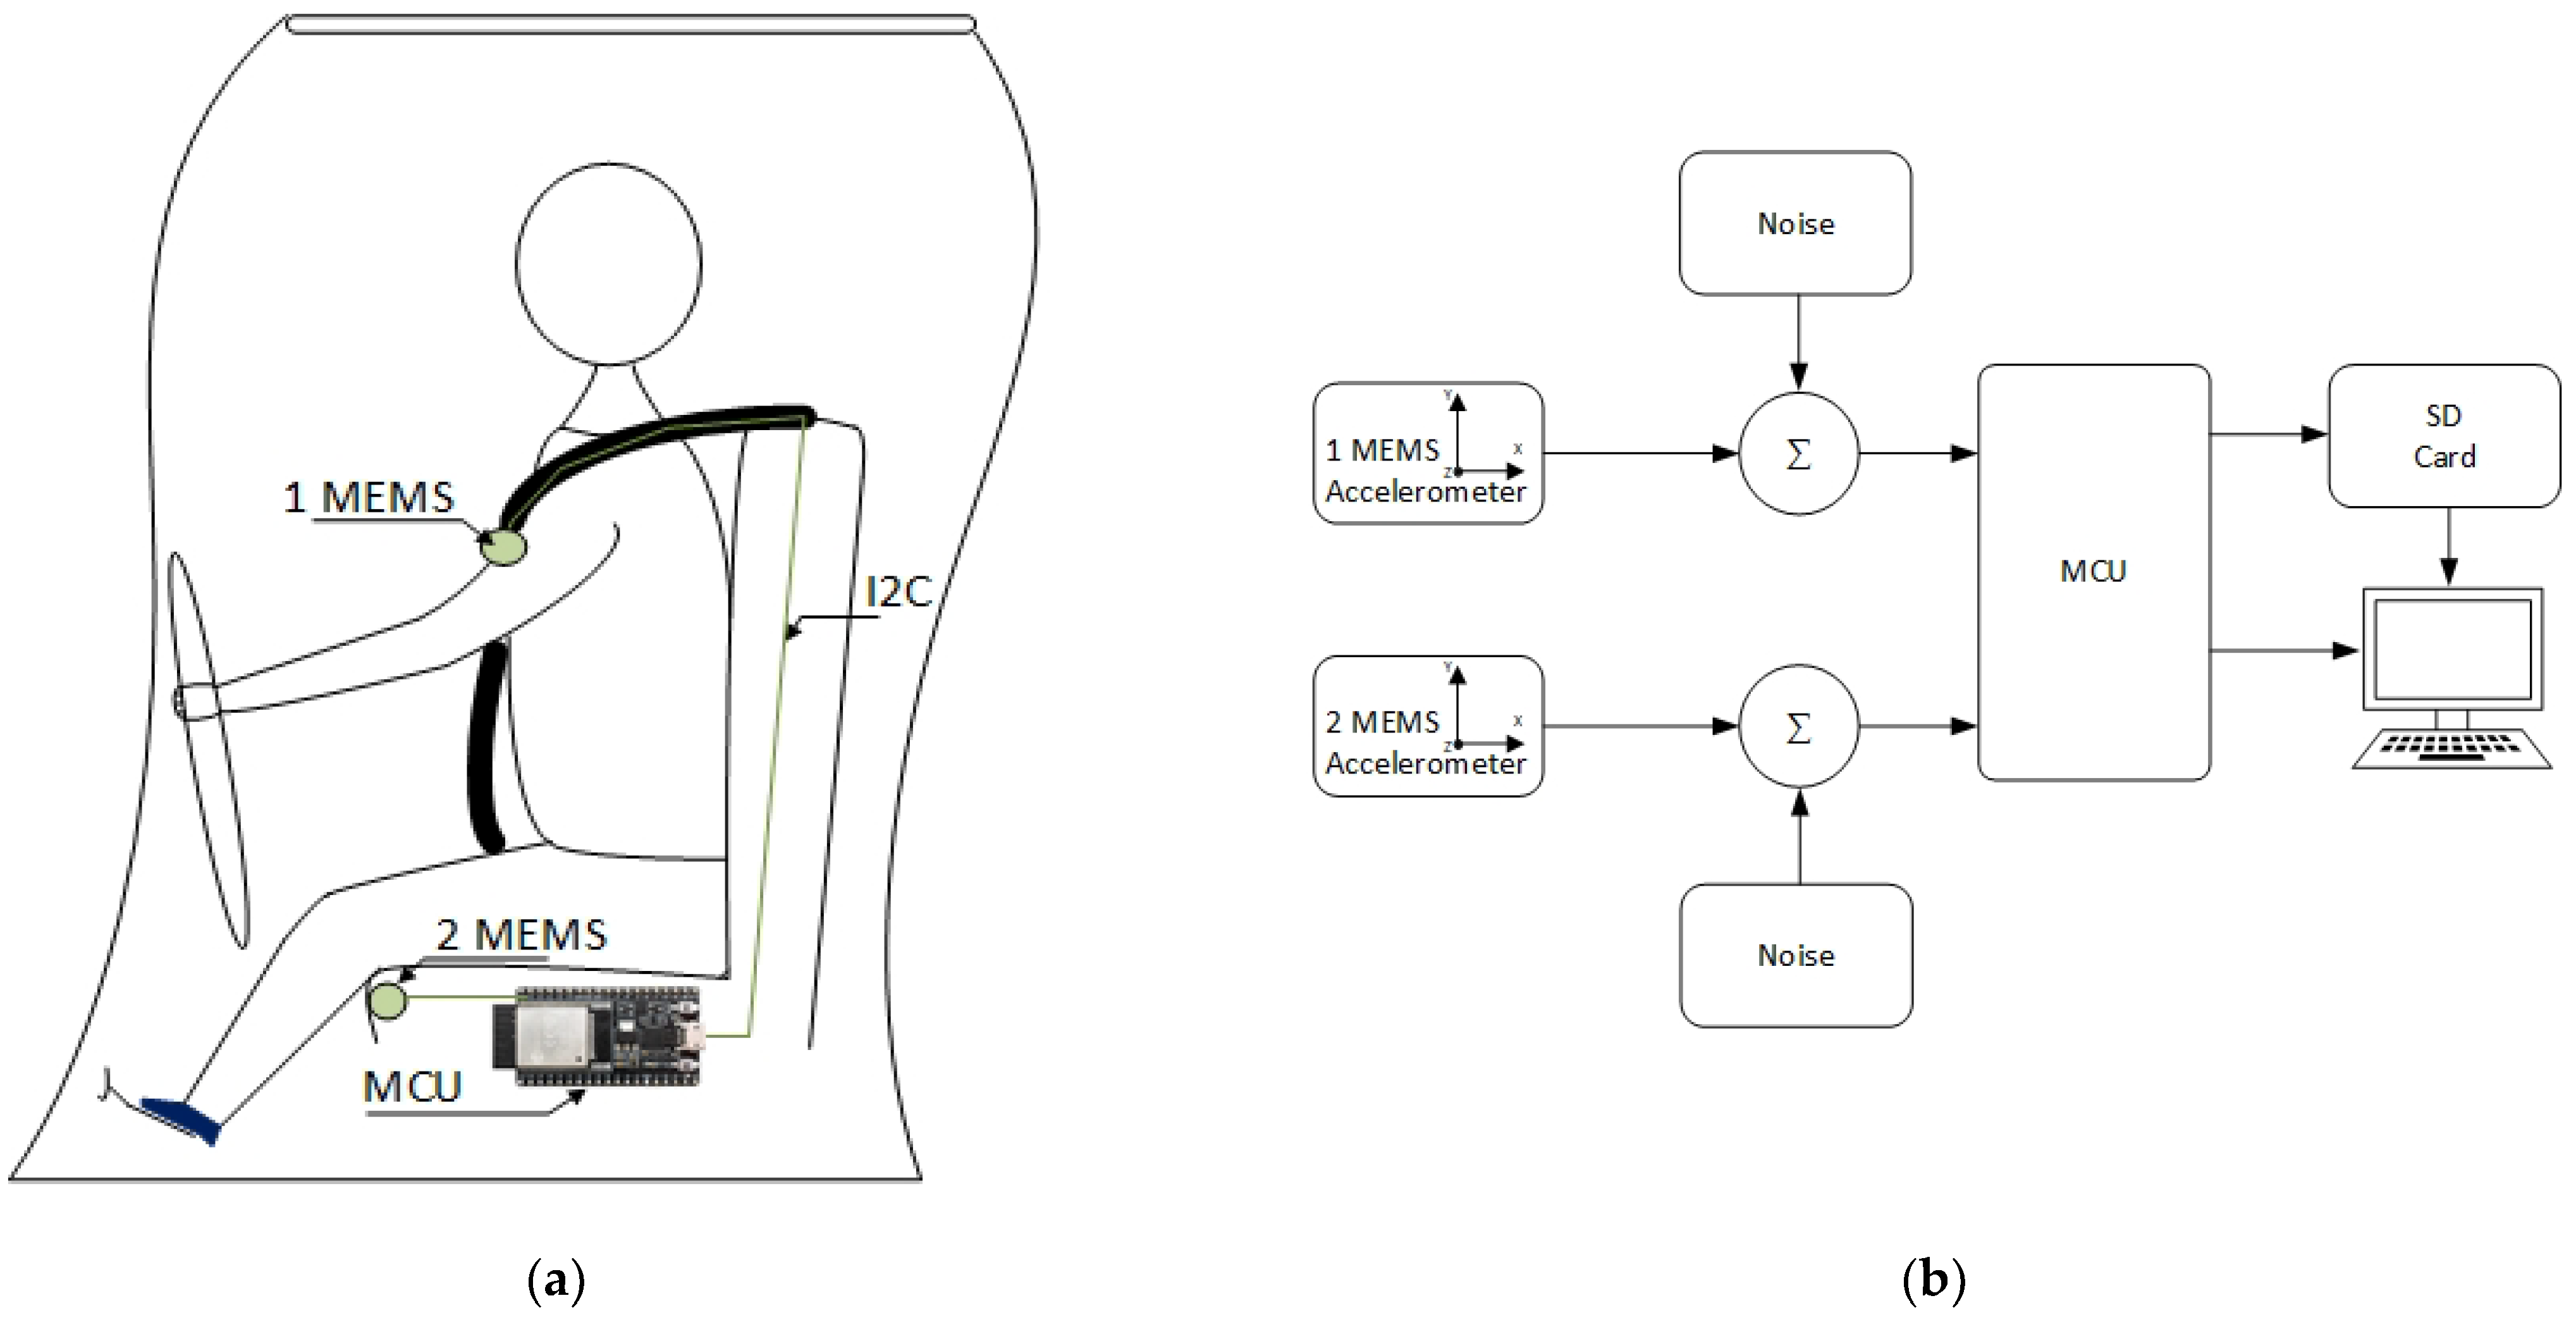
2.2. The System Discription
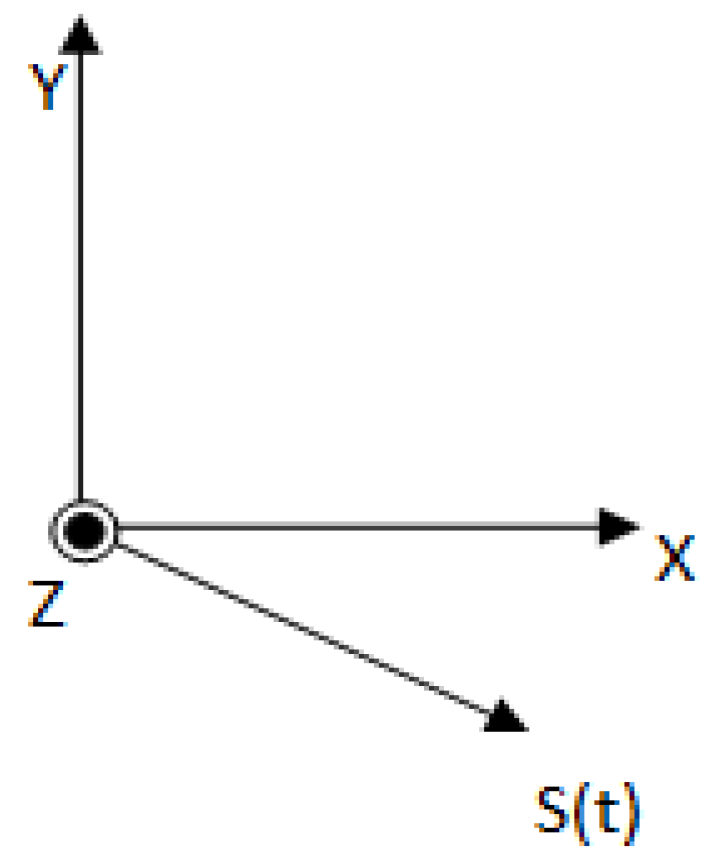
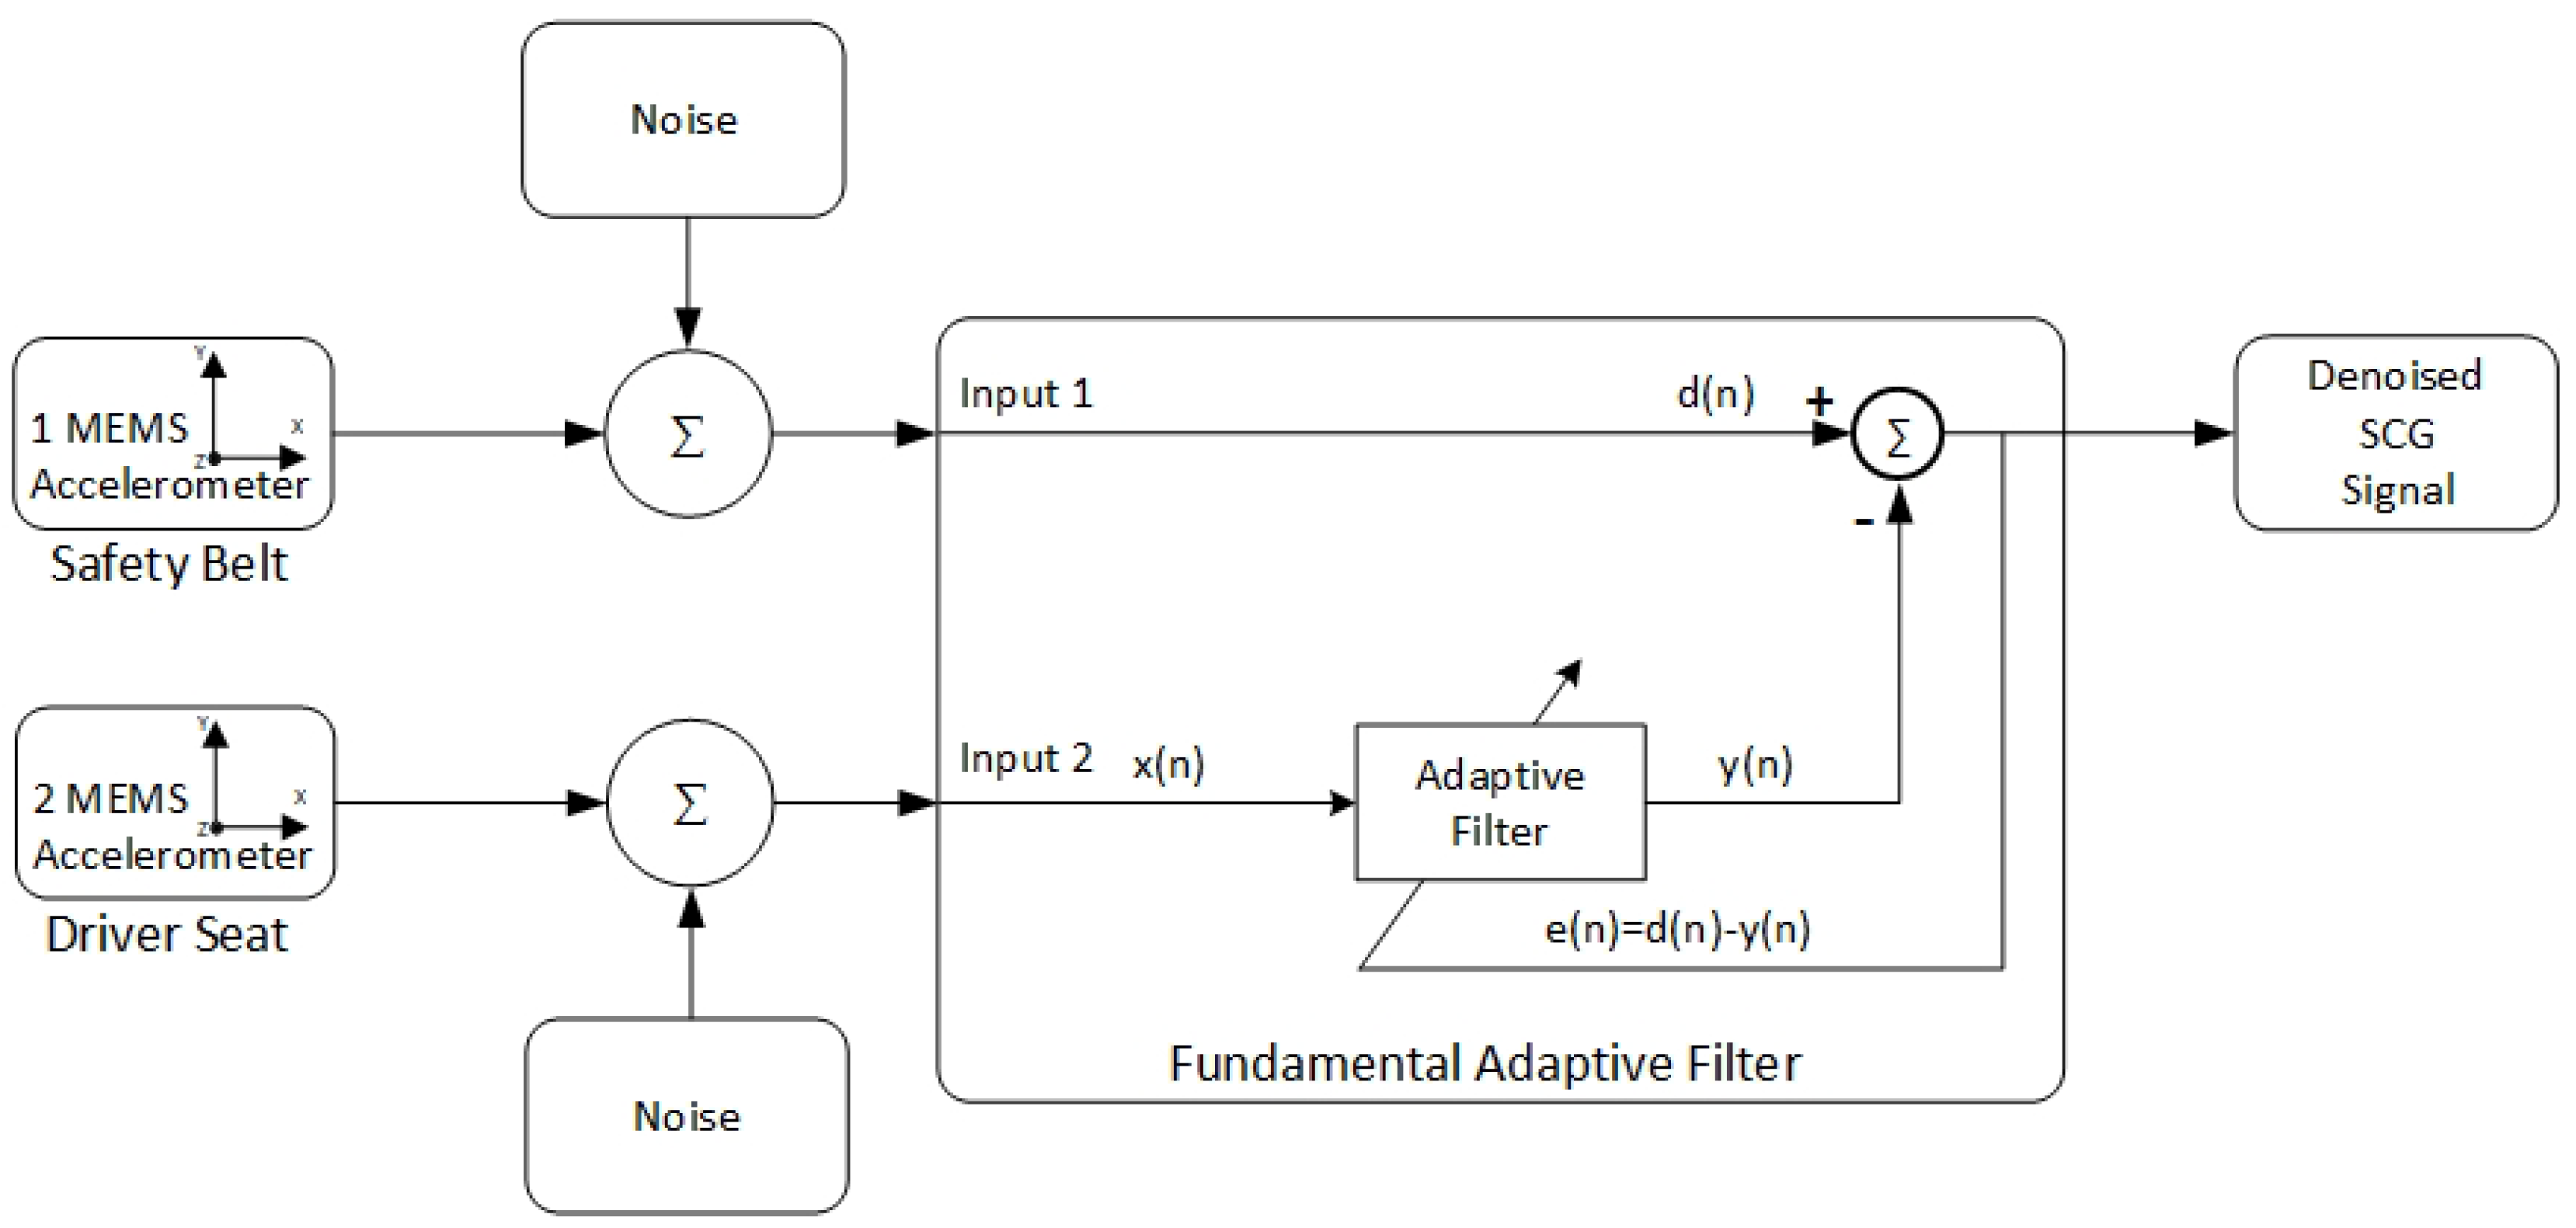
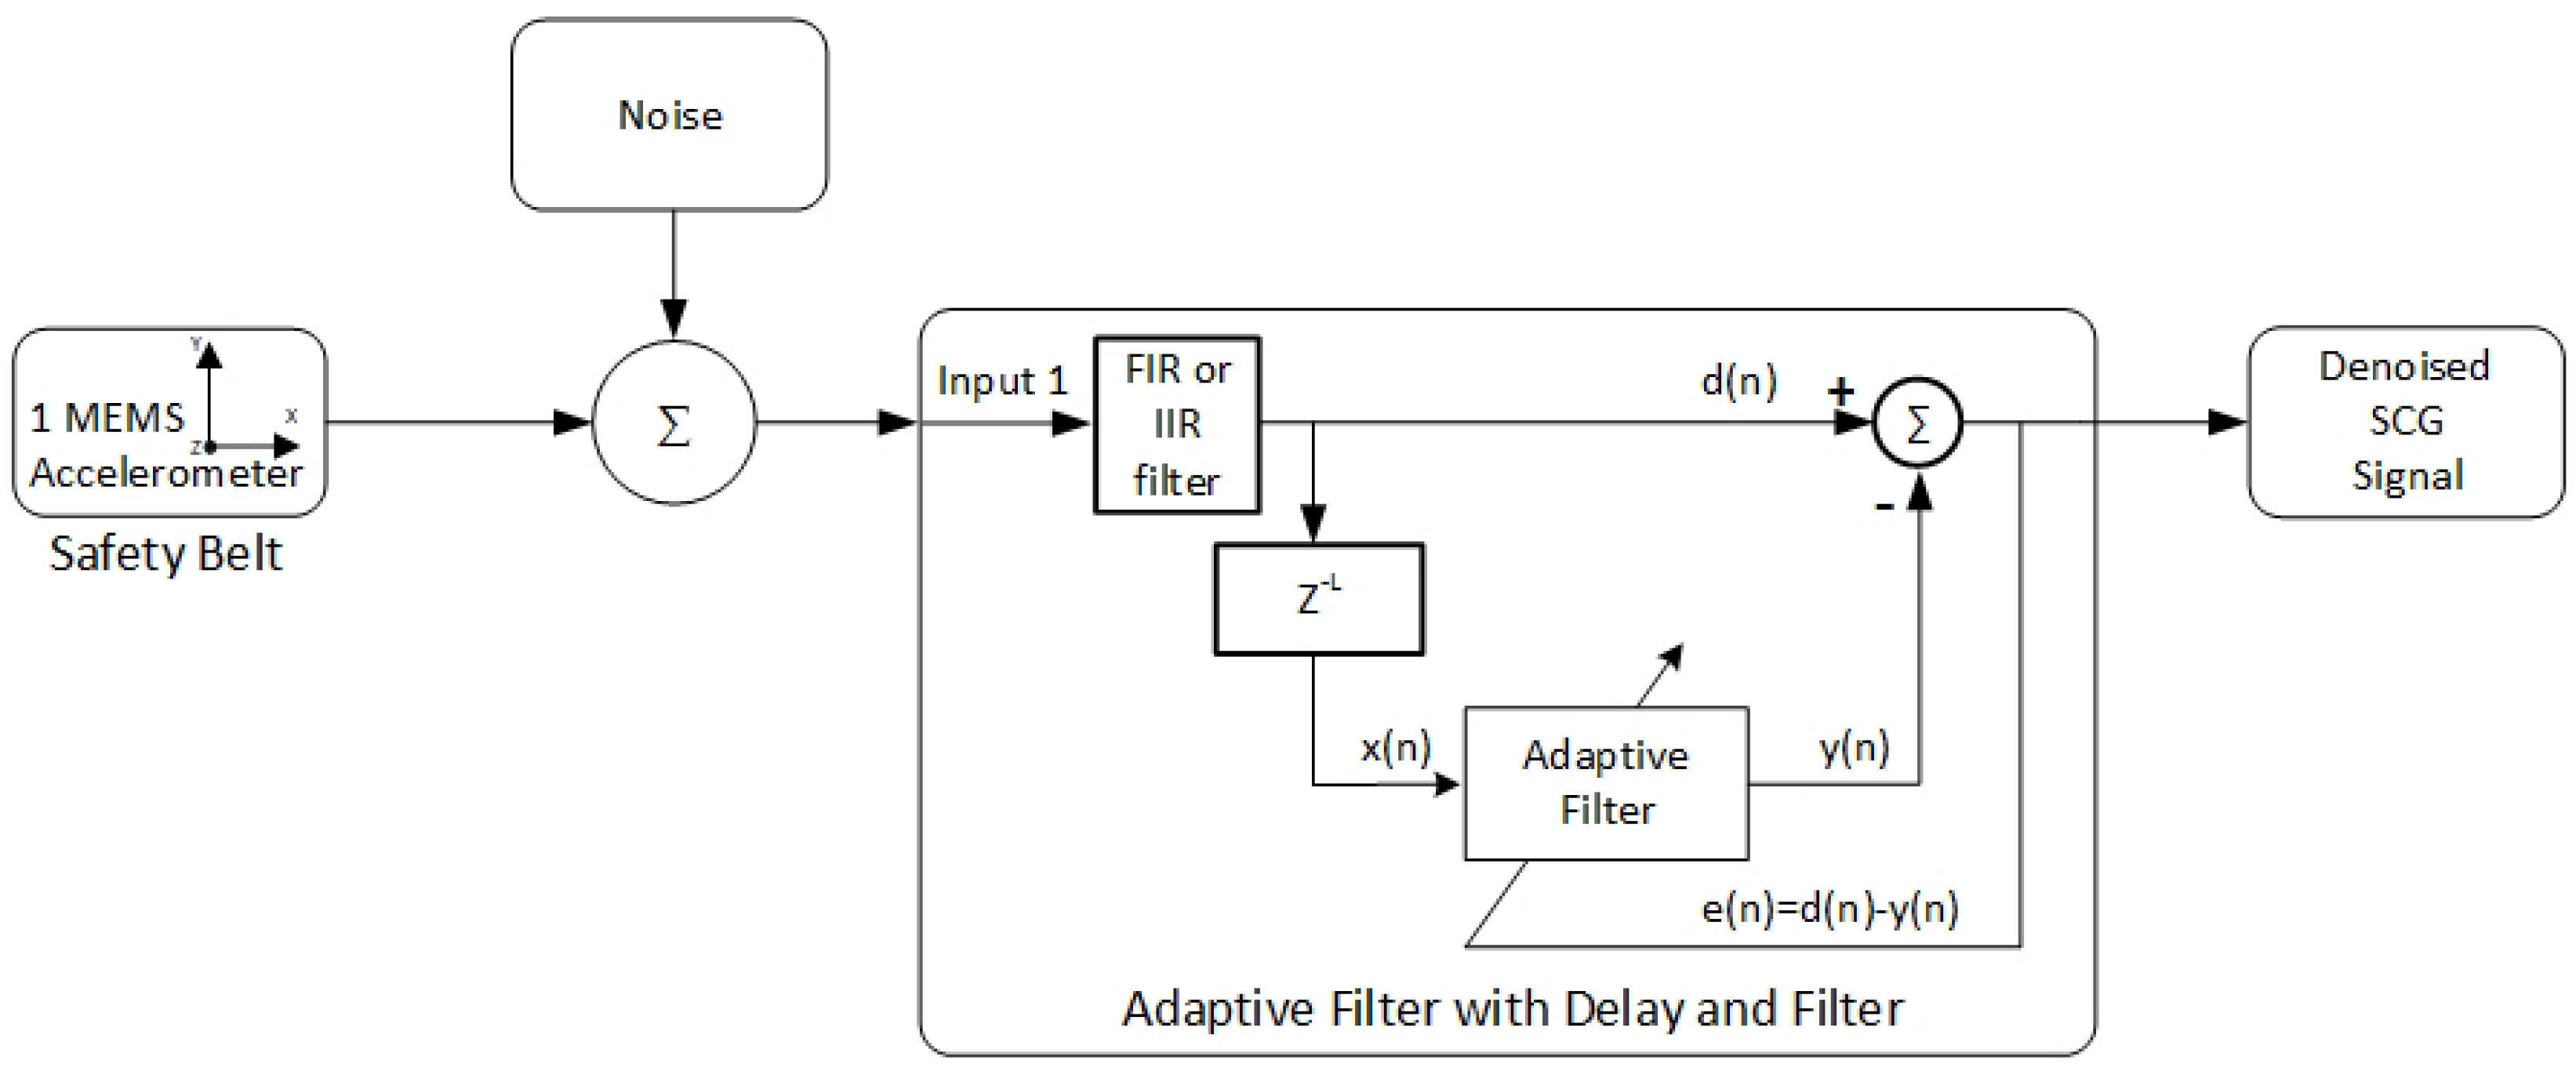
2.3. The Signal Processing
3. Results and Discussion
4. Experimental Results
5. Conclusions
Author Contributions
Funding
Conflicts of Interest
References
- Epstein, A.E.; Miles, W.M.; Benditt, D.G.; Camm, A.J.; Darling, E.J.; Friedman, P.L.; Garson, A.; Harvey, J.C.; Kidwell, G.A.; Klein, G.J.; et al. Personal and public safety issues related to arrhythmias that may affect consciousness: Implications for regulation and physician recommendations. A medical/scientific statement from the American Heart Association and the North American Society of Pacing. Circulation 1996, 94, 1147–1166. [Google Scholar] [CrossRef] [PubMed]
- Pencina, M.J.; Navar, A.M.; Wojdyla, D.; Sanchez, R.J.; Khan, I.; Elassal, J.; D’agostino, R.B.; Peterson, E.D.; Sniderman, A.D. Quantifying Importance of Major Risk Factors for Coronary Heart Disease. Circulation 2019, 139, 1603–1611. [Google Scholar] [CrossRef] [PubMed]
- Virani, S.S.; Alonso, A.; Benjamin, E.J.; Bittencourt, M.S.; Callaway, C.W.; Carson, A.P.; Chamberlain, A.M.; Chang, A.R.; Cheng, S.; Delling, F.N. Heart disease and stroke statistics—2020 update: A report from the American Heart Association. Circulation 2020, 141, E139–E596. [Google Scholar] [CrossRef] [PubMed]
- Cardiovascular Diseases (CVDs). Available online: https://www.who.int/news-room/fact-sheets/detail/cardiovascular-diseases-(cvds) (accessed on 28 December 2021).
- Virani, S.S.; Alonso, A.; Aparicio, H.J.; Benjamin, E.J.; Bittencourt, M.S.; Callaway, C.W.; Carson, A.P.; Chamberlain, A.M.; Cheng, S.; Delling, F.N. Heart Disease and Stroke Statistics–2021 Update A Report from the American Heart Association. Circulation 2021, 143, E254–E743. [Google Scholar] [CrossRef]
- Ruthmann, N. AHA: Heart Disease Remains Leading Cause of Death Worldwide; Trends Discouraging. Available online: https://www.healio.com/news/cardiology/20210127/aha-heart-disease-remains-leading-cause-of-death-worldwide-trends-discouraging (accessed on 28 December 2021).
- Epstein, A.E.; Baessler, C.A.; Curtis, A.B.; Estes, N.A.A.M.; Gersh, B.J.; Grubb, B.; Mitchell, L.B. Addendum to “Personal and Public Safety Issues Related to Arrhythmias That May Affect Consciousness: Implications for Regulation and Physician Recommendations: A Medical/Scientific Statement From the American Heart Association and the North American Society of Pacing and Electrophysiology”. Circulation 2007, 115, 1170–1176. [Google Scholar]
- Brignole, M.; Moya, A.; De Lange, F.J.; Deharo, J.C.; Elliott, P.M.; Fanciulli, A.; Fedorowski, A.; Furlan, R.; Kenny, R.A.; Martín, A.; et al. 2018 ESC Guidelines for the diagnosis and management of syncope. Eur. Heart J. 2018, 39, 1883–1948. [Google Scholar] [CrossRef]
- Margulescu, A.D.; Anderson, M.H. A review of driving restrictions in patients at risk of syncope and cardiac arrhythmias associated with sudden incapacity: Differing global approaches to regulation and risk. Arrhythmia Electrophysiol. Rev. 2019, 8, 90–98. [Google Scholar] [CrossRef]
- Sonmezocak, T.; Kurt, S. Detection of EMG Signals by Neural Networks Using Autoregression and Wavelet Entropy for Bruxism Diagnosis. Elektron. Elektrotechnika 2021, 27, 11–21. [Google Scholar] [CrossRef]
- Nguyen, T.-N.; Nguyen, T.-H. Deep Learning Framework with ECG Feature-Based Kernels for Heart Disease Classification. Electron. Electr. Eng. 2021, 27, 48–59. [Google Scholar] [CrossRef]
- Drezner, J.A.; Ackerman, M.J.; Cannon, B.C.; Corrado, D.; Heidbuchel, H.; Prutkin, J.M.; Salerno, J.C.; Anderson, J.; Ashley, E.; Asplund, C.A.; et al. Abnormal electrocardiographic findings in athletes: Recognising changes suggestive of primary electrical disease. Br. J. Sports Med. 2013, 47, 153–167. [Google Scholar] [CrossRef] [Green Version]
- Guettler, N.; Bron, D.; Manen, O.; Gray, G.; Syburra, T.; Rienks, R.; D’Arcy, J.; Davenport, E.D.; Nicol, E.D. Management of cardiac conduction abnormalities and arrhythmia in aircrew. Heart 2019, 105, S38–S49. [Google Scholar] [CrossRef] [Green Version]
- Klein, H.H.; Sechtem, U.; Trappe, H.-J. Fitness to Drive in Cardiovascular Disease. Dtsch. Arztebl. Int. 2017, 114, 692–701. [Google Scholar] [CrossRef] [Green Version]
- Al-Khatib, S.M.; Stevenson, W.G.; Ackerman, M.J.; Bryant, W.J.; Callans, D.J.; Curtis, A.B.; Deal, B.J.; Dickfeld, T.; Field, M.E.; Fonarow, G.C.; et al. 2017 AHA/ACC/HRS Guideline for Management of Patients with Ventricular Arrhythmias and the Prevention of Sudden Cardiac Death: A Report of the American College of Cardiology/American Heart Association Task Force on Clinical Practice Guidelines and the Heart. J. Am. Coll. Cardiol. 2018, 72, e91–e220. [Google Scholar] [CrossRef]
- Vijgen, J.; Albrecht, M.; Kumar, A.; Steen, T.; Tant, M.; Lerecouvreux, M.; Jung, W.; Rugina, M.; Falk, V.; Moerz, R.; et al. New Standards for Driving and Cardiovascular Diseases. Eur. Work. Gr. Driv. Cardiovasc. Dis. 2013, 1, 59. [Google Scholar]
- EUR-Lex–32016L1106–EN–EUR-Lex. Available online: https://eur-lex.europa.eu/eli/dir/2016/1106/oj/deu (accessed on 3 January 2022).
- Numé, A.K.; Gislason, G.; Christiansen, C.B.; Zahir, D.; Hlatky, M.A.; Torp-Pedersen, C.; Ruwald, M.H. Syncope and motor vehicle crash risk: A Danish nationwide study. JAMA Intern. Med. 2016, 176, 503–510. [Google Scholar] [CrossRef] [Green Version]
- Sumiyoshi, M. Driving restrictions for patients with reflex syncope. J. Arrhythmia 2017, 33, 590–593. [Google Scholar] [CrossRef]
- Jaul, E.; Barron, J. Age-Related Diseases and Clinical and Public Health Implications for the 85 Years Old and Over Population. Front. Public Health 2017, 5, 335. [Google Scholar] [CrossRef] [Green Version]
- Kassebaum, N.J.; Arora, M.; Barber, R.M.; Brown, J.; Carter, A.; Casey, D.C.; Charlson, F.J.; Coates, M.M.; Coggeshall, M.; Cornaby, L.; et al. Global, regional, and national disability-adjusted life-years (DALYs) for 315 diseases and injuries and healthy life expectancy (HALE), 1990–2015: A systematic analysis for the Global Burden of Disease Study 2015. Lancet 2016, 388, 1603–1658. [Google Scholar] [CrossRef] [Green Version]
- Simpson, C.; Ross, D.; Dorian, P. CCS Consensus Conference 2003: Assessment of the cardiac patient for fitness to drive and fly–Executive summary. Can. J. Cardiol. 2004, 20, 1313–1323. [Google Scholar]
- Pockevicius, V.; Markevicius, V.; Cepenas, M.; Andriukaitis, D.; Navikas, D. Blood Glucose Level Estimation Using Interdigital Electrodes. Elektron. Elektrotechnika 2013, 19, 71–74. [Google Scholar] [CrossRef]
- Jain, P.K.; Tiwari, A.K. Heart monitoring systems–A review. Comput. Biol. Med. 2014, 54, 1–13. [Google Scholar] [CrossRef]
- Barbic, F.; Casazza, G.; Zamunér, A.R.; Costantino, G.; Orlandi, M.; Dipaola, F.; Capitanio, C.; Achenza, S.; Sheldon, R.; Furlan, R. Driving and working with syncope. Auton. Neurosci. Basic Clin. 2014, 184, 46–52. [Google Scholar] [CrossRef]
- Chen, C.C.; Shiu, L.J.; Li, Y.L.; Tung, K.Y.; Chan, K.Y.; Yeh, C.J.; Chen, S.C.; Wong, R.H. Shift Work and Arteriosclerosis Risk in Professional Bus Drivers. Ann. Epidemiol. 2010, 20, 60–66. [Google Scholar] [CrossRef]
- García Lledó, A.; Valdés Rodríguez, E.; Ozcoidi Val, M. Heart Disease and Vehicle Driving: Novelties in European and Spanish Law. Rev. Española Cardiol. (Engl. Ed.) 2018, 71, 892–894. [Google Scholar] [CrossRef]
- Sidikova, M.; Martinek, R.; Kawala-Sterniuk, A.; Ladrova, M.; Jaros, R.; Danys, L.; Simonik, P. Vital sign monitoring in car seats based on electrocardiography, ballistocardiography and seismocardiography: A review. Sensors 2020, 20, 5699. [Google Scholar] [CrossRef]
- Surgailis, T.; Valinevicius, A.; Markevicius, V.; Navikas, D.; Andriukaitis, D. Avoiding forward car collision using stereo vision system. Elektron. Elektrotechnika 2012, 18, 37–40. [Google Scholar] [CrossRef] [Green Version]
- Soni, N.; Malekian, R.; Andriukaitis, D.; Navikas, D. Internet of Vehicles based approach for road safety applications using sensor technologies. Wirel. Pers. Commun. 2019, 105, 1257–1284. [Google Scholar] [CrossRef] [Green Version]
- Ieremeiev, O.; Lukin, V.; Okarma, K.; Egiazarian, K. Full-Reference Quality Metric Based on Neural Network to Assess the Visual Quality of Remote Sensing Images. Remote Sens. 2020, 12, 2349. [Google Scholar] [CrossRef]
- Paterova, T.; Prauzek, M. Estimating Harvestable Solar Energy from Atmospheric Pressure Using Deep Learning. Elektron. Elektrotechnika 2021, 27, 18–25. [Google Scholar] [CrossRef]
- Sotner, R.; Domansky, O.; Jerabek, J.; Herencsar, N.; Petrzela, J.; Andriukaitis, D. Integer-and Fractional-Order Integral and Derivative Two-Port Summations: Practical Design Considerations. Appl. Sci. 2020, 10, 54. [Google Scholar] [CrossRef] [Green Version]
- Prauzek, M.; Konecny, J. Optimizing of Q-Learning Day/Night Energy Strategy for Solar Harvesting Environmental Wireless Sensor Networks Nodes. Elektron. Elektrotechnika 2021, 27, 50–56. [Google Scholar] [CrossRef]
- Skovierova, H.; Pavelek, M.; Okajcekova, T.; Palesova, J.; Strnadel, J.; Spanik, P.; Halašová, E.; Frivaldsky, M. The Biocompatibility of Wireless Power Charging System on Human Neural Cells. Appl. Sci. 2021, 11, 3611. [Google Scholar] [CrossRef]
- Saini, S.K.; Gupta, R. Artificial intelligence methods for analysis of electrocardiogram signals for cardiac abnormalities: State-of-the-art and future challenges. Artif. Intell. Rev. 2021, 1–47. [Google Scholar] [CrossRef]
- Maršánová, L.; Ronzhina, M.; Smíšek, R.; Vítek, M.; Němcová, A.; Smital, L.; Nováková, M. ECG features and methods for automatic classification of ventricular premature and ischemic heartbeats: A comprehensive experimental study. Sci. Rep. 2017, 7, 1–11. [Google Scholar] [CrossRef] [Green Version]
- Taymanov, R.; Sapozhnikova, K. What makes sensor devices and microsystems ‘intelligent’ or ‘smart’? In Smart Sensors and MEMS, 2nd ed.; Elsevier: Amsterdam, The Netherlands, 2018; pp. 1–22. ISBN 9780081020562. [Google Scholar]
- Yang, C.; Tavassolian, N. Combined Seismo- and Gyro-Cardiography. IEEE J. Biomed. Health Inform. 2018, 22, 1466–1475. [Google Scholar] [CrossRef]
- Sahoo, P.K.; Thakkar, H.K.; Lin, W.Y.; Chang, P.C.; Lee, M.Y. On the design of an efficient cardiac health monitoring system through combined analysis of ECG and SCG signals. Sensors 2018, 18, 379. [Google Scholar] [CrossRef] [Green Version]
- Javaid, A.Q.; Ashouri, H.; Dorier, A.; Etemadi, M.; Heller, J.A.; Roy, S.; Inan, O.T. Quantifying and reducing motion artifacts in wearable seismocardiogram measurements during walking to assess left ventricular health. IEEE Trans. Biomed. Eng. 2017, 64, 1277–1286. [Google Scholar] [CrossRef]
- Pandia, K.; Ravindran, S.; Kovacs, G.T.A.; Giovangrandi, L.; Cole, R. Chest-accelerometry for hemodynamic trending during valsalvarecovery. In Proceedings of the 2010 3rd International Symposium on Applied Sciences in Biomedical and Communication Technologies, Rome, Italy, 7–10 November 2010; pp. 1–5. [Google Scholar]
- Leonhardt, S.; Leicht, L.; Teichmann, D. Unobtrusive vital sign monitoring in automotive environments—A review. Sensors 2018, 18, 3080. [Google Scholar] [CrossRef] [Green Version]
- Yang, C.; Tavassolian, N. Motion Noise Cansellation in Seismocardiographic Monitoring of Moving Subjects. In IEEE Biomedical Circuits and Systems Conferences (BioCAS); IEEE: Piscataway, NJ, USA, 2015. [Google Scholar]
- Hurnanen, T.; Lehtonen, E.; Jafari Tadi, M.; Kuusela, T.; Kiviniemi, T.; Saraste, A.; Vasankari, T.; Airaksinen, J.; Koivisto, T.; Tadi, M.J.; et al. Automated Detection of Atrial Fibrillation Based on Time-Frequency Analysis of Seismocardiograms. IEEE J. Biomed. Health Inform. 2017, 21, 1233–1241. [Google Scholar] [CrossRef]
- Mohammed, Z.; Elfadel, I.; Abe, M.; Rasras, M. Monolithic multi degree of freedom (MDoF) capacitive MEMS accelerometers. Micromachines 2018, 9, 602. [Google Scholar] [CrossRef] [Green Version]
- Cooper, S.; Cant, R.; Sparkes, L. Respiratory rate records: The repeated rate? J. Clin. Nurs. 2014, 23, 1236–1238. [Google Scholar] [CrossRef]
- Mizuno, N.; Washino, K. A model based filtering technique for driver’s heart rate monitoring using seat-embedded vibration sensors. In ISCCSP 2014—2014 The 6th International Symposium on Communications, Control, and Signal Processing Proceedings; IEEE: Piscataway, NJ, USA, 2014. [Google Scholar] [CrossRef]
- Holcik, J.; Moudr, J. Mathematical model of seismocardiogram. World Congr. Med. Phys. Biomed. 2007, 14, 3415–3418. [Google Scholar]
- Casanella, R.; Inan, O.T.; Migeotte, P.; Park, K.; Member, S.; Etemadi, M.; Member, S.; Tavakolian, K.; Casanella, R.; Zanetti, J.; et al. Ballistocardiography and Seismocardiography: Ballistocardiography and Seismocardiography: A Review of Recent Advances. J. Biomed. Health Inform. 2014, 19, 1414–1427. [Google Scholar] [CrossRef] [Green Version]
- Leitão, F.; Moreira, E.; Alves, F.; Lourenço, M.; Azevedo, O.; Gaspar, J.; Rocha, L.A. High-Resolution Seismocardiogram Acquisition and Analysis System. Sensors 2018, 18, 3441. [Google Scholar] [CrossRef] [Green Version]
- Okada, S.; Fujiwara, Y.; Yasuda, M.; Ohno, Y.; Makikawa, M. Non-restrictive heart rate monitoring using an acceleration sensor. In Proceedings of the 2006 International Conference of the IEEE Engineering in Medicine and Biology Society, New York, NY, USA, 30 August–3 September 2006. [Google Scholar]
- Jafari Tadi, M.; Lehtonen, E.; Saraste, A.; Tuominen, J.; Koskinen, J.; Teräs, M.; Airaksinen, J.; Pänkäälä, M.; Koivisto, T. Gyrocardiography: A New Non-invasive Monitoring Method for the Assessment of Cardiac Mechanics and the Estimation of Hemodynamic Variables. Sci. Rep. 2017, 7, 6823. [Google Scholar] [CrossRef]
- Luu, L.; Dinh, A. Using Moving Average Method to Recognize Systole and Diastole on Seismocardiogram without ECG Signal. In Proceedings of the Annual International Conference of the IEEE Engineering in Medicine and Biology Society, EMBS, Honolulu, HI, USA, 18–21 July 2018; pp. 3796–3799. [Google Scholar]
- Di Rienzo, M.; Vaini, E.; Lombardi, P. An algorithm for the beat-to-beat assessment of cardiac mechanics during sleep on Earth and in microgravity from the seismocardiogram. Sci. Rep. 2017, 7, 1–12. [Google Scholar] [CrossRef] [Green Version]
- Shafiq, G.; Tatinati, S.; Ang, W.T.; Veluvolu, K.C. Automatic Identification of Systolic Time Intervals in Seismocardiogram. Sci. Rep. 2016, 6, 37524. [Google Scholar] [CrossRef] [Green Version]
- Georgoulas, G.; Chudacek, V.; Rieger, J.; Stylios, C.; Lhotska, L. Methods and Tools for Prosessing Biosignals: A Survey Paper. In Proceedings of the the 3rd European Medical & Biological Engineering Conference, Prague, Czech Republic, 20–25 November 2005; Volume 11, pp. 20–25. [Google Scholar]
- Fong, S.; Hang, Y.; Mohammed, S.; Fiaidhi, J. Stream-based Biomedical Classification Algorithms for Analyzing Biosignals. J. Inf. Process. Syst. 2012, 7, 717–732. [Google Scholar] [CrossRef]
- Fong, S.; Lan, K.; Sun, P.; Mohammed, S.; Fiaidhi, J. A Time-Series Pre-Processing Methodology for Biosignal Classification using Statistical Feature Extraction. In Proceedings of the 10th IASTED International Conference on Biomedical Engineering (Biomed’13), Innsbruck, Austria, 13–15 February 2013; pp. 207–214. [Google Scholar]
- Sircar, P. Mathematical Aspects of Signal Processing; Cambridge University Press: Cambridge, UK, 2016; ISBN 9781107175174. [Google Scholar]
- Di Rienzo, M.; Meriggi, P.; Rizzo, F.; Vaini, E.; Faini, A.; Merati, G.; Parati, G.; Castiglioni, P. A wearable system for the seismocardiogram assessment in daily life conditions. In Proceedings of the 2011 Annual International Conference of the IEEE Engineering in Medicine and Biology Society, Boston, MA, USA, 30 August–3 September 2011; pp. 4263–4266. [Google Scholar]
- Kaisti, M.; Tadi, M.J.; Lahdenoja, O.; Hurnanen, T.; Saraste, A.; Pankaala, M.; Koivisto, T. Stand-Alone Heartbeat Detection in Multidimensional Mechanocardiograms. IEEE Sens. J. 2019, 19, 234–242. [Google Scholar] [CrossRef]
- Jafari Tadi, M.; Lehtonen, E.; Hurnanen, T.; Koskinen, J.; Eriksson, J.; Pänkäälä, M.; Teräs, M.; Koivisto, T. A real-time approach for heart rate monitoring using a Hilbert transform in seismocardiograms. Physiol. Meas. 2016, 37, 1885–1909. [Google Scholar] [CrossRef]
- Semmlow, J.L.; Griffel, B. Biosignal and Medical Image Processing MATLAB-Based Application, 3rd ed.; Taylor & Francis Group: New York, NY, USA, 2014; ISBN 9781466567368. [Google Scholar]
- Poularikas, A.D. Discrete Random Signal Processing and Filtering Primer with MATLAB; Taylor & Francis Group: New York, NY, USA, 2008; ISBN 9781420089332. [Google Scholar]
- Sørensen, K.; Schmidt, S.E.; Jensen, A.S.; Søgaard, P.; Struijk, J.J. Definition of Fiducial Points in the Normal Seismocardiogram. Sci. Rep. 2018, 8, 15455. [Google Scholar] [CrossRef] [PubMed] [Green Version]
- Mora, N.; Cocconcelli, F.; Matrella, G.; Ciampolini, P. Detection and Analysis of Heartbeats in Seismocardiogram Signals. Sensors 2020, 20, 1670. [Google Scholar] [CrossRef] [PubMed] [Green Version]


| Vital Sign Monitoring Method | Sensor Location | Advantages | Disadvantages |
|---|---|---|---|
| Seismocardiogram | Safety belt (this research) | Allows measuring cardiac and respiratory activity unobtrusively. The signal of the three-axis accelerometer characterizes specific events of the heart’s activity. The SCG signal is measured from the front of the chest. The additional reference signal is not required. The safety belt obliges using the vital sign monitoring system automatically. | Requires solving noise issues. |
| Seismocardiogram | Worn sensor | Allows measuring cardiac and respiratory activity unobtrusively. The signal of the three-axis accelerometer characterizes specific events of the heart’s activity. Does not require a reference signal. | Driver required to wear sensor on the body. Requires solving noise issues. |
| Seismocardiogram | Back of the car seat | Allows measuring cardiac and respiratory activity unobtrusively. The signal of the three-axis accelerometer characterizes specific events of the heart’s activity [28,43]. | The seat attenuates the SCG signal. Requires a reference signal, which increases signal processing duration. |
| Balistocardiogram | Car seat | Allows measuring cardiac and respiratory activity unobtrusively. Records the cardio, mechanic, and lung vibrations and the momentum of the blood pulse traveling down to the aorta [28]. | The noise of car motor vibrations may make measurement difficult [28]. Requires a reference signal. |
| Capacitive electrocardiogram | Steering wheel Car seat Back of car seat | Records electrical activity of the heart muscle. Still the most valuable physiological signal. No galvanic contact with the body. Electrically insulated and remains stable in long-term applications [43]. | Both hands have to touch two different parts of the wheel. Requires an infinitely high ohmic resistance [43]. |
| Video monitoring | Camera-based | Allows measuring cardiac activity unobtrusively. No contact required to monitor a driver or passengers. Monitoring of respiratory and temperature can happen in complete darkness. Driver drowsiness and attention detection. Driver stress and pain detection by analyzing facial expressions [28,43]. | Requires free line of sight. Absence of privacy. Sufficient light cannot be guaranteed for operating in the far infrared spectrum. Shadows from other cars and trees can rapidly change the signal [28,43]. |
| Radar system transmitter—receiver system Doppler radar | Front radar Back of car seat | Allows measuring cardiac and respiratory activity unobtrusively. No contact required. Uses high-frequency electromagnetic waves that are emitted and reflected by the chest’s surface [28,43]. | The heart-related motions are very small and hard to detect [43]. |
| Electroencephalogram | Special helmet | Allows measuring concentration, reaction time, and cognitive state, as well as drowsiness of drivers [43]. | The measurement system is complex. |
| Adaptive Filter 1 | Adaptive Filter 2 | Adaptive Filter 3 | Adaptive Filter 4 | |
|---|---|---|---|---|
| Filter order | 90 | 90 | 200 | 50 |
| mu AF step | 1.0133 × 10⁻³ | 1.0133 × 10⁻³ | 5.0855 × 10⁻³ | 9.3302 × 10⁻¹ |
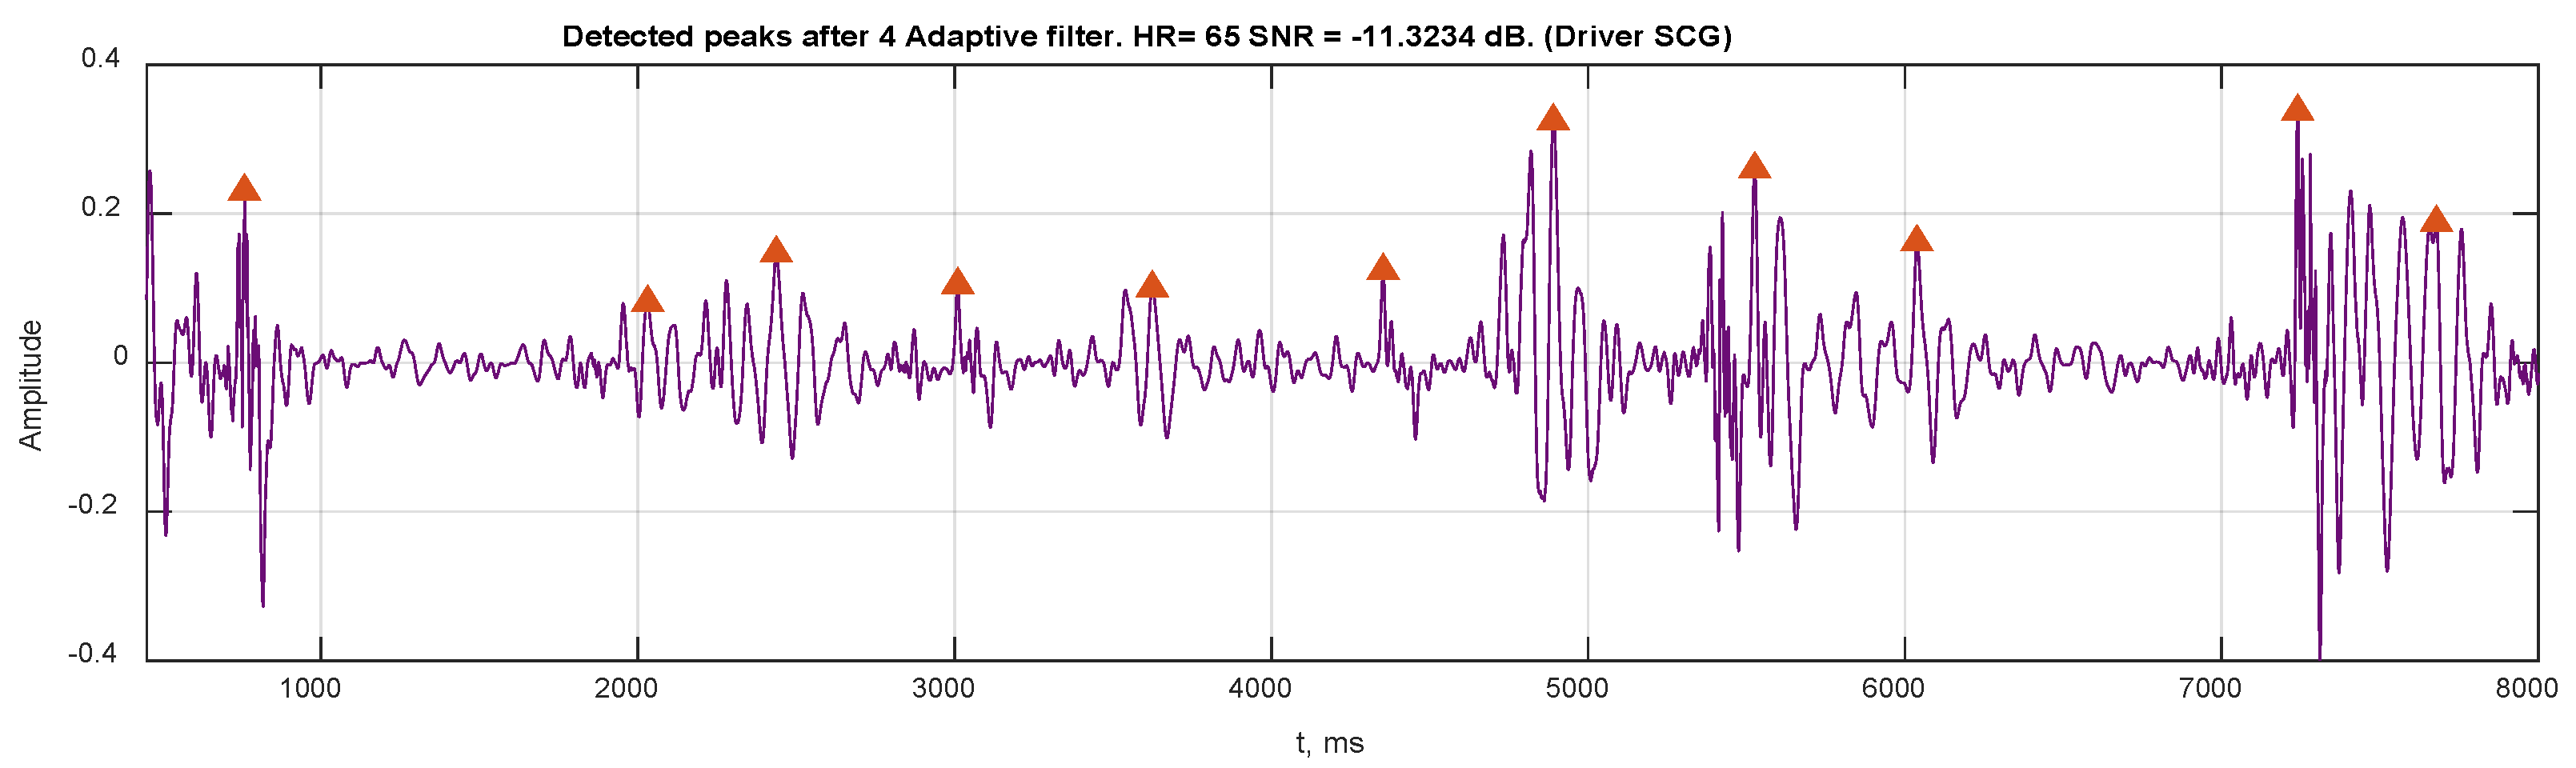
| Heart rate (beats/min) | 109 | 107 | 111 | 65 |
| RMS (m/s2) | 0.5212 | 0.5208 | 0.5198 | 0.0684 |
| SNR (dB) | −7.61 | −7.22 | −8.06 | −11.32 |
| RMSE (m/s2) | 0.0472 | 0.0370 | 0.0248 | 0.1942 |
| Detected peaks number | 53 | 52 | 53 | 27 |
| Peak interval mean (ms) | 549.07 | 558.21 | 536.15 | 917.56 |
| Peak Interval STD | 117.82 | 127.11 | 117.22 | 635.12 |
| Processing time (s) | 57.69 | 1.09 | 1.09 | 1.11 |
| Processing benefit (dB) | 7.10 | 7.49 | 6.65 | 3.39 |
Publisher’s Note: MDPI stays neutral with regard to jurisdictional claims in published maps and institutional affiliations. |
© 2022 by the authors. Licensee MDPI, Basel, Switzerland. This article is an open access article distributed under the terms and conditions of the Creative Commons Attribution (CC BY) license (https://creativecommons.org/licenses/by/4.0/).
Share and Cite
Uskovas, G.; Valinevicius, A.; Zilys, M.; Navikas, D.; Frivaldsky, M.; Prauzek, M.; Konecny, J.; Andriukaitis, D. Driver Cardiovascular Disease Detection Using Seismocardiogram. Electronics 2022, 11, 484. https://doi.org/10.3390/electronics11030484
Uskovas G, Valinevicius A, Zilys M, Navikas D, Frivaldsky M, Prauzek M, Konecny J, Andriukaitis D. Driver Cardiovascular Disease Detection Using Seismocardiogram. Electronics. 2022; 11(3):484. https://doi.org/10.3390/electronics11030484
Chicago/Turabian StyleUskovas, Gediminas, Algimantas Valinevicius, Mindaugas Zilys, Dangirutis Navikas, Michal Frivaldsky, Michal Prauzek, Jaromir Konecny, and Darius Andriukaitis. 2022. "Driver Cardiovascular Disease Detection Using Seismocardiogram" Electronics 11, no. 3: 484. https://doi.org/10.3390/electronics11030484