Article

An Attack Simulation and Evidence Chains Generation Model for Critical Information Infrastructures

by
Eleni-Maria Kalogeraki
1,*,
Spyridon Papastergiou
1,2 and
Themis Panayiotopoulos
1
1
Department of Informatics, University of Piraeus, 80 Karaoli and Dimitriou Str., 18534 Piraeus, Greece
2
MAGGIOLI SPA, Via Del Caprino 8, 47822 Santarcangelo di Romagna, RN, Italy
*
Author to whom correspondence should be addressed.
Electronics 2022, 11(3), 404; https://doi.org/10.3390/electronics11030404
Submission received: 11 December 2021 / Revised: 20 January 2022 / Accepted: 21 January 2022 / Published: 28 January 2022
(This article belongs to the Special Issue AI-Based Knowledge Management)

Abstract

:
Recently, the rapid growth of technology and the increased teleworking due to the COVID-19 outbreak have motivated cyber attackers to advance their skills and develop new sophisticated methods, e.g., Advanced Persistent Threat (APT) attacks, to leverage their cybercriminal capabilities. They compromise interconnected Critical Information Infrastructures (CIIs) (e.g., Supervisory Control and Data Acquisition (SCADA) systems) by exploiting a series of vulnerabilities and launching multiple attacks. In this context, industry players need to increase their knowledge on the security of the CIs they operate and further explore the technical aspects of cyber-attacks, e.g., attack’s course, vulnerabilities exploitability, attacker’s behavior, and location. Several research papers address vulnerability chain discovery techniques. Nevertheless, most of them do not focus on developing attack graphs based on incident analysis. This paper proposes an attack simulation and evidence chains generation model which computes all possible attack paths associated with specific, confirmed security events. The model considers various attack patterns through simulation experiments to estimate how an attacker has moved inside an organization to perform an intrusion. It analyzes artifacts, e.g., Indicators of Compomise (IoCs), and any other incident-related information from various sources, e.g., log files, which are evidence of cyber-attacks on a system or network.

1. Introduction

In recent years, the development of digital communication technology and the increased teleworking all over the world due to the global spread of the coronavirus disease (COVID-19 pandemic) [1] have raised the chances of cyber-attacks in the global community affecting a great variety of industries, such as healthcare, transportation, and energy. Adversaries are evolving their skills exponentially and despite the continuous effort for security technological progress, it still appears difficult to address the emerging cyber threats and/or respond to ongoing security events in cyber-dependent infrastructures.
According to the EU Directive 2008/114/EC on the identification and designation of European Critical Infrastructures (ECIs) and the assessment of the need to improve their protection (ECI Directive), Critical Infrastructures (CIs) are considered those that are “essential for the maintenance of vital societal functions, health, safety, security, economic or social well-being of people”, and their disruption or destruction could lead to significant impact in an EU member state due to the “failure to maintain those functions” [2]. In addition, the ECI Directive considers Critical Information Infrastructures (CIIs) those Information Communication Technologies (ICT) systems that are “Critical Infrastructures for themselves or that are essential for the operation of Critical Infrastructures” (e.g., telecommunications, computers/software, Internet, satellites, etc.) [2].
During the last decade, high-skilled hackers (e.g., “Anonymous”, “FireEye”, “Shadow Brokers”, “Baby Elephant”, etc.) have managed to conduct multiple and sophisticated attacks across ICT networks, i.e., Advanced Persistent Threat (APT) attacks. Furthermore, sophisticated cybercriminals target industries’ heterogeneous CIIs by penetrating interconnected nodes as a stepping stone, either to infiltrate deeply into such infrastructures and cause serious damage to a variety of interrelated entities or to reach a specific target to serve malevolent goals. Significant examples of cyber-attacks with great impact are the WannaCry ransomware attacks of 2017, where a quarter million machines were compromised in more than 150 countries globally affecting several entities, including NHS, Spain’s Telefonica, the US company FedEx [3], and the Colonial Pipeline ransomware attack of 2021 [4].
To respond to the continuous evolving threat landscape, risk management techniques need to focus on exploring cyber-attack features, such as the cyber attack’s course, the adversary’s profile, the cyber-attack potential, attacker’s location through the network, etc., to detect threats and estimate risks on CIIs. Attack Trees or Attack Graphs, have been recognized as well-established approaches for employing threat modeling investigating and analyzing risk propagation during the risk assessment performance. Moreover, they aim to represent potential attack paths that can be exploited by attackers to penetrate systems and obtain unauthorized access through a gradual exploitation of a series of vulnerabilities (vulnerability chains) among interconnected assets. Several attack path discovery algorithms in the literature are able to efficiently estimate and deliver all possible attack paths an adversary could follow to compromise CIIs. Nevertheless, there is still room for investigation and improvement on estimating attack paths based on real security (confirmed) events by analyzing digital artifacts extracted from various sources (e.g., traffic data, log files). In this respect, Indicators of Compromise (IoCs) that are considered critical pieces of incident analysis (e.g., data found in system) and denote potentially malicious activity on a system or network can be utilized by IT professionals and security specialists to acquire a greater understanding of the security posture of their organization. In this vein, attack generation research needs to be enhanced with approaches that combine different security-related information, including IoCs and vulnerability assessment results.
The proposed attack simulation and evidence-based chains generation approach aims to leverage awareness of the cyber-attack surface. It enables the cybersecurity knowledge representations, modeling and evaluation of possible cyber threats, and attack paths and chains of evidence associated with confirmed ongoing unwanted security events. The incident-related information residing in different and heterogeneous ICT systems may include various types of data (i.e., active/unpatched vulnerabilities in the technological infrastructure; misuse/anomaly detection in the network or in the systems, network usage and bandwidth monitoring; SCADA vulnerabilities; etc.). To this end, the attack simulation and evidence chain generation model aims to employ an attack path discovery algorithm that computes all possible attack paths an adversary could follow in relation to (a) specific confirmed security event(s) by taking advantage of incident-related information from various sources (i.e., log files, network traffic analysis). The developed model undertakes a hybrid approach that combines incident analysis and vulnerability analysis and therefore it can benefit the decision-making of CII operators both proactively and for incident handling. In addition, the proposed approach simulates attacks via the development of real-life scenarios to give the ability to further experiment through results and validate the procedures.
Attack modeling techniques could additionally assist in privacy assessment. Since 2018, companies have been encouraged to comply with the General Data Protection Regulation (GDPR) on a global scale [5]. This compliance process was already a rough task and error-prone for many enterprises based on two identified problems according to [5]: the first arises from the unawareness and uncertainty of people on the regulations that have to apply and the second is that some entities do not have the ability to develop policies that leverage compliance. The organizations’ inability to be privacy-aware raised challenges and issues that enable the execution of successful cyber-attacks that can highly impact an organization (e.g., ransomware attack compromising sensitive information).
The proposed approach relies on a standard-based risk assessment methodology that considers information security and security management standards (e.g., ISO27001, ISO28000). The attack simulation and evidence chains generation model detects and assesses vulnerabilities by combining and analyzing incident data during the risk assessment process. In this context, the model can explore vulnerabilities related to privacy, develop attack paths associated with privacy incidents, such as data breaches and information exposures, and analyze an attack’s technical aspects. In this vein, it can assist CII operators to improve their decision-making on strengthening their defense against privacy risks and thus reinforce their compliance to GDPR.
The remainder of this paper is structured as follows: Section 2 provides an overview of current efforts on attack graphs, attack simulation, and knowledge-based security models. Section 3 outlines the methods and algorithms utilized in the current research work. Section 4 presents the proposed attack simulation and evidence chain generation approach. In Section 5, a real-life threat scenario on CIIs is analyzed to demonstrate and validate the approach. Section 6 discusses the research findings and their contribution and suggests avenues for future enhancements. Section 7 draws conclusions. Appendix A includes auxiliary tables of measurements used in the current approach. Appendix B provides a list of acronyms and mathematical symbols applied in this work to facilitate readability.

2. Attack Graphs, Attack Simulation, and Security Knowledge-based Models

Cyber resilience is the ability to anticipate, withstand, recover from, and adapt to adverse conditions, stresses, attacks, or compromises on cyber resources [6]. To better define and estimate a CII system’s cyber resiliency, the measurement of its performance, properties, capabilities, effectiveness, the attacker’s activity, or other risk factors need to be considered. The European Commission (EC), through the NIS Directive [7] and the new NIS 2 Directive proposal [8], aims to stress the need to European Union (EU) member states for the application of EU-wide cybersecurity legislation to enhance cybersecurity across the EU, open opportunities for cross-border collaboration between EU countries, supervise the cybersecurity of critical EU markets and encourage operators of essential and important services of industries to further invest on cybersecurity in terms of increasing their security knowledge on the CIIs they operate and thus strengthen their cyber resilience.
Security management-related standards, such as ISO/IEC 27000 family [9] for information security and ISO 31000 [10] for risk management, are applicable to all types of organizations addressing any type of risk and as they can be adjusted to all activities, they could leverage the decision-making of CII operators. From another point of view, security incident management-related standards, such as the ISO/IEC 27035 series [11], address basic concepts and phases of information security incident management and combine them with principles in a structured approach that can leverage detection, reporting, evaluation, and response to incidents promoting lessons learnt. Scoring methodologies that focus on assessing a system in terms of reaching its operational or mission objectives and comparing alternative produced solutions can raise the security knowledge of CIIs operators and guide them to improve their security policies and thereby raise the cyber resilience of their CIIs. Attack modeling techniques, simulation experiments, and knowledge-based security approaches are core components of such methodologies.
This section aims to depict the current research work related to attack graphs and modeling, attack simulation, and knowledge-based risk management techniques.

2.1. Current Efforts on Attack Modeling and Attack Graphs

The evolving cyber-threats’ landscape and the enormous effort needed to efficiently secure data in the context of a Critical Information Infrastructure (CII), such as SCADA, IoTs, and ICTs utilized in a variety of industries, such as healthcare, maritime transport, and energy, denoted the necessity of adopting more advanced environments capable of providing a holistic picture of the system. For that reason, over the last years, several types of attack modeling and simulation techniques have been developed to deal with networks’ vulnerabilities, behavioral analysis of a cyber-threat, and the potential objectives of an attacker. A proper utilization of such techniques not only provides improved planning of a rapid response to a security incident, but it can also improve the automation procedure of threat modeling through simulation-driven approaches. Moreover, their results could facilitate security practitioners and CII operators further exploring technical aspects of composite attacks and deeply comprehend the security specificities and technical particularities of their IT infrastructures and thereby expand their security knowledge. As a result, this could help them to better manage the corresponding cyber risks and strengthen their defense and security policies.
A vulnerability assessment is considered a thorough analysis of assets’ security weaknesses through which the existing and potential threat landscape within a network can be valued. The development of threat scenarios can delineate the underlined threat landscape and thus facilitate threat knowledge and improve visualization [12].
Attack modeling is a part of the vulnerability analysis which contributes to the evaluation of risk metrics during the risk assessment process. It utilizes Attack Trees or Attack Graphs, which are well-established approaches to employ threat scenarios during the risk assessment process [12]. An indicative example is presented in [13], where cybersecurity threat modeling for supply chain organizational environments is introduced to investigate threat actors, threat reporting among supply chain stakeholders requirements domain aiming to better understand supply chain threats. In recent years, attack modeling has been considered a useful tool in the risk assessment of complex cyber-physical systems (i.e., SCADA systems) [14]. In such systems, attack vectors are strongly dependent on considerations regarding the technical and operational environment where an attack takes place. A typical process of vulnerability analysis can be conducted via scanning tools identifying individual vulnerabilities. Local vulnerability information together with network information (i.e., connectivity between hosts) is capable of developing attack graphs. To evaluate the vulnerability of CIIs in complex networks, the effects of interconnected relations must be considered.
Attack graphs are data structures that are able to model all possible avenues of a network attack. According to Jha et al. [15], attack graphs are considered a series of exploits, the so-called atomic attacks, which can drive the process to an undesirable state (e.g., an adversary gains administrative access to a critical host). They can be utilized for detection, defense, and forensic analysis purposes [15]. Attack graphs can be assumed to be direct graphs in the form of representing a network (nodes are states and edges are the application of an exploit that can transfer a network state into another, more compromised network state) [16]. The ending states of the attack graph represent the network states in which the adversary has met his goals. In addition, an attack graph can be considered in the form of a dependency graph exploit [16].
Attack paths are the identification of one or more vulnerabilities that can be exploited by threat actors (attackers) to obtain access to specific assets and move between them within a network and thereby form an exploitable path between the assets.
Attack modeling first appears in the late 1980s to estimate computer attacks manually, which was a tedious and error-prone process, especially in cases of extensive numbers of nodes [16]. During the end of 1990s, automatic generation of attack graphs, research efforts of computer aided tools, and methods to model network risks were presented counting on mathematical models [17,18]. In recent years, cyber-attack prevention technologies have utilized attack graph generation and analysis methods to identify all possible paths that attackers can exploit to gain unauthorized access to a system [19,20].
There is considerable work for attack graph generation and analysis. The model checking algorithm of [15] is a technique to check if a formal model M of a system satisfies a given property p. According to Kundu et al. [21], attack graph network measurements can be classified into structure and probability-based metrices to quantify network security [22], time-based metrices [23,24] to illustrate the network’s agility in taking preemptive measures to respond to attacks, and stochastic-based metrices to estimate large nodes of networks [17].
Dependability is engaged by the following attributes: availability of service (readiness for correctness), reliability (continuity) of service, safety (absence of negative/catastrophic consequences) of users and the environment, confidentiality (unauthorized disclosure), integrity, and maintainability (repair) [16]. Cyber-attacks can be considered either intentional or unintentional (accidental) and dependability can be evaluated through stochastic analysis (sophisticated method to measure the probability/acceptability of faults) [16]. In case a large network analysis is either an explicit or strict requirement, a quantitative, much more complex analysis is preferred, which can be achieved through probabilistic models [16]. Advanced (sophisticated) attacks can be represented with probabilistic attack graphs that can depict the different states of a system as nodes and the relations between different states as directed edges whereas computation of all potential attack paths to a target of interest is feasible. One single path describes the various steps of an attack, where exploiting one vulnerability grants access to other vulnerabilities, e.g., by gaining some privileges. Even for small networks, attack paths may become quite complex and several tools may be required to develop the attack graphs [25].
As far as dependency evaluation is concerned, the traditional techniques for ensuring the correct operation of a service that cover the “absolute necessities” are block diagrams (BDs) and fault trees (FTs), while more sophisticated approaches are based on Markov models [17,18]. Attack trees as a method to formalize the security of systems and subsystems against different attacks were introduced by Schneier (1999) [26]. A tri-level optimization model to evaluate the performance of power systems for their optimal defending resource allocation to enhance cyber-physical security is presented by Lai et al. (2019) [27].
Topological Analysis of Network Attack Vulnerability (TVA) builds a so-called exploit dependency graph which contains information about the conditions of an exploit and then searches this graph to combine a variety of vulnerabilities [19]. The MulVAL, logic-based network security analyzer was initiated by [28] and it is a vulnerability analysis tool that models the interaction of software flaws along with network configurations. NetSPA is a network security planning architecture that very efficiently develops the worst-case attack graphs [29].
A component metric is attached to each attack node derived from the Common Vulnerability Scoring System (CVSS) metric vector [30]. In [31], a novel systematic method for discovering and analyzing attack paths in real-world scale interdependent cyber physical systems is described. A threat intelligence approach exploring attack data collected using cloud-based web service to support the active threat intelligence is presented in [32]. Through the Pyramid of Pain, the level of difficulty in handling cyber threats is indicated by establishing different levels of Indicators of Compromise (IoC) to show the various levels of technical difficulty and understand attackers’ behavior. A methodology that classifies and attributes the attack surface of mobile malware with known threat actors through automated TTP and IoC analysis is described in [33]. The TTP analysis relies on two methods: mathematical modeling of the ATT&CK matrix and IoC pairing to avoid false flags.
Despite the rising effort of adopting IoC analysis to improve the understanding of the technical aspects of IT infrastructures and to increase awareness of the attack’s course and behavior, there is still potential to study how to assess specific attack paths connected to real security (confirmed) events. The proposed approach on attack simulation and evidence chains generation targets at promoting attack path results by analyzing, modeling, and evaluating all possible cyber threats to produce chains of evidence according to specific and confirmed security events. To achieve this, it combines incident-related information, such as IoCs, with the vulnerability assessment results obtained during the performance of an existing risk assessment methodology. This hybrid approach aims to analyze two aspects: the exploitability capability of vulnerability (e.g., explore where the vulnerability exploitation is possible, whether specific configurations are required, etc.) chains and the cyber attack’s characteristics (e.g., adversary’s profile, available equipment, attack’s course, opportunities, etc.) that can be elaborated to construct the attacker’s timeline towards a detected security event and increase the knowledge both for proactive management and incident handling.

2.2. Attack Simulation and Security Knowledge-Based Models

Simulation techniques can facilitate the assessment environment and deepen the analysis of attacks. A simulation-driven approach is a composite process aiming to discover and execute possible attack plans and it can assess how the availability of information about the system implementation influences the success of attack plans [34]. Moreover, a framework to support the attacks discovery and the calculation of the probabilities of successful attacks and their impact is shown [34]. A variety of approaches explore attack simulation and computation of attack graphs over IT infrastructures (i.e., agent-based model, semi-automated attack-graph generation model) to calculate very large attack graphs, allowing attacks’ simulation in the domain of interest [35].
Ontology-based solutions are dynamic solutions to measure security variables, such as cyber-attacks that can infer risk knowledge and thus enhance situational awareness. Lambe (2013) [36] identifies four types of knowledge risk; knowledge continuity risks, knowledge acquisition risks (new knowledge), knowledge outsourcing risks (risks coming from external parties), and knowledge articulation risks (combine and leverage knowledge capabilities). Risk management is a complex procedure across the complex interdependent nodes of networks. CII operators must be aware of the risks-related information both at organizational and cross-sectorial level. Knowledge Risk Management (KRM) is a new research field which aims to enhance the decision-making of entrepreneurs regarding risk response actions. KRM can have a significant value on SC organizations’ performance expanding the borders of the enterprise’s innovativeness, responsiveness, sustainability, and agility [37]. Adopting Knowledge Management (KM) techniques in risk management can facilitate academic researchers and practitioners better comprehending the risk management processes [37] against the evolving threat landscape of CIIs.
There is considerable research work of KM applications for risk management. For instance, Massingham (2010) [38] proposes a KRM model to differentiate amongst risks and reduce the cognitive bias inherent in traditional decision methods for risk assessment to improve its accuracy. Durst and Zieba (2019) [39], in their systematic and comprehensive review, identify state-of-the-art gaps in analyzing essential organizational risks along with their relations. They consider that the development of a knowledge risk taxonomy can be reasoned to improve risk awareness, to obtain a holistic view of organizational knowledge, to build a fruitful ground for expanding the research of KRM, and to offer a diagnostic tool for practitioners to better scrutinize their knowledge aspects. Lu (2019) [40] illustrates gaps in the MITRE’s ATT&CK adversarial behavior framework and mentions the lack of its hierarchical structure proposing OWL semantic language and reasoning mechanisms to populate domain-specific knowledge or solve instances of structural issues and syntactic errors. Concerning further semantic ontology contribution in the security domain, the ARGUS semantic framework has been proposed for storing data retrieved from existing sensors and extract information on assessing security risks [41].
The current attack simulation and evidence chain generation-proposed approach aims to facilitate knowledge representations of alternative attack paths that deepen the analysis of the technical components of CIIs and advance learning on the attack course and attacker’s characteristics. In this regard, it will facilitate the design and execution of joint/collaborative simulation experiments of various threat scenarios and security incidents to identify, analyze, model, and represent the course of a cyber-attack as it propagates across the CIIs. Such knowledge uptakes can leverage the decision-making of CII operators and inspire them to improve their defense and implemented security policies.

3. Applied Methods and Algorithms for Simulation and Evidence Chains Generation

This section aims to delineate all methods, algorithms, and techniques that have been adopted to support the proposed attack simulation and evidence chains generation approach.

3.1. Overview of Applied Methods and Algorithms

As described in the previous sections, the main objective of the attack simulation and evidence chain generation approach is to enable the representation, modeling, and evaluation of all possible attack paths and to identify chains of evidence related to real security events. For this reason, the approach employs a simulation environment that allows the design and execution of complex threat cases to identify, analyze, and model the technical aspects of a cyber-attack (e.g., course of the attack, attacker’s profile, the capability to implement attack paths, etc.) as it propagates across the CIIs’ network. To this aim, the cascading effects of a risk implementation can be evaluated through the production of all possible attack paths that would enable an attacker to reach one or more targeted assets from one or more asset entry points discovered. In this regard, the current approach adopts the Collaborative, Evidence-driven Risk Assessment methodology [42,43,44] which performs multi-order risk assessment, impact assessment, and provides dynamic decision support capabilities required for the identification, analysis, and assessment of risks, threats, and incidents, and the estimation of their impact on CIIs. The methodology can predict potential security incidents, mitigate and minimize the consequences of divergent security threats and their cascading effects in the most cost-effective way through the investigation of simulated scenarios and the generation, and scrutinize and model all possible attack paths and attack patterns following a Vulnerability Chains Discovery method [19,44].
The proposed attack simulation and evidence chains generation model aims to enhance the attack path generation process of this Vulnerability Chains Discovery method by estimating, producing, and prioritizing all potential attacks that match to specific confirmed events of a given predefined threat scenario according to the information retrieved from artifacts, such as Indicators of Compromise (IoC). To achieve this, it analyzes malware techniques and attackers’ behavior based on digital forensics. The current attack simulation and evidence chains approach utilizes algorithmic techniques of graph chains and interdependency graphs as well as mathematical and quantitative methods.

3.2. Adoption of a Multi-Order Risk Assessment

The adopted multi-order risk assessment empowers CII operators to identify and calculate risks, provide risk propagation, and analyze potential cascading effects over their CIIs in a holistic manner. The proposed approach implements the risk assessment methodology by utilizing mathematical modules, interdependency graphs, and quantification techniques that enable the execution of a bundle of automated processes and routines. In particular, these processes and routines capture and analyze all threats arising from CIIs interdependencies, quantify their cascading effects, and explore cyber-attacks’ course and features to mitigate and alleviate the consequences of divergent security threats. This is supported dynamically through a simulation environment and by deriving evidence-based knowledge of data acquired from online sources and repositories, such as NIST repositories and CAPEC attack patterns list. In this regard, forecasting techniques are used that implement Natural Language Processing (NLP) algorithms to heuristically select a basic set of keywords associated with the overall infrastructural topology and elicit data (i.e., CVE details) from Open Intelligence Sources (OSINT) using cloud-based techniques and Big Data analytics to tackle vast amounts of data and handle redundant information.
The adopted Evidence-driven Risk Assessment methodology relies on interdependency graphs, game theory, and percolation theory; it is built on a set of steps which are briefly described in the following. An analytical presentation of its steps can be found in [42,43,44].
The adopted methodology consists of the following sequential steps.

3.2.1. Asset Cartography and Modelling

Using process-centric and asset-centric approaches presented in [45], the under-examination scenario is analyzed according to the embedded business processes, business partners involved, and CIIs/assets operating for the execution of these processes. The implementation of this step delivers a cyber-asset inventory per involved organization engaging a set of characteristics for a cyber asset “An” (cf. Table A8, Appendix B), i.e., type of asset, vendor, version, etc., based on the CPE model of MITRE [46]. In addition, cyber-dependencies between assets are identified indicating their type of interdependency (1. hosting; 2. exchange data/information; 3. storing; 4. controlling; 5. processing; 6. accessing; 7. installing; 8. trusted; 9. connecting) and the access vector (Local/Adjacent Network/Network) which are further analyzed in [43,47]. Such identifications will allow the underlined cyber assets to be related to respective threats and vulnerabilities in the coming steps.

3.2.2. Threat Assessment

Threat scenario is assumed to be a use-case in which a threat can compromise an asset by exploiting vulnerabilities and weaknesses as well as taking advantage of the lack of adequate security controls. After developing an asset cartography, identification of individual cyber threats against each recorded cyber asset are recognized, according to business partners’ expertise and knowledge, existing cyber threat repositories, social media, and crowdsourcing exploitation. To implement this step, the CAPEC classification of MITRE [48] is adopted to synchronize the MITRE attack identifiers and associate the vulnerabilities that will be identified in the next step with one or more weakness identifiers. Afterwards, a threat assessment is conducted to estimate the expected probability of occurrence given a specific scenario utilizing the quantification method upon specific criteria (previous historical data, CII operators’ intuition, social engineering). A static asset map with threats using semantic frameworks and reasoning mechanisms is produced [45]. The outcome of this step is to provide a threat level for each scenario under examination to each identified asset and thus to increase CII operators’ threat awareness:
-
Threat “Ts” is considered all cyber threats, “s”, applied to the cyber asset “An. (cf. Table A8, Appendix B).
-
The Threat Level “TLs” of a cyber threat, “s”, is the expected probability of occurrence of the threat scenario under examination to the cyber asset “An”.

3.2.3. Vulnerability Assessment

The execution of this step provides individual vulnerability identification associated with the CII assets declared in the first step of asset modeling. All confirmed and unknown/undisclosed (zero-day) vulnerabilities are gathered in a list. This is accomplished by utilizing open data sources, such as adopting a CVE metamodel which illustrates the disclosed vulnerabilities, replicating all of them, and matching them with the identified assets of the first step through synchronization mechanisms and knowledge-based rules. In addition, unknown/undisclosed (zero-day) vulnerabilities can be declared and treated by CII operators. To quantify vulnerabilities, a set of metrics is considered according to CVE characteristics [49]. After confirmed and unknown (zero-day) vulnerabilities are identified the asset mapping process continues, the MITRE attack identifiers are synchronized, and the identified vulnerabilities are associated with one or more weakness identifiers. Then, a vulnerability assessment process takes place delivering individual, cumulative, and propagation values:
  • The individual vulnerability assessment measures the probability that an adversary can successfully reach and exploit a specific vulnerability (either confirmed or unknown) in a given asset. Using the CVSS 2.0 vulnerability severity metrics [50] and considering the implemented security controls, the severity of the identified vulnerabilities on the CII assets of the first step is estimated. The Individual Vulnerability level “VLv“ is the probability that an attacker can successfully reach and exploit a specific (confirmed or zero-day) vulnerability “v” in a given cyber asset “An” (cf. Table A8, Appendix B). The Individual Vulnerability level VLv is calculated considering the mapping of CVSS 2.0 exploitability metrics depicted in Table A1 of Appendix A.
  • The cumulative vulnerability assessment measures the Exploitation Level (EL) of the identified vulnerabilities (confirmed and unknown) considering the adversary’s individual actions to satisfy the preconditions required for the exploitation. In particular, it measures the conditional probability that an attacker can successfully reach and exploit each of the vulnerabilities identified in the previous steps (confirmed and unknown) in a given vulnerability chain. To accomplish this, the calculated individual vulnerability levels, the assets’ cyber-dependencies produced in the first step, and the attacker’s (adversary) profile are considered. The attacker’s profile relies on the attacker’s relationship with the organization (insider, outsider), attacker’s skills (ICT skilled, premature), and attacker’s target (level of damage aimed). Within this performance, a rule-based propagation and path construction reasoning approach is followed [42], aiming to generate the chain of sequential vulnerabilities on different assets that arise from consecutive multiple attacks starting from all possible asset entry points to exploit a series of vulnerabilities that could reach a specific asset target point.
  • The propagated vulnerability assessment estimates how deep into the network an attacker can penetrate in view of exploiting a series of vulnerabilities. Moreover, it measures the conditional probability that an attacker can successfully reach and exploit vulnerabilities (confirmed and unknown) identified in the previous steps in a given vulnerability dependency graph. Accordingly, in the propagated vulnerability assessment, a rule-based propagation and path construction reasoning approach is followed [42], aiming to generate the chain of sequential vulnerabilities on different assets that arise from consecutive multiple attacks starting from a specific asset entry point to exploit a series of vulnerabilities that could reach all possible asset target points.
Within this step, a Vulnerability Chains Discovery method [20] is followed to generate vulnerability chains and predict potential attack paths. The methodology investigates the exploitation of vulnerability chains through inferred attack paths to conduct vulnerability assessment and estimate the cascading effects of risk implementation and risk propagation. To predict attack paths and forecast attacks, features from collaborative filtering recommender (decision support) systems and attack path discovery methods analyzed in [51] are captured.

3.2.4. Impact Assessment

Similarly, the impact from the vulnerabilities exploitation on assets is estimated on individual, cumulative, and propagated values.
The individual impact assessment promotes a single estimation of the overall impact of a specific asset/vulnerability combination. The Impact Level “Iv” measures the effect that can be expected as a result of the successful exploitation of a vulnerability “v” that resides in asset “An” (cf. Table A8, Appendix B). On this account, the CVSS 2.0 Impact metrics Confidentiality, Integrity, Availability [50] are juxtaposed with a qualitative five-tier scale (i.e., “Very Low” (VL), “Low” (L), “Moderate” (M), “High” (H), “Very High” (VH)) as presented in [42]:
  • The cumulative impact assessment estimates the impact that occurs after a specific asset/vulnerability combination has been exploited by an attacker using any possible (asset) entry point. This is only related to the impact of this specific asset/vulnerability combination.
  • The propagated impact assessment illustrates the attacker’s intention to cause damage on the way at any asset/vulnerability combination. It is defined as the overall impact that takes place when an attacker exploits a specific asset/vulnerability combination and further moves on into the network starting from a specific (asset) entry point.

3.2.5. Risk Analysis

The risk metric “Rs” represents how dangerous all threats, “s”, are to the specific asset “An” [44] (cf. Table A8, Appendix B).
After collecting all Threat Levels “TLs” (Threat Assessment step), Vulnerability Levels, “VLv” (Vulnerability Assessment step), and Impact Values “Iv” (Impact Assessment step) for each identified asset “An” (Asset Cartography and Modeling step), the Risk Level “Rs” is estimated for every asset “An” for the threat, “s”, according to the general multiplication of risk equation:
Risk Level = Threat Level x Vulnerability Level x Impact Level
Rs = TLs, × VLv × Iv
This step produces:
  • Individual risk analysis, to estimate how dangerous a threat appears on a specific cyber asset;
  • Cumulative risk analysis, to estimate the risk exposure of the successful exploitation of multiple vulnerabilities, targeting a specific cyber asset starting from different (asset) entry points; and
  • Propagated risk analysis, to calculate how deep into the network an attacker may penetrate in case he/she successfully exploits vulnerabilities identified in (asset) entry points corresponding to threats.
The risk level can be calculated either in qualitative or quantitative values, following the Probability Scale of Table A2, Appendix A.

3.2.6. Defense and Risk Mitigation

The inferred attack path constructions performed during the vulnerability assessment (which are enhanced and further analyzed in the proposed approach) produced vulnerabilities chains to estimate the risk exposure of the under-examination CII assets. Within this framework, CII operators are guided by indications for the most effective security controls, following a rational analysis and optimization practices, to minimize as far as possible the expected damage. Moreover, a zero-sum game approach of a worst-case scenario is followed, considering the attacker is oriented to cause as much damage as possible [47]. In particular, an attacker-defender scenario is addressed by:
  • The strategies of the players (attacker/defender): a characterization of what actions both players can undertake; and
  • The payoffs for each scenario: an assessment of the damage occurring to the defender for each combination of attack and defense strategy.

4. The Attack Simulation and Evidence Chains Generation Approach

This section is the core component of the current work. At first, an overview of the approach is illustrated. Afterwards, the attack simulation and evidence chains generation model is extensively illustrated following a step-by-step structure.

4.1. Overview of the Approach

The attack path discovery algorithms described in the previous section compute and deliver all possible attack paths an adversary could follow across all potential asset entry points. Moreover, such algorithms are also able to estimate all the cascading effects and all possible attack paths arising from a specific vulnerability in a given entry point to show how deeply the adversary is able to penetrate the system. Nevertheless, they lack the ability to deliver the specific attack paths that concern chains of evidence linking to real security events.
The incident-related information that resides in different and heterogeneous cyber systems may include various types of data, i.e., active/unpatched vulnerabilities in the technological infrastructure; misuse detection in the network or in the systems, including both Host-based Intrusion Detection System (HIDS) and Network-based Intrusion Detection System (NIDS) deployment and integration; anomaly detection in the network or in the systems; system availability signals; network usage and bandwidth monitoring; industry proprietary protocol anomalies; supervisory control and data acquisition (SCADA) [43]; ICT vulnerabilities; etc.
In this vein, the proposed attack simulation and evidence chains generation approach will enhance the calculation of the utilized attack path discovery algorithm in terms of computing all possible attack paths an adversary could follow in relation to a specific confirmed event that can be identified from various sources (i.e., log files, network traffic analysis). This raises research investigation into how to reconstruct attack paths, rebuild their timeline, and prioritize them according to specific confirmed events.
The current approach can represent various cyber-attack patterns according to different security incidents within the CIIs generating multi-order evidence dependencies. Furthermore, it will scrutinize the inherent relationships between devices and evidence and represent a timeline of the incident, engaging a map of affected devices and an evidence chain model comprising credible and meaningful chains of evidence. In this manner, the proposed approach can leverage the computation of the adopted risk assessment approach with such evidence which will facilitate the rational analysis. Taking into account all received incident-related information, the Attack Simulation and Evidence Chains Generation model will estimate the cascading effects of various cyber-attack patterns and security incidents of the CIIs. By utilizing novel processes of near real-time identification of anomalies, threats, and attacks, abnormal behaviors and malicious activity that match the structural patterns of possible intrusion on the cyber assets will be recognized and ongoing attacks will be identified along with attack related information indicating the status of the attack and the attacker’s location. Once the cyber-attack is identified, a simulation process will be performed to reconstruct the attack scenarios and represent the linked evidence. This attack path regeneration will enable deep evaluation performance of the underlying vulnerabilities to detect where the attack is heading and eventually to identify the entry and target points of the attack.
To address such case, a calculation of all the attack paths that are related to the specific asset or assets according to the evidential data derived from a variety of sources will be carried out, delivering payoffs that match to the predefined scenario and produce secure, credible, and valid chains of evidence.
The proposed approach will be capable of identifying how an attacker has moved inside the infrastructure and further scrutinize their malicious activity. In this context, it can provide valuable insights on a cyber-attack’s course and therefore it could drive the CII operators and decision-makers to handle the incident effectively and formulate their incident response processes in an efficient manner.
An overview of the Attack Simulation and Evidence Chains Generation model is depicted in Figure 1.

4.2. Step-by-Step Analysis of the Approach

As described in the previous section, the current approach aims to enhance the Vulnerability Chains Discovery method, described in the risk assessment process of Section 3, with the re-construction of all possible attacks paths to generate chains of evidence that lead to specific confirmed security events. The proposed model which classifies and calculates the attack paths to create and represent knowledge of evidence chains is divided into consecutive steps presented as follows.

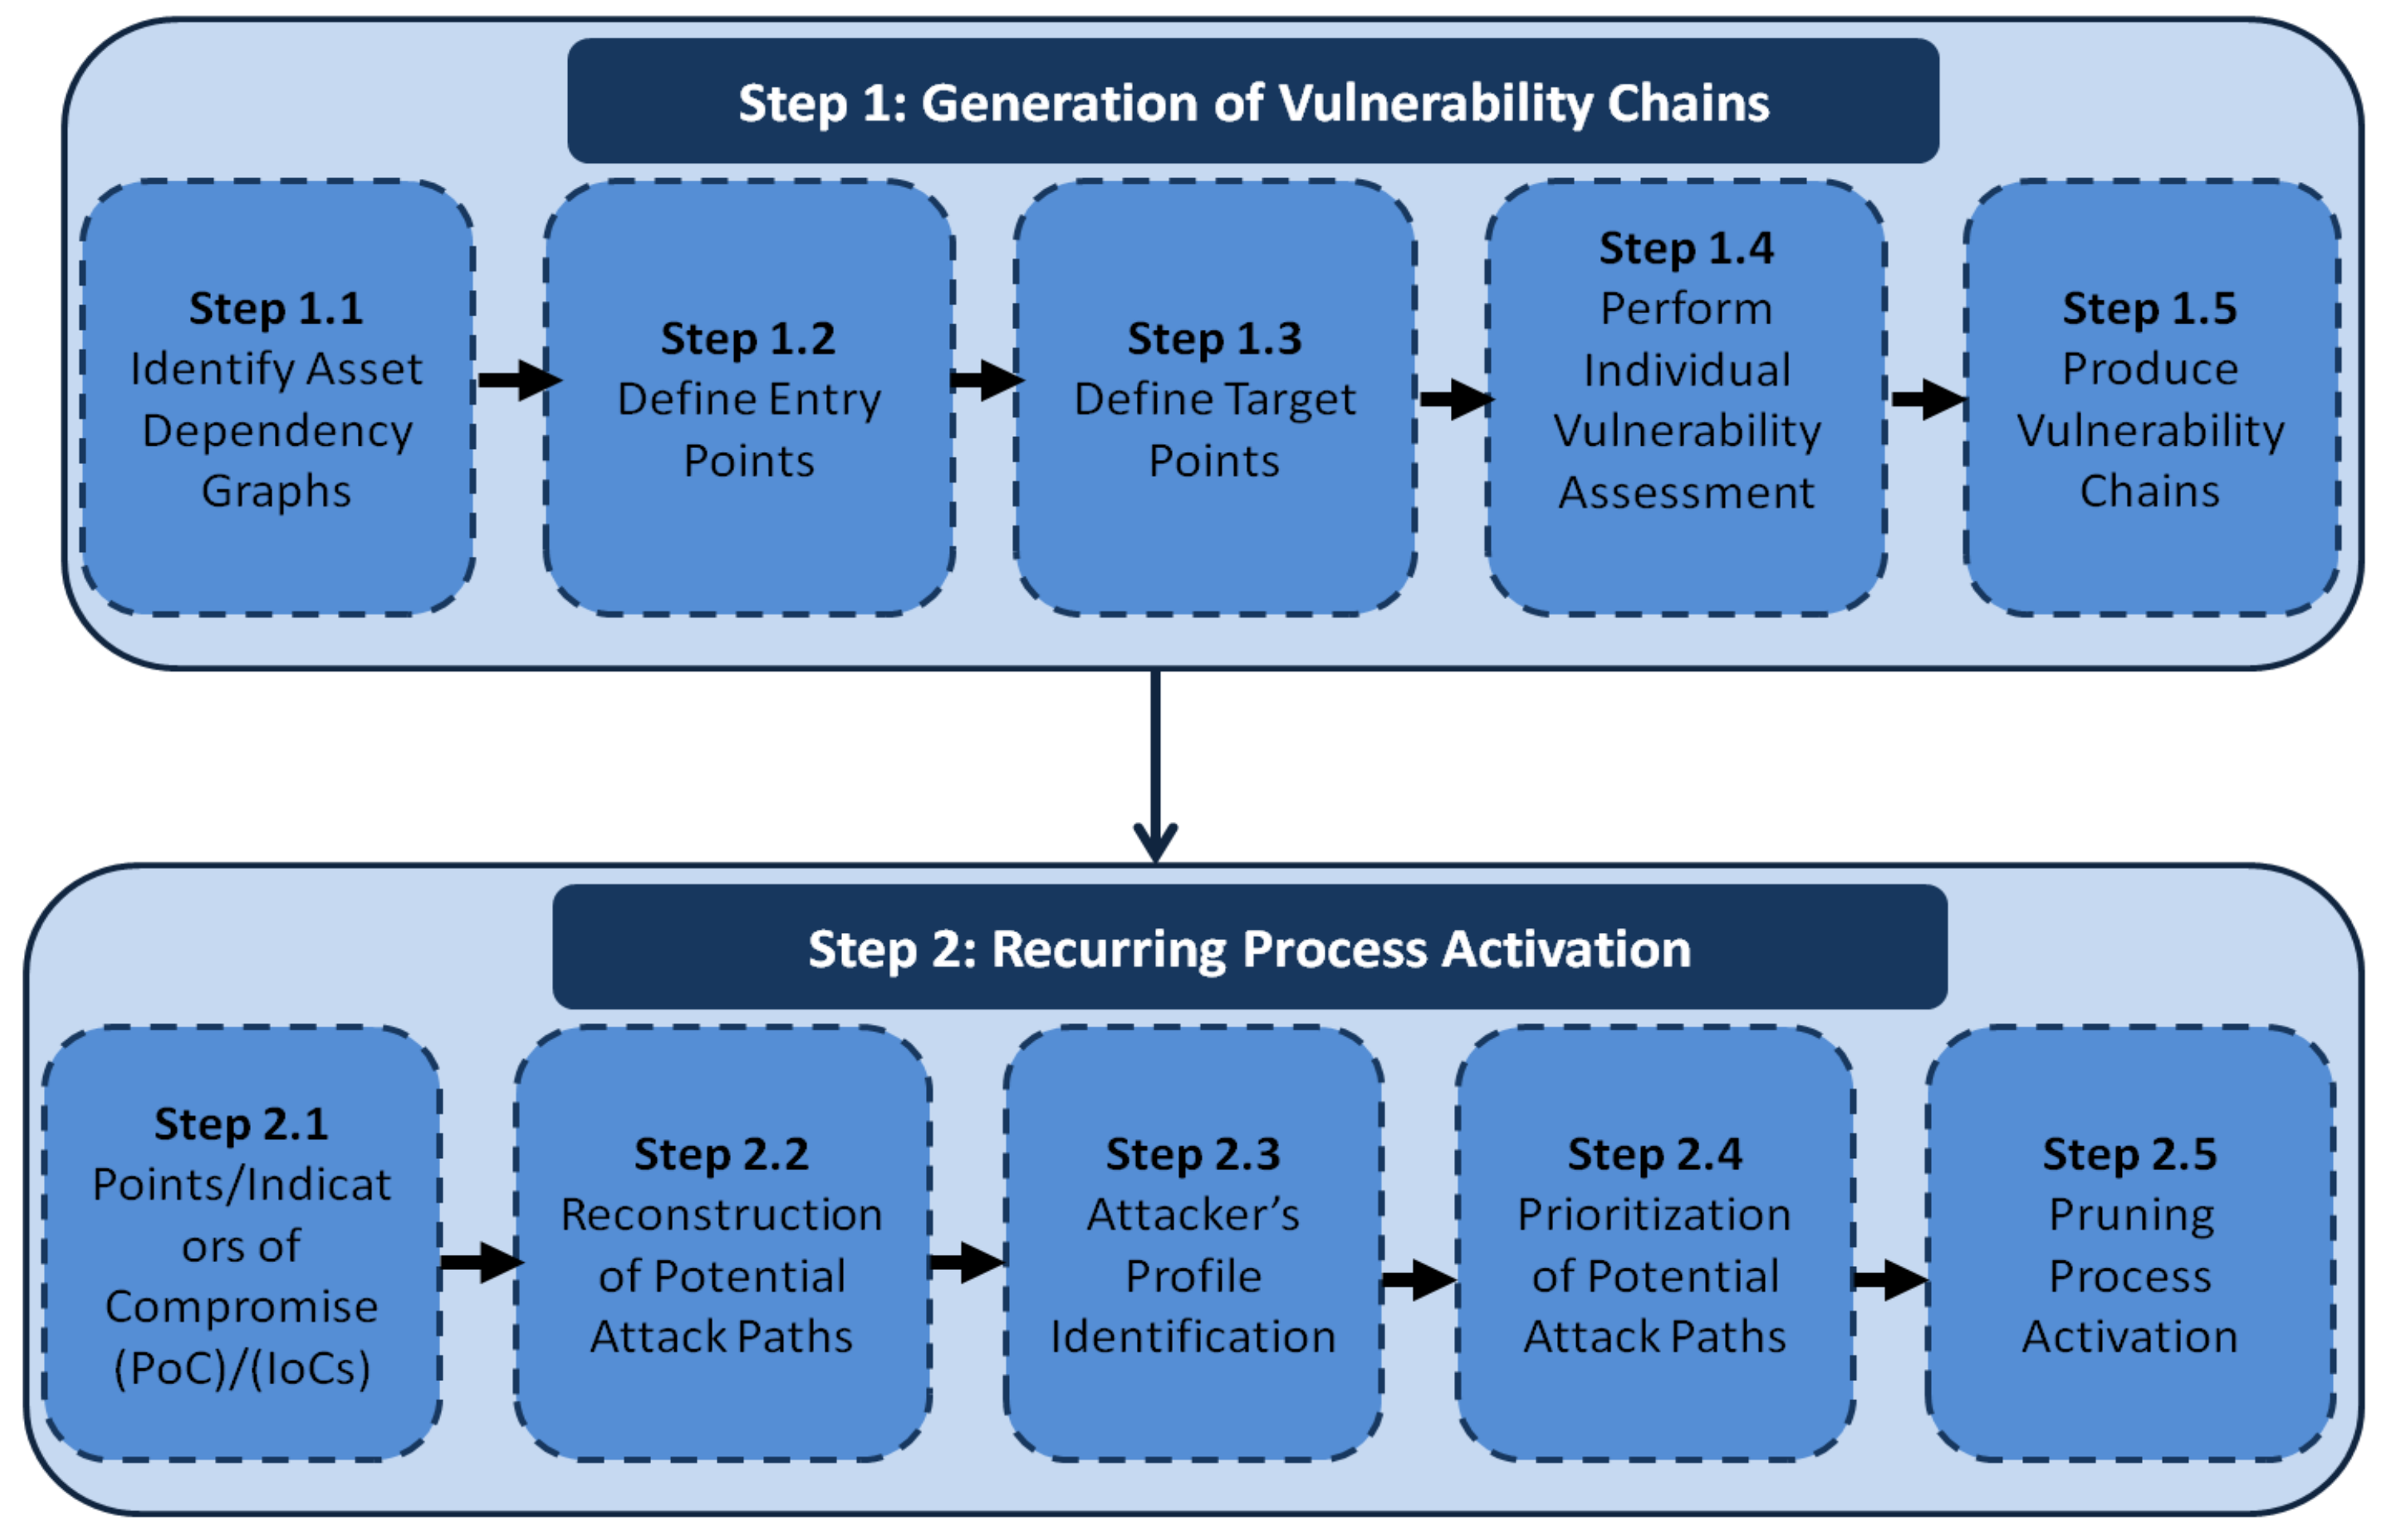
4.2.1. Step 1: Generation of Vulnerability Chains

The attack path discovery and development algorithm follows the steps and tasks of the Risk Assessment methodology related to the “Asset Cartography and Modeling”, “Individual Vulnerability Assessment”, and the Vulnerability Chains Discovery method [20], presented in Section 3. Moreover, it is implemented to reproduce attack paths in order to provide all vulnerability chains whose exploitation can lead to possible attack paths on given cyber-dependent assets. The attack path discovery relies on unique characteristics, i.e., assets dependency graphs (step 1.1), to calculate all possible non-circular paths attackers could undertake to implement an intrusion. CIIs incorporate a number of dispersed nodes that can be exploited by adversaries to infiltrate a system. Depending on the number of vulnerabilities that can be identified in a communication network and how reachable they are, the size of the attack graphs may differ [51]. Namely, as the exploitation capabilities increase, the attack graph is able to expand. The attack graphs are constructed using security information from online repositories, such as the Common Weakness Enumeration (CWE) [48] and the Common Vulnerabilities and Exposures (CVE) [49].
The algorithm that discovers and analyzes all potential attack paths on CIIs for complex attack scenarios given a specific asset cartography adopted by the attack simulation and evidence chain generation approach is presented through subsequent steps, analyzed in [20,45]. As the Vulnerability Chains Discovery method does not calculate all possible attack paths that match to specific confirmed security event, the method is implemented only to generate a list of vulnerability chains (potential attack paths) and to estimate the Individual Vulnerability Level (IVL), described in Section 3. The steps to accomplish this are set as follows.

4.2.2. Step 1.1: Identify Asset Dependency Graphs

The current step relies on the Asset Cartography and Modeling corresponding step of the risk assessment methodology (illustrated in Section 3). In this step, assets are identified, analyzed, and modeled to identify asset characteristics (e.g., asset category, asset vector, version), asset cyber-dependencies, according to specific types of interdependencies (1. hosting; 2. exchange data/information; 3. storing; 4. controlling; 5. processing; 6. accessing; 7. installing; 8. trusted; 9. connecting), and the Access Vector (AV) (Local, Adjacent Network, Network) to develop an asset inventory of an organization and design asset dependency graphs. Detailed description and analytical examples of the application of the above assets’ characteristics and relations on real-life scenarios have been illustrated in previous works [43,45].

4.2.3. Step 1.2: Define Entry Points

Security operators must identify assets that can be highly approachable by adversaries to initiate an attack, considered as entry points.

4.2.4. Step 1.3: Define Target Points

Security operators must identify the most “attractive” assets (critical) for attackers to intrude, considered as target points.

4.2.5. Step 1.4: Perform Individual Vulnerability Assessment

The Individual Vulnerability Level (IVL) estimates the probability an adversary can successfully reach and exploit a specific (confirmed or zero-day) vulnerability “v” on a given asset “An”. Using the CVSS 2.0 score Exploitability Metrics [50], namely the Access Vector (Local/Adjacent/Network), Access Complexity (High/Moderate/Low), and Authentication (Multiple/Single/None) and concerning the implemented security controls, the Individual Vulnerability levels of all identified vulnerabilities on the CII assets are estimated. The IVL for each identified vulnerability is calculated considering the mapping of CVSS 2.0 exploitability metrics, depicted in Table A1 of Appendix A.

4.2.6. Step 1.5: Produce Vulnerability Chains

Adoption of a rule-based reasoning approach (filters) presented in [51] which implements the attack path generation algorithm described in [20] to produce the chain of sequential vulnerabilities on different assets that arise from consequential multi-steps attacks, initiated from all Entry Points in order to exploit the vulnerabilities of all possible Target Points.
The Individual Chain Vulnerability Level (ICVL) measures the probability that a vulnerability “z” which resides in an Asset Target Point “”can be exploited given the specific kth-Vulnerability Chain C originated from an Asset Entry Point “Am” with vulnerability “v”.
The proposed Attack Simulation and Evidence Chains Generation approach aims to identify all possible attack paths that are linked to the specific security event that has been detected. The current step builds all possible vulnerability chains in general either from a given asset entry point or a given asset target point. Incident-related information is analyzed in the next step (Step 2.1) and considered for the attack path re-construction to capture only the attack paths related to the specific security event (Step 2.2).

4.2.7. Step 2: Recurring Process Activation

To implement the current step, the Attack Simulation and Evidence Chains model follows the developed algorithmic process, presented below.

4.2.8. Step 2.1: Points of Compromise (PoC) and Indicators of Compromise (IoCs)

Analyze artifacts, such as Indicators of Compromise (IoCs), which can be considered as digital evidence of potential attacks on a system or network, to gather security knowledge regarding the intrusion attempts detected or other malicious traffic or activities. A deep analysis is carried out on these indications provided (i.e., incident alerts that are raised along with the respective notifications, lateral movement, or data exfiltration) to explore which parts of the underlined infrastructure have been compromised, namely to identify the Points of Compromise (PoC) and elicit information on the particular intrusion technique and malicious behavior.

4.2.9. Step 2.2: Reconstruction of Potential Attack Paths

Once all the security data have been explored and correlated, the obtained information is used to reconstruct the potential attack paths according to the analyzed IoC. Attack paths that do not match with the received indications are erased. With respect to the reconstructed attack paths, all vulnerability chains that are linked to the IoC are generated.

4.2.10. Step 2.3: Attacker’s Profile Identification

The attacker’s profile is identified by the attacker’s location (local/adjacent/network), the attacker’s capability (very low/low/moderate/high/very high) due to specific characteristics, i.e., expertise, available resources, and opportunities (shown in Table A3 of Appendix A), meaning the likelihood of an attacker to perform a cyber-attack or a sequence of cyber-attacks relies on these characteristics, and the attacker’s target (can be either a specific asset or cause general harm).
Within this step, the computation of Exploitation Levels and Exploitation Level Chains is provided.
To estimate the exploitability of the potential attack paths remained from the reconstruction process of step 2.2, the attacker’s capability along with the Individual Vulnerability Level (IVL) will compute the Exploitation Level “ELv” of an identified vulnerability v on an asset An, as described in the “Vulnerability Assessment” step of Section 3. This is achieved by consulting Table A4 of Appendix A which maps the IVL onto the attacker’s capability. The gained values are used to build the Exploitation Level Chains (ELCs).
ELCs are considered a sequence of exploitation levels “ELv” of individual vulnerabilities “v” on specific asset/vulnerabilities combinations, related to an IoC. The ELC is used to calculate the exploitability probability. A multiplication operation is performed to illustrate how a set of Exploitation Levels are mapped onto new levels [42].
ELC = EL1 × EL2 × … × ELv, v ∊ Ν
Exploitability Probability is the likelihood “P” of exploitation of a specific attack path given a specific IoC, where PIoC = 1. The outcome is a quantitative value.
The exploitability probability is calculated, the quantitative value is converted to a qualitative value using Table A2 of Appendix A, to estimate the Attack Path Exploitability Level (APEL). The APEL illustrates in a qualitative value the level of exploitation for a given attack path towards a specific confirmed event with a specific IoC.

4.2.11. Step 2.4: Prioritization of Potential Attack Paths

The current step relies on the specific attacker’s profile (i.e., capability, location through the network) identified in step 1.3. All assets from the graph that the attacker does not have the ability or the access required shall be erased. Attack course is reconstructed and asset entry and asset target points are identified for each given attack path. In this regard, all possible evidence chains that match to the confirmed incident are prioritized according to the worst-case scenario, to the greatest impact (security, financial, environmental) the assets compromization can cause harm to the interconnected CIIs and the organization, which reveals from categorizing the identified attack paths from highest to lowest APEL.

4.2.12. Step 2.5: Pruning Process Activation

Since the attacker’s profile and APEL are identified, these two metrics are mapped to specify the attacker’s exploitation capacity towards a given attack path. The attacker’s capability is related to a set of characteristics, presented in Table 1 and Table A3 of Appendix A, i.e., knowledge/expertise, available resources, and opportunities required to exploit a single or a sequence of vulnerabilities. Thus, an attacker with low knowledge/ limited available resources and opportunities is not capable of successfully conducting complex and advanced cyber-attacks which have low exploitability potential. As a result, the following mapping is developed (Table 1):
Eventually, the prioritized attack paths are reviewed and evaluated against the attacker’s exploitation capability and less important paths are pruned. The remaining attack paths are capable of addressing the given confirmed event and credible evidence chains are generated. The results can be further explored and guide the CII operators to set recommendations, to undertake an effective incident response handling policy that could either address or mitigate the effects of the incident.
The subsequent steps of the proposed approach are visualized in Table 2 along with the corresponding tasks, construction, and semantic rules applied in the current algorithmic process.

5. Application of the Evidence Chain Generation Approach

This section illustrates the evidence chains generation approach, described in Section 4, via a simplified business scenario. The scenario selected is close to real life and aims at demonstrating the proposed model, and validating the approach by checking the applicability.
The scenario refers to the maritime transport industry and implements a process that is executed during the performance of the General Cargo Transport Service. The Service relies on the transportation of the general cargo from a port of origin to the destination port, including loading/unloading procedures and inbound/outbound logistics to deliver the cargo to the final consumer. A critical document during cargo transportation is the Standard Cargo Manifest which includes all the information related to a vessel and the cargo transported though this vessel. Suppose a Ship Agent sends a Standard Cargo Manifest request to the Port Authority.
These communications are accomplished using the Port Community System (PCS), which provides the users a client application to launch the service rapidly and be able to fulfil the requirements to send documentation electronically to the involved entities. The port operator of the Port Authority who handles the current transaction with the Ship Agent (through the PCS) uses also other web services to implement port activities (i.e., Customs Clearance).
The Port Authority’s assets that are operating in the current scenario are the following:
A Web Application for the Standard Cargo Manifest request (A1) hosted on a Web Server (A2) which is installed on the PCS Operating System (A3). Customs Clearance is supported by another Web Service (A4) of the Port Authority which is also hosted on the Web Server (A2). A Database Server (A5) stores the PCS data and is installed on the PCS Operating System (A3). The Database Server (A5) exchanges information with the Standard Cargo Manifest request Web Application (A1). When the Ship Agent sends the Standard Cargo Manifest request, relevant data are stored on the Database Server (A5).
The Port Authority assets communicate with various port stakeholders (e.g., the Ship Agent, Vessels, Customs, etc.).
Assuming that the Port Authority has activated the presented risk assessment process, during the vulnerability assessment process, the proposed model is implemented to assess vulnerabilities and estimate their exploitation. The steps of the proposed approach are implemented consequently, utilizing tasks and rules presented in Table 2 and described in the following.

5.1. Generation of Vulnerability Chains (Step 1)

In the current step, the Vulnerability Chains Discovery method is activated (step 1.1-step1.5) to generate all possible vulnerability chains that are potential attack paths. To generate vulnerability chains, the first and third steps of the Risk Assessment methodology must be implemented (Asset Cartography and Modeling and the Vulnerability Assessment in terms of generating vulnerability chains).

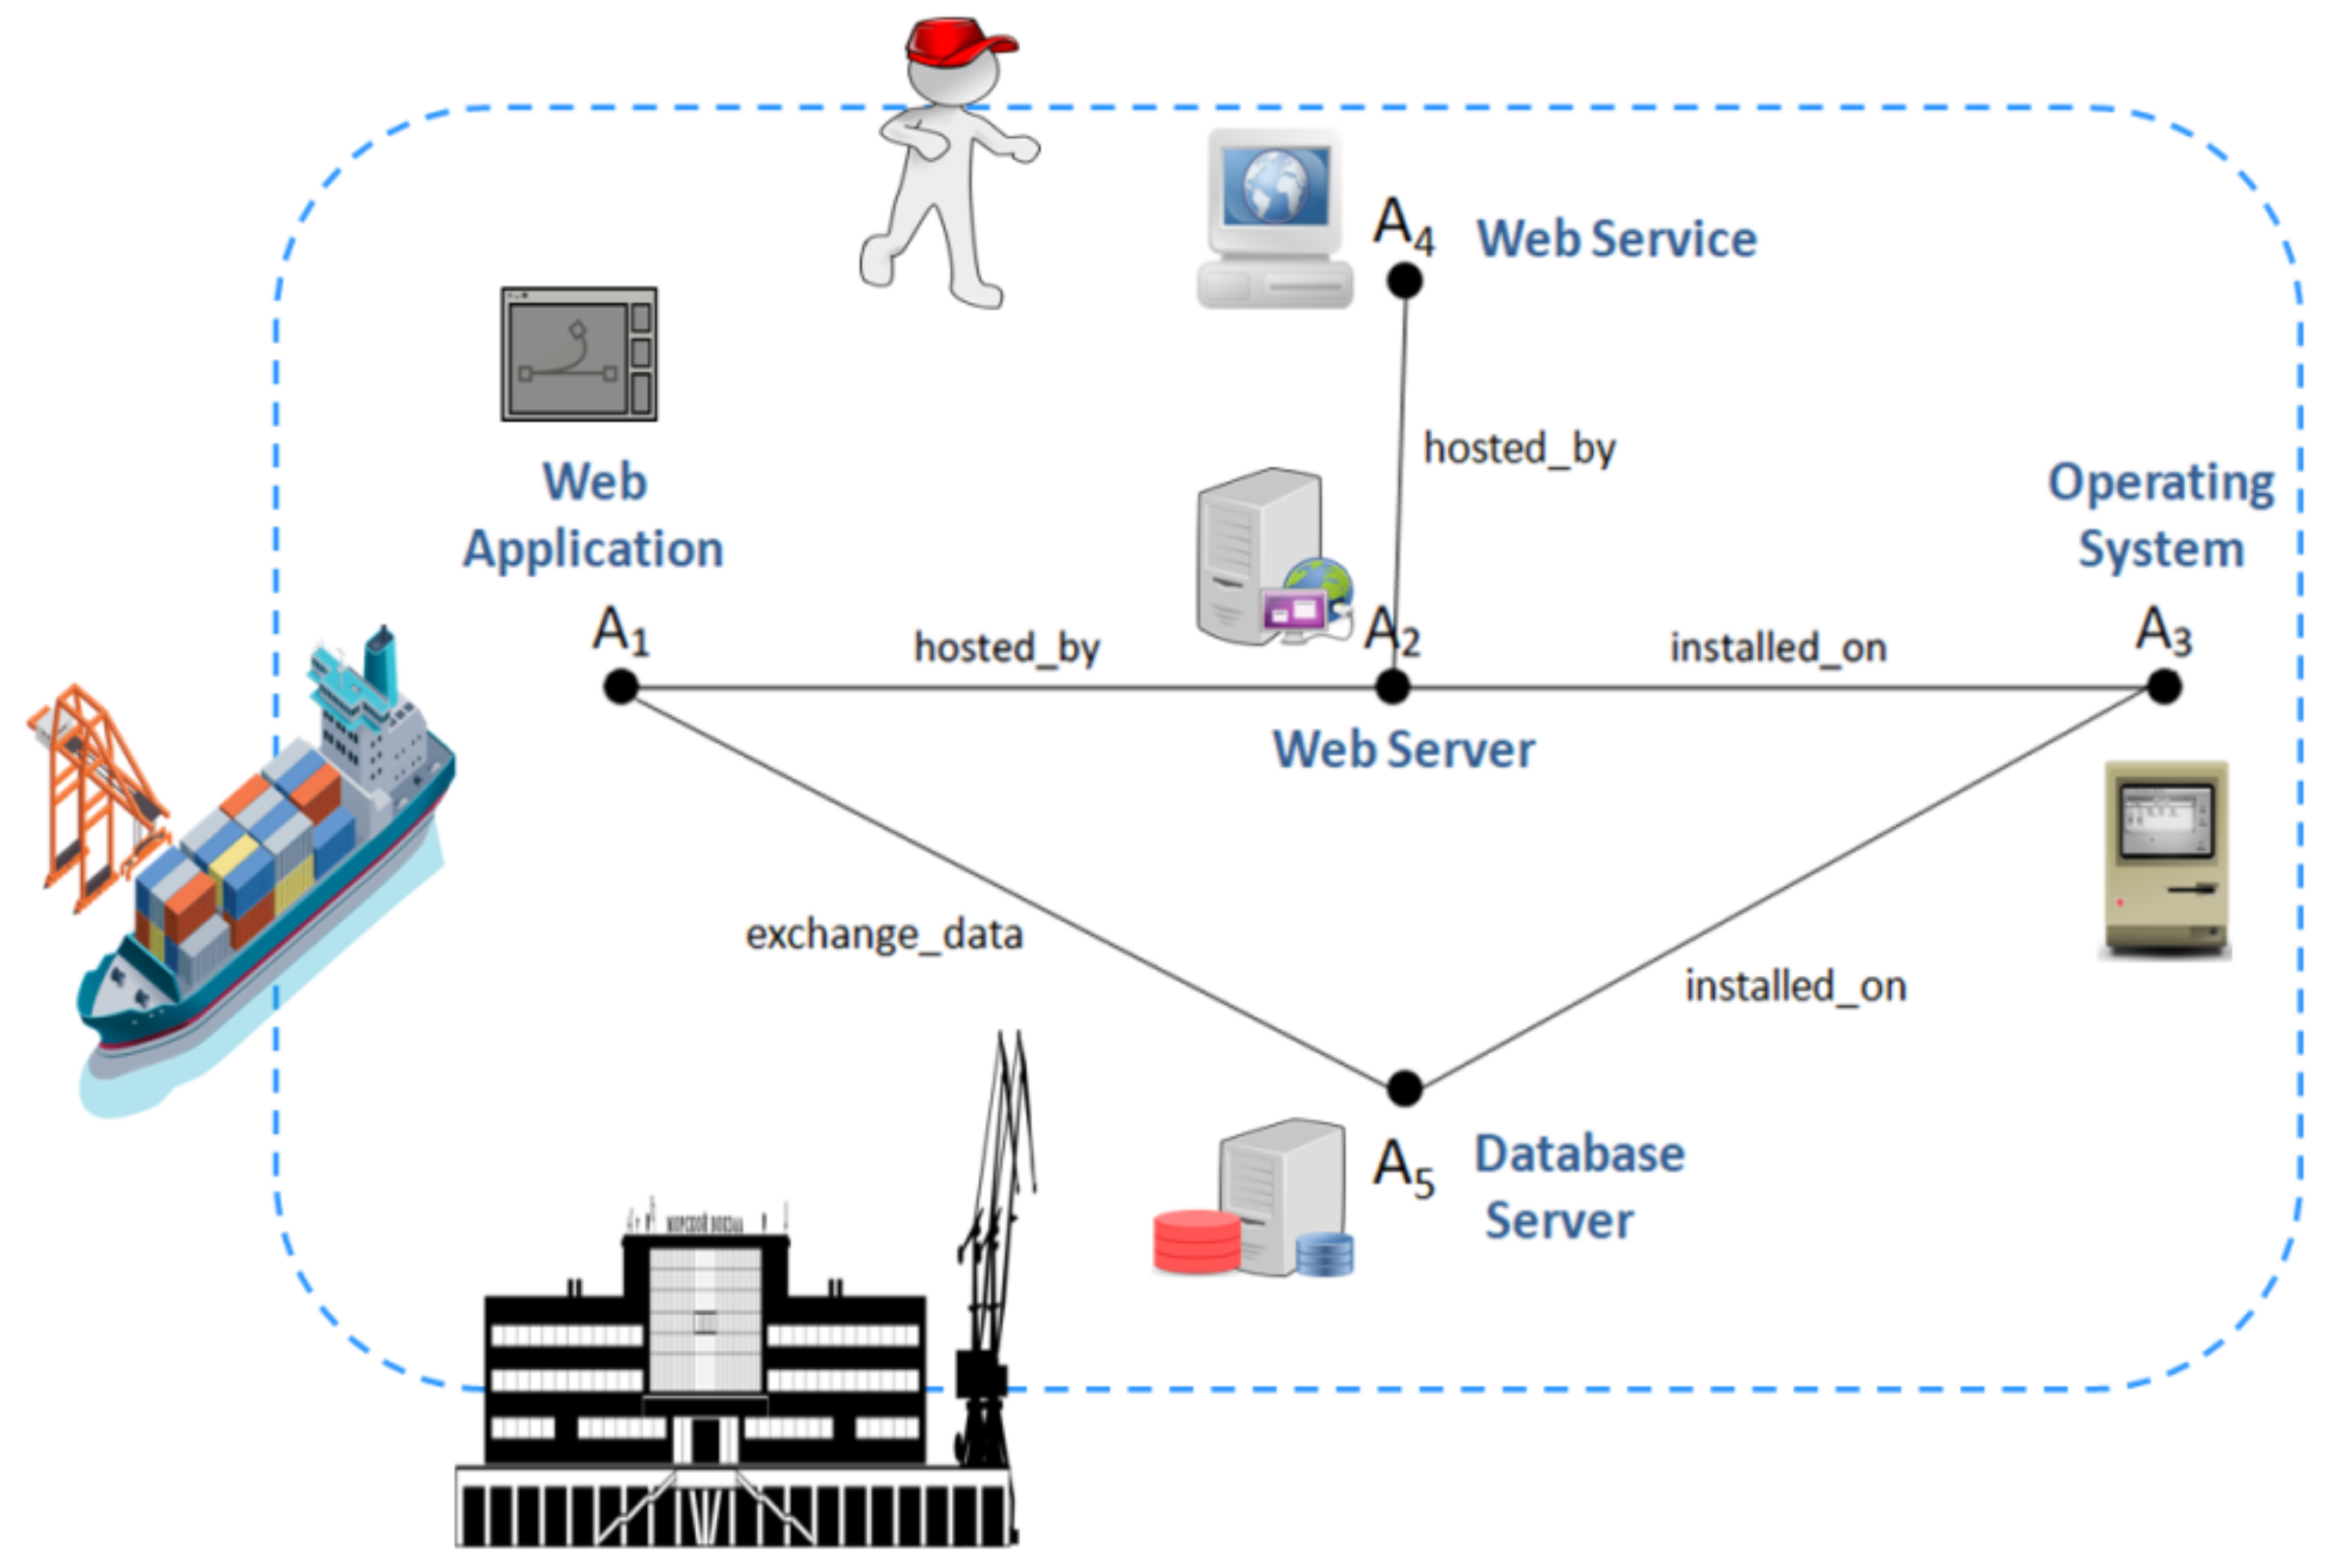
5.1.1. Identify Asset Dependency Graphs (Step 1.1)

According to the first step of the methodology, asset modeling is performed. The engaged assets are presented in Table 3 along with their cyber-dependency types in asset pairs (cf. Step 1.1, Section 4).
A visualization of the assets cyber-dependencies can be viewed in the developed asset dependency graph of Figure 2.

5.1.2. Define Entry Points (Step 1.2)−Define Target Points (Step 1.3)

According to the developed assets cyber-dependencies, CII operators of the Port Authority define Asset Entry Points (Step 1.2) and Asset Target Points (Step 1.3) that are considered critical to be examined.

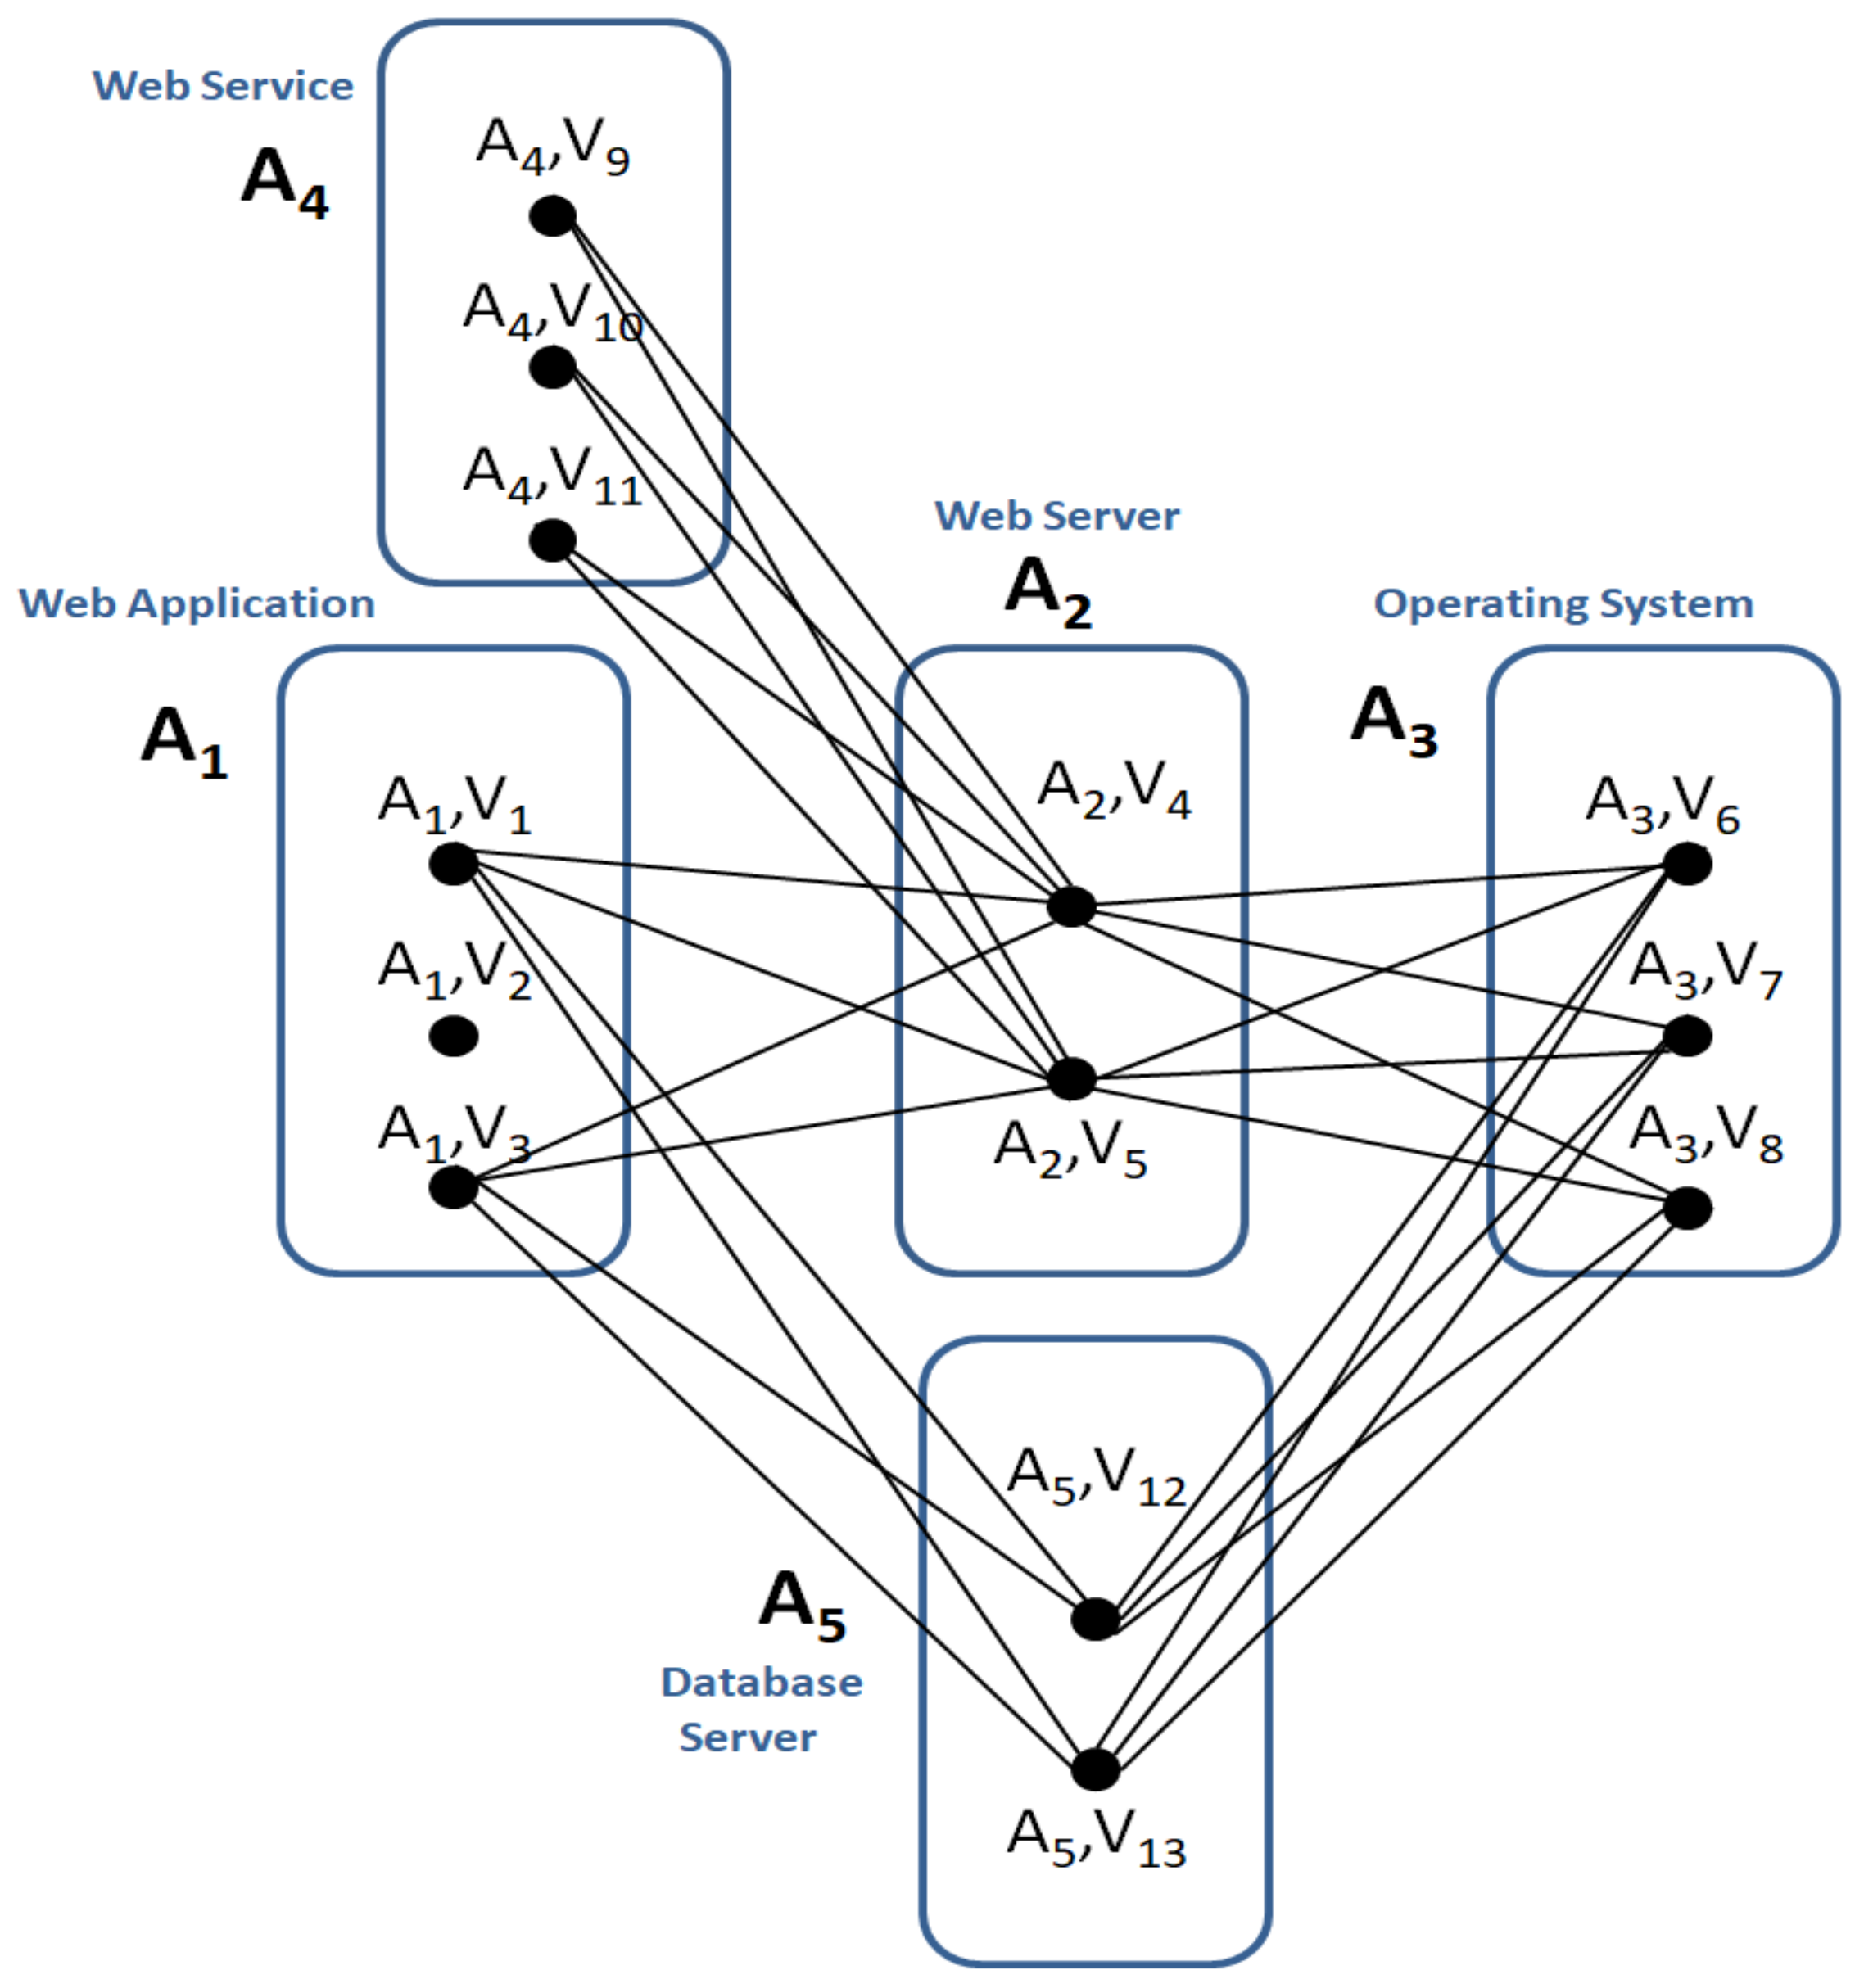
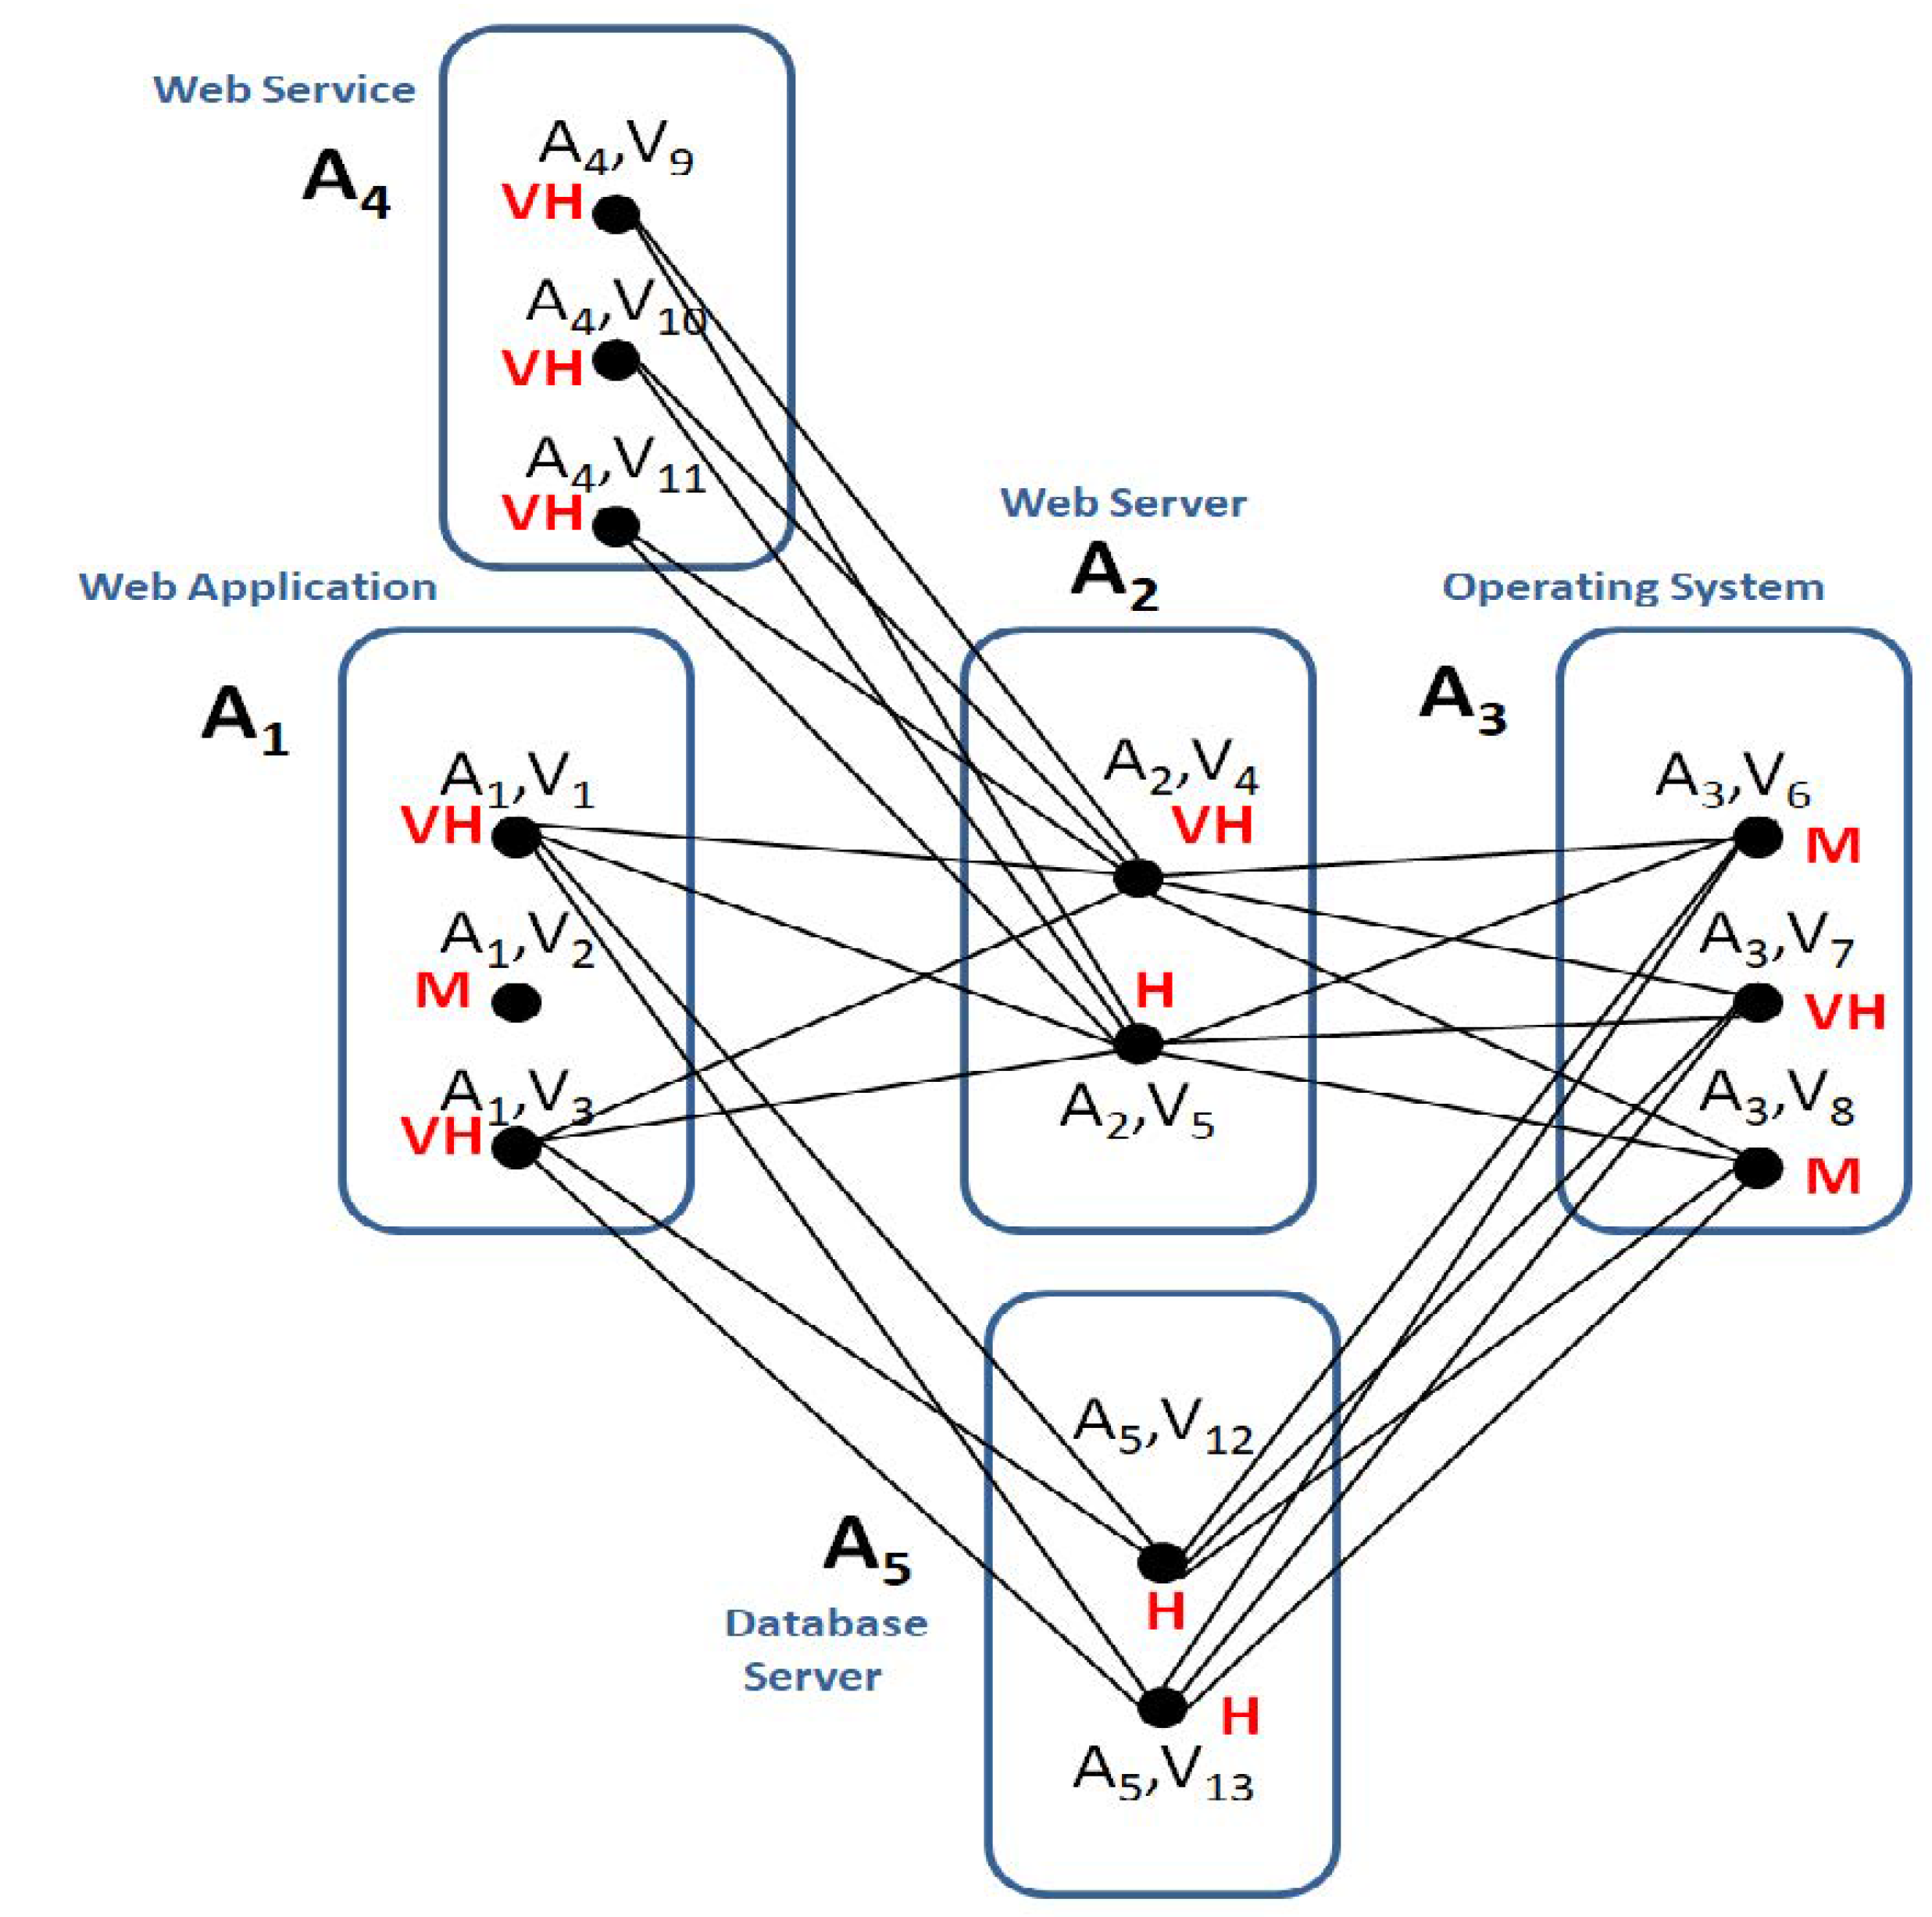
5.1.3. Perform Individual Vulnerability Assessment (Step 1.4)

In the current scenario, thirteen vulnerabilities (confirmed and unconfirmed) are detected among those assets as follows:
  • three vulnerabilities (V1,V2,V3) are identified on asset A1,
  • two vulnerabilities (V4,V5) are identified on asset A2,
  • three vulnerabilities (V6,V7,V8) are identified on asset A3,
  • three vulnerabilities (V9,V10,V11) are identified on asset A4, and
  • two vulnerabilities (V12,V13) are identified on asset A5.
According to the CVSS 2.0 score metrics [50] (referred in Section 3), the thirteen identified vulnerabilities (V1, V2, …, V13) along with their attributes are presented in the following Table 4 with respect to the corresponding asset.
Then, the Individual Vulnerability Level (IVL) is estimated upon these asset/vulnerability combinations, according to what has been described in the Vulnerability Assessment corresponding step of the Risk Assessment methodology in Section 3.2. Moreover, taking into account the Access Vector, Access Complexity, and Authentication policy vulnerability attributes of Table 4 and the matrix of mapping the CVSS Exploitability to the IVL, displayed in Table A1 of Appendix A, the IVL is estimated on a qualitative nature of a five-tier nominal scale, which is reflected by the probability scale of Table A2 of Appendix A. For each asset/vulnerability combination (illustrated in Figure 3), the IVL is calculated and depicted in Figure 4, whereas it is enlisted in Table 5. For instance, the probability an attacker successfully reaches and exploits the vulnerability V10 of asset A4 is “Very High”.

5.1.4. Produce Vulnerability Chains (Step 1.5)

At this point, considering the graph of Figure 4, a great number of possible sequential vulnerability chains can be generated. For instance:
  • the V1 → V5 → V6 vulnerability chain for A1,V1 → A2,V5 → A3,V6 asset/vulnerability combinations,
  • the V5 → V7 vulnerability chain for A2,V5 → A3,V7 sequence of asset/vulnerability combinations,
  • the V9 → V4 → V6, vulnerability chain for A4,V9 → A2,V4 → A3,V6 asset interdependency chain, etc. ….
According to the above and taking into account Table 4 and Table A1, the IVL is calculated as presented in Table 5.
The Vulnerability Chains Discovery algorithm of step 1 of the current approach, presented in Section 4.2, is executed and all vulnerability chains are developed to illustrate potential attack paths. All generated vulnerability chains of the current scenario are depicted in Figure 4 and the exhaustive list of these chains is shown in Table A5 of Appendix A. Reviewing Table A5 of Appendix A, from 13 vulnerabilities that have been identified, 84 vulnerability chains are generated, which can be potential attack paths in case of being exploited by an adversary.

5.2. Recurring Process Activation (Step 2)

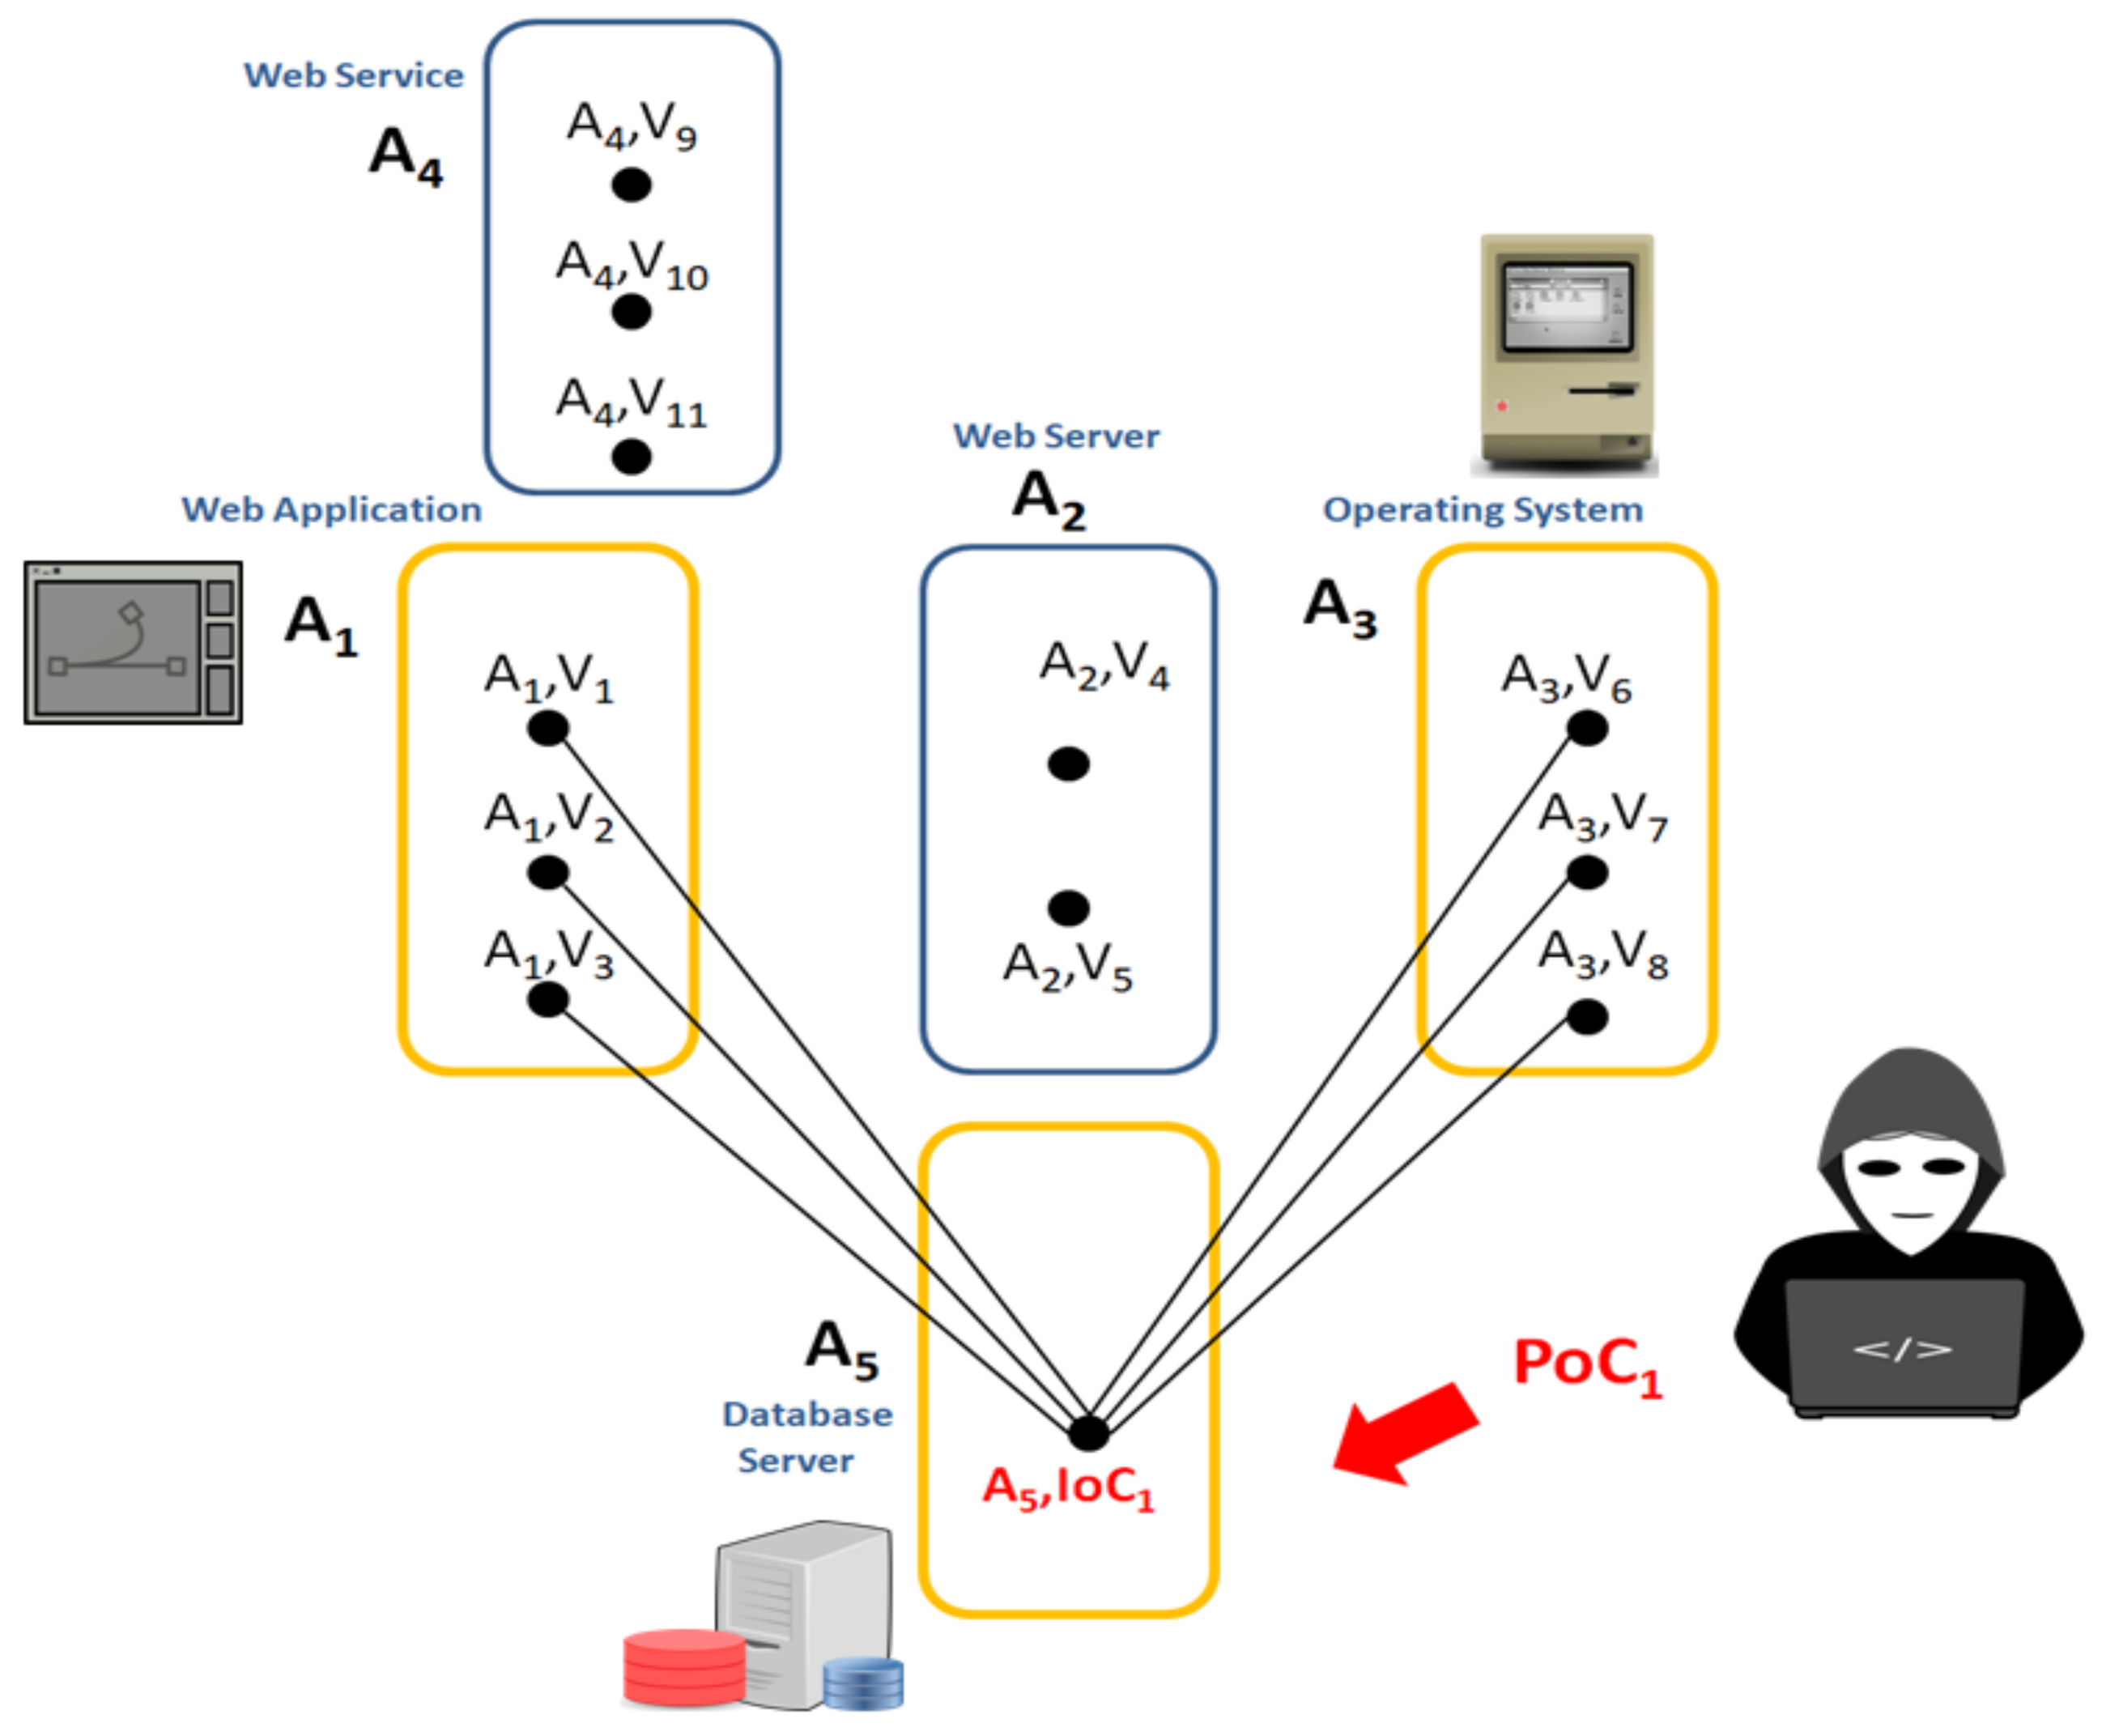
5.2.1. Points of Compromise (PoC) and Indicators of Compromise (IoCs) (Step 2.1)

Within this step, cyber threats are detected on the defined asset network and the IoC is analyzed. In particular, in the current scenario, an unauthorized access to the Database Server (asset A5) was detected from an analyzed log file. This log file took into consideration the specific IoC, IoC1, that uncovered the threatening activity that evidenced the compromization of the specific Database Server (A5) for which the specific PoC has been identified.
This case enfolds a confirmed event of a cyber-attack. To discover and produce the potential cyber-attack paths for the compromised asset A5, a simulated scenario will run only for the assets that are cyber-dependent with the PCS Database Server (A5). In relation to what has been described in the current scenario, all possible asset cyber-dependencies related to the compromised asset A5 are written down and shown in Table 6. According to Table 6, in the current scenario the PCS Database Server is cyber-dependent with the Standard Cargo Manifest Application (A1) and the Operating System (A3). Figure 5 delineates all potential cyber-attack paths that link the compromised PCS Database Server (A5) with the Standard Cargo Manifest Web Application (A1) and the PCS Operating System (A3) concerning the specific identified IoC1. The A5,IoC1 combination symbolizes the PoC on the PCS Database Server (A5).

5.2.2. Reconstruction of Potential Attack Paths (Step 2.2)

The potential cyberattack paths are reconstructed according to the received evidence of the compromised PCS Database Server (A5). In particular, all redeveloped attack paths, related to the PoC1, where PoC1 = A5,IoC1, are presented in Figure 5 and listed in Table 7.
The Asset Interdependency Chains shown in Table 7 are considered asset/vulnerability combinations that involve the compromised PCS Database Server (A5) according to the evidence found from IoC. If we compare the results of Table A5, Appendix A, retrieved from Step 1.5 and the results of Table 7 derived from Step 2.2, we notice that the previously 84 developed Asset Interdependency Chains are now limited to 30. On this account, the 84 potential attack paths, identified in Table A5, Appendix A of Step 1.5 (Section 5.1), have been redeveloped to 15 potential attack paths and displayed in Table 7. This means that 70 attack paths are now left considering the results of Table A5, Appendix A, some of which were erased as they were not related with the infected PCS Database Server (A5) and some others were shrunken/merged because the likelihood of exploitation of all vulnerabilities that reside in the infected asset is 1: probability PIOC = 1 as the asset has already been compromised.
Hence, the two potential attack paths
A1,V1 → A5,V12 →A3,V6 and
A1,V1 → A5,V13 →A3,V6
that would have been constructed from the 2 different vulnerabilities V12, V13 are now shrunk into one attack path: A1,V1 → A5,IoC1 →A3,V6
In addition, all potential attack paths associated with IoC1 are generated and displayed in Table 7.

5.2.3. Attacker’s Profile Identification (Step 2.3)

In the current step, the attacker’s profile is recognized based on his/her location and capability. Considering the location, it is assumed that the attacker is an outsider and can initiate an attack on the described assets only remotely through the Web. On this account, a graph of assets/vulnerabilities combinations is developed in Figure 3, engaging asset entry points from vulnerabilities that have the access vector “Network”.
To compute the EL, the IVL already calculated on each asset/vulnerability combinations must be taken into account in combination with the attacker’s profile. In particular, the EL is identified from the “Likelihood of Exploitation” matrix, shown in Table A4 of Appendix A, which maps the IVL with the attacker’s capability, utilizing the nominal scale mentioned previously. Following the Vulnerability Chains Discovery method presented in Section 4.2, asset entry points, asset target points, and attacker’s profile are identified.
According to what has been described, the EL is defined for each identified asset combination, shown in Table 8.
To estimate the exploitability for each reconstructed attack path, different attackers’ profiles are taken into account following Table A3 of the Appendix A. To estimate the EL per vulnerability, with respect to the analyzed IoC1, only vulnerabilities of the assets interconnected with the IoC1, namely, vulnerabilities of the Web Application and Operating System assets, are considered. Considering that the adversary is identified in the broader network, asset/vulnerability combinations starting from V2 of A1, V6 of A3 and V8 of A3 are excluded in the current scenario as their access vector from the CVSS 2.0 is “Adjacent Network” and “Local”, respectively (combination V7 of A3 is also assumed to be excluded). In relation to the IVL and attacker’s capability mapping to provide the EL, reflected in Table 9, the specific IVL mapping of V1, V3 vulnerabilities of A1 and V6, V7, and V8 vulnerabilities of asset A3 with each attacker’s capability respectively shown in Table 8. Supposing the attacker’s capability is “Low”, the Attacker’s Exploitability Level is calculated from the appropriate column of Table 9.
Considering the ELs calculations of Table 8, the ELC is estimated. To compute the probability of attack path exploitation and given that IoC1 indicates the compromization of A5, IoC1 has exploitation probability equal to 1. In Table 10, the exploitation probability is calculated in quantitative values and then according to Table A2 of Appendix A. These values are converted to qualitative values to estimate the Attack Path Exploitability Level (APEL) defined in Section 4. This is depicted in the following Table 10, in which the attacker is characterized with “Low” (L) capability.
As a result, from 15 attack paths, only 11 attack paths remained.

5.2.4. Prioritization of Potential Attack Paths (Step 2.4)

Within this step, the 11 remaining attack paths are prioritized regarding their APEL with the worst case scenario, namely, from the highest probability to the lowest to occur as depicted in Table A6 of Appendix A.

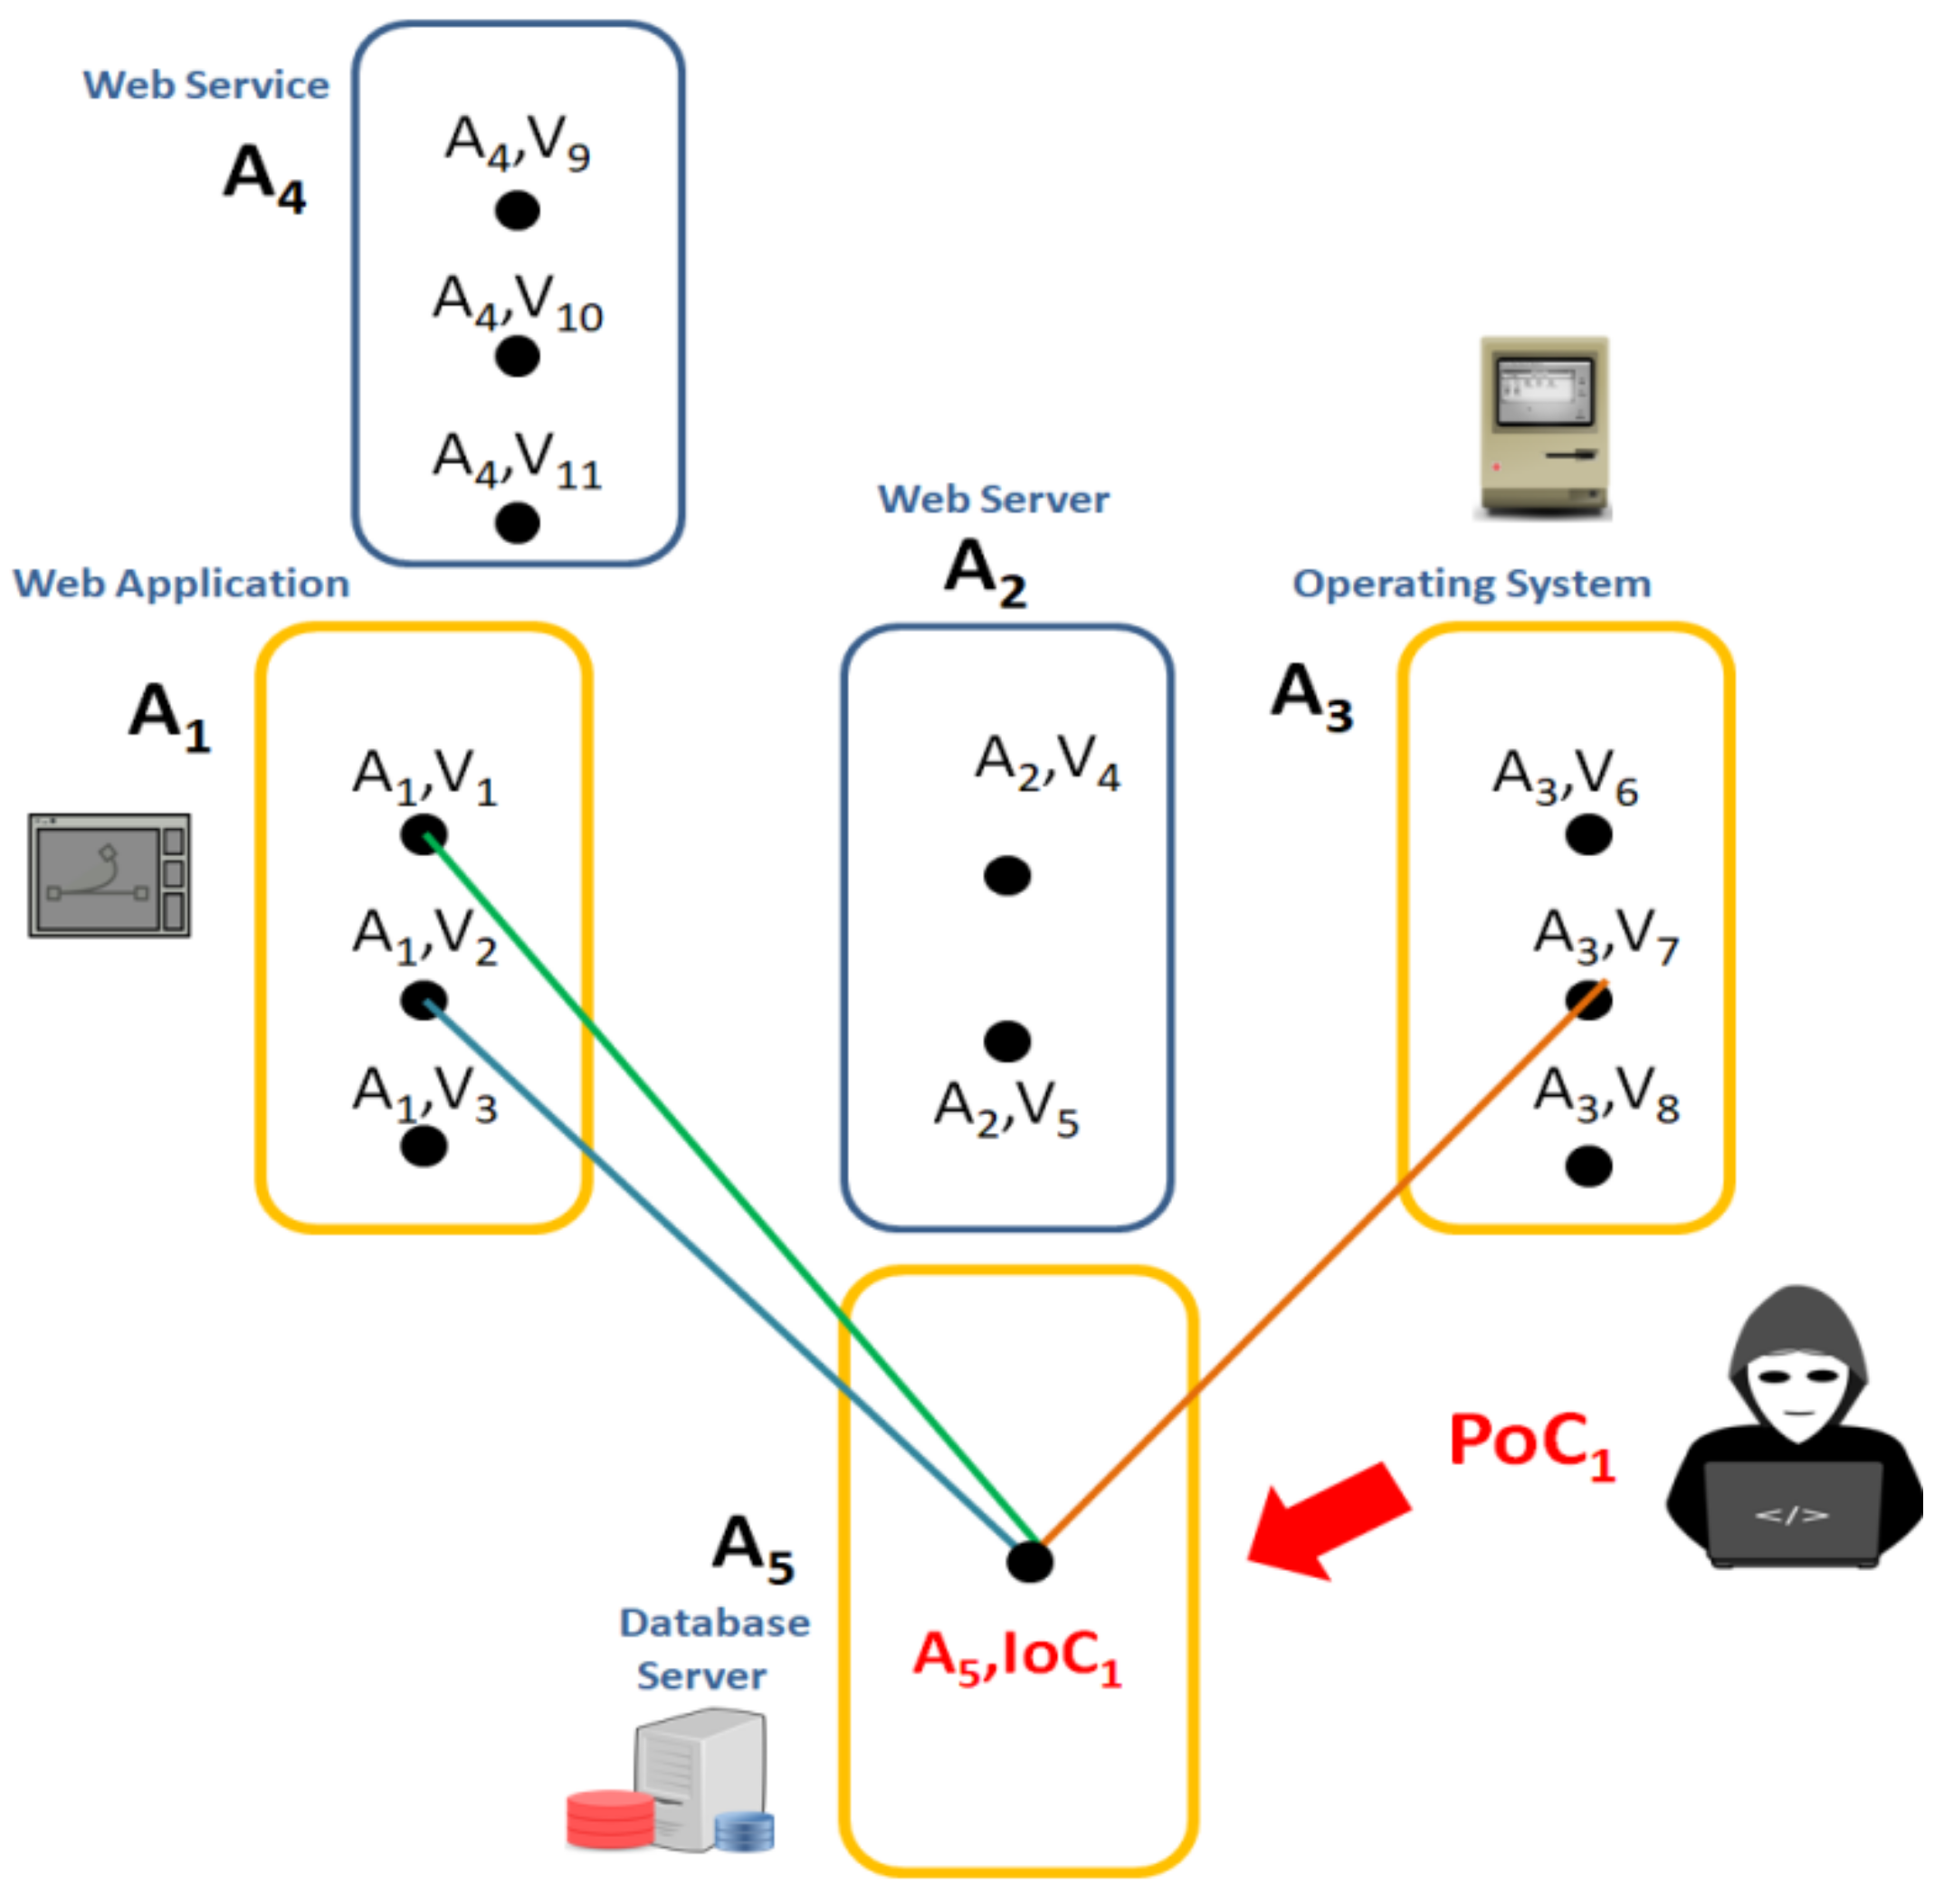
5.2.5. Pruning Process Activation (Step 2.5)

As regards the received information from the IoC analysis, the estimation of the APEL and the attacker’s expertise is reconsidered according to his/her capability, namely, the level of his/her expertise towards the APEL of the addressed vulnerabilities. According to the attacker’s exploitation capacity presented in Table 1, in case the attacker’s capability is “Low” (L), the adversary is capable of implementing an attack path that has either “High” (H) or “Very High” (VH) level of attack path exploitability.
In this context, a pruning process is applied to keep the meaningful attack paths according to the defined attacker’s capability with APEL = H and APEL = VH and thereby set credible evidence chains. Eventually, in Table 11, all possible attack paths that address the current predefined scenario are illustrated, which have generated Evidence Chains of vulnerabilities between the assets A1, A5, and A3. Eventually, from the 11 attack paths of the previous step, only three attack paths and the respective evidence chains remain.
Figure 6 reflects the final results from the application of the proposed approach to the current threat scenario of the Cargo Transportation Service. Three Evidence Chains are generated colored in green, blue, and orange in Figure 6 to show how the attacker could have moved inside the network:
  • Option a: The attacker used the Standard Cargo Manifest Web Application as an entry point to reach the PCS Database Server by exploiting either the vulnerability V1 or V2 of the asset.
  • Option b: The attacker used the PCS Database Server as an entry point to reach the PCS Operating System by exploiting the vulnerability V7 to enter the targeted asset.
The three results have the same APEL which means that they have equal possibility of occurring. To this end, we run the proposed algorithm to identify the attack’s course and gather information about the attacker’s malicious behavior which was successfully accomplished.

6. Results and Discussion

The research work presented proposes a hybrid approach which combines vulnerability analysis with incident analysis practices to explore an attack’s technical aspects and simulate how the adversary moved inside an organization’s network to launch an attack and reach a target. The proposed model developed an algorithm which can be utilized by CII operators to assess vulnerabilities and develop evidence chains of an attack considering information gained from artifacts analysis, e.g., IoC, and from other various sources. To achieve this, the current work:
  • measures the exploitability of a vulnerability to a given asset, the exploitability of a vulnerability in a given vulnerability chain, and the exploitability probability of an attack path;
  • investigates the attacker’s location in the network to identify if an attacker has the ability to reach and exploit a vulnerability on an asset using incident-related information;
  • estimates the attacker’s ability to perform an attack based on his/her expertise, available resources, and opportunities;
  • identifies the attacker’s exploitation capacity on attack paths;
  • analyzes IoCs, other artifacts, and data to gather security knowledge;
  • promotes IoC analysis;
  • reconstructs attack paths and erases those that are not related to the detected security event through a recurring process;
  • prioritizes attack paths to reveal the worst-case scenario;
  • following the identified attacker’s exploitation capacity, activates a pruning process to erase all irrelevant attack paths that do not match to the IoC; and
  • generates Evidence Chains on a given event.
The proposed model aimed at addressing the open research problem concerning the strong need to develop risk assessment techniques that focus the analysis on exploring cyber-attack features (e.g., cyber-attack course, adversary’s profile, etc.) in order to detect threats and estimate risks on CIIs. In particular, the contribution of this work relies on the analysis of the technical aspects of attacks when performing a risk assessment process to gain new security knowledge that allows CII operators to have a more concrete understanding of the security posture. In this vein, they can improve the decision making and incident handling procedures. Moreover, the model generates evidence chains by constructing attack paths related to specific detected security events. Considering all received incident-related information, the Attack Simulation and Evidence Chains Generation model will estimate the cascading effects of various cyber-attack patterns and security incidents of the CIIs. It utilizes novel processes of near real-time identification of anomalies, threats and attacks, abnormal behaviors, and malicious activity that stresses the structural pattern.
The current approach has been developed within the context of the EU H2020 research project “CyberSANE”. Close future action plans include the demonstration of the proposed Attack Simulation Evidence Chains generation model to pilot end-users who reside in three large-scale industries (healthcare, energy, maritime transport) and its results will be evaluated under the scope of varied realistic threat scenarios on CIIs of these industry sectors engaging different technical characteristics in the context of three pilot events.

7. Conclusions

Over the last years, aggressors have highly evolved their skills conducting multiple and sophisticated attacks across ICT networks compromising interconnected nodes as a stepping stone either to penetrate into the system as deeply as possible and cause serious damage or reach a specific target to serve malevolent goals. In this vein, risk management techniques have increased their focus on exploring cyber-attack features, such as the cyber-attack’s course, the adversary’s profile, the cyber-attack potential, attacker’s location through the network, etc., to detect threats and estimate risks on CIIs.
The current research work presented an Attack Simulation Evidence Chains Generation approach which analyzes artifacts (e.g., IoC) as digital evidence of cyber-attack and upon the captured information estimates all possible attack paths that could link to specific confirmed security events. Following a sequential algorithmic procedure, once a security unwanted event has been detected, incident-related information is deeply analyzed. The proposed approach implements a simulation environment, where security practitioners can further experiment on detected threat cases and share their knowledge in a collaborative manner. To better demonstrate the current approach and validate the applicability of the proposed model, a real-life scenario was deployed and fruitful results were gathered.

Author Contributions

E.-M.K. and S.P. constructed the presentation of the Attack Simulation and Evidence Chains Generation approach and conceived the indicative example for better comprehension of the approach. T.P. supervised the work. The described threat scenarios were fabricated by E.-M.K. and S.P. contributed to the writing of the manuscript. T.P. reviewed the work during the writing process and contributed to provide improvements. All authors discussed the content of the research and contributed to the final manuscript. All authors have read and agreed to the published version of the manuscript.

Funding

This work has received funding from the European Union’s Horizon 2020 Research and Innovation program "H2020-EU.2.1.1. - INDUSTRIAL LEADERSHIP - Leadership in enabling and industrial technologies - Information and Communication Technologies (ICT)" of topic SU-ICT-01-2018 “Dynamic countering of cyber-attacks” under Grant Agreement No 833683.

Acknowledgments

This work has been supported by the European Union’s Horizon 2020 Project “CyberSANE” under grant agreement No 833683. The authors would like to thank all project members for their valuable insights. Finally, special thanks to MAGGIOLI SPA and University of Piraeus Research Centre for its continuous support.

Conflicts of Interest

The authors declare no conflict of interest.

Appendix A

Table A1. Mapping CVSS 2.0 Exploitability Metrics identified the Individual Vulnerability Level (IVL).
AC
AV
LocalAdjacentNetwork
Auth High (H)Moderate (M)Low (L)High (H)Moderate (M)Low (L)High (H)Moderate (M)Low (L)
MultipleVLVLLLLMMMH
SingleVLLMLMHMHVH
NoneLMMMHHHVHVH
Table A2. The Probability Scale of the Risk Assessment methodology indicating qualitative and quantitative ranges and values.
Probability Scale
Qualitative ValuesRepresentative
RangeNumber
Very High (VH)0.85–1.000.93
High (H)0.65–0.840.75
Moderate (M)0.35–0.640.50
Low (L)0.15–0.340.25
Very Low (VL)0.00–0.140.07
Table A3. Attacker’s capability is ranked using the Probability Scale of the Risk Assessment methodology.
Assessment Scale of Attacker’s Capability
Qualitative ValuesSemi-Quantitative ValuesDescription
Very High(VH)85–10093The adversary has a very sophisticated level of expertise, is well-resourced, and can generate opportunities to support multiple successful, continuous, and coordinated attacks.
High(H)65–8475The adversary has a sophisticated level of expertise, with significant resources and opportunities to support multiple successful coordinated attacks.
Moderate(M)35–6450The adversary has moderate resources, expertise, and opportunities to support multiple successful attacks.
Low(L)15–3425The adversary has limited resources, expertise, and opportunities to support a successful attack.
Very Low(VL)0–147The adversary has very limited resources, expertise, and opportunities to support a successful attack.
Table A4. The likelihood of an attacker successfully exploiting a specific vulnerability identified on an asset, considering the attacker’s capability and the corresponding Individual Vulnerability Level (IVL).
Attacker’s CapabilityVery Low
(VL)
Low
(L)
Moderate
(M)
High
(H)
Very High
(VH)
Individual
Vulnerability
Level (IVL)
Very Low (VL)VLVLLLM
Low (L)VLLLMH
Moderate (M)LLMHH
High (H)LMHHVH
Very High (VH)MHHVHVH
Table A5. Depiction of all existing vulnerability chains of all cyber-dependent assets of the scenario presented in Section 5.
Entry PointTarget PointAsset Interdependency ChainsVulnerability Chains
A1,V1A3,V6
A3,V6
A3,V7
A3,V7
A3,V8
A3,V8
A5,V12
A5,V13
A3,V6
A3,V7
A3,V8
A3,V6
A3,V8
A2,V4
A2,V5
A3,V7
A1,V1 → A5,V12 → A3,V6
A1,V1 → A5,V13 → A3,V8
A1,V1 → A5,V12 → A3,V7
A1,V1 → A5,V13 → A3,V7
A1,V1 → A5,V12 → A3,V8
A1,V1 → A5,V13 → A3,V8
A1,V1 → A5,V12
A1,V1 → A5,V13
A1,V1 → A2,V4 → A3,V6
A1,V1 → A2,V4 → A3,V7
A1,V1 → A2,V4 → A3,V8
A1,V1 → A2,V5 → A3,V6
A1,V1 → A2,V5 → A3,V8
A1,V1 → A2,V4
A1,V1 → A2,V5
A1,V1 → A2,V5 → A3,V7
V1 → V12 → V6
V1 → V13 → V6
V1 → V12 → V7
V1 → V13 → V7
V1 → V12 → V8
V1 → V13 → V8
V1 → V12
V1 → V13
V1 → V4 → V6
V1 → V4 → V7
V1 → V4 → V8
V1 → V5 → V6
V1 → V5 → V8
V1 → V4
V1 → V5
V1 → V5 → V7
A1,V2A3,V6
A3,V6
A3,V7
A3,V7
A3,V8
A3,V8
A5,V12
A5,V13
A3,V6
A3,V7
A3,V8
A3,V6
A3,V7
A3,V8
A2,V4
A2,V5
A1,V2 → A5,V12 → A3,V6
A1,V2 → A5,V13 → A3,V6
A1,V2 → A5,V12 → A3,V7
A1,V2 → A5,V13 → A3,V7
A1,V2 → A5,V12 → A3,V8
A1,V2 → A5,V13 → A3,V8
A1,V2 → A5,V12
A1,V2 → A5,V13
A1,V2 → A2,V4 → A3,V6
A1,V2 → A2,V4 → A3,V7
A1,V2 → A2,V4 → A3,V8
A1,V2 → A2,V5 → A3,V6
A1,V2 → A2,V5 → A3,V7
A1,V2 → A2,V5 → A3,V8
A1,V2 → A2,V4
A1,V2 → A2,V5
V2 → V12 → V6
V2 → V13 → V6
V2 → V12 → V7
V2 → V13 → V7
V2 → V12 → V8
V2 → V13 → V8
V2 → V12
V2 → V13
V2 → V4 → V6
V2 → V4 → V7
V2 → V4 → V8
V2 → V5 → V6
V2 → V5 → V7
V2 → V5 → V8
V2 → V4
V2 → V5
A1,V3A3,V7
A3,V8
A3,V6
A3,V6
A3,V7
A3,V8
A3,V6
A3,V6
A3,V7
A3,V7
A3,V8
A3,V8
A2,V4
A2,V5
A5,V12
A5,V13
A1,V3 → A5,V12 → A3,V7
A1,V3 → A5,V12 → A3,V8
A1,V3 → A5,V12 → A3,V6
A1,V3 → A5,V13 → A3,V6
A1,V3 → A5,V13 → A3,V7
A1,V3 → A5,V13 → A3,V8
A1,V3 → A2,V4 → A3,V6
A1,V3 → A2,V5 → A3,V6
A1,V3 → A2,V4 → A3,V7
A1,V3 → A2,V5 → A3,V7
A1,V3 → A2,V4 → A3,V8
A1,V3 → A2,V4
A1,V3 → A2,V5
A1,V3 → A5,V12
A1,V3 → A5,V13
V3 → V12 → V7
V3 → V12 → V8
V3 → V12 → V6
V3 → V13 → V6
V3 → V13 → V7
V3 → V13 → V8
V3 → V4 → V6
V3 → V5 → V6
V3 → V4 → V7
V3 → V5 → V7
V3 → V4 → V8
V3 → V5 → V8
V3 → V4
V3 → V5
V3 → V12
V3 → V13
A2,V4A3,V6
A3,V7
A3,V8
A2,V4 → A3,V6
A2,V4 → A3,V7
A2,V4 → A3,V8
V4 → V6
V4 → V7
V4 → V8
A2,V5A3,V6
A3,V7
A3,V8
A2,V5 → A3,V6
A2,V5 → A3,V7
A2,V5 → A3,V8
V5 → V6
V5 → V7
V5 → V8
A4,V9A3,V6
A3,V6
A3,V7
A3,V7
A3,V8
A3,V8
A2,V4
A2,V5
A4,V9 → A2,V4 →A3,V6
A4,V9 → A2,V5 →A3,V6
A4,V9 → A2,V4 →A3,V7
A4,V9 → A2,V5 →A3,V7
A4,V9 → A2,V4 →A3,V8
A4,V9 → A2,V5 →A3,V8
A4,V9 → A2,V4
A4,V9 → A2,V5
V9 → V4 →V6
V9 → V5 →V6
V9 → V4 →V7
V9 → V5 →V7
V9 → V4 →V8
V9 → V5 →V8
V9 → V4
V9 → V5
A5,V12A3,V6
A3,V7
A3,V8
A5,V12 → A3,V6
A5,V12 → A3,V7
A5,V12 → A3,V8
V12 → V6
V12 → V7
V12 → V8
A5,V13A3,V6
A3,V7
A3,V8
A5,V13 → A3,V6
A5,V13 → A3,V7
A5,V13 → A3,V8
V13 → V6
V13 → V7
V13 → V8
A4,V10A3,V6
A3,V6
A3,V7
A3,V7
A3,V8
A3,V8
A2,V4
A2,V5
A4,V10 → A2,V4 → A3,V6
A4,V10 → A2,V5 → A3,V6
A4,V10 → A2,V4 → A3,V7
A4,V10 → A2,V5 → A3,V7
A4,V10 → A2,V4 → A3,V8
A4,V10 → A2,V5 → A3,V8
A4,V10 → A2,V4
A4,V10 → A2,V5
V10 → V4 →V6
V10 → V5 →V6
V10 → V4 →V7
V10 → V5 →V7
V10 → V4 →V8
V10 → V5 →V8
V10 → V4
V10 → V5
A4,V11A3,V6
A3,V6
A3,V7
A3,V7
A3,V8
A3,V8
A2,V4
A2,V5
A4,V11 → A2,V4 →A3,V6
A4,V11 → A2,V5 →A3,V6
A4,V11 → A2,V4 →A3,V7
A4,V11 → A2,V5 →A3,V7
A4,V11 → A2,V4 →A3,V8
A4,V11 → A2,V5 →A3,V8
A4,V11 → A2,V4
A4,V11 → A2,V5
V11 → V4 → V6
V11 → V5 → V6
V11 → V4 → V7
V11 → V5 → V7V11 → V4 → V8
V11 → V5 → V8
V11 → V4
V11 → V5
Table A6. Attack Path Prioritization from highest to lowest probability of occurrence is depicted.
Attack PathsEvidence ChainsExploitation Level Chains (ELC)Exploitation
Probability
Attack Path
Exploitability Level (APEL)
Attacker’s Capability = Low (L)
A1,V1 → A5,IoC1V1 → IoC1H → IoC10.75 × 1 = 0.75H
A5,IoC1 → A3,V7IoC1 → V7IoC1 → H1 × 0.75 = 0.75H
A1,V3 → A5,IoC1V3 → IoC1H → IoC10.75 × 1 = 0.75H
A1,V1 → A5,IoC1 → A3,V7 V1 → IoC1 → V7H → IoC1 → H0.75 × 1 × 0.75 = 0.56M
A1,V3 → A5,IoC1 → A3,V7V3 → IoC1 → V7H → IoC1 → H0.75 × 1 × 0.75 = 0.56M
A5,IoC1 → A3,V6IoC1 → V6IoC1 → L1 × 0.25 = 0.25L
A5,IoC1 → A3,V8IoC1 → V8IoC1 → L1 × 0.25 = 0.25L
A1,V1 → A5,IoC1 → A3,V6V1 → IoC1 → V6H → IoC1 → L0.75 × 1 × 0.25 = 0.19L
A1,V1 → A5,IoC1 → A3,V8V1 → IoC1 → V8H → IoC1 → L0.75 × 1 × 0.25 = 0.19L
A1,V3 → A5,IoC1 → A3,V6V3 → IoC1 → V6H → IoC1 → L0.75 × 1 × 0.25 = 0.19L
A1,V3 → A5,IoC1 → A3,V8V3 → IoC1 → V8H → IoC1 → L0.75 × 1 × 0.25 = 0.19L

Appendix B

Table A7. List of acronyms.
AbbreviationDefinition
APELAttack Path Exploitability Level
APTAdvanced Persistent Threat
AVAccess Vector
BDBlock Diagram
CICritical Infrastructure
CIICritical Information Infrastructure
CVECommon Vulnerabilities and Exposures
CVSSCommon Vulnerability Scoring System
CWECommon Weakness Enumeration
ECEuropean Commission
ECIEuropean Critical Infrastructure
ELExploitation Level
ELCExploitation Level Chain
EUEuropean Union
FTFault Tree
GDPRGeneral Data Protection Regulation
HIDSHost-based Intrusion Detection System
ICTInformation Communication Technologies
ICSIndustrial Control System
ICVLIndividual Chain Vulnerability Level
IDSIntrusion Detection System
IoCIndicator of Compromise
IoTInternet of Things
IVLIndividual Vulnerability Level
KMKnowledge Management
KRMKnowledge Risk Management
MLMachine Learning
NIDSNetwork-based Intrusion Detection System
NLPNatural Language Processing
PCSPort Community System
PoCPoint of Compromise
SCADASupervisory Control and Data Acquisition
TVATopological Analysis of Network Attack Vulnerability
Table A8. List of mathematical symbols.
Mathematical SymbolSymbol NameMeaning/Definition
AnAssetThe cyber asset “n” of an organization.
sThreatA single cyber threat “s” that is applied to the cyber asset An
TsA set of cyber threatsAll cyber threats, “s”, which are applied to the cyber asset “An
TLsThreat LevelThe Threat Level “TLs” of a cyber threat, “s”, is the expected probability of occurrence of the threat scenario under examination to the cyber asset “An
vVulnerabilityA vulnerability “v” (confirmed or zero-day) that is identified to an asset An.
VLvIndividual Vulnerability LevelThe probability that an attacker can successfully reach and exploit a specific (confirmed or zero-day) vulnerability “v” in a given cyber asset “An” produces the Individual Vulnerability Level (IVL).
IvImpact LevelIt measures the effect that can be expected as a result of the successful exploitation of a vulnerability “v” that resides in asset “An”.
RsRisk Level“Rs” represents how dangerous all threats, s, are to the specific asset An.
ICVLIndividual Chain Vulnerability Level The Individual Chain Vulnerability Level (ICVL) measures the probability that a vulnerability “z” which resides in an Asset Target Point An, can be exploited given the specific kth-Vulnerability Chain C originated from an Asset Entry Point “Am” with vulnerability “v”.
ELvExploitation LevelThe Exploitation Level of an identified vulnerability “v” on an asset “An”.
ELCExploitation Level ChainThe multiplication of a set of individual vulnerabilities Exploitation Levels “EL” which apply on specific asset/vulnerability combinations related to an IoC. Alternatively, ELCs are considered a sequence of exploitation levels “ELv” of individual vulnerabilities “v” on specific asset/vulnerabilities combinations, related to an IoC.
PExploitability ProbabilityThe likelihood of exploitation of a specific attack path which is related to a specific IoC, with exploitability probability equal to 1 (PIoC = 1)—as it indicates compromization. The outcome is a quantitative value.
APELAttack Path Exploitability LevelIt illustrates in a qualitative scale the level of exploitation for a given attack path towards a specific confirmed event with a specific IoC.
AnVvAsset/Vulnerability combinationAn asset/vulnerability combination, indicating a vulnerability “v” is identified on a cyber asset “n”. In the current model, it is used to develop asset interdependency chains and asset interdependency graphs.
ECEvidence Chain A sequence of exploitable vulnerabilities related to IoC.

References

  1. Organisation for Economic Co-Operation and Development (OECD). Policy Responses to Coronavirus (COVID-19). TELEWORKING in the COVID-19 Pandemic: Trends and Prospects. 2021. Available online: https://www.oecd.org/coronavirus/policy-responses/teleworking-in-the-COVID-19-pandemic-trends-and-prospects-72a416b6/ (accessed on 25 November 2021).
  2. The Council of the European Union. Council Directive 2008/114/EC of 8 December 2008 on the Identification and Designation of European Critical Infrastructures and the Assessment of the Need to Improve Their Protection (ECI Directive). Off. J. Eur. Union (OJ) 2008, 345, 75–82. Available online: https://eur-lex.europa.eu/legal-content/EN/TXT/?uri=celex%3A32008L0114 (accessed on 25 November 2021).
  3. Acronis. How Ransomware Attacks Health Care Providers and Other Industries. 2017. Available online: https://www.acronis.com/en-us/articles/nhs-cyber-attack/ (accessed on 25 November 2021).
  4. Turton, W.; Mehrotra, K. Hackers Breached Colonial Pipeline Using Compromised Password. Bloomberg. 2021. Available online: https://www.bloomberg.com/news/articles/2021-06-04/hackers-breached-colonial-pipeline-using-compromised-password (accessed on 25 November 2021).
  5. Pereira, F.; Crocker, P.; Leithardt, V.R. PADRES: Tool for PrivAcy, Data REgulation and Security. SoftwareX 2020, 17, 100895. [Google Scholar] [CrossRef]
  6. MITRE, Cyber Resiliency. 2017. Available online: https://.mitre.org/sites/default/files/PR_17-1434.pdf (accessed on 25 November 2021).
  7. The European Parliament and the Council of the European Union. Directive (EU) 2016/1148 of the European Parliament and of the Council of 6 July 2016 concerning measures for a high common level of security of network and information systems across the Union (NIS Directive). Off. J. Eur. Union (OJ) 2016, L194, 1–30. Available online: https://eur-lex.europa.eu/eli/dir/2016/1148/oj (accessed on 25 November 2021).
  8. Proposal for a Directive of the EU Parliament and of the Council on Measures for a High Common Level of Cybersecurity Across the Union, Repealing Directive (EU) 2016/1148, (NIS Directive 2), December 2020. Available online: https://eur-lex.europa.eu/legal-content/EN/TXT/?uri=COM:2020:823:FIN (accessed on 25 November 2021).
  9. ISO/IEC 27000:2018—Key International Standard for Information Security. Available online: https://www.iso.org/news/ref2266.html (accessed on 25 November 2021).
  10. ISO 31000:2018—Risk Management. Available online: https://www.iso.org/iso-31000-risk-management.html (accessed on 25 November 2021).
  11. ISO/IEC 27035:2016-1—Security Incident Management. Available online: https://www.iso.org/standard/60803.html (accessed on 25 November 2021).
  12. Bodeau, D.J.; McCollum, C.D.; Fox, D.B. Cyber Threat Modeling: Survey, Assessment, and Representative Framework, The Homeland Security Systems Engineering and Development Institute (HSSEDI) & MITRE Cooperation. 2018. Available online: https://www.mitre.org/sites/default/files/publications/pr_18-1174-ngci-cyber-threat-modeling.pdf (accessed on 25 November 2021).
  13. Yeboah-Ofori, A.; Islam, S. Cyber security threat modeling for supply chain organizational environments. Future Internet 2019, 11, 63. [Google Scholar] [CrossRef] [Green Version]
  14. Kriaa, S.; Bouissou, M.; Piètre-Cambacédès, L. Modeling the Stuxnet Attack with BDMP: Towards More Formal Risk Assessments; IEEE: Cork, Ireland, 2012; pp. 1–8. [Google Scholar] [CrossRef]
  15. Jha, S.; Sheyner, O.; Wing, J. Two Formal Analyses of Attack Graphs; IEEE: Cape Breton, NS, Canada, 2002; pp. 49–63. [Google Scholar] [CrossRef] [Green Version]
  16. Chochliouros, I.; Spiliopoulou, A.; Chochliouros, S. Methods for Dependability and Security Analysis of Large Networks. In Encyclopedia of Multimedia Technology and Networking; Pagani, M., Ed.; IGI Global: Milan, Italy, 2009; pp. 921–929. [Google Scholar] [CrossRef] [Green Version]
  17. Abraham, S.; Nair, S. Predictive cyber-security analytics framework: A non-homogenous markov model for security quantification. arXiv 2015, arXiv:1501.01901. [Google Scholar] [CrossRef]
  18. Dacier, M.; Deswarte, Y. Privilege graph: An extension to the typed access matrix model. In Computer Security ESORICS 94—ESORICS 1994; Gollmann, D., Ed.; Lecture Notes in Computer Science; Springer: Berlin/Heidelberg, Germany, 1994; Volume 875, pp. 319–334. [Google Scholar] [CrossRef]
  19. Ou, X.; Singhal, A. Quantitative Security Risk Assessment of Enterprise Networks, 1st ed.; Springer: New York, NY, USA, 2011. [Google Scholar]
  20. Polatidis, N.; Pimenidis, E.; Pavlidis, M.; Papastergiou, S.; Mouratidis, H. From product recommendation to cyber-attack prediction: Generating attack graphs and predicting future attacks. Evol. Syst. 2020, 11, 479–490. [Google Scholar] [CrossRef] [Green Version]
  21. Kundu AGhosh, N.; Chokshi, I.; Ghosh, S.K. Analysis of Attack Graph-Based Metrics for Quantification of Network Security, India Conference (INDICON); IEEE: Kochi, India, 2012; pp. 530–535. [Google Scholar] [CrossRef]
  22. Frigault, M.; Wang, L. Measuring Network Security Using Bayesian Network-Based Attack Graphs. In Proceedings of the 2008 32nd Annual IEEE International Computer Software and Applications Conference, Turku, Finland, 28 July–1 August 2008; pp. 698–703. [Google Scholar] [CrossRef] [Green Version]
  23. Jaquith, A. Security Metrics: Replacing Fear, Uncertainty, and Doubt; Addison-Wesley Professional Computing Series; Pearson Education: Boston, MA, USA, 2007; ISBN 9780321349989. [Google Scholar]
  24. Abdelgawad, A.; Farstad, T.E.; Gonzalez, J. Vulnerability analysis of interdependent critical infrastructures upon a cyber-attack. In Proceedings of the 52nd Hawaii International Conference on System Sciences (HICSS-52), Grand Wailea, Hawaii, HI, USA, 8–11 January 2019; p. 629–638, ISBN 978-0-9981331-2-6. [Google Scholar]
  25. Singhal, A.; Ou, X. Security Risk Analysis of Enterprise Networks Using Probabilistic Attack Graphs. In Network Security Metrics; Springer: Berlin/Heidelberg, Germany, 2017; pp. 53–73. [Google Scholar]
  26. Schneier, B. Attack Trees. In Dr. Dobb’s Journal; Counterpane Internet Security: New Orleans, LA, USA, 1999; pp. 21–29. [Google Scholar]
  27. Lai, R.; Qiu, X.; Wu, J. Robustness of Asymmetric Cyber-Physical Power Systems Against Cyber Attacks. IEEE Access 2019, 7, 61342–61352. [Google Scholar] [CrossRef]
  28. Ou, X.; Govindavajhala, S.; Appel, A.W. MulVAL: A Logic-based Network Security Analyzer. In Proceedings of the 14th USENIX Security Symposium, Baltimore, MD, USA, 31 July–5 August 2005; Volume 8, pp. 113–128. [Google Scholar]
  29. Artz, M. NetSPA: A Network Security Planning Architecture; Massachusetts Institute of Technology: Cambridge, UK, 2002. [Google Scholar]
  30. Mell, P.; Scarfone, K.; Romanosky, S. A Complete Guide to the Common Vulnerability Scoring System Version 2.0; National Institute of Standards and Technology (NIST): Gaithersburg, MA, USA, 2007. [Google Scholar]
  31. Kavallieratos, G.; Katsikas, S. Attack Path Analysis for Cyber Physical Systems. In Computer Security; Springer: Cham, Switzerland, 2020; pp. 19–33. [Google Scholar] [CrossRef]
  32. Al-Mohannadi, H.; Awan, I.; Al Hamar, J. Analysis of adversary activities using cloud-based web services to enhance cyber threat intelligence. Serv. Oriented Comput. Appl. 2020, 14, 175–187. [Google Scholar] [CrossRef] [Green Version]
  33. Kim, K.; Shin, Y.; Lee, J.; Lee, K. Automatically Attributing Mobile Threat Actors by Vectorized ATT&CK Matrix and Paired Indicator. Sensors 2021, 21, 6522. [Google Scholar] [CrossRef] [PubMed]
  34. Baiardi, F.; Telmon, C.; Sgandurra, D. A simulation-driven approach for assessing risks of complex systems. In Proceedings of the 13th European Workshop on Dependable Computing (EWDC’11), Pisa, Italy, 11–12 May 2011; pp. 35–40. [Google Scholar] [CrossRef]
  35. Johnson, P.; Lagerström, R.; Ekstedt, M. A meta language for threat modeling and attack simulations. In Proceedings of the 13th International Conference on Availability, Reliability and Security (ARES 2018), Hamburg, Germany, 27–30 August 2018; pp. 1–8. [Google Scholar] [CrossRef]
  36. Lambe, P. Four Types of Knowledge Risk. 2013. Available online: http://www.straitsknowledge.com/ (accessed on 10 November 2021).
  37. Talet, A.N. The Role of Knowledge Management with Risk Management for Information Technology Projects Risk Assessment. Int. J. Environ. Sustain. 2018, 6, 1–3. [Google Scholar] [CrossRef]
  38. Massingham, P. Knowledge risk management: A framework. J. Knowl. Manag. 2010, 14, 464–485. [Google Scholar] [CrossRef] [Green Version]
  39. Durst, S.; Zieba, M. Mapping knowledge risks: Towards a better understanding of knowledge management. Knowl. Manag. Res. Pr. 2018, 17, 1–13. [Google Scholar] [CrossRef]
  40. Lu, D. ATT&CK Structure PART II: From Taxonomy to Ontology. 2019. Available online: https://www.tripwire.com/state-of-security/mitre-framework/attck-structure-ontology/ (accessed on 10 November 2021).
  41. Barreto, A.B.; Costa, P.C. Cyber-ARGUS—A mission assurance framework. J. Netw. Comput. Appl. 2019, 133, 86–108. [Google Scholar] [CrossRef]
  42. Schauer, S.; Polemi, N.; Mouratidis, H. MITIGATE: A dynamic supply chain cyber risk assessment methodology. J. Transp. Secur. 2018, 12, 1–35. [Google Scholar] [CrossRef]
  43. Kalogeraki, E.-M.; Papastergiou, S.; Mouratidis, H.; Polemi, N. A Novel Risk Assessment Methodology for SCADA Maritime Logistics Environments. Appl. Sci. 2018, 8, 1477. [Google Scholar] [CrossRef] [Green Version]
  44. Papastergiou, S.; Polemi, N. MITIGATE: A Dynamic Supply Chain Cyber Risk Assessment Methodology. In Smart Trends in Systems, Security and Sustainability: Proceedings of WS4 2017; Lecture Notes in Networks and Systems (LNNS); Yang, X.S., Nagar, A., Joshi, A., Eds.; Springer: Berlin/Heidelberg, Germany, 2017; Volume 18, pp. 1–9. ISBN 978-981-10-6916-1. [Google Scholar]
  45. Kalogeraki, E.-M.; Apostolou, D.; Polemi, N.; Papastergiou, S. Knowledge Management Methodology for Identifying Threats in Maritime/Logistics Supply Chains. Knowl. Manag. Res. Pract. 2018, 16, 508–524. [Google Scholar] [CrossRef] [Green Version]
  46. Common Platform Enumeration (MITRE). Available online: https://cpe.mitre.org/dictionary/ (accessed on 26 November 2021).
  47. Rass, S.; König, S.; Schauer, S. Uncertainty in Games: Using Probability-Distributions as Payoffs. In Lecture Notes in Computer Science, Proceedings of the Decision and Game Theory for Security, London, UK, 4–5 November 2015; Khouzani, M.H.R., Panaousis, E., Theodorakopoulos, G., Eds.; Springer: Cham, Switzerland, 2015; pp. 346–357. [Google Scholar] [CrossRef]
  48. Common Attack Enumeration and Classification (MITRE). Available online: https://capec.mitre.org/ (accessed on 10 November 2021).
  49. Common Vulnerabilities and Exposures (MITRE). Available online: https://cve.mitre.org/ (accessed on 10 November 2021).
  50. CVSS v.2 (FIRST). 2007. Available online: https://www.first.org/cvss/v2/guide (accessed on 10 November 2021).
  51. Polatidis, N.; Pavlidis, M.; Mouratidis, H. Cyber-attack path discovery in a dynamic supply chain maritime risk management system. Comput. Stand. Interfaces 2018, 56, 74–82. [Google Scholar] [CrossRef] [Green Version]
Figure 1. The Attack Simulation and Evidence Chains Generation model.
Electronics 11 00404 g001
Figure 2. Assets cyber-dependency graph of Port Authority assets.
Electronics 11 00404 g002
Figure 3. Combinations of assets and vulnerabilities are developed for the current business scenario.
Electronics 11 00404 g003
Figure 4. The Individual Vulnerability Level (IVL) has been calculated on asset/vulnerability combinations according to the Risk Assessment methodology.
Electronics 11 00404 g004
Figure 5. Potential cyber-attack paths related to the compromised PCS Database Server (A5) given the specific PoC1 derived from the analyzed IoC1.
Electronics 11 00404 g005
Figure 6. The application of the proposed approach to the General Cargo Transportation scenario generated three Evidence Chains for the PCS Database Server compromization.
Electronics 11 00404 g006
Table 1. Mapping of the attacker’s capability and the attack path exploitability to identify the attacker’s exploitability potential.
Attacker’s Exploitation Capacity
Qualitative Values
of Attacker’s Capability
Description of the Attacker’s Capability Attack Vector towards Exploitability
Very High (VH)The adversary has a very sophisticated level of expertise, is well-resourced, and can generate opportunities to support multiple successful, continuous, and coordinated attacks.The adversary is capable of
implementing an attack path that has VL, L, M, H, or VH level of exploitability in a sequence of vulnerabilities.
High (H)The adversary has a sophisticated level of expertise, with significant resources and opportunities to support multiple successful coordinated attacks.The adversary is capable of implementing an attack path that has
L, M, H, or VH level of exploitability in a sequence of vulnerabilities.
Moderate (M)The adversary has moderate resources, expertise, and opportunities to support multiple successful attacks.The adversary is capable of implementing an attack path that has M, H, or VH level of exploitability in a sequence of vulnerabilities.
Low (L)The adversary has limited resources, expertise, and opportunities to support a successful attack.The adversary is capable of implementing an attack path that has H or VH level of exploitability in a sequence of vulnerabilities.
Very Low (VL)The adversary has very limited resources, expertise, and opportunities to support a successful attack.The adversary is capable of implementing an attack path only with VH level of exploitability in a sequence of vulnerabilities.
Table 2. Steps, tasks, and rules applied in the Attack Simulation and Evidence Chains generation model.
Step Number Step Name Tasks and Rules
Step 1Generation of Vulnerability ChainsConstruct all possible Asset/Vulnerability combinations
between an Asset Entry Point and an Asset Target Point
Step 1.1Identify Asset
Dependency Graphs
a.
Identify assets
b.
Identify assets characteristics (e.g., type, vendor)
c.
Identify assets interdependencies
d.
c.1 Access Vector (AV)
e.
c.2 Asset Cyber-dependencies
f.
Construct asset dependency graphs
Step 1.2

Entry Points
Identification
g.
CII operators define assets that are more reachable by
h.
the attackers to initiate an attack.
Step 1.3Target Points
Identification
i.
CII operators define assets of high criticality on their infrastructures that may attract attackers to reach.
Step 1.4Perform
Individual Vulnerability
Assessment
j.
Estimate Individual Vulnerability Level
(Exploitability of a vulnerability to an asset).
Step 1.4Produce
Vulnerability
Chains
k.
Generate the chain of sequential vulnerabilities on different assets arising from Entry Points to exploit the vulnerabilities of the Target Points.
Step 2Recurring Process ActivationConstruct all possible Attack Paths related to a
specific security confirmed event
Step 2.1PoCs/IoC
l.
Analyze artifacts and incident-related information.
m.
Investigate for PoC.
Step 2.2Reconstruction of
Attack Paths
n.
Identify all vulnerability chains connected with the IoC.
o.
Erase all Attack Paths that are not connected with the IoC.
Step 2.3Attacker’s Profile
Identification
p.
Define Attacker’s Profile (Location, Capabiliy).
q.
Erase Vulnerability Chains with Asset Entry Points that are not reachable to the attacker.
r.
Estimate the Exploitation Levels of vulnerabilities on the developed attack paths (they must all link to the IoC).
s.
Estimate the exploitability probability of all attack paths (APEL) (they must all link to the IoC).
t.
The likelihood of exploitation of vulnerabilities that reside in the infected asset is 1: exploitability probability PIOC = 1 as the asset has already been compromised.
Step 2.4 Prioritization of
Potential Attack Paths
u.
Prioritize the attack paths to the worst-case scenario (Classify the APEL from “Very High” to “Very Low”).
Step 2.5Pruning Process Activation
v.
Map attacker’s profile and APEL to specify the Attacker’s Exploitation capacity towards a given attack path.
w.
Pruning Process Activation for all attack paths; the attacker has no exploitability capacity and review remaining attack paths.
x.
Evidence Chains generated.
Table 3. Assets and their cyber-dependencies of the current business scenario.
Asset SourceAsset DestinationCyber-Dependency Type
AssetAsset CategoryAssetAsset Category1. Hosting; 2. Exchange Data/Information; 3. Storing; 4. Controlling; 5. Processing; 6. Accessing; 7. Installing; 8. Trusted; 9. Connecting
A1Web ApplicationA2Web Serverhosted_by
A2Web ServerA3Operating Systeminstalled_on
A4Web ServiceA2Web Serverhosted_by
A5Database ServerA3Operating Systeminstalled_on
A1Web ApplicationA5Database Serverexchange_data
Table 4. Vulnerabilities identified on assets and corresponding CVSS 2.0 metrics.
VulnerabilityAssetCVSS ExploitabilityCVSS Impact
Access Vector (AV)
(Local (L), Adjacent (A), Network (N))
Access Complexity (AC)
(Low (L), Moderate (M), High (H))
Authentication policy (Auth)
(Multiple (M), Single (S),
None (N))
Confidentiality (C)
(Complete (C), Partial (P),
None (N))
Integrity (I)
(Complete (C), Partial (P),
None (N))
Availability (A)
(Complete (C), Partial (P), None (N))
V1A1NLSCCC
V2A1AMSPPN
V3A1NMNCCP
V4A2NMNNPN
V5A2NHNNPN
V6A3LLNCCC
V7A3NLNNNP
V8A3LMNCCC
V9A4NMNPPN
V10A4NLNPNN
V11A4NLNPPN
V12A5NMSCCC
V13A5NHNCCC
Table 5. Estimation of the Individual Vulnerability Level (IVL) for each identified asset/vulnerability combination.
Vulnerability AssetIndividual Vulnerability Level (IVL)
V1A1VLV1 = VH
V3A1VLV3 = VH
V4A2VLV4 = VH
V5A2VLV5 = H
V6A3VLV6 = M
V7A3VLV7 = VH
V8A3VLV8 = M
V9A4VLV9 = VH
V10A4VLV10 = VH
V11A4VLV11 = VH
V12A5VLV12 = H
V13A5VLV13 = H
Table 6. Assets cyber-dependencies linked to the detected compromised asset A5.
Asset SourceAsset DestinationCyber-dependency Type
AssetAsset CategoryAssetAsset Category1. Hosting; 2. Exchange Data/Information; 3. Storing; 4. Controlling; 5. Processing; 6. Accessing; 7. Installing; 8. Trusted; 9. Connecting
A5Database ServerA3Operating Systeminstalled_on
A1Web ApplicationA5Database Serverexchange_data
Table 7. Attack paths are reconstructed according to the confirmed security event and potential evidence chains.
Asset interdependency ChainsAttack PathsEvidence Chains
A1,V1 → A5,V12 →A3,V6A1,V1A5,IoC1 → A3,V6V1IoC1 → V6
A1,V1 → A5,V13 →A3,V6
A1,V1 → A5,V12 → A3,V7A1,V1A5,IoC1 → A3,V7V1IoC1 → V7
A1,V1 → A5,V13 → A3,V7
A1,V1 → A5,V12 → A3,V8A1,V1A5,IoC1 → A3,V8V1IoC1 → V8
A1,V1 → A5,V13 → A3,V8
A1,V1 → A5,V12A1,V1A5,IoC1V1IoC1
A1,V1 → A5,V13
A1,V2 → A5,V12 → A3,V6A1,V2A5,IoC1 → A3,V6V2IoC1 → V6
A1,V2 → A5,V13 → A3,V6
A1,V2 → A5,V12 → A3,V7A1,V2A5,IoC1 → A3,V7V2IoC1 → V7
A1,V2 → A5,V13 → A3,V7
A1,V2 → A5,V12 → A3,V8A1,V2A5,IoC1 → A3,V8V2IoC1 → V8
A1,V2 → A5,V13 → A3,V8
A1,V2 → A5,V12 A1,V2A5,IoC1V2IoC1
A1,V2 → A5,V13
A5,V12 → A3,V6A5,IoC1 → A3,V6IoC1 → V6
A5,V13 → A3,V6
A5,V12 → A3,V7A5,IoC1 → A3,V7IoC1 → V7
A5,V13 → A3,V7
A5,V12 → A3,V8A5,IoC1 → A3,V8IoC1 → V8
A5,V13 → A3,V8
A1,V3 → A5,V12A1,V3A5,IoC1V3IoC1
A1,V3 → A5,V13
A1,V3 → A5,V12 → A3,V6A1,V3A5,IoC1 → A3,V6V3IoC1 → V6
A1,V3 → A5,V13 → A3,V6
A1,V3 → A5,V12 → A3,V7A1,V3A5,IoC1 → A3,V7V3IoC1 → V7
A1,V3 → A5,V13 → A3,V7
A1,V3 → A5,V12 →A3,V8A1,V3A5,IoC1 → A3,V8V3IoC1 → V8
A1,V3 → A5,V13 →A3,V8
Table 8. Estimation of the Exploitation Level (EL) for each identified asset/vulnerability combination.
VulnerabilityAssetExploitation Level (EL)
(Attacker’s Capability = Low)
V1A1ELV1 = H
V3A1ELV3 = H
V4A2ELV4 = H
V5A2ELV5 = M
V6A3ELV6 = L
V7A3ELV7 = VH
V8A3ELV8 = L
V9A4ELV9 = H
V10A4ELV10 = H
V11A4ELV11 = H
V12A5ELV12 = M
V13A5ELV13 = M
Table 9. Likelihood of exploitation estimation towards addressed vulnerabilities of the current threat scenario.
VulnerabilityAssetIndividual Vulnerability Level (IVL)Attacker’s Exploitability Level
Attacker’s Capability = Very Low (VL)Attacker’s Capability = Low (L)Attacker’s Capability = Moderate (M)Attacker’s Capability = High (H)Attacker’s Capability = Very High (VH)
V1A1VLV1 = VHMHHVHVH
V3A1VLV3 = VHMHHVHVH
V6A3VLV6 = MLLMHH
V7A3VLV7 = VHMHHVHVH
V8A3VLV8 = MLLMHH
Table 10. The likelihood of the attack path exploitation and the Attack Path Exploitability Level (APEL) are estimated given the IoC1.
Attack PathsEvidence ChainsExploitation Level Chain (ELC)
Attacker’s Capability = Low (L)
Exploitation ProbabilityAttack Path Exploitability Level (APEL)
A1,V1A5,IoC1 → A3,V6V1IoC1 → V6H → IoC1 → L0.75 × 1 × 0.25 = 0.19L
A1,V1A5,IoC1 → A3,V7V1IoC1 → V7H → IoC1 → H0.75 × 1 × 0.75 = 0.56M
A1,V1A5,IoC1 → A3,V8V1IoC1 → V8H → IoC1 → L0.75 × 1 × 0.25 = 0.19L
A1,V1A5,IoC1V1IoC1H → IoC10.75 × 1 = 0.75H
A5,IoC1 → A3,V6IoC1 → V6IoC1 → L1 × 0.25 = 0.25L
A5,IoC1 → A3,V7IoC1 → V7IoC1 → H1 × 0.75 = 0.75H
A5,IoC1 → A3,V8IoC1 → V8IoC1 → L1 × 0.25 = 0.25L
A1,V3A5,IoC1V3IoC1H → IoC10.75 × 1 = 0.75H
A1,V3A5,IoC1 → A3,V6V3IoC1 → V6H → IoC1 → L0.75 × 1 × 0.25 = 0.19L
A1,V3A5,IoC1 → A3,V7V3IoC1 → V7H → IoC1 → H0.75 × 1 × 0.75 = 0.56M
A1,V3A5,IoC1 → A3,V8V3IoC1 → V8H → IoC1 → L0.75 × 1 × 0.25 = 0.19L
Table 11. Attack paths that satisfy the current predefined threat scenario and the generated Evidence Chains are illustrated.
Attack PathsEvidence ChainExploitation Level Chains (ELC)Exploitation ProbabilityAttack Path Exploitability Level (APEL)
Attacker’s Capability = Low (L)
A1,V1 → A5,IoC1V1 → IoC1H → IoC10.75 × 1 = 0.75H
A5,IoC1 → A3,V7IoC1→ V7IoC1 → H1 × 0.75 = 0.75H
A1,V3 → A5,IoC1V3 → IoC1H → IoC10.75 × 1 = 0.75H
Publisher’s Note: MDPI stays neutral with regard to jurisdictional claims in published maps and institutional affiliations.

