Article

Performance of Millimeter Wave Dense Cellular Network Using Stretched Exponential Path Loss Model

1
Department of Telecommunications Engineering, NED University of Engineering and Technology, Karachi 75270, Pakistan
2
Department of Physics, NED University of Engineering and Technology, Karachi 75270, Pakistan
3
School of Computing and Engineering, University of West London, London W5 5RF, UK
*
Author to whom correspondence should be addressed.
Electronics 2022, 11(24), 4226; https://doi.org/10.3390/electronics11244226
Submission received: 31 October 2022 / Revised: 2 December 2022 / Accepted: 13 December 2022 / Published: 19 December 2022
(This article belongs to the Special Issue Smart Applications of 5G Network)

Abstract

:
Future wireless networks are expected to be dense and employ a higher frequency spectrum such as millimeter wave (mmwave) to support higher data rates. In a dense urban environment, the presence of obstructions causes the transmissions between the user equipment and base stations to transit from line-of-sight (LOS) to non-LOS (NLOS). This transit hence emphasizes the significance of NLOS links for reliable mmwave communication. The work presented in this paper investigates the downlink performance of a mmwave cellular system by modeling the NLOS channel using stretched exponential path loss model (SEPLM) and employing a 3GPP distance-dependent LOS probability function. This path loss model has the inherent ability to define short ranges as well as obstructions in the environment as a function of its parameter resulting in a more realistic performance analysis. The path loss model is first validated for NLOS link using a data set from an open-source mmwave channel simulator. Then, a mathematical model incorporating LOS and NLOS transmissions is developed to study the impact of path loss on signal-to-interference-plus-noise (SINR) coverage probability and area spectral efficiency (ASE). The proposed framework can provide coverage performance indication over various blockage environments. Our results demonstrate that SINR coverage probability decreases exponentially with increasing base station density. Moreover, ASE initially increases with increasing BS density and is maximized for a particular density value, after which it converges to zero for higher densities. The results are also benchmarked with the existing path loss model of mmwave cellular system with different exponents for LOS and NLOS paths. It was observed that as the base station density increases, the SINR degrades more rapidly when using SEPLM as compared to the existing mmwave path loss model.

1. Introduction

Densifying a cellular network by deploying a large number of small cells per unit area, widely known as an ultra-dense network (UDN), is the most appealing approach to increase the per-user data rate by exploiting spatial reuse of frequency resources among users. Essential features of UDN include short transmission ranges with different propagation characteristics, and discrete obstructions cause significant attenuation than the conventional free space path loss. Moreover, the irregular deployment of dense infrastructure introduces increased interference different from the existing cellular network [1,2,3,4,5,6]. On the other hand, the mmwave band scales up the network capacity and provides high data rates of multi-Gbps due to the abundant spectrum in the frequency range of 30–300 GHz. In addition, the propagation feature of mmwave signals, such as limited communication range, appears very attractive for UDN deployment. Accordingly, both of these are key inter-dependent technologies to address the requirements for enhanced coverage and capacity [7,8,9,10].
However, deploying mmwave for outdoor cellular communication has several associated challenges, such as LOS link establishment, directional communication and severe penetration losses. Due to these limitations, the range of a direct path in mmwave is limited with highly probabilistic LOS communication. The probability of an LOS link between user equipment (UE) and base station (BS) depends on numerous factors, such as building density, terrain features and locations of UEs. Moreover, because of the high deployment cost of mmwave networks, LOS channels might not always be feasible, and NLOS links should be considered for coverage [11]. Mmwave channel measurements and field experiments have shown that the signal received from reflections, i.e., NLOS paths, helps cover the shadowed region behind blockages. These NLOS signals supplement the LOS signal to increase capacity substantially. For an mmwave testbed operating at 29 GHz, channel measurements have shown that an NLOS connection reflected from a site located 1200 feet away could provide a superior received signal than the LOS where foliage or street infrastructure may obstruct the LOS path. The NLOS-reflected signals from objects such as concrete and the ground are found to be highly supportive for mobile communication and can be used to maintain the connection with attractive data rates even if a mobile device has moved out of the LOS coverage [12]. Using network optimization tools, it has been analyzed that interference due to potential reflection in NLOS links is negligible, and the reflected paths can be leveraged as an alternative to the LOS paths [13,14]. Performance evaluation of mmwave cellular network shows that in an environment with dense blockages, even if a large number of users connect to the BS through NLOS links, there is adequate coverage [15]. NLOS paths are also shown to facilitate localization and positioning in mmwave [16,17]. HM Consequently, when deploying mmwave technology in practice, it is necessary to understand what kind of performance can be obtained under a realistic outdoor environment that may have different blockages, such as different building densities, irregular town structures, etc. Hence, the modeling of NLOS links deserves special attention if sufficient coverage and rates are to be drawn.
For system-level analysis, the presence of blockages in an environment is abstracted to a LOS probability function. The impact of blockages is incorporated into the system model by distinguishing the LOS and NLOS paths with separate path loss expressions. The LOS path is shown to have behaviour similar to free space having a path loss exponent value of 2, while depending upon the environmental factors and obstacles density, the NLOS path loss exponent, has a greater value than the LOS exponent [13]. For analytical tractability, almost all prior works use the exponential blockage model [18,19,20,21,22] or the ball blockage model [23,24,25,26]. These models assume a single obstruction blocks the LOS path between BS and UE. However, in the case of outdoor environments or systems having antenna arrays, the beamwidths may encounter several obstacles, which can block the LOS path.
An alternate approach to model channel behaviour and the presence of blockages in urban areas is to stochastically define the propagation mechanism characterized by a few parameters, such as clutter in the environment and absorption. A channel model that reflects a rich scattering environment and regular city structure with a fixed number of blockages of the same size and orientation is proposed in [27,28]. The urban area sites are modeled using a random square lattice each having a blockage with some probability. The authors in [29] extend the previous research by considering the random orientation of blockages and signal penetration losses. The work in [22] models blockages with random size, orientation and location using random shape theory considering the height of the BSs, UEs, and buildings. The distribution of blockages is derived and the power loss of a signal that strikes on the blockages is also quantified. All these aforementioned works proposed an exponential path-loss formula as an alternative to the conventional path-loss formula. This is also supported by field measurements where exponential attenuation is shown to be a regular phenomenon due to the cluttered environment [30,31]. Similarly, the work in [22,32] developed a path loss formula to incorporate penetration loss on a given link, which indicates that due to the presence of blockages an additional exponential decay component is introduced in the link budget. In [33] SEPLM is proposed, which generalizes various exponential path loss models found in the literature [Table I, [33]. Recently, SEPLM has been used to analyze the uplink of several ultra-dense networks. [34,35,36,37].
Related to coverage analysis of mmwave network analytical frameworks using standard power-law path loss model for LOS and NLOS transmission due to blockage is developed in [23,24,25,26,38,39]. Results reported in these works establish that the SINR coverage probability decreases as BS density becomes greater than a certain value and ASE experiences slow growth and falls to zero. HM

Motivation and Contribution

All prior works to study coverage performance of mmwave cellular network [23,24,25,38,39,40] are based on the standard distance-dependent path loss model. The presence of blockages in an environment is abstracted to a LOS probability function that differentiates between LOS and NLOS paths by separate path loss exponents. This paper presents an alternate approach by modeling blockages in the environment as an element of large-scale fading with a certain probability of occurrence. As compared to the previous work, our main contributions can be summarized as follows:
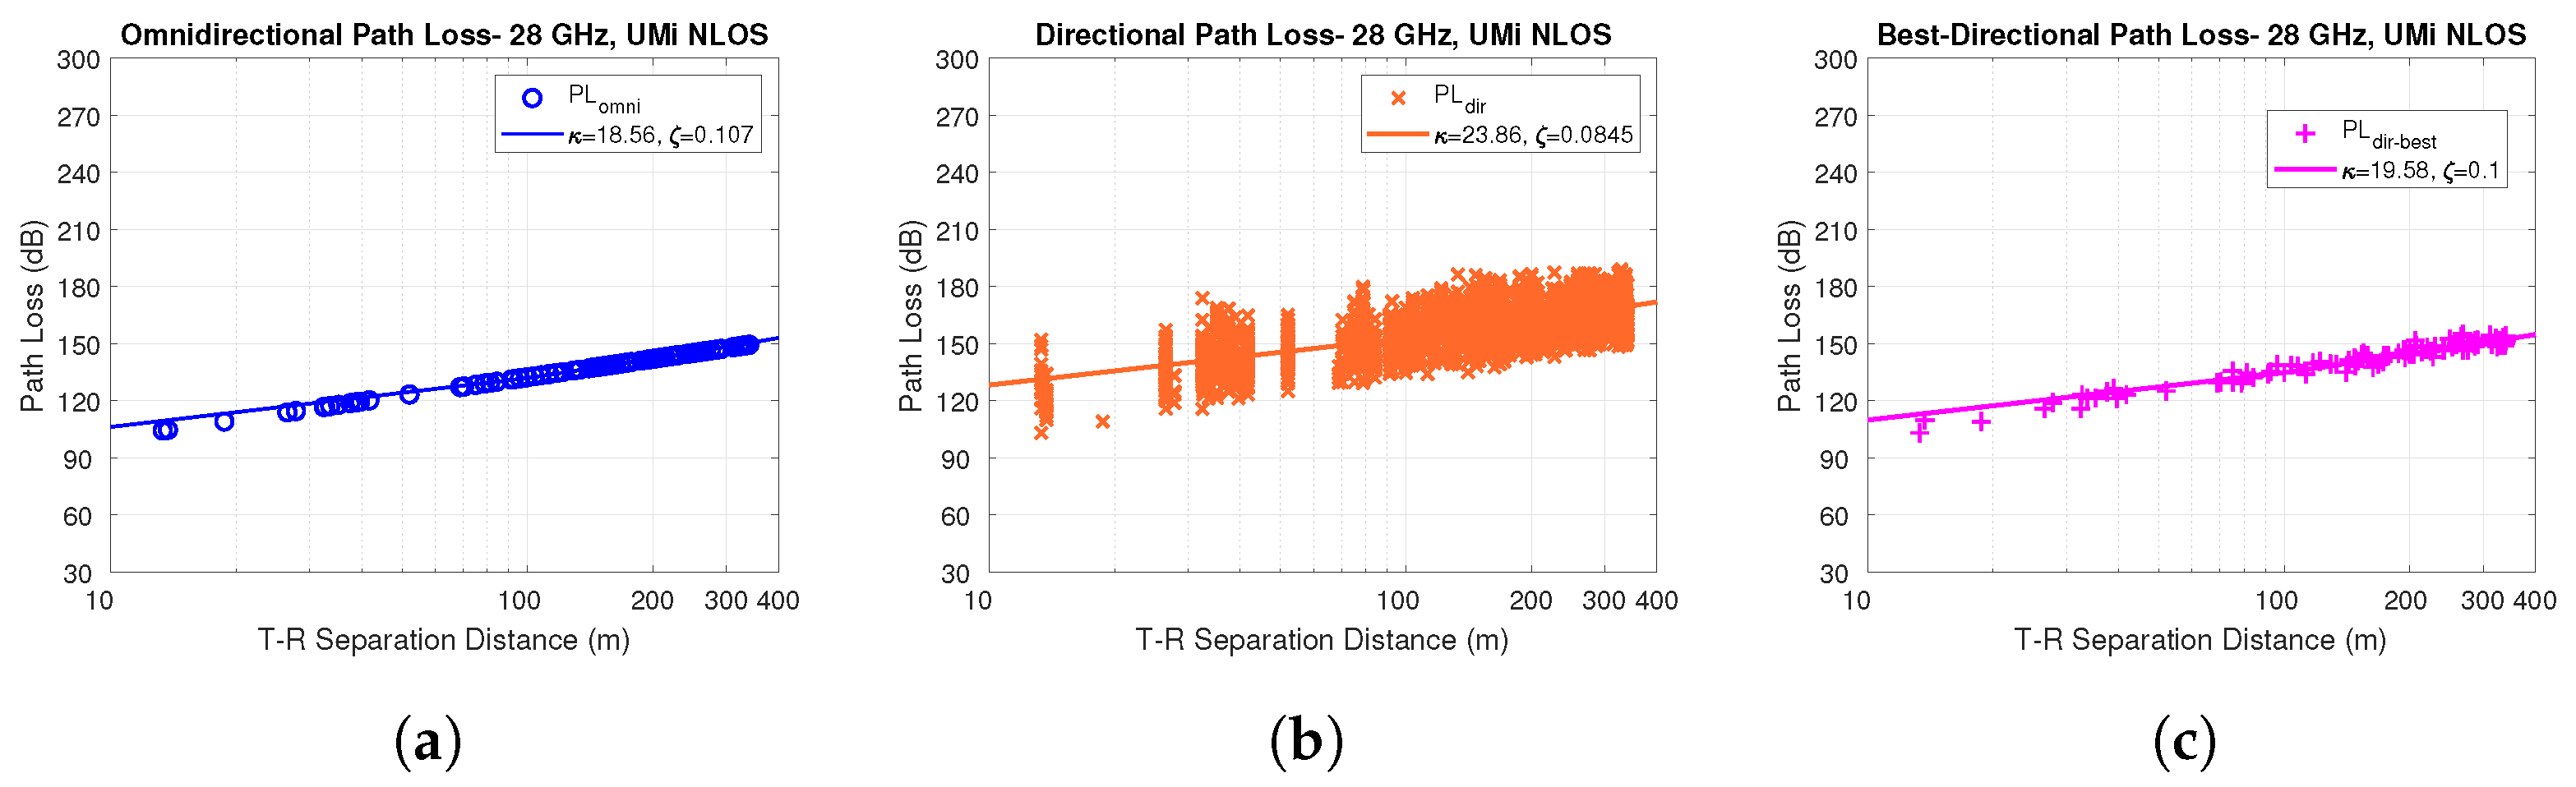
  • The SEPLM is validated for mmwave NLOS link using experimental measurement data from NYUSIM for an urban outdoor scenario.
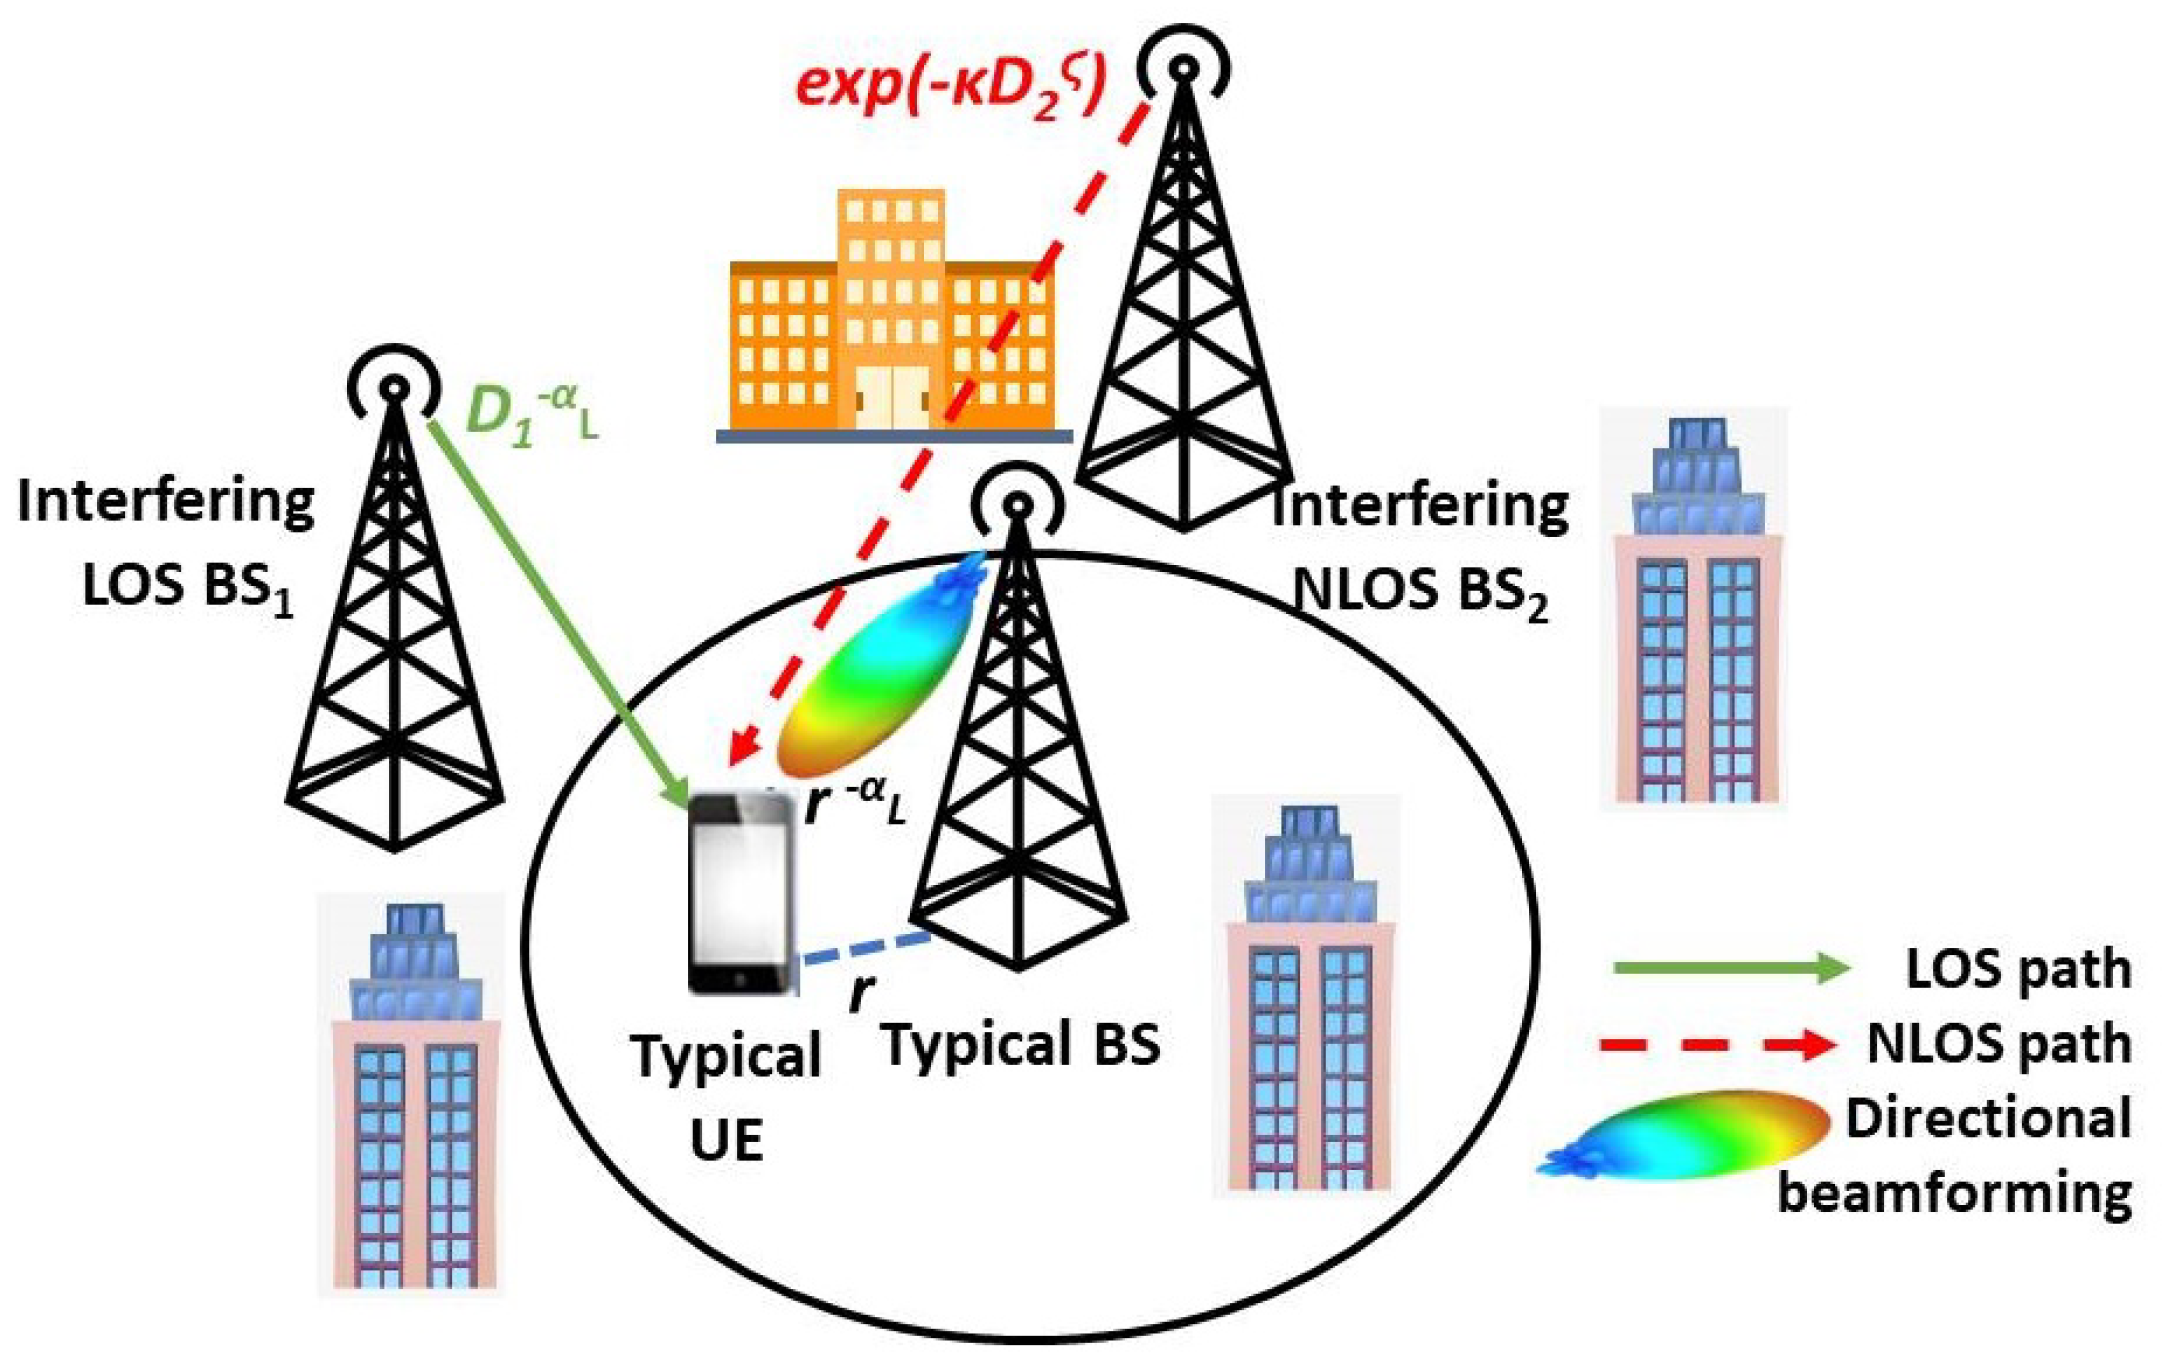
  • A system model is proposed where LOS links follow the standard distance-dependant path loss model and NLOS links are modeled using SEPLM. A 3GPP LOS probability is employed to determine the LOS and NLOS link state, and the impact of blockages in the surroundings is modeled as path loss parameters.
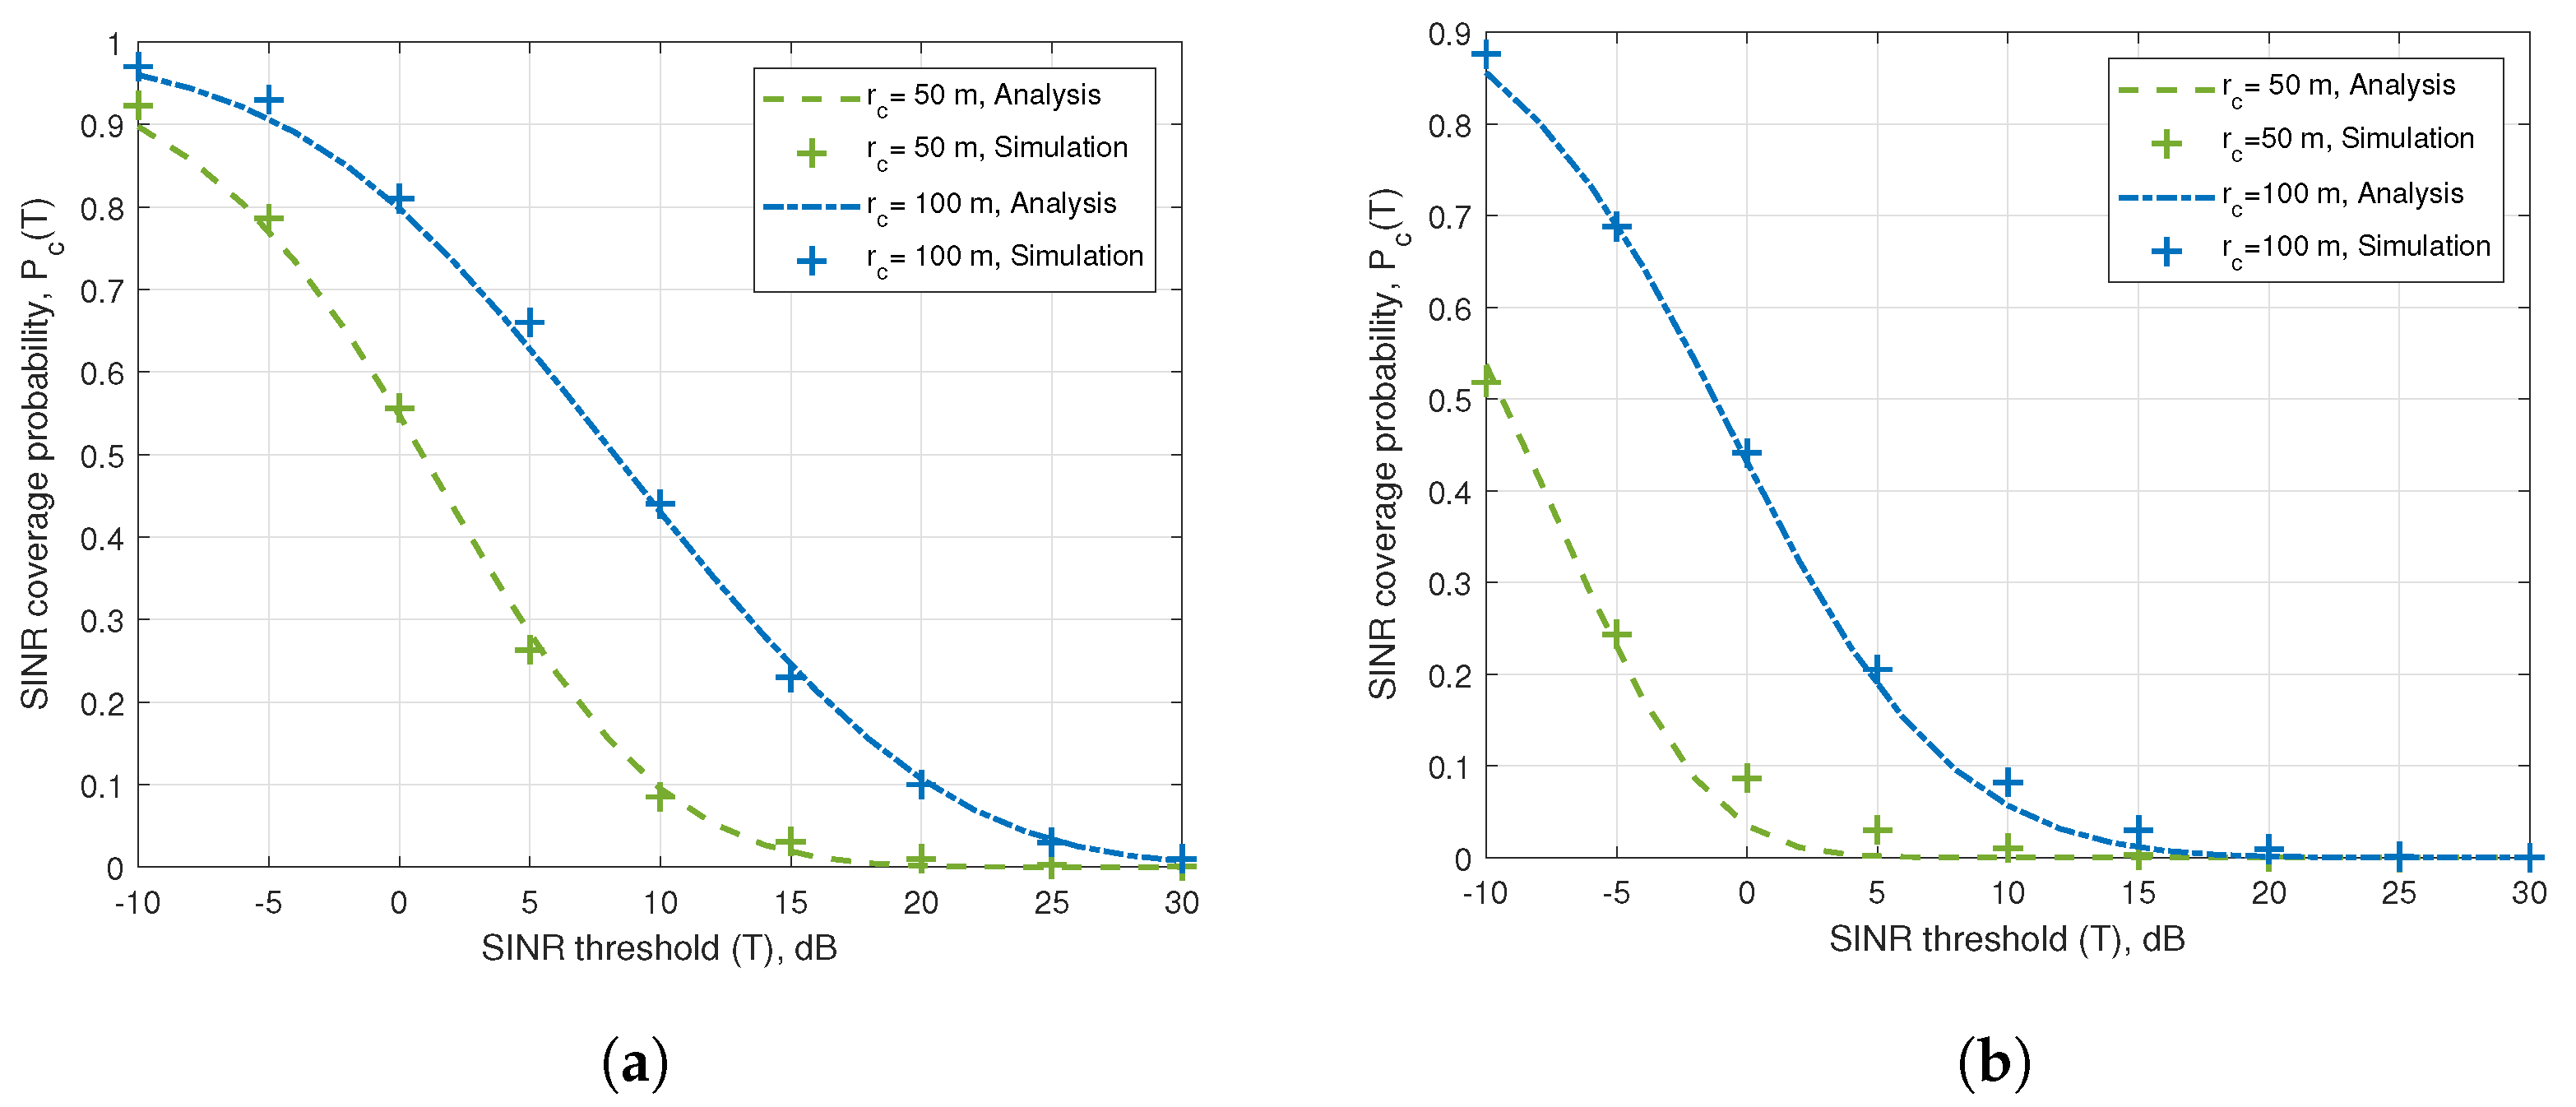
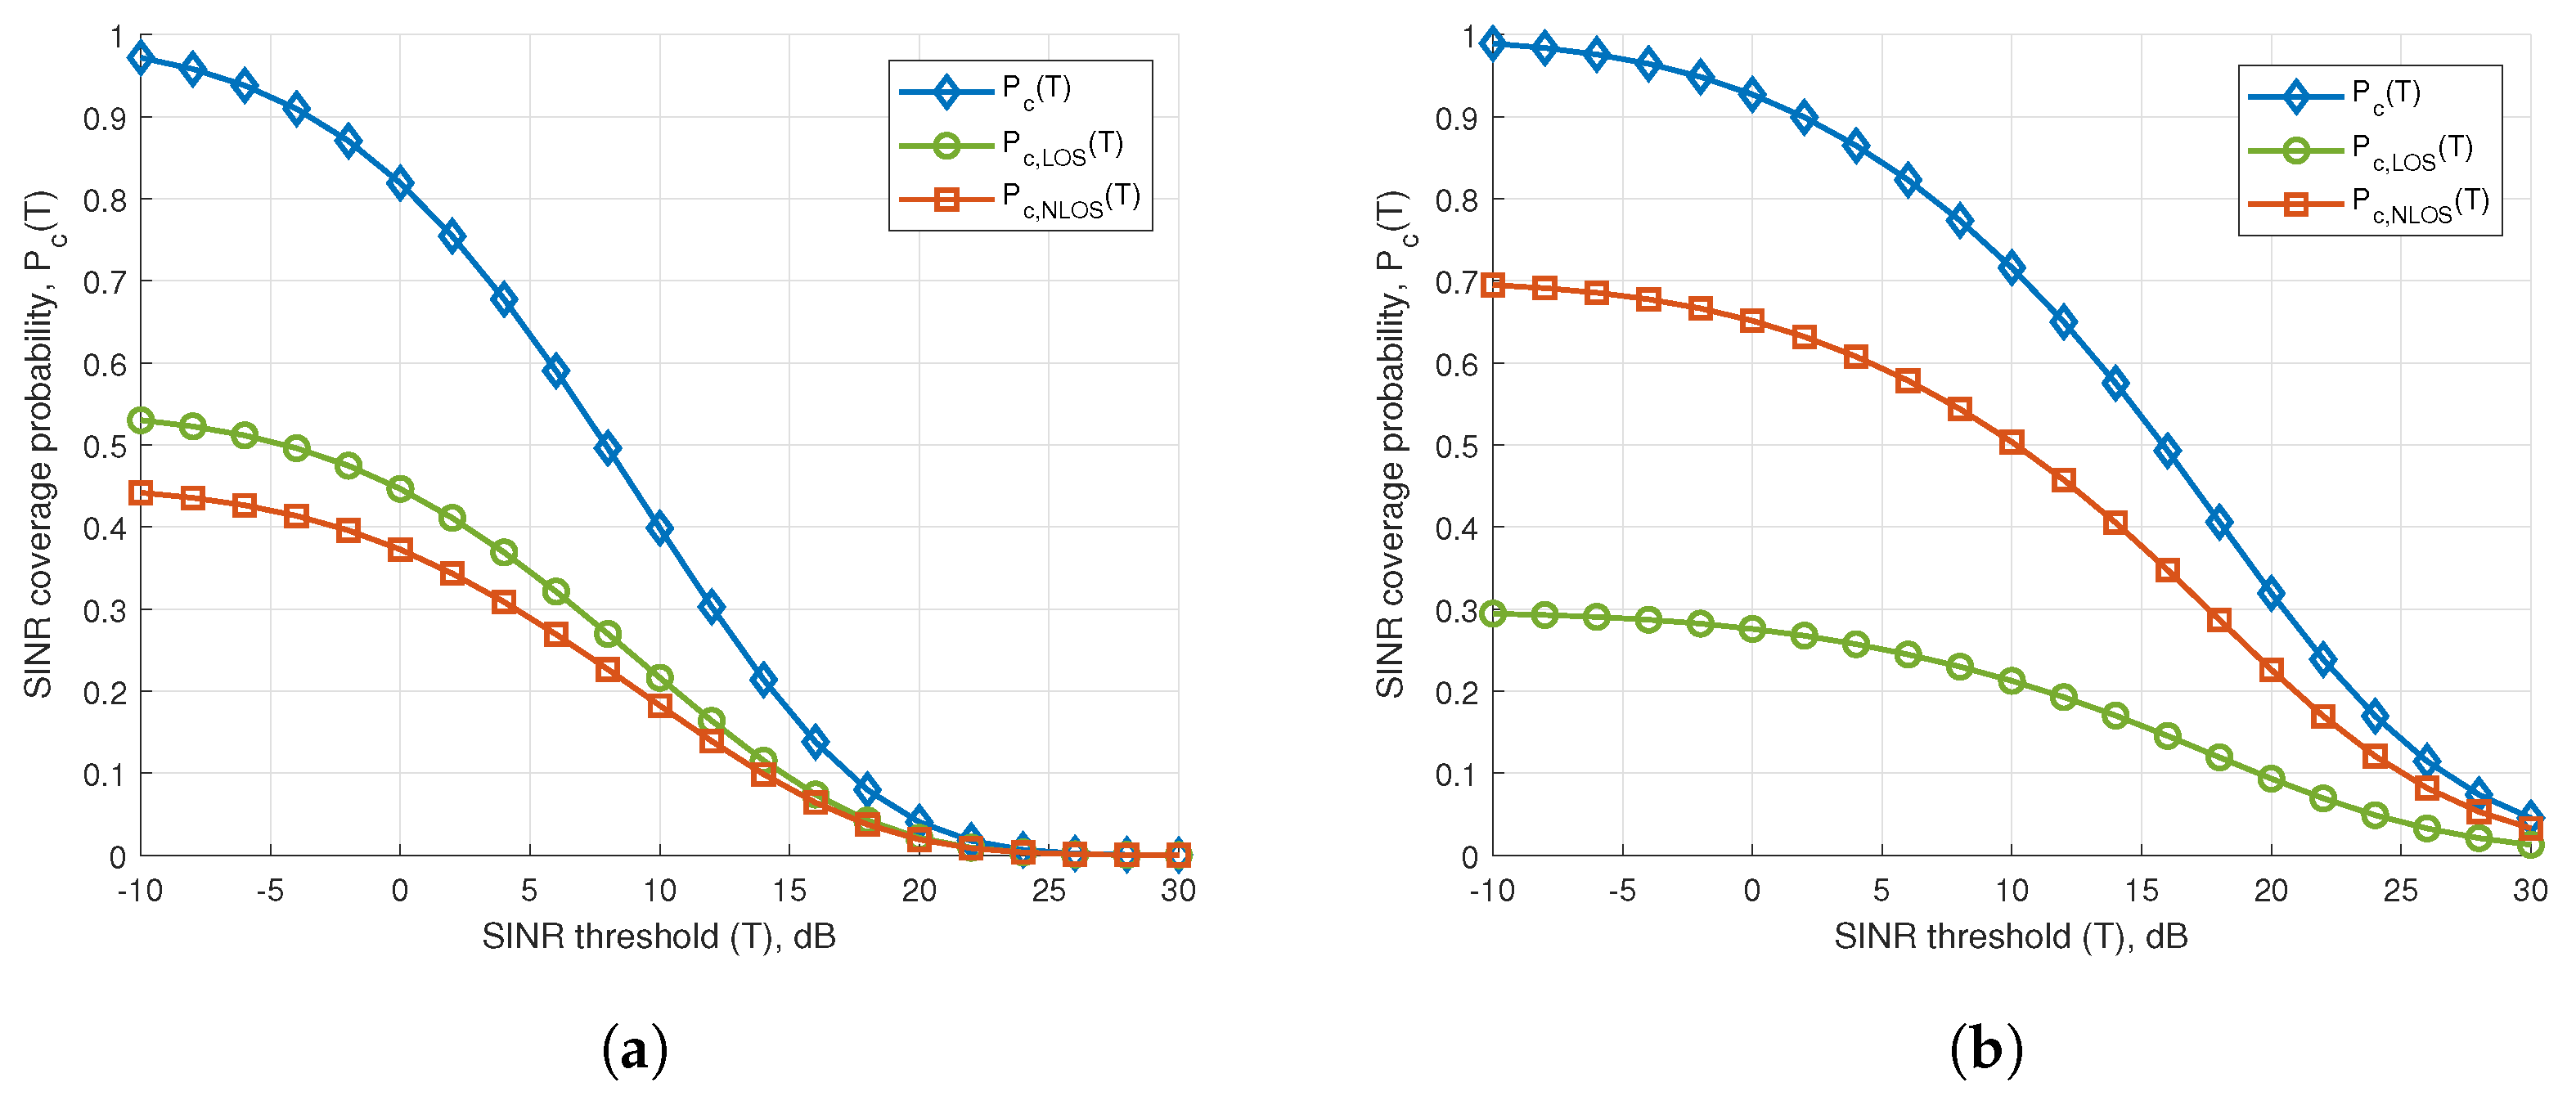
  • Based on the system model, stochastic geometry is used to derive generalized mathematical expressions for SINR coverage probability and ASE. The expressions are numerically analyzed to observe the performance over a range of SINR thresholds and BS densities.
Leveraging on the derived results, it has been observed that the SINR coverage probability varies with the path loss parameters that define different blockage environments. At high BS densities, coverage probability decreases exponentially and approaches zero. The ASE is found to be maximum for a certain BS density and approaches zero as density is further increased. Contrary to the noise-limited assumption of mmwave at a high cell radius, our proposed model shows that for cell radii 100–200 m, the coverage performance is degraded by network interference.
The rest of the paper is organized as follows. Section 2, presents our system model and all assumptions related to our analysis. Section 3, includes the mathematical formulation of downlink SINR coverage probability and ASE. In Section 4, the simulation and analytical results with discussions are presented. Section 5 concludes the paper.

2. System Model

2.1. Spatial Network Model

In this work, the downlink of an outdoor single-tier mmwave cellular network is considered. The BSs and UEs are located in R 2 according to Poisson point process (PPP) ϕ B and ϕ u of density λ and λ u respectively. The network assumes universal frequency reuse with each BS having the same bandwidth that is allocated equally to all UEs. λ u > > λ , and all BS have a single active UE to serve in its coverage area. HM The average cell radius ( r c ) of the network defines the inter-site distance used in BS planning as well as characterizes the BS density in a network given by r c = 1 / π λ . For tractability, all BSs as well as the UEs are assumed to transmit at fixed power. The UE for which performance analysis is being performed is termed as typical UE placed at the origin. HM It is assumed that each user associates with the BS providing the highest SINR [41]. The probability distribution function (PDF) of distance is given by:
f R ( r ) = 2 π λ r exp ( π λ r 2 )

2.2. Path Loss and Channel Model

The path loss on a link of length r is
l ( r ) = 𝟙 l L O S ( r ) p L O S ( r ) + 𝟙 l N L O S ( r ) ( 1 p L O S ( r ) )
Here, 𝟙 is a function that indicates an active link-state. Incorporating NLOS propagation in the path loss model accounts for the presence of obstacles in the path between BS and UE, which causes exponential attenuation [22]. Following the approach in [42], the blockages are modeled as an element of large-scale fading with a certain probability of occurrence. According to SEPLM, the signal attenuates over a distance r as follow [33]:
l N L O S ( r ) = exp ( κ r ζ )
where κ , ζ > 0 are path loss parameters that define several propagation environments. ζ defines the factor with which the obstructing objects scale with respect to the path length ( r ζ ) and κ is the average multiplicative attenuation caused by these obstructions. This path loss model is particularly used to describe an urban network where signal mostly attenuates due to discrete obstructions such as buildings, infrastructures, etc. and has been validated through empirical measurements data of an urban small cell environment within the distance range r [ 5 , 350 ] m for small to medium cell radii. The scaling of obstruction has the following interpretations:
  • ζ = 1 , defines the environment where the obstacles scale linearly with the path length between UE and BS. (3) can be written as L ( r ) = exp ( κ r ) . This case captures obstacles distribution similar to the one defined in [22], based on random shape theory that is widely adopted for performance analysis of mmwave networks. The randomly oriented obstacles are uniformly distributed over the plane intersecting the path length r between BS and UE and scales linearly with the distance r. κ in this case depends upon the attenuation of each blocking object.
  • ζ = 2 , defines the environment where the obstacle scales with r 2 . Assuming UE to be located at the centre of a disc B ( 0 , r ) and signal propagates within the disc sector extending to the BS, (3) can be written as L ( r ) = exp ( κ r 2 ) and takes the form analogous to LOS probability function in [43] expressed as exp ( ( r L ) 2 ) , where L depends upon the density of large obstructing objects in the propagation environment. A larger value of κ signifies a sparse environment having high LOS probability with distance.
  • ζ < 1 defines the case similar to the ray propagation in lattice modeling of urban areas with regular building blockage [28]. Here, κ depends on the properties of the considered lattice and the reflectivity of the obstacle.
  • The special values of ( κ , ζ ) = ( 0.3 , 2 / 3 ) and ( 0.94 , 1 / 2 ) in SEPLM reduces to multislope path loss model [44] consistent with the one adopted in 3GPP standardization.
Accordingly, the path loss on the LOS and NLOS links L L O S ( r ) and L N L O S ( r ) are defined as follows:
l ( r ) = l L O S ( r ) = r α L l N L O S ( r ) = exp ( κ r ζ )
Here, α L is the LOS path loss exponent. The probability of a link being in LOS ( p L O S ( r ) ), specified by 3GPP for outdoor urban microcellular environment is considered in this analysis [45],
p L O S ( r ) = exp r L
Similarly, the probability of the link being in NLOS state is given by:
p N L O S ( r ) = 1 p L O S ( r ) = 1 exp r L
L is a parameter that determines the likelihood of LOS of a certain propagation environment as a function of the distance. For each link between a UE and its tagged BS and between interfering UEs and typical BS, Rayleigh fading is assumed.

2.3. Antenna Model

The BSs and UEs employ directional beamforming that estimates AoAs and steers the main lobe beam in the preferred direction to achieve maximum directivity gain. For an approximation of the beamforming pattern sectored antenna model is utilized and is defined by three parameters: the main lobe gain G 0 j , the main lobe beamwidth θ j and the side lobe gain G s l j for j B S , U E [22]. The beam direction of typical UE and tagged BS are perfectly aligned leading to a maximum gain of G 0 B S G 0 U E . The beam direction of interferers and typical BS is independent and has uniform distribution from 0 , 2 π . Therefore, the gain of the interfering beams is a discrete random variable, G Z = a k having a probability b k for k = 1 , 2 , 3 , 4 is given below [38]:
G Z = G 0 U E G 0 B S with probability P G 0 U E G 0 B S = ( ϕ U E 2 π ) ( ϕ B S 2 π ) G 0 U E G s l B S with probability P G 0 U E G s l B S = ( ϕ U E 2 π ) ( 1 ϕ B S 2 π ) G s l U E G 0 B S with probability P G s l U E G 0 B S = ( 1 ϕ U E 2 π ) ( ϕ B S 2 π ) G s l U E G s l B S with probability P G s l U E G s l B S = ( 1 ϕ U E 2 π ) ( 1 ϕ B S 2 π )
Figure 1 presents our system model of the downlink mmwave cellular network. Two interfering BSs are shown, BS 1 is in LOS to the typical BS and BS 2 is in NLOS to the typical UE, thus causing LOS and NLOS interference, respectively. The path loss on the LOS interfering link is D 1 α L , where D 1 is the path length between typical UE and interfering BS 1 . The path loss on the NLOS interfering link is exp ( κ D 2 ζ ) , where D 2 is the path length between typical UE and interfering BS 2 . The path loss on the desired link is r α L . HM Table 1 provides a list of various notations related to the system model used throughout this work.

3. SINR Coverage Probability and Area Spectral Efficiency

This section presents mathematical expressions for analyzing coverage probability and area spectral efficiency of a typical UE based on the system model defined in Section 2.

3.1. SINR Coverage Probability

For a given SINR threshold (T), the probability of SINR coverage denoted by P c ( T ) is mathematically given by P c T = P [ SIN R > T ] . The SINR received at typical UE at a distance r is:
SIN R = | h 0 | 2 G 0 B S G 0 U E l r σ 2 + Z ϕ Z I Z
I Z in the above expression represents total interference in the network and is given as:
I Z = Z ϕ Z | h Z | 2 G Z l D Z
The channel fading power on the desired link follows an exponential distribution i.e., | h 0 | 2 exp ( 1 ) . G 0 U E and G 0 B S are the antenna gains of typical UE and tagged BS. | h Z | 2 is the normalized fading power on interfering link. An interfering BS is located at a distance D z from the tagged BS. l r and l D z are the path losses on the desired link and interfering links, respectively. The term σ 2 represents zero mean thermal noise power. ϕ Z represents the point process of interfering s and z denotes the interfering BS with antenna gain G Z . Depending upon the propagation distance, the serving BS can either be in LOS or NLOS to the typical UE. According to the law of total probability, the SINR coverage probability P c ( T ) can be expressed as:
P c ( T ) = p L O S ( r ) P c , L O S ( T ) + p N L O S ( r ) P c , N L O S ( T )
The derived expression for the probability of SINR coverage P c T averaged over R 2 conditioned on the nearest BS at a distance r from the typical UE is given below:
P c ( T ) = 2 π λ 0 exp μ L σ 2 exp 2 π λ G G z P G z r 1 1 1 + μ L G z t α L t p L O S ( t ) d t r exp ( π λ r 2 ) r p L O S ( r ) d r + 2 π λ 0 r exp λ π r 2 × exp 2 π λ ζ κ 2 ζ 4 k = 1 b k 0 e x p κ r ζ s a k 1 + s a k u l n u 2 ζ ζ p N L O S l n ( u ) κ 1 ζ d u p N L O S ( r ) d r
Proof. 
The proof is given in Appendix A. □
HM The integrals obtained for total coverage probability are too complex to be evaluated in the closed form. The expression can only be simplified in its closed form for special values of ζ in the following subsection.

3.1.1. ζ = 2 1 + p , Where p Is a Positive Integer

The derived expression of NLOS coverage probability for the special case of ζ = 2 1 + p is given below:
P c , N L O S T = 2 π λ 0 r exp p + 1 q = 0 λ α q T a v k r 2 q p + 1 d r
where,
α q T a v k = 4 k = 1 π p + 1 ! q ! κ p q + 1 b k L i p q + 1 T a v k 0 q p π q = p + 1
L i k denotes the kth order polylogarithmic function given by:
L i p q + 1 T a v k = T a v k 0 1 e c + T a v k ( c ) p q d c
Proof. 
The proof is given in Appendix A.2. □

3.1.2. ζ = 2

The NLOS coverage probability takes its simplest form for ζ = 2 , which corresponds to p = 0 , and it is given as:
P c , N L O S T = exp k = 1 4 b k π λ κ l n 1 + T a v k
Proof. 
This follows from simplifying (12). □
For theoretical insights on the effect of increasing BS density on the downlink coverage performance of mmwave network, we consider the simplified expression obtained for ζ = 2. The SINR coverage probability is a decreasing exponential function of BS density and approaches zero when λ . This is due to the increased LOS interference in a dense network.

3.1.3. ζ = 1

The NLOS coverage probability expression in (12) simplifies to the following expression for ζ = 1 .
P c , N L O S ( T ) = 4 k = 1 exp 2 π λ κ 2 b k L i 2 T a v k × 1 2 π λ κ b k y T a v k e π λ b k 2 y 2 ( T a v k ) κ 2 Q 2 π λ κ b k y T a v k
where y T a v k = l n 1 + T a v k and Q ( ) is the Q-function.
Proof. 
The proof is given in Appendix A.3

3.2. Area Spectral Efficiency

To study ASE and to quantify the maximum number of transmitted bits per second per unit bandwidth per unit area (bps/Hz/m 2 ) the definition in [44] is used. It indicates the increase in achievable data rate as the network density is increased by adding more BSs. It is given by:
A S E = λ l o g 2 1 + T P c T
By substituting the coverage probability expression obtained in (11) the above expression can be simplified as follow:
A S E = λ l o g 2 1 + T 2 π λ 0 exp 2 π λ G G z P G z r 1 1 1 + μ L G z t α L t p L O S ( t ) d t r exp ( π λ r 2 ) r p L O S ( r ) d r + 2 π λ 0 r exp p + 1 q = 0 λ α q T a v k r 2 q p + 1 d r

3.2.1. ASE for ζ = 2

ASE for the simplified case ζ = 2 is given as follow,
A S E = λ log 2 1 + T 2 π λ 0 exp 2 π λ G G z P G z r 1 1 1 + μ L G z t α L t p L O S ( t ) d t r exp ( π λ r 2 ) r p L O S ( r ) d r + exp k = 1 4 b k π λ κ l n 1 + T a v k

3.2.2. ASE for ζ = 1

ASE for ζ = 1 is given as follows:
A S E = λ log 2 1 + T 2 π λ 0 exp 2 π λ G G z P G z r 1 1 1 + μ L G z t α L t p L O S ( t ) d t r exp ( π λ r 2 ) r p L O S ( r ) d r + 4 k = 1 exp 2 π λ κ 2 b k L i 2 T a v k × 1 2 π λ κ b k y T a v k e π λ b k 2 y 2 ( T a v k ) κ 2 Q 2 π λ κ b k y T a v k
For theoretical insight into the network performance, it can be observed that each component of the expression of coverage probability and ASE depends on the PDF of the distance between UE and typical BS, which has two terms, a linear function λ and a negative exponential function having λ in the argument. For higher values of λ , the exponential term decays exponentially to zero. Therefore, the coverage probability as well as ASE approaches zero.

4. Simulation Results and Discussions

Fitting the Path Loss Model

The SEPLM is verified and validated for mmwave NLOS links with actual path loss measurement data at 28 GHz obtained through an open-source channel simulator NYUSIM [46]. NYUSIM generates static and independent samples of channel impulse responses for different separation distances between transmitter and receiver. The parameters fed into NYUSIM are listed in Table 2. A scatter plot of omnidirectional and directional path loss over the specified distance range is generated from a continuous run of simulations. For finding the best fit of the parameters κ and ζ , a linear mean-square estimate is employed [47], and details are provided in Appendix B. The directional, directional-best and omnidirectional path loss measurement data, along with the fitted SEPLM parameters, are shown in Figure 2a–c. It can be seen that, for the specified range, SEPLM can adequately describe the path loss characteristics of NLOS link and the path loss parameters are set differently according to the environment.
The derived expressions for special cases of obstacle scaling factor ζ = 1 and ζ = 2 in Section 3 are evaluated numerically according to the parameters listed in Table 3. Although the derived expressions are mathematically complex in their generalized form, they are numerically computed easily using MATLAB. The numerical evaluation of derived expressions is also compared with simulation results. For simulation, the system model of Section 2 is produced by considering a circular area and the BSs are located uniform randomly over the entire area. Typical UE is placed at the origin. The coordinates of tagged BS from the origin are computed using minimum distance. The euclidean distance between interfering BSs and the tagged BS is computed. Depending on the distance, using the LOS probability function in (5), LOS and NLOS BSs are determined. The beamforming gains on desired and interfering links are then defined. Independent channel gains are modeled for each desired and interfering link by generating exponentially distributed fading power for LOS and NLOS channels. SINR is computed using (8).
In Figure 3a,b, SINR coverage probability is plotted vs. the SINR threshold for a set of SEPLM parameters κ and ζ to model different propagation environments. The analytical and simulation results are closely matched for two cell radii. An increasing value of ζ is observed to cause a decrease in coverage probability due to increased path loss for higher values of ζ . Smaller values of ζ represent an environment with sparse obstacles and few objects obstruct the link between UE and its serving BS. As a result, the probability of UE associating with the nearest BS with a minimum obstructed path is higher than the environment with dense obstacles (for higher values of ζ ), consequently, coverage probability decreases as ζ increases. According to SEPLM, obstructions along with the path r scales as r ζ causing an attenuation κ . As ζ increases, the obstacles scale at a faster rate with distance causing more blockages and attenuation, hence the increased path loss. Since path loss directly affects received SINR, therefore SINR coverage probability is decreased.
Figure 3 also explores the impact of varying cell radius on the coverage probability in varying ζ environments. It is found that the SINR coverage probability is reduced at a small cell radius ( r c = 50 m) because as the cell radius is decreased, the distance between BSs is reduced, which brings the interfering BSs closer to the tagged BS. As a result, coverage probability decreases due to strong network interference that lies closer to tagged BS. Furthermore, at increased cell radius, the reflections may enable NLOS links and hence the increase in coverage probability due to NLOS paths. It has also been observed in [22,48] that NLOS paths provide sufficient gains to recover for path loss due to the LOS link. Moreover, at increased cell radius, the obstructions are more, causing some of the dominant interference to be suppressed, thereby enhancing the coverage probability.
To elaborate further, in Figure 4, the SINR coverage probability of LOS and NLOS path is plotted along with the total coverage probability for different values of cell radii, r c = 50 m and r c = 100 m. It can be observed that the probability of NLOS coverage is higher than the LOS coverage for a larger cell radius. This is in line with the observation in [38], that at increased cell radius, the associated BS is mostly in NLOS with the UE.
In Figure 5, the effect of BS density on SINR coverage probability is studied for different values of obstacle scaling factor ( ζ ). It is observed that the total coverage probability decreases exponentially to zero for high BS density. It is also observed that when BS density is low, the NLOS coverage probability is higher than the LOS coverage probability implying that in the closest association, UEs are associated with NLOS BS. As BS density increases, NLOS coverage keeps on decreasing. On the other hand, LOS coverage is initially low and begins increasing but does not increase significantly as BS density increases. This is because of the fact that, as BS density increases, the aggregate network interference increases, causing a reduction in coverage probability. These results are in line with various research [38,49,50]. The drop in coverage probability is more for higher values of ζ , which represents a highly obstructive environment. Similar insights for the downlink microwave network are obtained in [33]. According to our system model and assumption, the total coverage probability follows a trend similar to the coverage of the NLOS path. This emphasizes the significance of NLOS links in mmwave communication.
HM In Figure 6 the impact of different BS antenna parameters is studied on the SINR coverage probability at r c = 100 m. The UE beam is fixed at G 0 U E = 10 dB, G 0 s l = −10 dB and θ U E = 30 . It can be observed that increasing the BS antenna gain increases the coverage probability. Whereas increasing the beamwidth of the BS antenna makes the main lobe wider, and coverage probability is reduced due to a decrease in directionality.
Figure 7 shows that ASE is not a monotonic function; instead, it initially increases with increasing BS densities and reaches a peak value at a certain BS density, after which it decreases and falls to zero. For each value of ζ , the ASE curve has a similar trend but different maximum ASE values and decay rates. In an environment with high obstructions, ASE quickly drops to zero as BS densities are increased with low achievable ASE, whereas, in an environment with medium to sparse obstructions, sufficient ASE can be attained before it drops to zero. Consequently, network designers can decide the maximum BS density value that yields adequate ASE in different obstructive environments. As in a highly obstructive environment, deploying more BSs may not be beneficial. Similar insights are obtained in [33] for the downlink microwave network. However, the obtainable data rates in the case of an mmwave network are significantly higher than that of a microwave network. For ASE comparison purposes, a microwave network operating at 2 GHz is also simulated. It can be observed that due to its high bandwidth, the ASE obtained from the mmwave NLOS links are also higher than the microwave network, which is further increased by the addition of LOS links.
To emphasize the practicality of our work, in Figure 8, the methodology present in this paper is compared with the existing widely adopted path loss model for mmwave in [38] under the same system assumptions (i.e., ignoring the noise and assuming Rayleigh fading) and antenna gain. The presence of thermal noise in the system is ignored to study the impact of path loss alone on coverage performance. Moreover, in dense cellular networks, noise power has negligible impact as compared to interference. Hence noise can be ignored. It can be observed that at a high cell radius ( r c > 100 m), our proposed model shows that the coverage probability increases with the increasing cell radii due to weaker interference power as the distances between BS increase. In line with the findings in [38], at r c > 100 m, the SIR coverage probability is high, due to weaker interference power and/or blocked interference components leading to improved performance. However, when employing SEPLM, the coverage probability shows significant improvement in coverage as the cell radius increases from 100 m to 200 m, while the mmwave system with traditional path loss does not show such variations. HM This work is also compared with mmwave small cell network in [25,26], which employs an inter-cell interference coordination (ICIC) scheme to mitigate interference in the dense network for improved coverage and capacity. It can be observed that SEPLM provides better coverage performance as compared to the conventional path loss model with opportunistic interference cancellation mechanism at different blockage densities. Similarly, it can also be observed that when using SEPLM as BS density is increased the coverage probability is reduced due to increasing interference power from nearby BS as illustrated in Figure 5. On the contrary, the existing path loss model shows a slow decline in SIR when increasing BS densities.

5. Conclusions

In this paper, a mathematical framework for downlink mmwave cellular network has been proposed where the NLOS path is modeled by SEPLM and a 3GPP LOS probability function. The SEPLM was first validated for mmwave NLOS channel using data from an open source measurement-based simulator NYUSIM, and then a stochastic geometry-based mathematical model for mmwave communication in an outdoor scenario with obstructions has been developed. Using this developed model, the impact of cell radii, BS densities, and obstructions/ blockages on SINR coverage probability and ASE has been investigated. Our analysis shows that the SINR coverage probability is improved as the cell radius is increased. The coverage probability decreases as the number of obstructions in the environment increases because of increased BS blockage. It is also determined that, as network density increases, the coverage probability falls exponentially to zero due to increased network interference. The ASE is observed to increase linearly with increasing BS densities reaching a maximum value and then dropping to zero. It is also found that the achievable ASE is low for a highly obstructive environment and cannot be increased by deploying more BSs. As a more realistic path loss model for mmwave, SEPLM shows a strong dependence on cell radius and BS compared to the existing path loss model resulting in different coverage performance.
HM The coverage probability derived in this work utilizes a sectored antenna model for simplified analysis. In future, this work can be extended to include realistic antenna patterns with the main lobe and observe the impact of beamforming in a dense network. Furthermore, the path loss parameters used and validated in this work mainly assume static blockages (such as buildings) in an urban microcellular scenario. In future, more investigation is required to determine the impact of blockage on the path loss parameters in different propagation environments.

Author Contributions

Conceptualization, H.M., I.A. and M.I.A.; methodology, H.M. and S.A.; software, H.M.; validation, H.M., M.I.A. and I.A.; formal analysis, H.M.; investigation, H.M., I.A. and I.U.R.; writing—original draft preparation, H.M.; writing—review and editing, H.M., I.A., S.A., M.I.A. and I.U.R.; supervision, I.A. and M.I.A. All authors have read and agreed to the published version of the manuscript.

Funding

This research received no external funding.

Data Availability Statement

The data set supporting reported results in Figure 2 is generated using https://wireless.engineering.nyu.edu/nyusim/(accessed on 31 October 2022).

Conflicts of Interest

The authors declare no conflict of interest.

Appendix A. Derivation of SINR Coverage Probability

The LOS coverage probability can be written as
P c , L O S T = P | h L 0 | 2 G 0 B S G 0 U E l r σ 2 + I z > T
= P | h L 0 | 2 > T σ 2 + I z G 0 B S G 0 U E l r
E e T σ 2 + I z G 0 B S G 0 U E l r
E e μ σ 2 E e μ L I Z
E e μ L σ 2 L I Z μ L
P c , L O S ( T ) = 0 L I Z μ L f R r d r
Let us denote μ L = T G 0 B S G 0 U E r α L in (A4). L I Z μ L in (A5) is the LT of LOS interference components and by definition, L I s = E e s I . (A6) represents the coverage probability conditioned on the PDF of the distance between typical UE and its nearest serving BS denoted by f R r in (A6) defined in (1), and assuming σ 2 < < I Z .
Similarly, the SINR in the NLOS link between BS and typical UE can be written as,
SIN R N L O S = | h N 0 | 2 G 0 B S G 0 U E l N L O S ( r ) σ 2 + z ϕ Z | h z 2 | G z l ( D z )
and the NLOS conditional coverage probability is given as
P c , NLOS ( T ) = E e μ N σ 2 L I Z μ N
P c , N L O S ( T ) = 0 L I Z μ N f R r d r
Here, μ N = T G 0 B S G 0 U E e x p κ r ζ and σ 2 < < I Z .

Appendix A.1. Laplace Transform of Interference

According to the thinning property of PPP the interference components can be split into independent PPPs for the LOS and NLOS BS.
I z = I L O S + I N L O S
I L O S = z ϕ L | h L | 2 G z l L O S ( D z )
I N L O S = z ϕ N | h N | 2 G z l N L O S ( D z )
The LT of interference caused by LOS BSs can be derived according to the following steps:
L I L O S ( μ L ) = E [ exp ( μ L I L O S ) ]
= E ϕ L exp μ L z ϕ L B ( 0 , r ) | h z | 2 G z D z α L
= E G z , D z , h z z ϕ L B ( 0 , r ) exp μ L | h z | 2 G z D z α L
= E G z z ϕ L B ( 0 , r ) E D z 1 1 + μ L G z D z α L
= exp 2 π λ E G z r 1 1 1 + μ L G z t α L t p L O S ( t ) d t
= exp 2 π λ G G z P G z r 1 1 1 + μ L G z t α L t p L O S ( t ) d t
where (A15) is due to the independence of random variables G z , D z , h z across ϕ L . (A16) is due to the MGF of h z . (A17) is using PGFL of a PPP [51] and P G z in (A18) is given in (7).
The LT of interference caused by NLOS BSs can be derived according to the following steps:
L I N L O S μ L = E exp μ L I N L O S
= E ϕ Z exp μ L z ϕ Z B 0 , r | h z | 2 G z l D z
= E G z , D z , h z z ϕ Z B 0 , r exp μ | h z | 2 G z e x p κ D z ζ
= exp 2 π λ 4 k = 1 b k r E h z 1 exp μ L a k | h z | 2 e x p κ t ζ t p N L O S ( t ) d t
= exp 2 π λ ζ ( κ ) 2 ζ 4 k = 1 b k 0 e x p κ t ζ E h z 1 exp μ L a k | h z | 2 u u ln ( u ) 2 ζ ζ p N L O S l n ( u ) κ 1 ζ d u
= exp 2 π λ ζ ( κ ) 2 ζ 4 k = 1 b k 0 e x p κ t ζ 1 1 1 + μ L a k u u ln ( u ) 2 ζ ζ p N L O S l n ( u ) κ 1 ζ d u
= exp 2 π λ ζ κ 2 ζ 4 k = 1 b k 0 e x p κ r ζ μ L a k 1 + μ L a k u l n u 2 ζ ζ p N L O S l n ( u ) κ 1 ζ d u
(A22) is obtained by using PGFL of PPP and by substituting u = exp ( κ t ζ ) . The integration limits from r to , implies that the closest interferer lies at least at a distance r from tagged BS. (A23) is from moment generating function of h z exp ( 1 ) and a k and b k are constants defined in (7).

Appendix A.2. Laplace Transform for ζ = 2 p + 1

The LT for ζ = 2 p + 1 is derived in the following steps. Substituting s = T e x p κ r ζ G 0 B S G 0 U E and ω = u e x p κ r ζ and letting a v k = a k G 0 B S G 0 U E , we obtain (A26)–(A31),
L I μ N = exp 2 π λ T ζ κ 2 ζ 4 k = 1 b k 0 1 a v k ( l n ω α r ζ ) 2 ζ ζ 1 + T a v k ω d ω
= exp π λ T p + 1 ( κ ) p + 1 4 k = 1 b k 0 1 a v k ( l n ω κ r 2 p + 1 ) p 1 + T a v k ω d ω
= exp p q = 0 q p 1 q κ q r 2 q p + 1 p + 1 π λ T ( κ ) p + 1 4 k = 1 b k a v k 0 1 l n ( ω ) p q 1 + T a v k ω d ω
= exp p q = 0 q p κ q r 2 q p + 1 p + 1 π λ T κ p + 1 4 k = 1 b k a v k 0 1 e c + T a v k ( c ) p q d c
= exp p q = 0 q p κ q r 2 q p + 1 p + 1 π λ T κ p + 1 4 k = 1 b k a v k Γ p q + 1 L i p q + 1 T a v k
= exp p q = 0 λ α q T a v k r 2 q p + 1
(A29) is obtained from substitution of c = l n ( ω ) and from binomial expansion. (A30) is by using integral representation of polylogarithmic function where L i k denotes kth order polylogarithmic function L i p q + 1 T a v k = T a v k 0 1 e c + T a v k p q c d c . Letting α q T a v k = k = 1 4 π p + 1 ! q ! α p q + 1 b k L i p q + 1 T a v k and α p + 1 = π in (A31) and averaging over the serving distance final expression for mmwave coverage probability in (12) is obtained.

Appendix A.3. Laplace Transform for ζ = 1

For ζ = 1 which corresponds to p = 1 , (12) can be expanded in following steps,
P c T = 2 π λ 0 r exp 2 q = 0 λ α q T a v k r q d r
= 2 π λ 0 r exp λ 4 k = 1 2 π κ 2 b k L i 2 T a v k + λ 4 k = 1 2 π κ b k L i 1 T a v k r + λ ( π ) r 2 d r
= 4 k = 1 2 π λ exp 2 π λ κ 2 b k L i 2 T a v k × 0 exp 2 π λ κ b k y T a v k r exp π λ r 2 r d r
= 4 k = 1 exp 2 π λ κ 2 b k L i 2 T a v k × 1 π λ κ b k y T a v k e π λ b k 2 y ( T a v k ) 2 κ 2 E r f c π λ κ b k y T a v k
= 4 k = 1 exp 2 π λ κ 2 b k L i 2 T a v k × 1 2 π λ κ b k y T a v k e π λ b k 2 y 2 ( T a v k ) κ 2 Q 2 π λ κ b k y T a v k
In (A33) L i 1 T a v k = l n 1 + T a v k and y T a v k = l n 1 + T a v k . (A34) is from integral transform of exponential function 0 e p x e a x 2 x d x = 2 b 2 π 1 / 2 b 3 / 2 e b p 2 p E r f c p b here, b = 1 4 a . Finally, by the relation of Q and E r f c , Q x = 1 2 E r f c x 2 the expression for coverage probability is obtained in (A36).

Appendix B. Fitting Stretched Exponential Path Loss Model to the Measurement Data

In this subsection, the SEPLM is verified and validated for mmwave NLOS links with actual path loss measurement data. For finding the best fit of the parameters κ and ζ , linear mean-square estimate is employed [47]. The path loss expression in (3) is transformed into a linear expression in the following steps:
L ( r ) = exp ( κ r ζ )
Taking natural logarithm of both sides of above expression, the following equation is obtained,
l n L = ln ( exp ( κ r ζ ) )
ln L = ( κ r ζ )
Again taking natural logarithm of both sides of above expression, the following equation is obtained,
ln ( ln ( L ) ) = ln ( κ r ζ )
ln ( ln ( L ) ) = ln ( κ ) + ζ ln ( r )
The above expression can be written as a linear function of the data as follow,
Y = A X + b
Here, Y = ln ( ln ( L ) ) , b = ln ( κ ) , A = ζ and X = ln ( r ) . A and b are the parameters that minimize the mean square estimation error and are computed according to the following expressions,
b = E ( X Y ) E ( X ) E ( Y ) E [ X 2 ] E 2 [ X ]
A = E [ Y ] b E [ X ]
Here E ( . ) represents the mean value of the measured data. The SEPLM parameters κ and ζ can be obtained using the relation, ζ = b and ln ( κ ) = A .

References

  1. Qualcomm. The 1000× Mobile Data Challenge: More Spectrum, More Small Cells, More Indoor Cells and Higher Efficiency; Technical Report; Qualcomm: San Diego, CA, USA, 2012. [Google Scholar]
  2. López-Pérez, D.; Ding, M.; Claussen, H.; Jafari, A.H. Towards 1 Gbps/UE in Cellular Systems: Understanding Ultra-Dense Small Cell Deployments. IEEE Commun. Surv. Tutor. 2015, 17, 2078–2101. [Google Scholar] [CrossRef] [Green Version]
  3. Andrews, J.G.; Buzzi, S.; Choi, W.; Hanly, S.V.; Lozano, A.; Soong, A.C.K.; Zhang, J.C. What Will 5G Be? IEEE J. Sel. Areas Commun. 2014, 32, 1065–1082. [Google Scholar] [CrossRef]
  4. Bhushan, N.; Li, J.; Malladi, D.; Gilmore, R.; Brenner, D.; Damnjanovic, A.; Sukhavasi, R.T.; Patel, C.; Geirhofer, S. Network densification: The dominant theme for wireless evolution into 5G. IEEE Commun. Mag. 2014, 52, 82–89. [Google Scholar] [CrossRef]
  5. Kamel, M.; Hamouda, W.; Youssef, A. Ultra-Dense Networks: A Survey. IEEE Commun. Surv. Tutor. 2016, 18, 2522–2545. [Google Scholar] [CrossRef]
  6. Gotsis, A.; Stefanatos, S.; Alexiou, A. UltraDense Networks: The New Wireless Frontier for Enabling 5G Access. IEEE Veh. Technol. Mag. 2016, 11, 71–78. [Google Scholar] [CrossRef] [Green Version]
  7. Rappaport, T.S.; Sun, S.; Mayzus, R.; Zhao, H.; Azar, Y.; Wang, K.; Wong, G.N.; Schulz, J.K.; Samimi, M.; Gutierrez, F. Millimeter Wave Mobile Communications for 5G Cellular: It Will Work! IEEE Access 2013, 1, 335–349. [Google Scholar] [CrossRef]
  8. Akdeniz, M.R.; Liu, Y.; Samimi, M.K.; Sun, S.; Rangan, S.; Rappaport, T.S.; Erkip, E. Millimeter Wave Channel Modeling and Cellular Capacity Evaluation. IEEE J. Sel. Areas Commun. 2014, 32, 1164–1179. [Google Scholar] [CrossRef]
  9. Trigui, I.; Affes, S.; Renzo, M.D.; Jayakody, D.N.K. Coverage Analysis and Scaling Laws of Ultra-Dense Networks. IEEE Trans. Commun. 2021, 69, 4158–4171. [Google Scholar] [CrossRef]
  10. Baldemair, R.; Irnich, T.; Balachandran, K.; Dahlman, E.; Mildh, G.; Selén, Y.; Parkvall, S.; Meyer, M.; Osseiran, A. Ultra-dense networks in millimeter-wave frequencies. IEEE Commun. Mag. 2015, 53, 202–208. [Google Scholar] [CrossRef]
  11. Wang, R.; Klaine, P.V.; Onireti, O.; Sun, Y.; Imran, M.A.; Zhang, L. Deep Learning Enabled Beam Tracking for Non-Line of Sight Millimeter Wave Communications. IEEE Open J. Commun. Soc. 2021, 2, 1710–1720. [Google Scholar] [CrossRef]
  12. Gabriel, B. Exploring the Potentials of Mmwave for 5G Mobile Access; Qualcomm: San Diego, CA, USA, 2016. [Google Scholar]
  13. Rajagopal, S.; Abu-Surra, S.; Malmirchegini, M. Channel Feasibility for Outdoor Non-Line-of-Sight mmWave Mobile Communication. In Proceedings of the 2012 IEEE Vehicular Technology Conference (VTC Fall), Quebec City, QC, Canada, 3–6 September 2012; pp. 1–6. [Google Scholar] [CrossRef]
  14. IEEE Communications Society. Huawei and NTT Docomo “5G” mmWave Field Trial in Tokyo; IEEE Communications Society: New York, NY, USA, 2017. [Google Scholar]
  15. Bai, T.; Heath, R.W. Coverage analysis for millimeter wave cellular networks with blockage effects. In Proceedings of the 2013 IEEE Global Conference on Signal and Information Processing, Austin, TX, USA, 3–5 December 2013; pp. 727–730. [Google Scholar] [CrossRef]
  16. Ruble, M.; Güvenç, I. Wireless localization for mmWave networks in urban environments. EURASIP J. Adv. Signal Process. 2018, 2018, 35. [Google Scholar] [CrossRef] [PubMed] [Green Version]
  17. Mendrzik, R.; Wymeersch, H.; Bauch, G.; Abu-Shaban, Z. Harnessing NLOS Components for Position and Orientation Estimation in 5G Millimeter Wave MIMO. IEEE Trans. Wirel. Commun. 2019, 18, 93–107. [Google Scholar] [CrossRef] [Green Version]
  18. Onireti, O.; Imran, A.; Imran, M.A. Coverage, Capacity, and Energy Efficiency Analysis in the Uplink of mmWave Cellular Networks. IEEE Trans. Veh. Technol. 2018, 67, 3982–3997. [Google Scholar] [CrossRef]
  19. Mariam, H.; Ahmed, I.; Aslam, M.I. Coverage probability of uplink millimeter wave cellular network with non-homogeneous interferers’ point process. Phys. Commun. 2021, 45, 101274. [Google Scholar] [CrossRef]
  20. Muhammad, N.A.; Apandi, N.I.A.; Li, Y.; Seman, N. Uplink Performance Analysis for Millimeter Wave Cellular Networks with Clustered Users. IEEE Trans. Veh. Technol. 2020, 69, 6178–6188. [Google Scholar] [CrossRef]
  21. Wang, X.; Gursoy, M.C. Uplink Coverage in Heterogeneous mmWave Cellular Networks With Clustered Users. IEEE Access 2021, 9, 69439–69455. [Google Scholar] [CrossRef]
  22. Bai, T.; Vaze, R.; Heath, R.W. Analysis of Blockage Effects on Urban Cellular Networks. IEEE Trans. Wirel. Commun. 2014, 13, 5070–5083. [Google Scholar] [CrossRef] [Green Version]
  23. Turgut, E.; Gursoy, M.C. Coverage in heterogeneous downlink millimeter wave cellular networks. IEEE Trans. Commun. 2017, 65, 4463–4477. [Google Scholar] [CrossRef]
  24. Di Renzo, M. Stochastic geometry modeling and analysis of multi-tier millimeter wave cellular networks. IEEE Trans. Wirel. Commun. 2015, 14, 5038–5057. [Google Scholar] [CrossRef] [Green Version]
  25. Ouamri, M.A. Stochastic geometry modeling and analysis of downlink coverage and rate in small cell network. Telecommun. Syst. 2021, 77, 767–779. [Google Scholar] [CrossRef]
  26. Ouamri, M.A.; Azni, M.; Oteşteanu, M.E. Coverage Analysis in Two-tier 5G Hetnet Based on Stochastic Geometry with Interference Coordination Strategy. Wirel. Pers. Commun. 2021, 121, 3213–3222. [Google Scholar] [CrossRef]
  27. Franceschetti, G.; Marano, S.; Palmieri, F. Propagation without wave equation toward an urban area model. IEEE Trans. Antennas Propag. 1999, 47, 1393–1404. [Google Scholar] [CrossRef]
  28. Marano, S.; Franceschetti, M. Ray propagation in a random lattice: A maximum entropy, anomalous diffusion Process. IEEE Trans. Antennas Propag. 2005, 53, 1888–1896. [Google Scholar] [CrossRef]
  29. Franceschetti, M.; Bruck, J.; Schulman, L.J. A random walk model of wave propagation. IEEE Trans. Antennas Propag. 2004, 52, 1304–1317. [Google Scholar] [CrossRef] [Green Version]
  30. Hemadeh, I.A.; Satyanarayana, K.; El-Hajjar, M.; Hanzo, L. Millimeter-Wave Communications: Physical Channel Models, Design Considerations, Antenna Constructions, and Link-Budget. IEEE Commun. Surv. Tutor. 2018, 20, 870–913. [Google Scholar] [CrossRef] [Green Version]
  31. Papazian, P.; Lo, Y. Seasonal variability of a local multi-point distribution service radio channel. In Proceedings of the RAWCON 99. 1999 IEEE Radio and Wireless Conference (Cat. No.99EX292), Denver, CO, USA, 1–4 August 1999; pp. 211–214. [Google Scholar]
  32. Muhammad, N.A.; Wang, P.; Li, Y.; Vucetic, B. Analytical Model for Outdoor Millimeter Wave Channels Using Geometry-Based Stochastic Approach. IEEE Trans. Veh. Technol. 2017, 66, 912–926. [Google Scholar] [CrossRef] [Green Version]
  33. AlAmmouri, A.; Andrews, J.G.; Baccelli, F. SINR and Throughput of Dense Cellular Networks with Stretched Exponential Path Loss. IEEE Trans. Wirel. Commun. 2018, 17, 1147–1160. [Google Scholar] [CrossRef]
  34. Kamel, M.; Hamouda, W.; Youssef, A. Uplink Coverage and Capacity Analysis of {mMTC} in Ultra-Dense Networks. IEEE Trans. Veh. Technol. 2020, 69, 746–759. [Google Scholar] [CrossRef]
  35. Kamel, M.; Hamouda, W.; Youssef, A. Uplink Performance of NOMA-Based Combined HTC and MTC in Ultradense Networks. IEEE Internet Things J. 2020, 7, 7319–7333. [Google Scholar] [CrossRef]
  36. Elbayoumi, M.; Hamouda, W.; Youssef, A. Multiple-Association Supporting HTC/MTC in Limited-Backhaul Capacity Ultra-Dense Networks. IEEE Trans. Commun. 2021, 69, 4113–4127. [Google Scholar] [CrossRef]
  37. Cong Lam, S.; Pham, T.H.; Tran, X.N. Uplink performance of nonorthogonal multiple access ultradense networks with power control. Int. J. Commun. Syst. 2022, 35, e5069. [Google Scholar] [CrossRef]
  38. Bai, T.; Heath, R.W. Coverage and Rate Analysis for Millimeter-Wave Cellular Networks. IEEE Trans. Wirel. Commun. 2015, 14, 1100–1114. [Google Scholar] [CrossRef]
  39. Kulkarni, M.N.; Singh, S.; Andrews, J.G. Coverage and rate trends in dense urban mmWave cellular networks. In Proceedings of the 2014 IEEE Global Communications Conference, Austin, TX, USA, 8–12 December 2014; pp. 3809–3814. [Google Scholar]
  40. Singh, S.; Kulkarni, M.N.; Ghosh, A.; Andrews, J.G. Tractable model for rate in self-backhauled millimeter wave cellular networks. IEEE J. Sel. Areas Commun. 2015, 33, 2196–2211. [Google Scholar] [CrossRef] [Green Version]
  41. Dhillon, H.S.; Ganti, R.K.; Baccelli, F.; Andrews, J.G. Modeling and Analysis of K-Tier Downlink Heterogeneous Cellular Networks. IEEE J. Sel. Areas Commun. 2012, 30, 550–560. [Google Scholar] [CrossRef] [Green Version]
  42. 5GCM. 5G Channel Model for Bands up to 100 GHz. Technical Report. 2016. Available online: https://www.google.com/url?sa=t&rct=j&q=&esrc=s&source=web&cd=&cad=rja&uact=8&ved=2ahUKEwjtlamuy4T8AhVRAIgKHU2wCdAQFnoECBQQAQ&url=http%3A%2F%2Fwww.5gworkshops.com%2F2015%2F5G_Channel_Model_for_bands_up_to100_GHz (accessed on 30 October 2022).
  43. Galiotto, C.; Pratas, N.K.; Marchetti, N.; Doyle, L. A stochastic geometry framework for LOS/NLOS propagation in dense small cell networks. In Proceedings of the 2015 IEEE International Conference on Communications (ICC), London, UK, 8–12 June 2015; pp. 2851–2856. [Google Scholar] [CrossRef] [Green Version]
  44. Zhang, X.; Andrews, J.G. Downlink cellular network analysis with multi-slope path loss models. IEEE Trans. Commun. 2015, 63, 1881–1894. [Google Scholar] [CrossRef] [Green Version]
  45. 3GPP. 3rd Generation Partnership Project; Technical Specification Group Radio Access Network; Evolved Universal Terrestrial Radio Access (E-UTRA) Physical Layer Procedures (Release 10), TS 36.213 V10.3.0 (2011-09); Technical Report; 3GPP: Valbonne, France, 2011. [Google Scholar]
  46. New York University. NYUSIM; New York University: New York, NY, USA, 2016. [Google Scholar]
  47. Devore, J.L. Probability and Statistics for Engineering and the Sciences; Cengage Learning: Boston, MA, USA, 2008. [Google Scholar]
  48. Jain, I.K.; Kumar, R.; Panwar, S.S. The Impact of Mobile Blockers on Millimeter Wave Cellular Systems. IEEE J. Sel. Areas Commun. 2019, 37, 854–868. [Google Scholar] [CrossRef] [Green Version]
  49. Ding, M.; Wang, P.; López-Pérez, D.; Mao, G.; Lin, Z. Performance impact of LoS and NLoS transmissions in dense cellular networks. IEEE Trans. Wirel. Commun. 2015, 15, 2365–2380. [Google Scholar] [CrossRef]
  50. Arnau, J.; Atzeni, I.; Kountouris, M. Impact of {LOS/NLOS} propagation and path loss in ultra-dense cellular networks. In Proceedings of the 2016 IEEE International Conference on Communications (ICC), Kuala Lumpur, Malaysia, 22–27 May 2016; pp. 1–6. [Google Scholar] [CrossRef]
  51. Andrews, J.G.; Gupta, A.K.; Dhillon, H.S. A primer on cellular network analysis using stochastic geometry. arXiv 2016, arXiv:1604.03183. [Google Scholar]
Figure 1. Downlink mmwave system model with exponential attenuation in the NLOS path.
Electronics 11 04226 g001
Figure 2. Measured data of different path losses and fitted SEPLM parameters. (a) O m n i d i r e c t i o n a l p a t h l o s s (b) D i r e c t i o n a l p a t h l o s s (c) B e s t - d i r e c t i o n a l p a t h l o s s .
Electronics 11 04226 g002
Figure 3. SINR coverage probability P c ( T ) vs. SINR threshold (T) for different blockage environment. (a) obstacle scaling factor ( ζ = 1 ) (b) obstacle scaling factor ( ζ = 2 ).
Electronics 11 04226 g003
Figure 4. SINR coverage probability P c ( T ) vs SINR threshold (T) with LOS and NLOS path. (a) cell radius ( r c ) = 50 m (b) cell radius ( r c ) = 100 m.
Electronics 11 04226 g004
Figure 5. Impact of BS density on SINR coverage probability for different blockage environment. (a) obstacle scaling factor, ζ = 1 (b) obstacle scaling factor, ζ = 2 .
Electronics 11 04226 g005
Figure 6. SINR coverage probability P c ( T ) vs. SINR threshold (T) for different BS antenna parameters at r c = 100 m. (a) obstacle scaling factor ζ = 1 (b) obstacle scaling factor ζ = 2 .
Electronics 11 04226 g006
Figure 7. Impact of BS density ( λ ) on area spectral efficiency.
Electronics 11 04226 g007
Figure 8. SINR coverage probability P c ( T ) comparison of conventional path loss model for mmwave and SEPLM. (a) SINR vs. SINR threshold (T) (b) SINR vs. BS density ( λ ).
Electronics 11 04226 g008
Table 1. List of notations and their definition.
NotationDefinition
ϕ B , ϕ U , ϕ Z BS, UE and Interfering UE point process
λ , λ U BS and UE densities
l ( r ) Path loss at distance r
α L LOS path loss exponent
( κ , ζ ) NLOS path loss parameter
f c Operating frequency
BChannel Bandwidth
r c Cell radius, 1 π λ
σ 2 Noise power
f R ( r ) PDF of distance r between typical UE and tagged BS
D Z Distance between interfering UE and tagged BS
l ( D z ) Path loss on the link D z
h 0 Small-scale fading on the link from serving BS to typical UE
h Z Small scale fading on interfering link
G O j Maximum directivity gain, j { U E , B S }
θ j Antenna HPBW, j { U E , B S }
G s l j Side lobe gain, j { U E , B S }
G Z Directivity gain of interfering UE
θ Z Beamwidth of interfering UE
P c ( T ) SINR coverage probability at threshold T
P c , s ( T ) SINR coverage probability, on l link for l { L O S , N L O S }
p s ( r ) Probability of link being in l condition for l { L O S , N L O S }
L I ( s ) Laplace Transform of interference component
ASEArea spectral efficiency
L i ( k ) kth order logarithmic function
Table 2. Input parameters to NYUSIM.
ParameterValue
f28 GHz
B500 MHz
ScenarioUMi
EnvironmentNLOS
Lower-Upper bound of transmitter-receiver separation10–350 m
Transmit Power30 dBm
Number of receiver locations100
Other parametersdefault
Table 3. Parameters for numerical evaluation of system model.
ParameterValue
f28 GHz
B500 MHz
G 0 j , j U E , B S 10 dB
G s l j , j U E , B S −10 dB
θ j , j U E , B S 30
r c 1 π λ
Publisher’s Note: MDPI stays neutral with regard to jurisdictional claims in published maps and institutional affiliations.

