Article

Evaluation Index for IVIS Integration Test under a Closed Condition Based on the Analytic Hierarchy Process

1
Intelligent Transportation Systems Research Center, Wuhan University of Technology, Wuhan 430063, China
2
School of Transportation and Logistics, Dalian University of Technology, Dalian 116024, China
*
Authors to whom correspondence should be addressed.
Electronics 2022, 11(22), 3830; https://doi.org/10.3390/electronics11223830
Submission received: 11 October 2022 / Revised: 31 October 2022 / Accepted: 8 November 2022 / Published: 21 November 2022
(This article belongs to the Special Issue Recent Advances in Intelligent Transportation Systems)

Abstract

:
The intelligent vehicle infrastructure system (IVIS) requires systematic testing before being put into large-scale applications. IVIS testing under closed conditions includes stress tests for typical scenarios and extreme scenario strength testing. To extract IVIS integration test indicators under closed conditions, this article constructed a hierarchical framework of IVIS’s evaluation indexes in the stress tests and the strength tests. The hierarchical framework of IVIS stress test evaluation indicators reflect the highway construction area under typical scenarios, and the hierarchical framework of IVIS strength test evaluation indicators reflect the highway merging area under extreme scenarios. Both are based on the test requirements of the stress test and strength test, with safety as the evaluation objective. Second, the analytic hierarchy process (AHP) was used to calculate the weights of the test evaluation indicators of the two scenarios. Finally, the activity-based classification (ABC) method was used after ranking the weight results in order to extract the key factors that have the maximum impact on safety in the scenarios. In this paper, we proved the practicality and feasibility of the AHP-ABC extraction method in the IVIS integration testing evaluation index and guided the development and testing of the IVIS.

1. Introduction

The intelligent vehicle infrastructure system (IVIS) is expected to be one of the best safety solutions towards fully automatic driving. However, before being put into large-scale applications, IVIS should be tested systematically [1]. IVIS test evaluation can be divided into two categories in general, one for traffic operation and one for connected and automated vehicles (CAVs) working conditions. There has been a large amount of work on traffic operation evaluation methods based on travel time [2], road capacity [3], velocity [4], and traffic flow [5]. Studies on CAV working condition evaluation methods were according to components [6,7] and functions [8]. At the same time, many closed CAVs test (CAVTest) fields have realized key test elements for CAV functions. Taking the closed CAVTest of Chang’an University in China [9] as an example, the critical test elements generally include a variety of road environments (cities, highways, and rural roads), environmental complexity (weather, emergencies), road infrastructure (road signs and markings, traffic control facilities, wading roads), auxiliary test equipment (dynamic and static obstacles), and network conditions (RSU, communication protocols, lidars). However, the traffic operating and CAV working conditions are inextricably linked, and a single evaluation for any side will inevitably fall into the problem because of the light evaluation mechanism. In other words, there are two main problems with the existing studies of IVIS key test elements. On the one hand, the current studies are conducted according to the working conditions of each system. However, IVIS is not only a simple superposition of road systems and CAV functions but also an organic fusion of traffic engineering, information technology, and the automotive industry, having the characteristics of multisystem cooperation and with specific functions corresponding to particular needs. On the other hand, in the current closed CAVTest fields, the test scenario is generally for a single refined scenario, such as the communication function test for LET-V, and AEB for the pedestrian test [9]. The IVIS technology in mass production faces comprehensive and complex scenarios, such as the high-speed on-ramp merging scenario, which involves communication, cut-in, obstacle recognition, and reaction and other functions, which have seldom been discussed in most of the existing studies.
In IVIS, according to the degree of openness, the system can be divided into closed and semi-open conditions. Due to article space limitations, we only focused on the selections of the IVIS integration test evaluation index under closed conditions. The closed condition refers to the conditions in which the IVIS elements are repeatable and steerable or are not affected by external factors [9]. As shown in Figure 1, IVIS testing under closed conditions should be executed in two parts: one is to meet the stress test (subdivided into industry development demand, technical test demand, and response testing demand), while the other is to match the strength test (subdivided into extreme weather testing demand, extreme road conditions demand, and extreme communication test demand) [10,11]. Then, the demand–indicator matching will extract typical scenario indicators for the stress test and extreme scenario indicators for the strength test. This IVIS testing framework of evaluation indexes can realize comprehensive testing in typical and extreme scenarios according to testing demand.
In general, to address the lack of evaluation for specific requirements and integrated evaluation in the above studies, we refined the testing requirements under IVIS integration testing in closed conditions, constructed a testing index framework for IVIS in closed conditions, and used the AHP to establish an evaluation framework. To reflect the importance of different indicators, we obtained the weight of each indicator through an expert survey [12] and finally evaluated the IVIS integration test indicators using activity-based classification taxonomy (ABC taxonomy, also known as the Pareto method).
The remainder is organized as follows: Section 2 reviews the previous works, Section 3introduces the evaluation methodology, Section 4 analyzes the arithmetic examples, and Section 5 concludes this study.

2. Literature Review

IVIS is divided into traffic operation and CAV working conditions. In terms of traffic operation evaluations, they are diverged into traffic operation efficiency evaluations and safety evaluations at different scales, such as road networks and intersections. The efficiency evaluations are generally according to travel time [1], driver behavior and market penetration [13], vulnerability (extreme weather impact within the region) [14], and speed [15]; safety evaluations are generally according to speed [16], time to collision (TTC) [17,18], and economic and environmental efficiency evaluations [19,20]. In terms of evaluating CAV working conditions, the testing is generally based on vehicle components or functions separately, such as brake pedal evaluation [6,7], crash testing [8,21], and even communication delay [22,23] or communication safety [24], as well as on the overall CAV performance [25].
In the study of evaluation methods, there are economic benefits assessment analysis and multiobjective analysis methods for the evaluation of traffic operations. The economic benefits assessment analysis method usually evaluates the socioeconomic convenience of transportation projects through cost–benefit analysis [26]. Multiobjective analysis methods include the analytic hierarchy process [20,27,28]; fuzzy comprehensive evaluation [29]; the Delphi method [30]; and the combination method of economic benefit analysis, the multi-criteria method [31,32], and multiobjective analysis [13]. On the other hand, the evaluation of the CAV working conditions is divided into simulation experiment methods [6,7], the analytic hierarchy process [12], and fuzzy comprehensive evaluation [25].
In conjunction with the above study, numerous studies in the field of transportation have been conducted using the AHP method and have proven their effectiveness, such as the evaluation of the impact of environmentally friendly transportation measures on urban sustainability [33], the evaluation of the safety impact of road projects on bridges [34], the evaluation of the current state of the transportation system in Beijing [35], the decision to deploy electric vehicle charging infrastructure [36], the evaluation of hinge factors for the selection of electric vehicle charging stations [37], and the evaluation of the primary occupational hazards of road construction workers [38].
Other studies verified the usefulness of Pareto analysis (aka the activity-based classification method, abbreviated as the ABC method) in identifying the majority of critical factors that play a decisive role. For example, total quality management (TQM) is often used to analyze the crucial factors for the success of total quality management in companies [39,40,41] or to analyze the crucial factors of food safety assurance systems [42]. Therefore, the ABC method has an excellent performance in the study of key factors and is applicable to the screening of key indicators for IVIS.
The distribution of the literature for current IVIS evaluation studies is shown in Table 1. From Table 1, we can see that most of the studies are relatively homogeneous, studying only one index to evaluate the traffic operation or the CAV working conditions. However, IVIS is a coupled human–vehicle–environment system, and a single index cannot satisfy the evaluation of one or more scenarios operating under IVIS. In addition, AHP in combination with other methods has been shown to be effective [43,44]; thus, in this paper, the AHP weighting results of IVIS are used for the screening of key indicators using the ABC method, and from there we propose a method that enables a comprehensive evaluation of the IVIS operation in different scenarios in a complex IVIS environment, and such a comprehensive evaluation can be executed with fewer evaluation indicators, which can guarantee the reliability of the evaluation results and improve efficiency.

3. Methods

In this paper, the AHP method was used to construct judgment matrices for the highway’s construction area stress test and merging area strength test layer by layer; the eigenvectors of each judgment matrix were obtained in order to find the weight results of each layer and the final weight results of each index. Finally, according to the final weighting results classifying the ABC method for key index screening, we obtained the indicators to be tested for different scenarios of the IVIS system under closed conditions. The framework of this proposed method is shown in Figure 2.

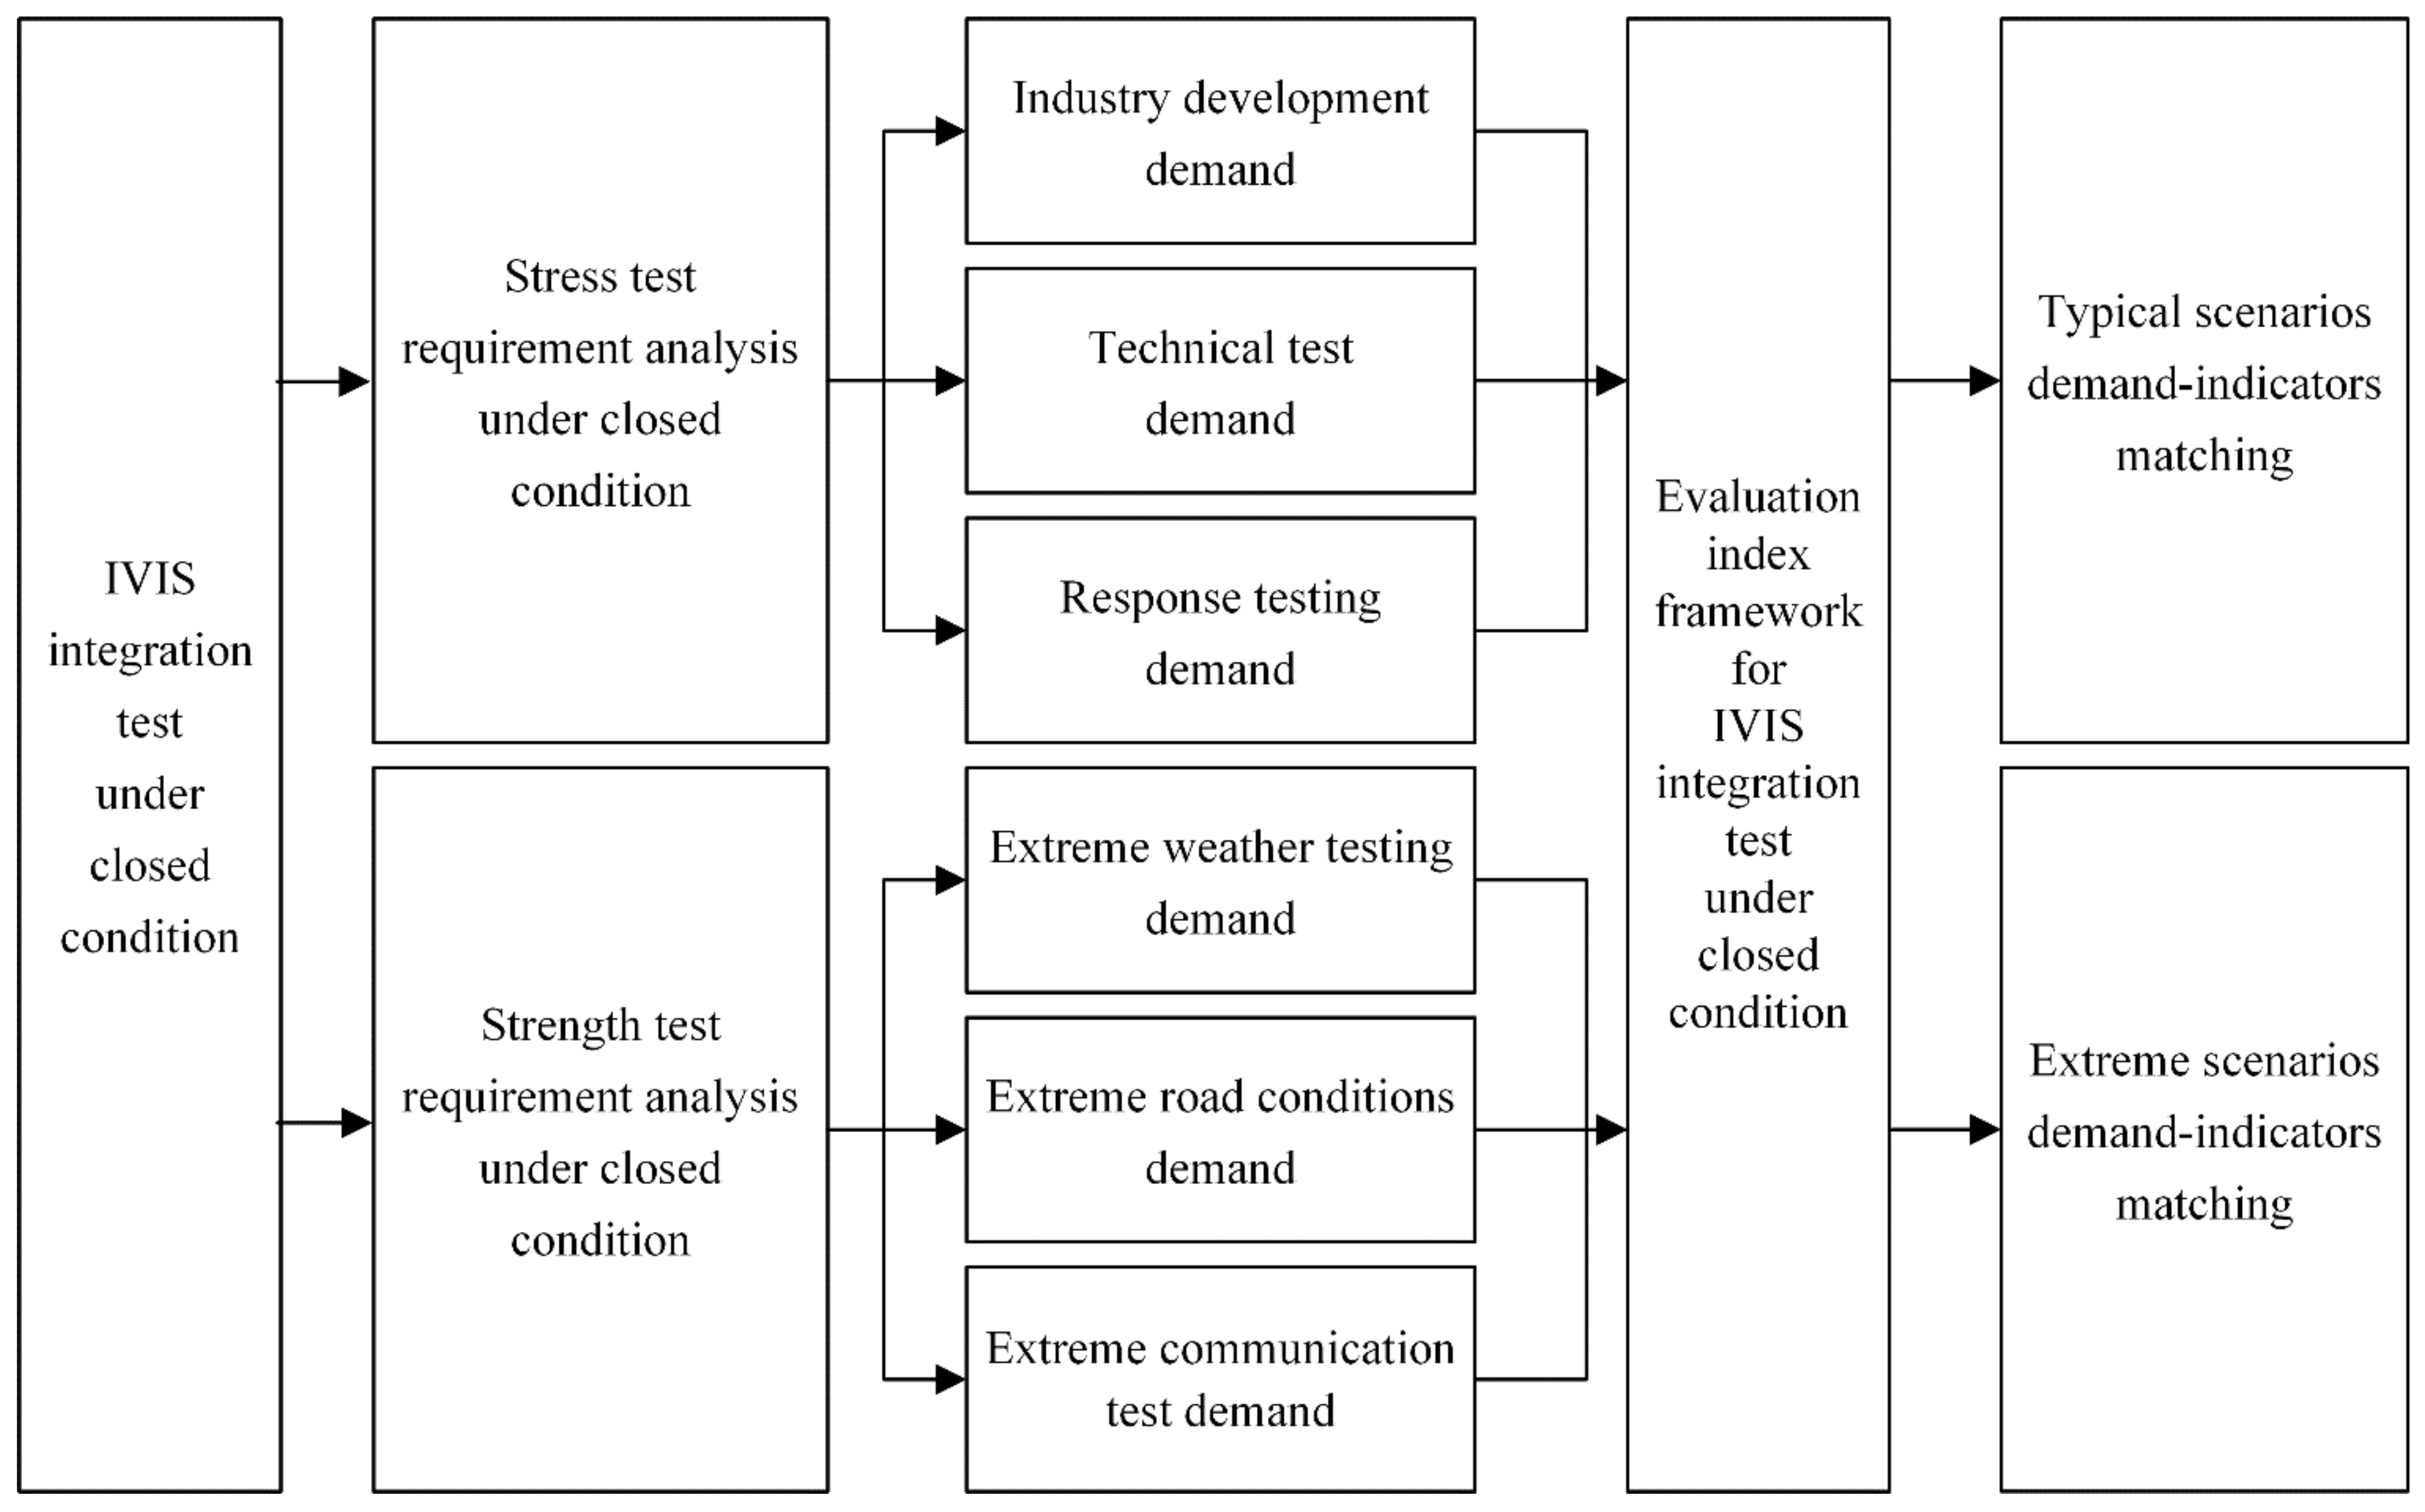
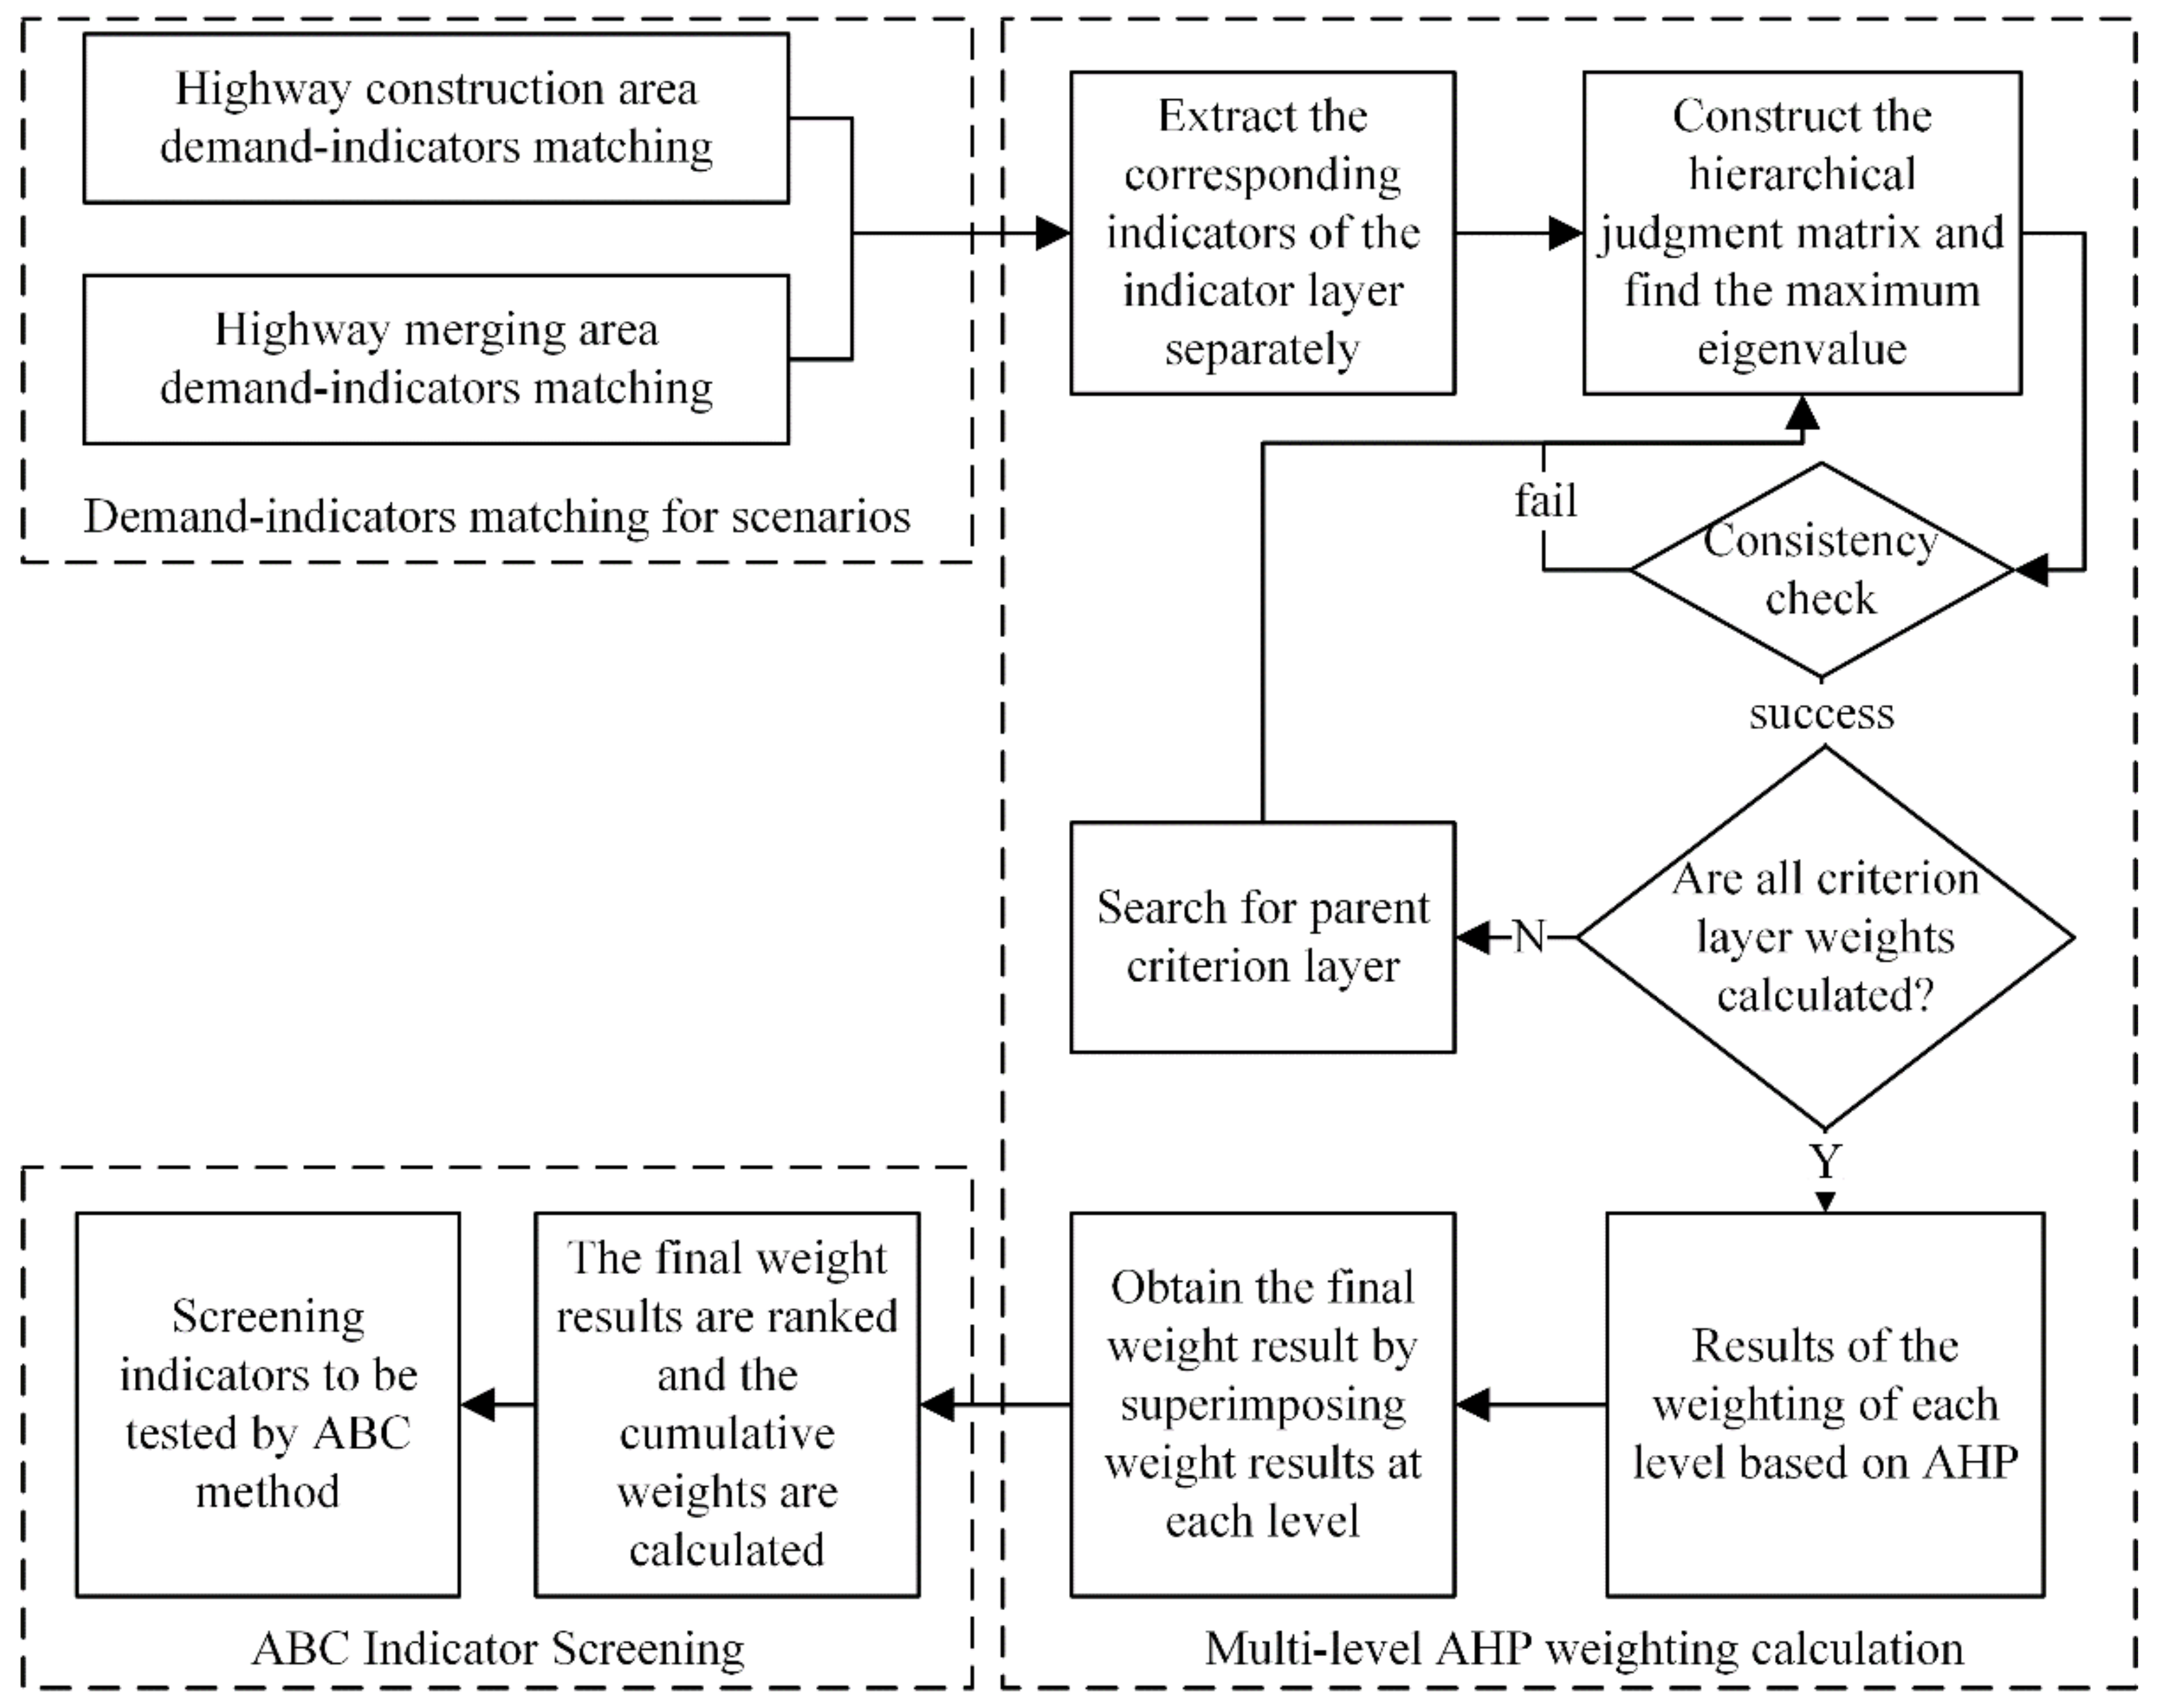
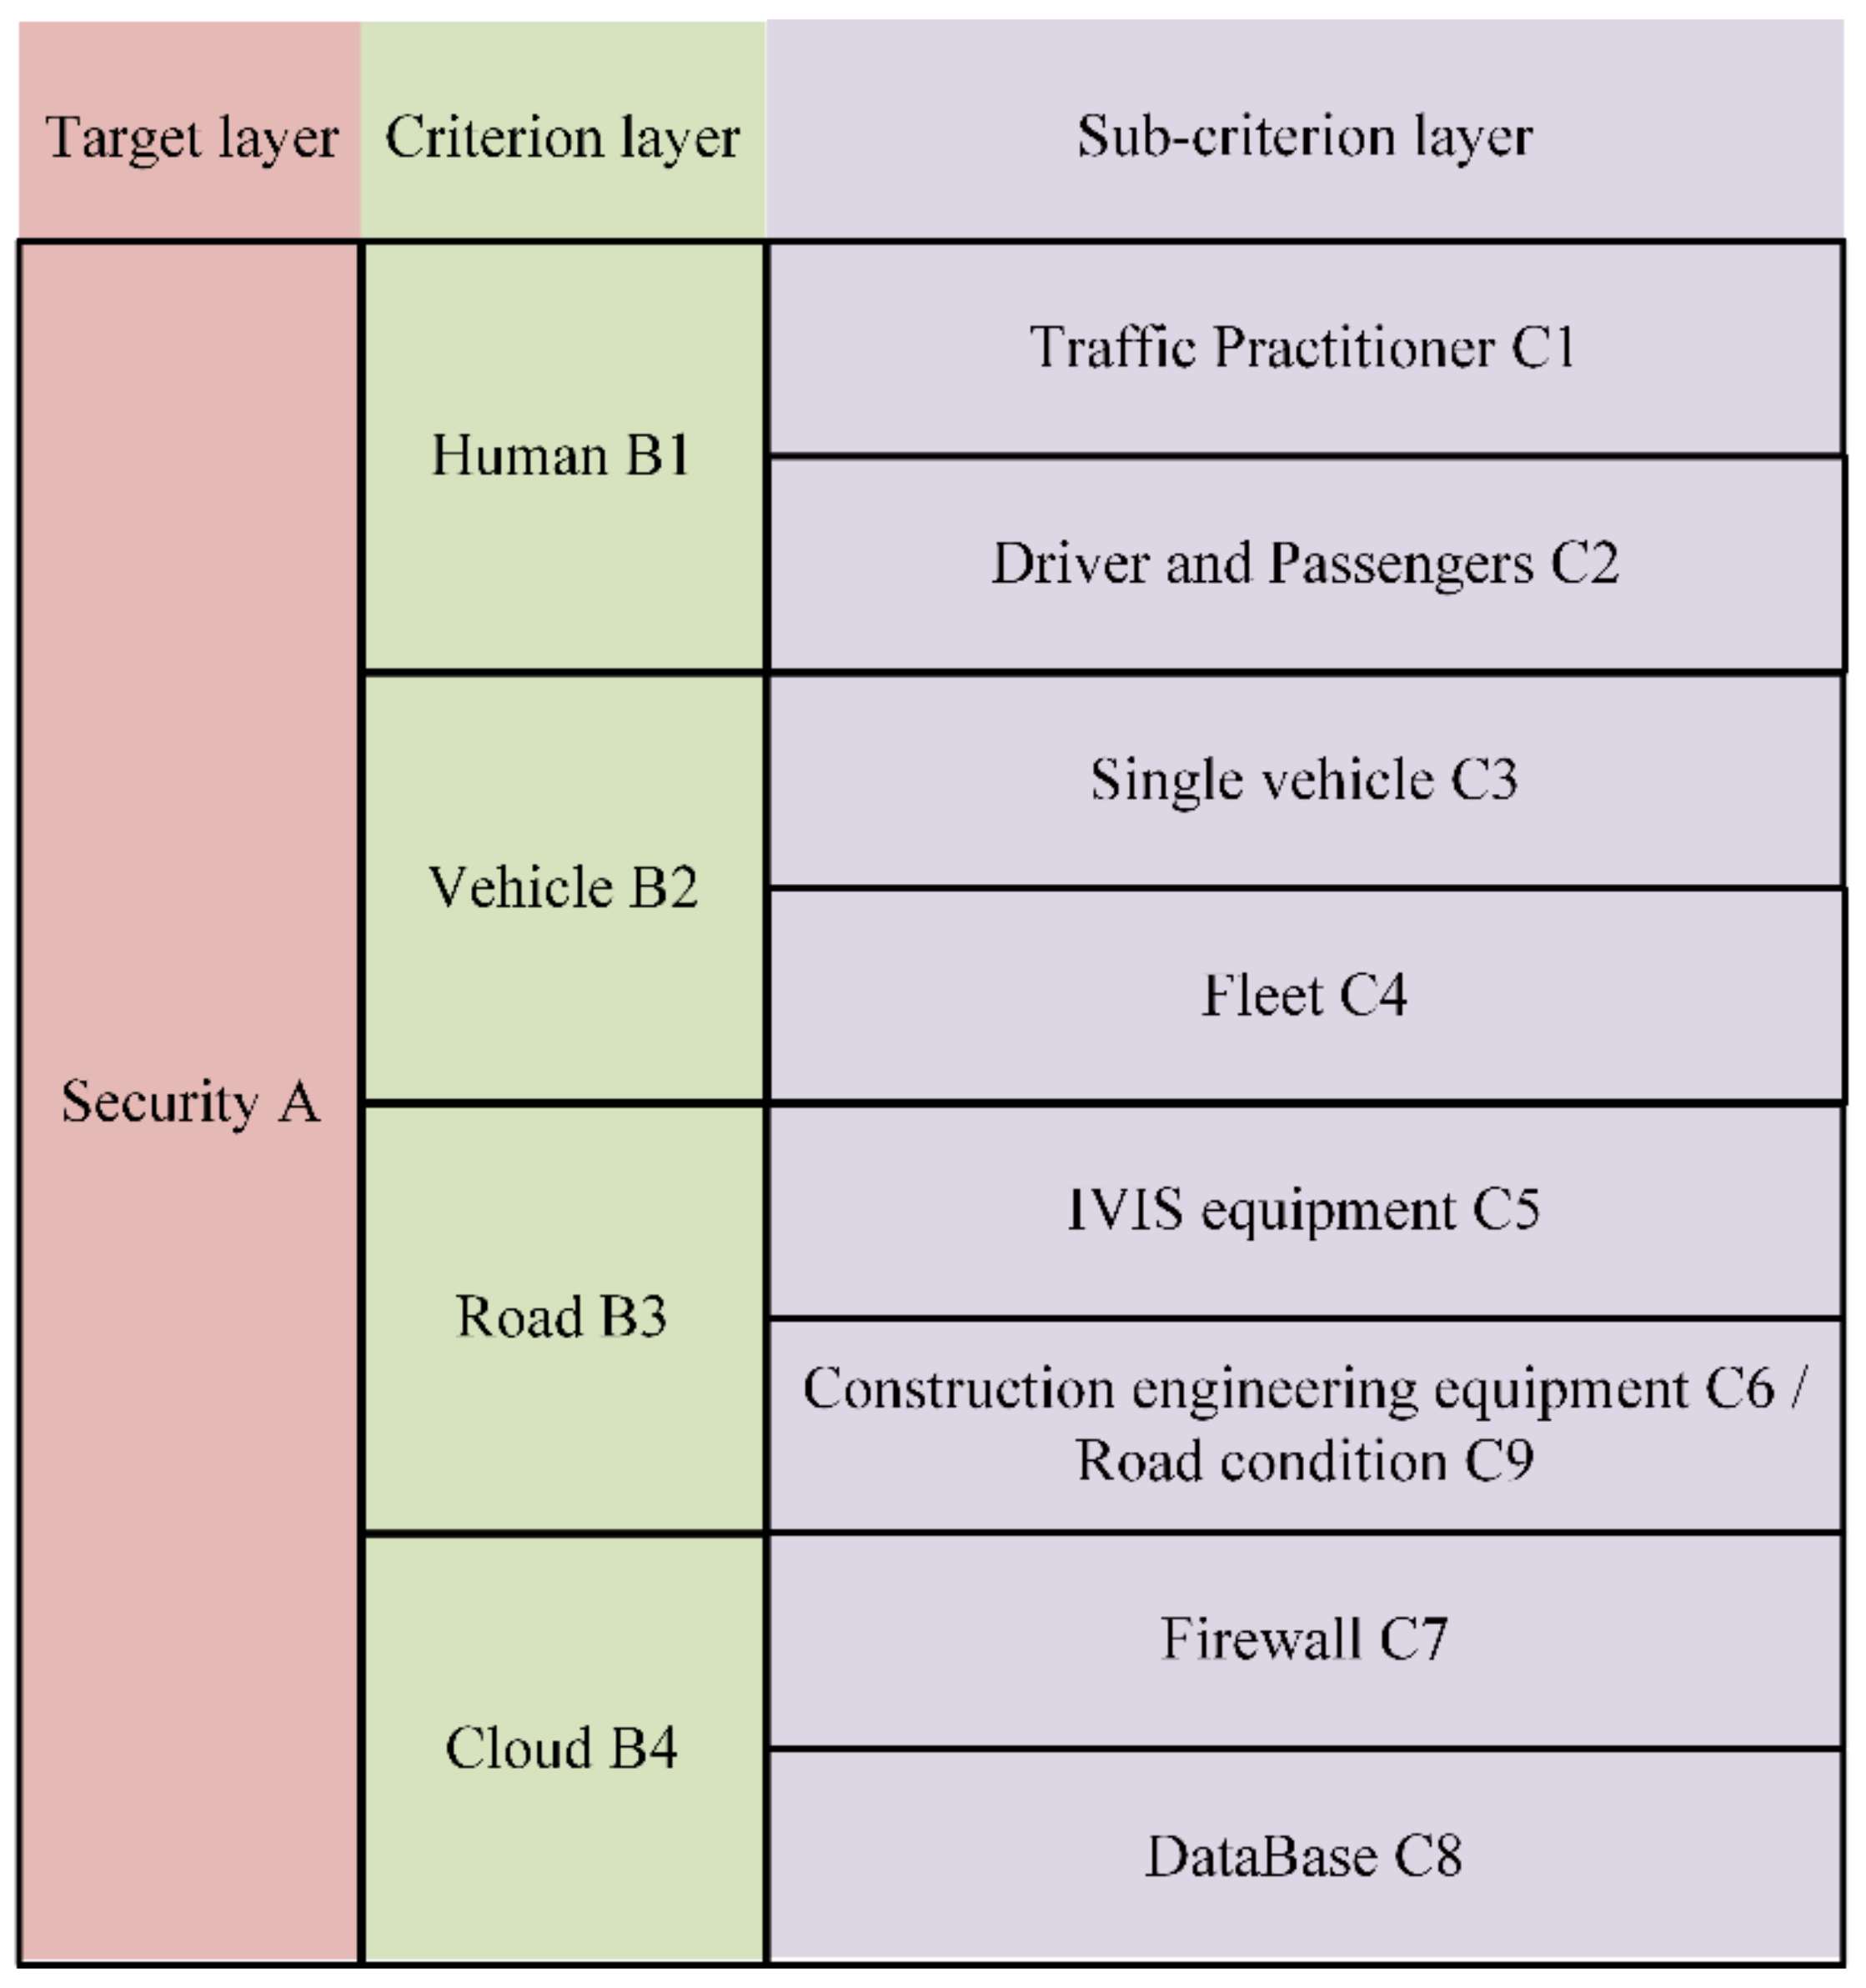
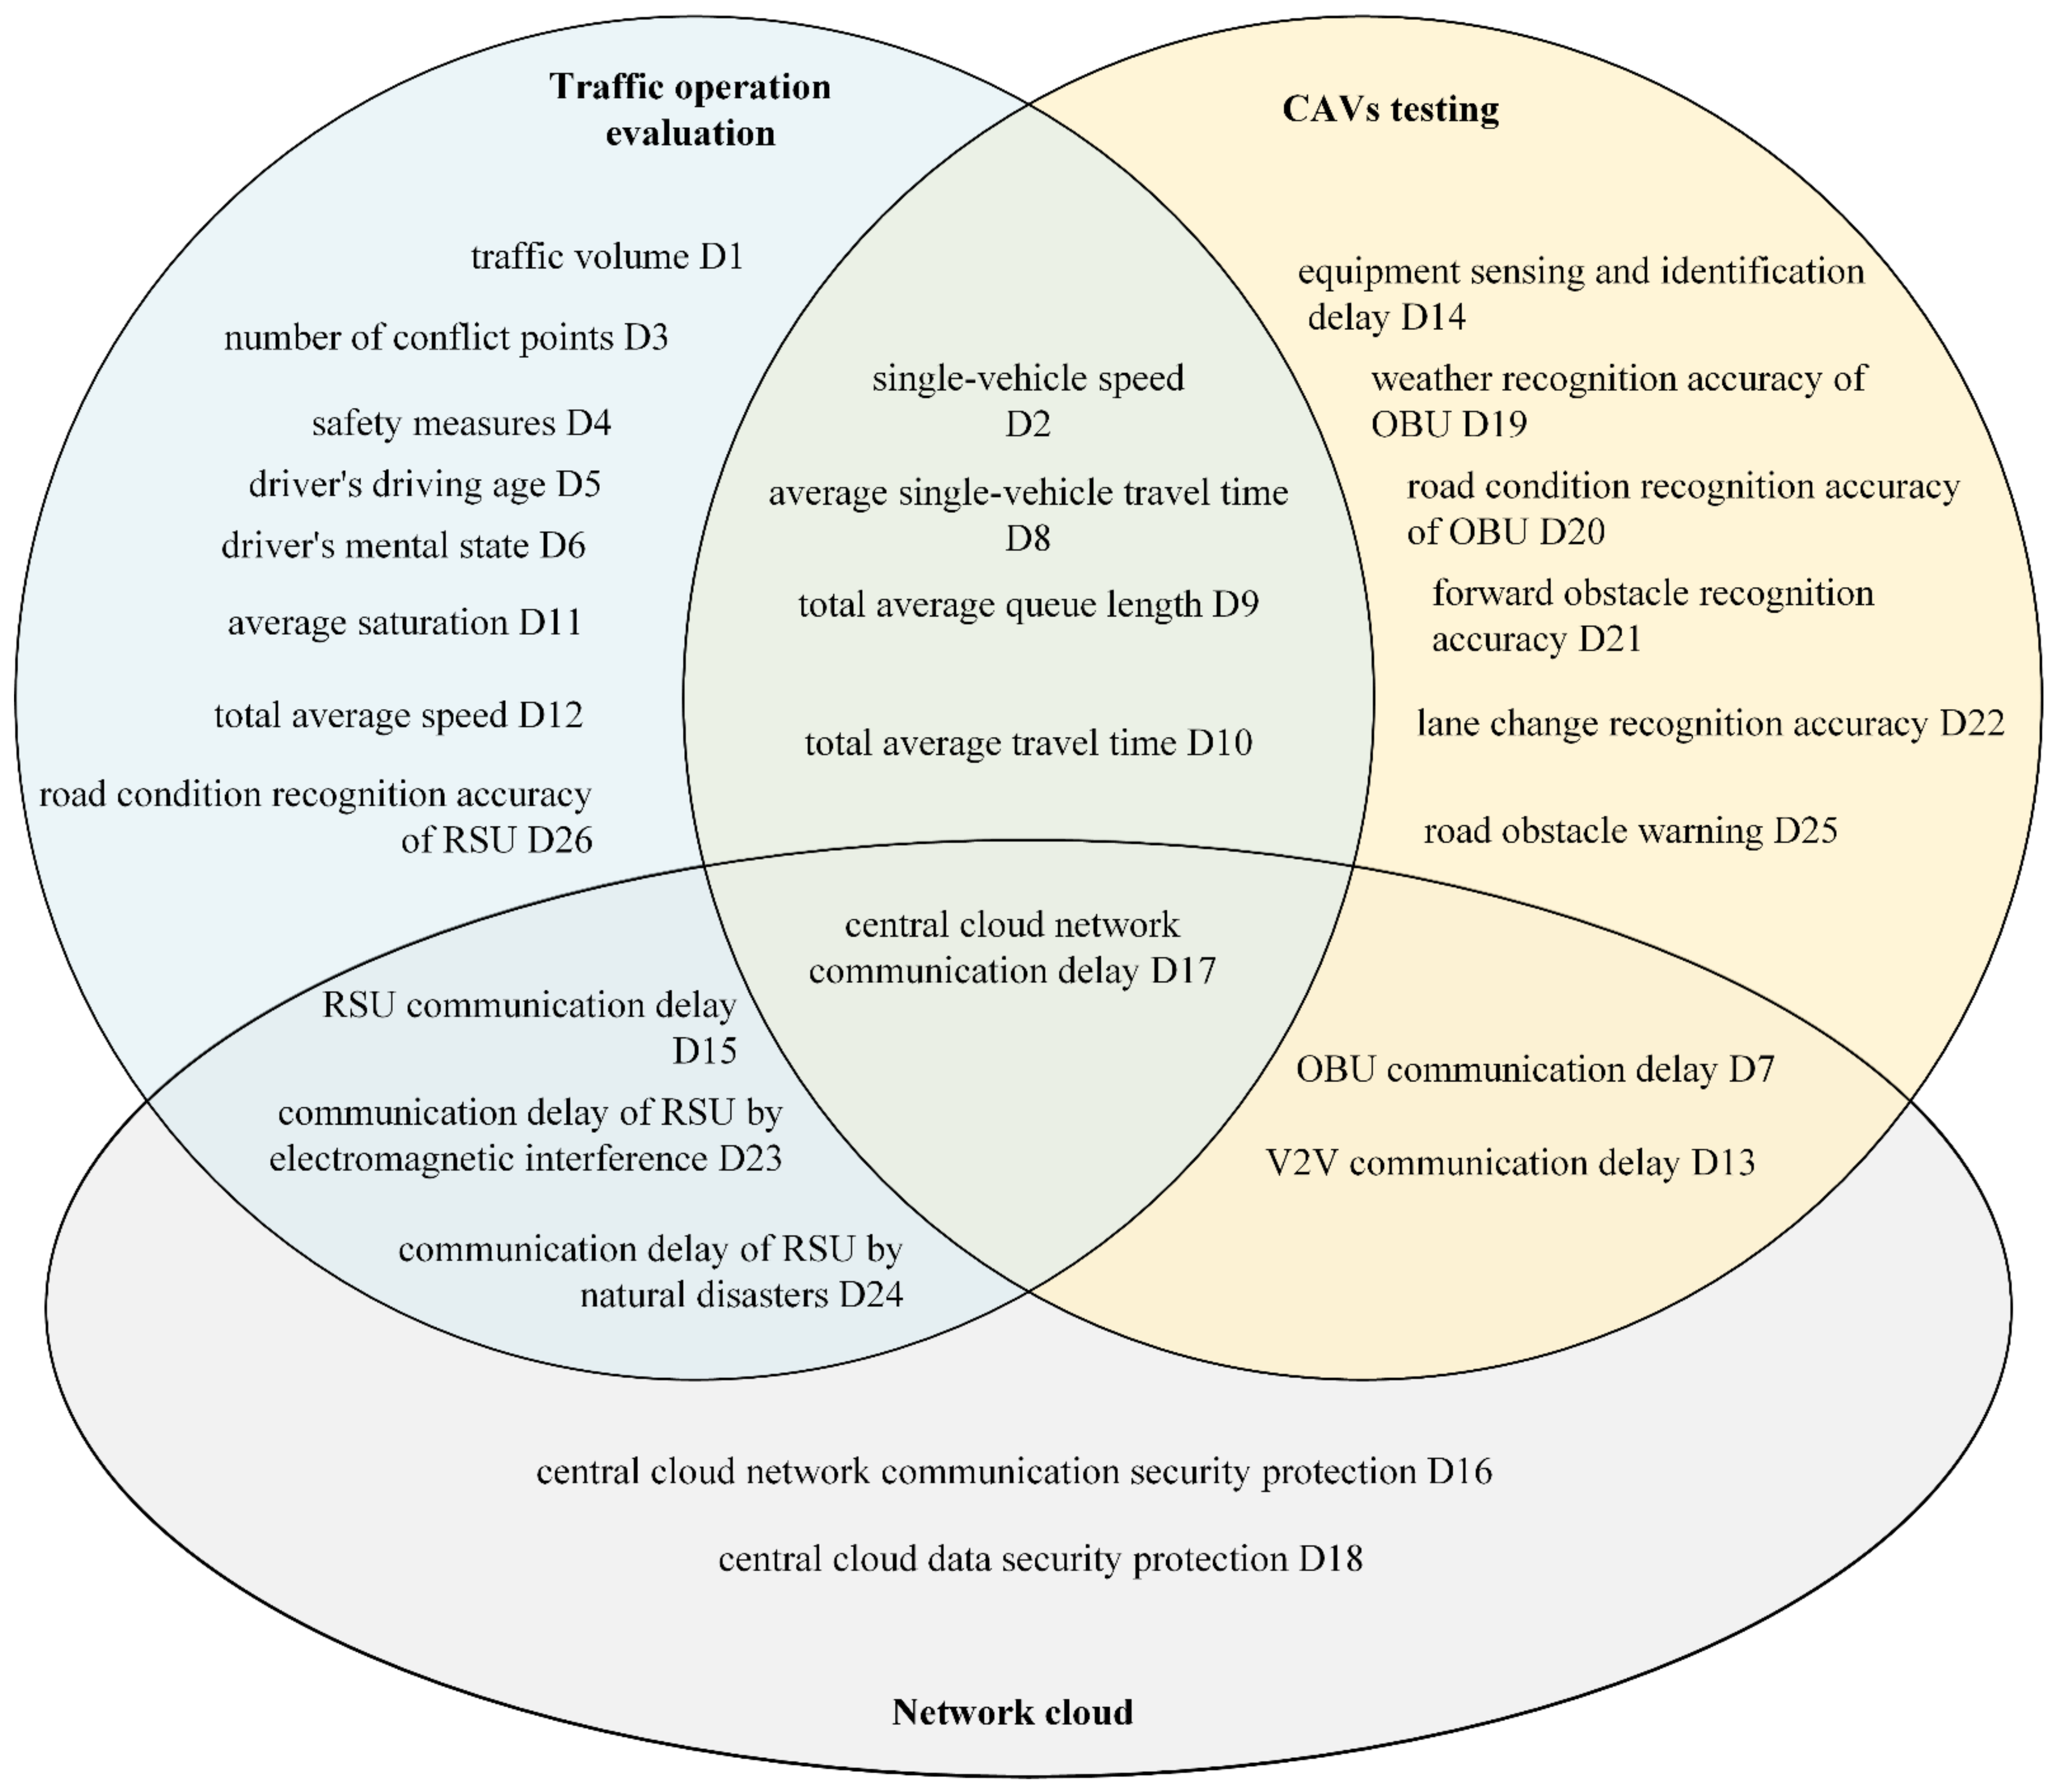
3.1. Demand–Indicator Matching for Scenarios

Demand–indicator matching requires upper-layer framework construction, lower-layer indicator extraction, and demand–indicators matching based on scenario selection of the following three steps:
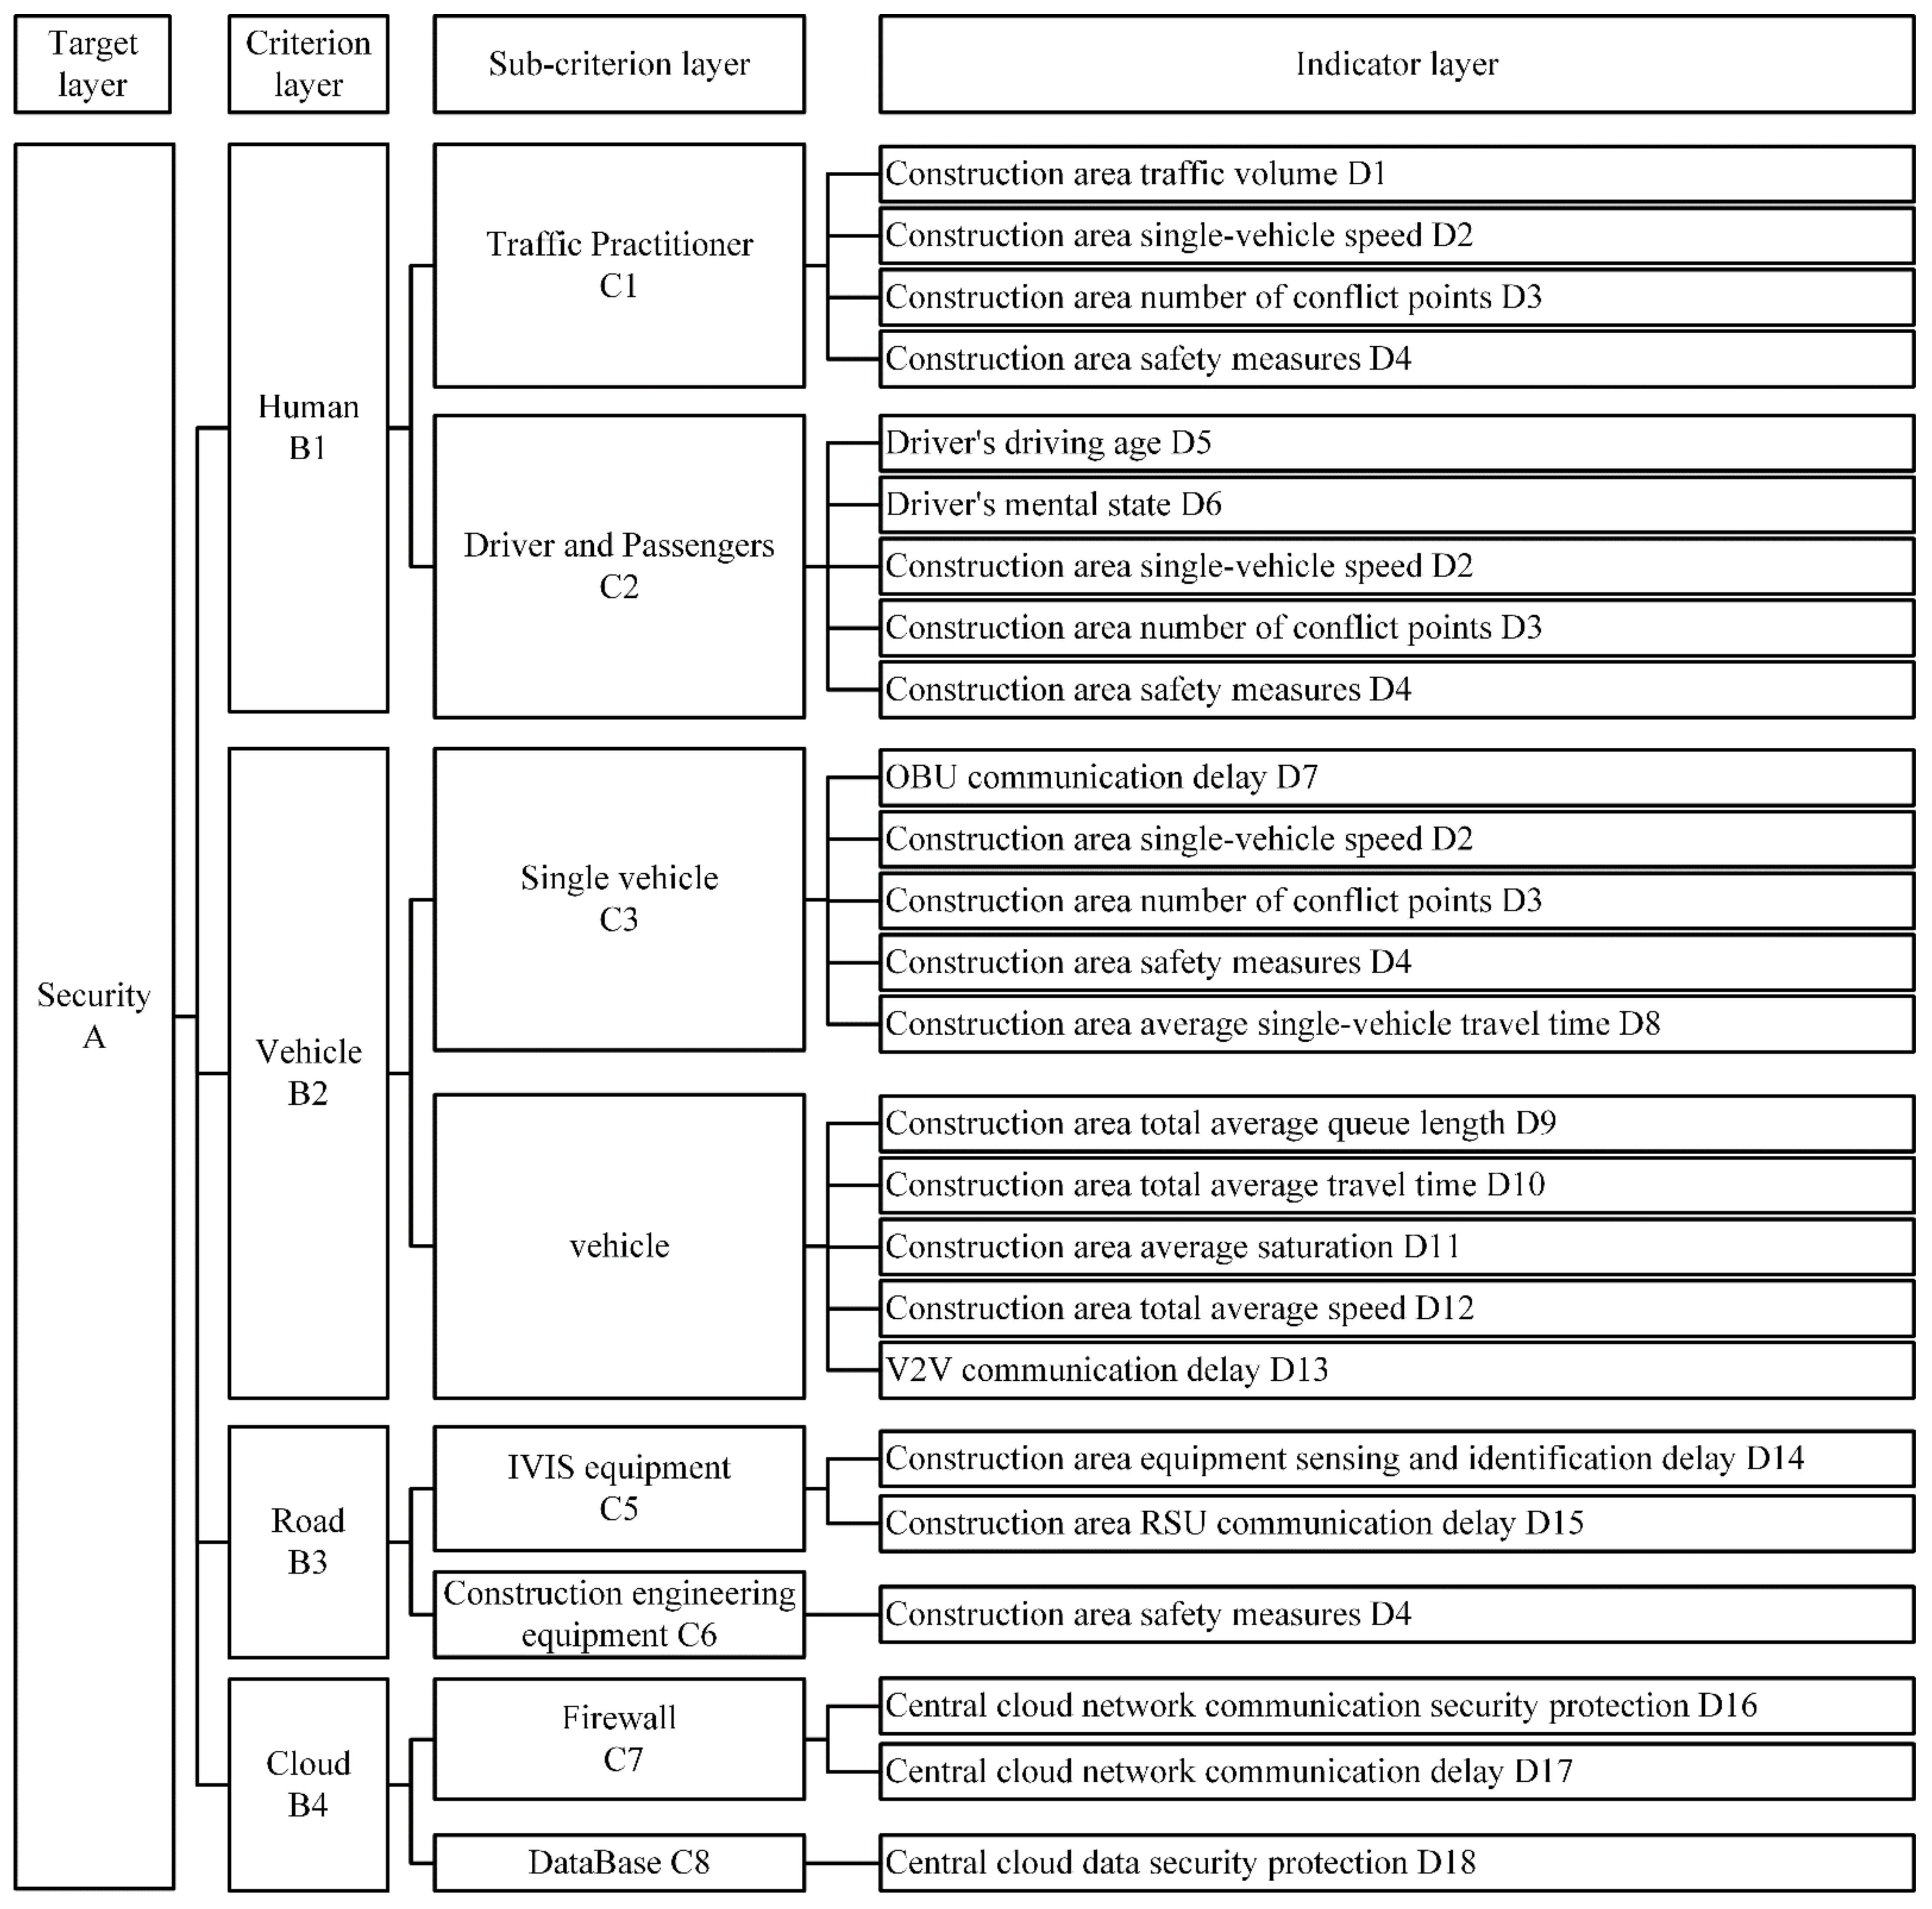
  • Step 1: Upper layer framework construction
The hierarchical structure of IVIS evaluation under closed conditions generally consists of four layers, which are the target layer, criterion layer, subcriterion layer, and indicator layer from top to bottom. Since [9] points out that the IVIS test conditions under closed conditions are controllable and that IVIS easily achieves optimal efficiency, we only thought over the establishment of the hierarchical structure when the objective was secure. As the network cloud has become a crucial component of the IVIS, we introduced a “cloud” based on the three scales of “human–vehicle–road”, as shown in Figure 3. In Figure 3, “A“ represents the total objective of the target layer, and Security A represents the total objective A in the hierarchical analysis is to evaluate the IVIS security; “B” represents each component in the criterion layer, which is composed of four scales of human–vehicle–road–cloud after decomposition according to the coupling characteristics of IVIS; “C” represents each component in the sub-criterion layer, which is a sub-criterion of different dimensions after further refinement on the basis of the criterion layer B, for example, to distinguish vehicle B2 by single vehicle C3 and fleet C4. Moreover, the impact of on-cloud firewalls and on-cloud databases on the central cloud in the cloud criterion was considered. From here, the upper framework was established.
2.
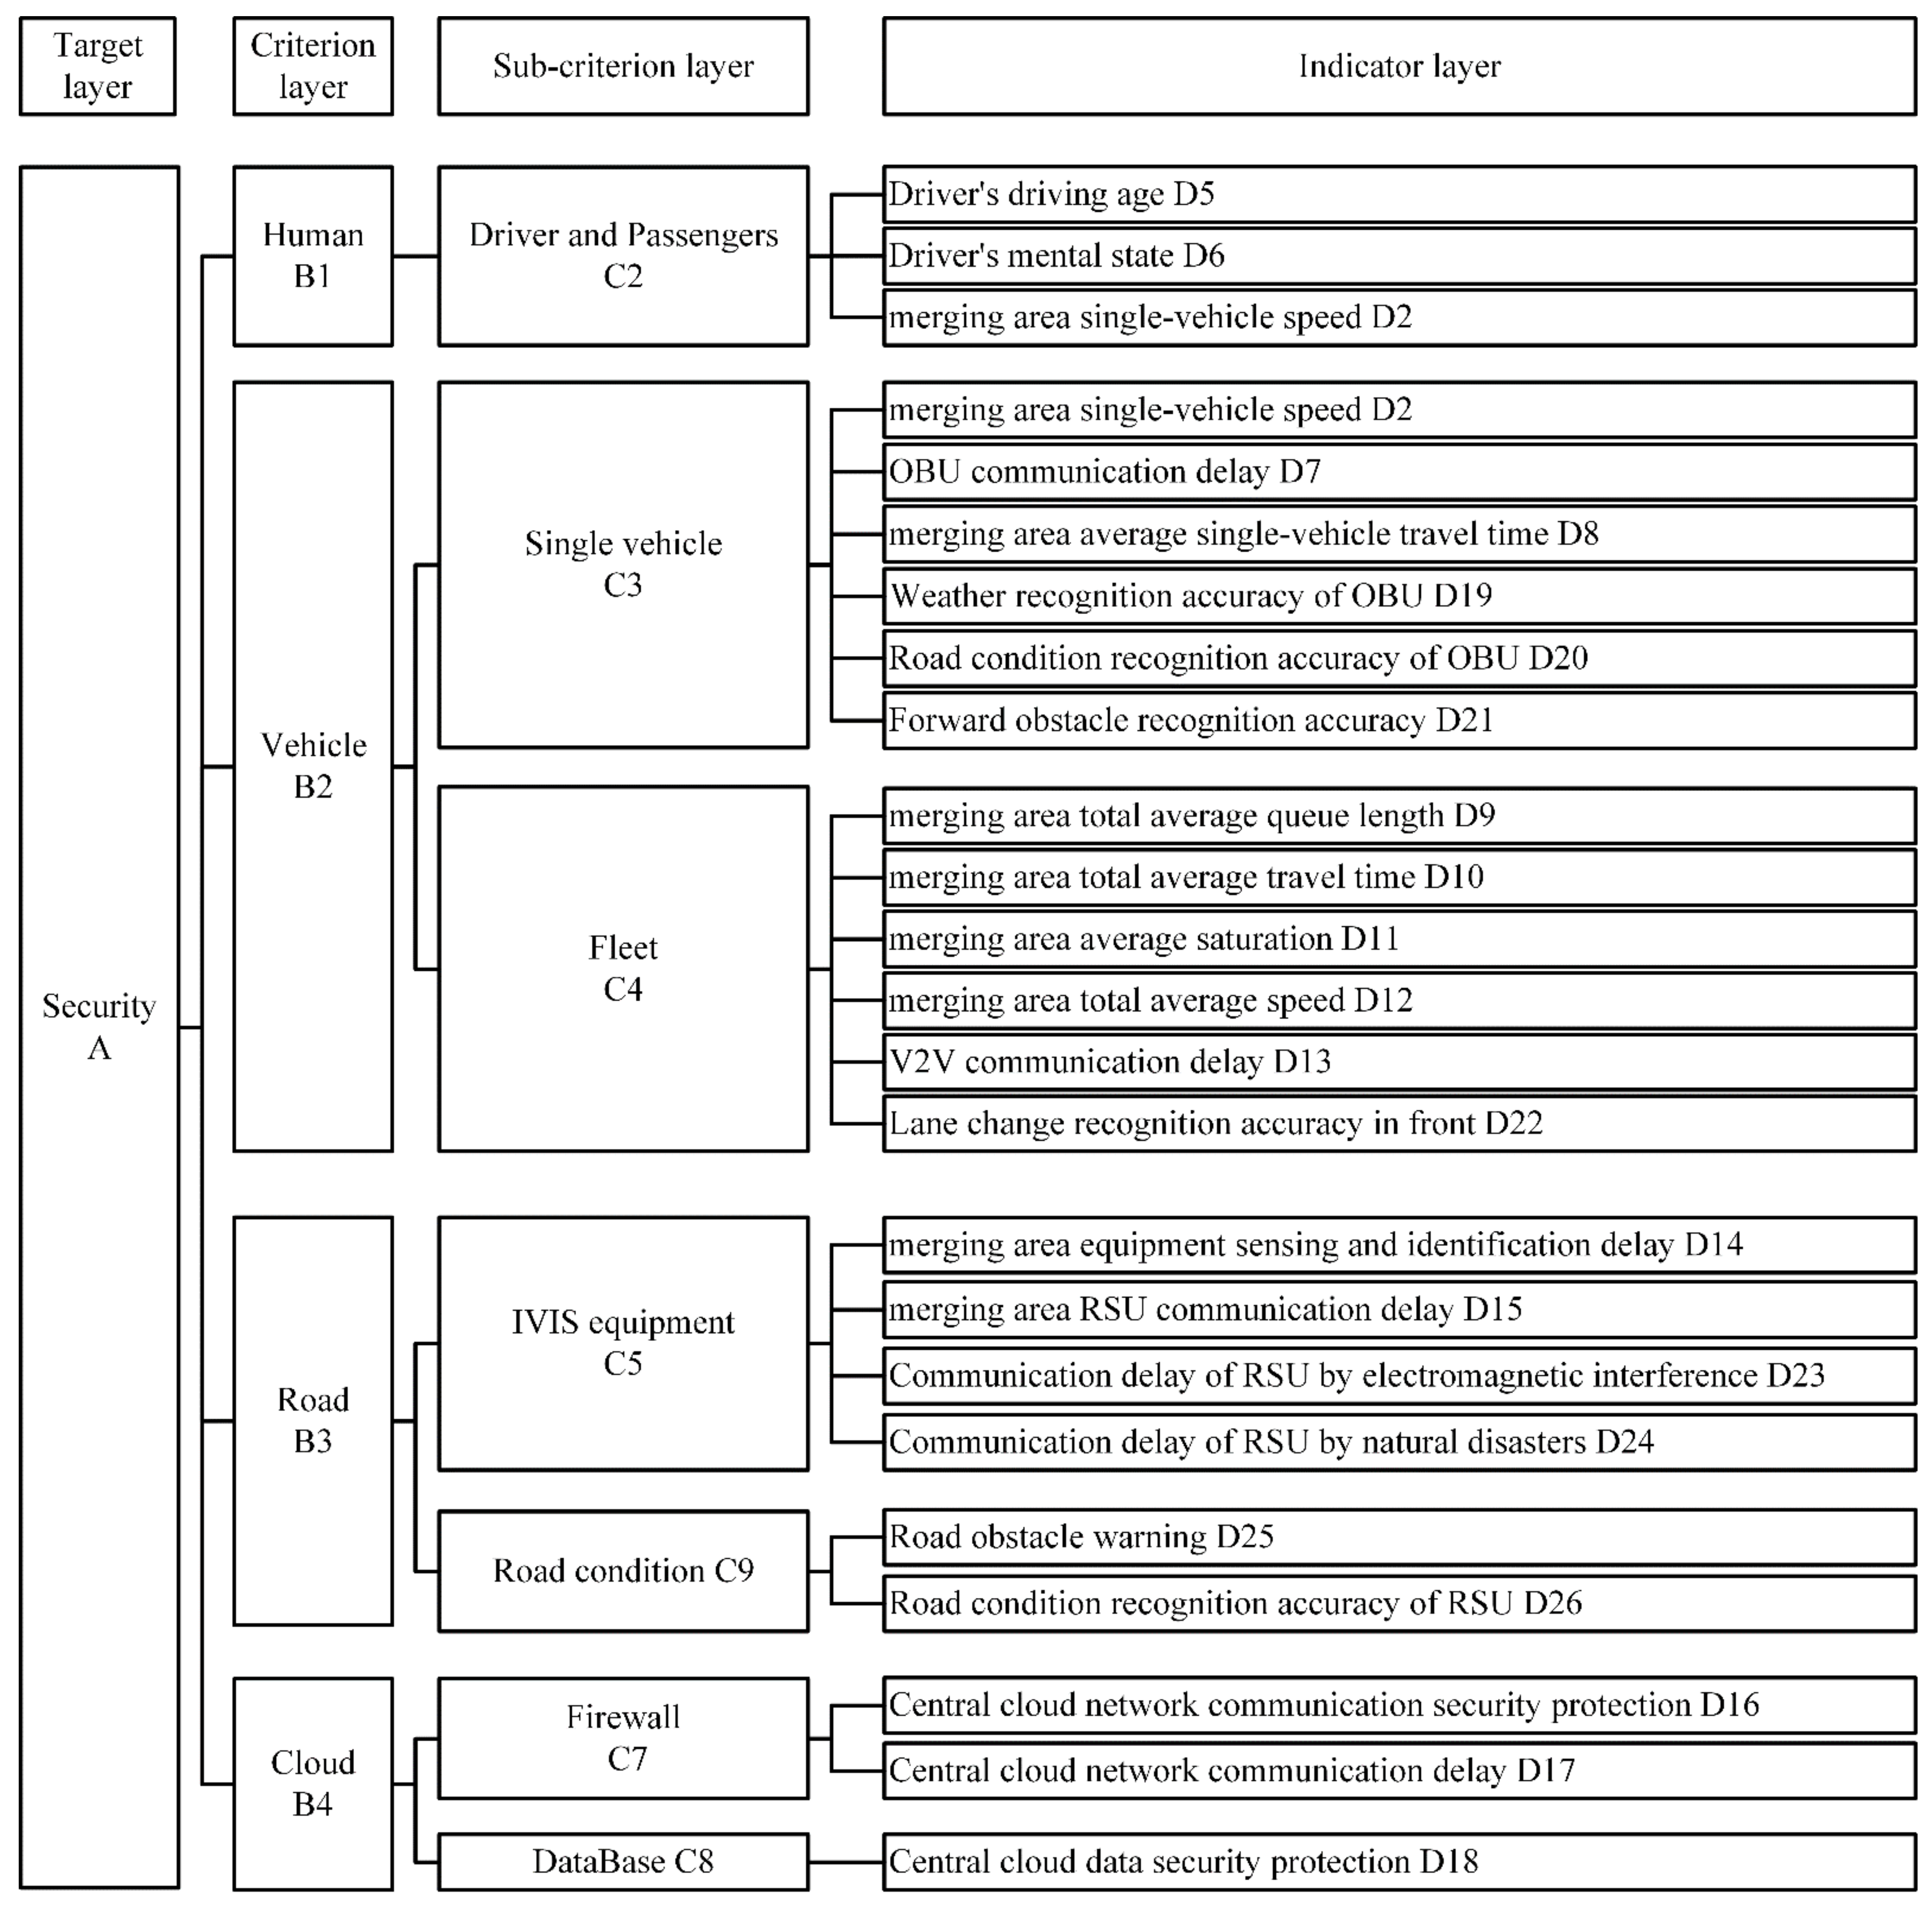
Step 2: Lower layer indicator extraction
Combining the literature research in the Literature Review section, we focused on the three aspects of multiple layers (target layer, criterion layer, subcriterion layer, and indicator layer), multiple scales (human, vehicle, road, and cloud), and multiple dimensions (IVIS system, infrastructure, and traffic participants including people and vehicles) and established the indicator set of the IVIS, as shown in Figure 4.
Specifically, traffic operation, travel time, congestion level, and TTC are usually used as optimization objectives in the evaluation, and those optimization objectives are generally calculated on the basis of the three major parameters of traffic (traffic volume, speed, and density)—these parameters can be transformed into each other as well, and thus the index system covers traffic volume, speed, travel time, saturation, etc. Driver behavior, vulnerability, and the uniqueness of the scenario also need to be considered, and thus the indexes also cover factors such as the driver’s mental state, construction area protection measures, number of conflict points, and extreme weather. CAV testing often is divided into functional testing of a single vehicle and cooperative testing of a cruising fleet. Since CAV technology relies on network cloud implementation, targets related to vehicle communication and network connectivity are considered in the set. In addition, the vehicle position, acceleration, and TTC are also physical quantities describing the vehicle and fleet motion state [45] and are controlled by the vehicle speed and travel time. Thus, vehicle speed and travel time are also part of the evaluation indicator set instead of position, acceleration, and TTC. Thereby, some indicators cross each other in the traffic operation evaluation and CAV testing, which are combined in the indicator set and shown only once, as shown in the overlapping part. The indicates in the overlapping part between the sets are called “common features”.
3.
Step 3: Demand–indicator matching based on scenario selection
Existing studies use intersections as the closed test field [1,46] because of the complexity. However, when it comes to using the test results for large-scale applications, the index results obtained from the tests are not well adapted to the actual application requirements. This is because the randomness of human and vehicle behavior in urban intersections exceeds the testing capabilities available in closed test sites (e.g., high density and large bursts of humans and vehicles cannot be well reproduced). In other words, the intersection is more reasonably classified as a test scenario under semi-open conditions.
The integration test of IVIS under closed conditions mainly includes the stress test and the strength test. The stress test tests the maximum load (stable and peak) that the system can achieve under certain load conditions by continuously increasing the system load. The impact of the system caused by the test object of the stress test is within the rated operating limits of the system and does not cause irreversible damage to the system. The strength test means that under atypical operating conditions, the test object’s influence on the system is beyond the system’s rated operating limits to measure the system’s operating condition under overload conditions.
In our study, in order to exclude the influence of highly random scenario elements on the test results, a stress test was conducted under closed conditions that was based on a repeatable cut-in test on a highway scenario [17], specifically a construction area with frequent vehicle cut-ins, as well as a strength test based on on-ramp merging, which can achieve high efficiency [47]. As shown in Figure 5, the CAV on lane 1 has to cut into lane 2 because of the construction area in front. The highway construction area is a rare scenario in highways with the participation of non-drivers and traffic practitioners for operational activities, which means a certain degree of freedom for humans, and its uncertainty affects the operation of the construction area. As shown in Figure 6, when the car on the ramp is ready to enter the main road, it will intertwine with lane 1 and lane 2 on the main road to generate at least two conflict points, and the higher the traffic flow, the more conflicts there are. The on-ramp merging area is the main conflict area where traffic intertwines on the highway, and thus we used the merging zone as a scenario to construct a safety test index system under extreme conditions.
Therefore, we took the highway construction area as the typical scenario for the stress test and the on-ramp merging area as the limit scenario for the strength test. Then, the stress test requirements and strength test requirements were matched with the above framework of the IVIS under closed conditions in order to obtain the corresponding indicators of the indicator layer under the above different scenarios. The framework of the IVIS highway construction area stress test evaluation index system under closed conditions is shown in Figure 7, and the framework of the IVIS on-ramp merging area strength test evaluation index system is shown in Figure 8.
The frameworks shown in Figure 7 and Figure 8 are both complete hierarchical frameworks. This complete hierarchical framework was formed by the metrics in Figure 4 after matching with the upper hierarchical framework for different scenarios and distributing them in subsets of the subcriteria layer to form a feature layer, and this feature layer was combined with the upper hierarchical framework. Moreover, since the features in certain sets were not applicable in different scenarios, the subcriteria and indicators included in different scenarios were different. For example, as shown in Figure 8, there will be no traffic practitioners in the highway merging area, and thus there was no subcriteria C1 and its subordinate indicators. For another example, the highway merging area shown in Figure 8 considers the test indicators in the strength test, which had certain requirements for extreme conditions, and therefore the impact of natural disasters (D24) needs to be considered, while the highway construction zone shown in Figure 7 was in the state of pressure test, and therefore D24 did not need to be considered. On the other hand, “common features” coexisted in many sets, and there were duplicate matches in the matching process between the upper hierarchical framework and the lower criteria, and thus there were duplicate indicators in the complete hierarchical structure of Figure 7 and Figure 8, such as D2, D3, and D4, i.e., common features caused the duplication of indicators in Figure 7 and Figure 8.
In summary, in the case of the upper hierarchy common to all scenarios in the IVIS environment obtained through IVIS feature decomposition and refinement, similarities (common upper hierarchy framework) and differences (different indicators due to different operating conditions (e.g., traffic practitioner/non-practitioner, or stress/strength testing)) appeared between Figure 7 and Figure 8.
Then, a two-by-two comparison judgment matrix for each level of Figure 7 and Figure 8 above can be obtained from the expert evaluation questionnaire. The weights of each criterion can be gained by calculating the maximum eigenvalue and the corresponding eigenvalue from the matrix. Finally, in line with the weights of each level and indicator, the total weights of each indicator in the target level were obtained.

3.2. Weight Calculation Based on the AHP Method

For the hierarchical analysis structure established in Figure 7 and Figure 8 for different scenarios, we invited several experts to score the importance of each index from 1 to 9 [12,20] and construct a judgment matrix. The scoring was based on the five-level scale importance, together with the corresponding meanings, which are listed in Table 2.
Then, the eigenvectors W of the judgment matrix can be obtained, and the consistency test C I of the judgment matrix based on the eigenvectors W was as shown in the following equation:
C I = λ max n n 1 ,
where λ max is the maximum eigenvalue of the judgment matrix and n is the order of the judgment matrix. When the judgment matrix order is greater than 2, the ratio of the judgment matrix consistency index C I to the average consistency index R I [20] is calculated as the random consistency ratio C R . When C R < 0.10 , the judgment matrix has acceptable consistency to obtain the index importance ranking in the IVIS integrated test evaluation index system under closed conditions.

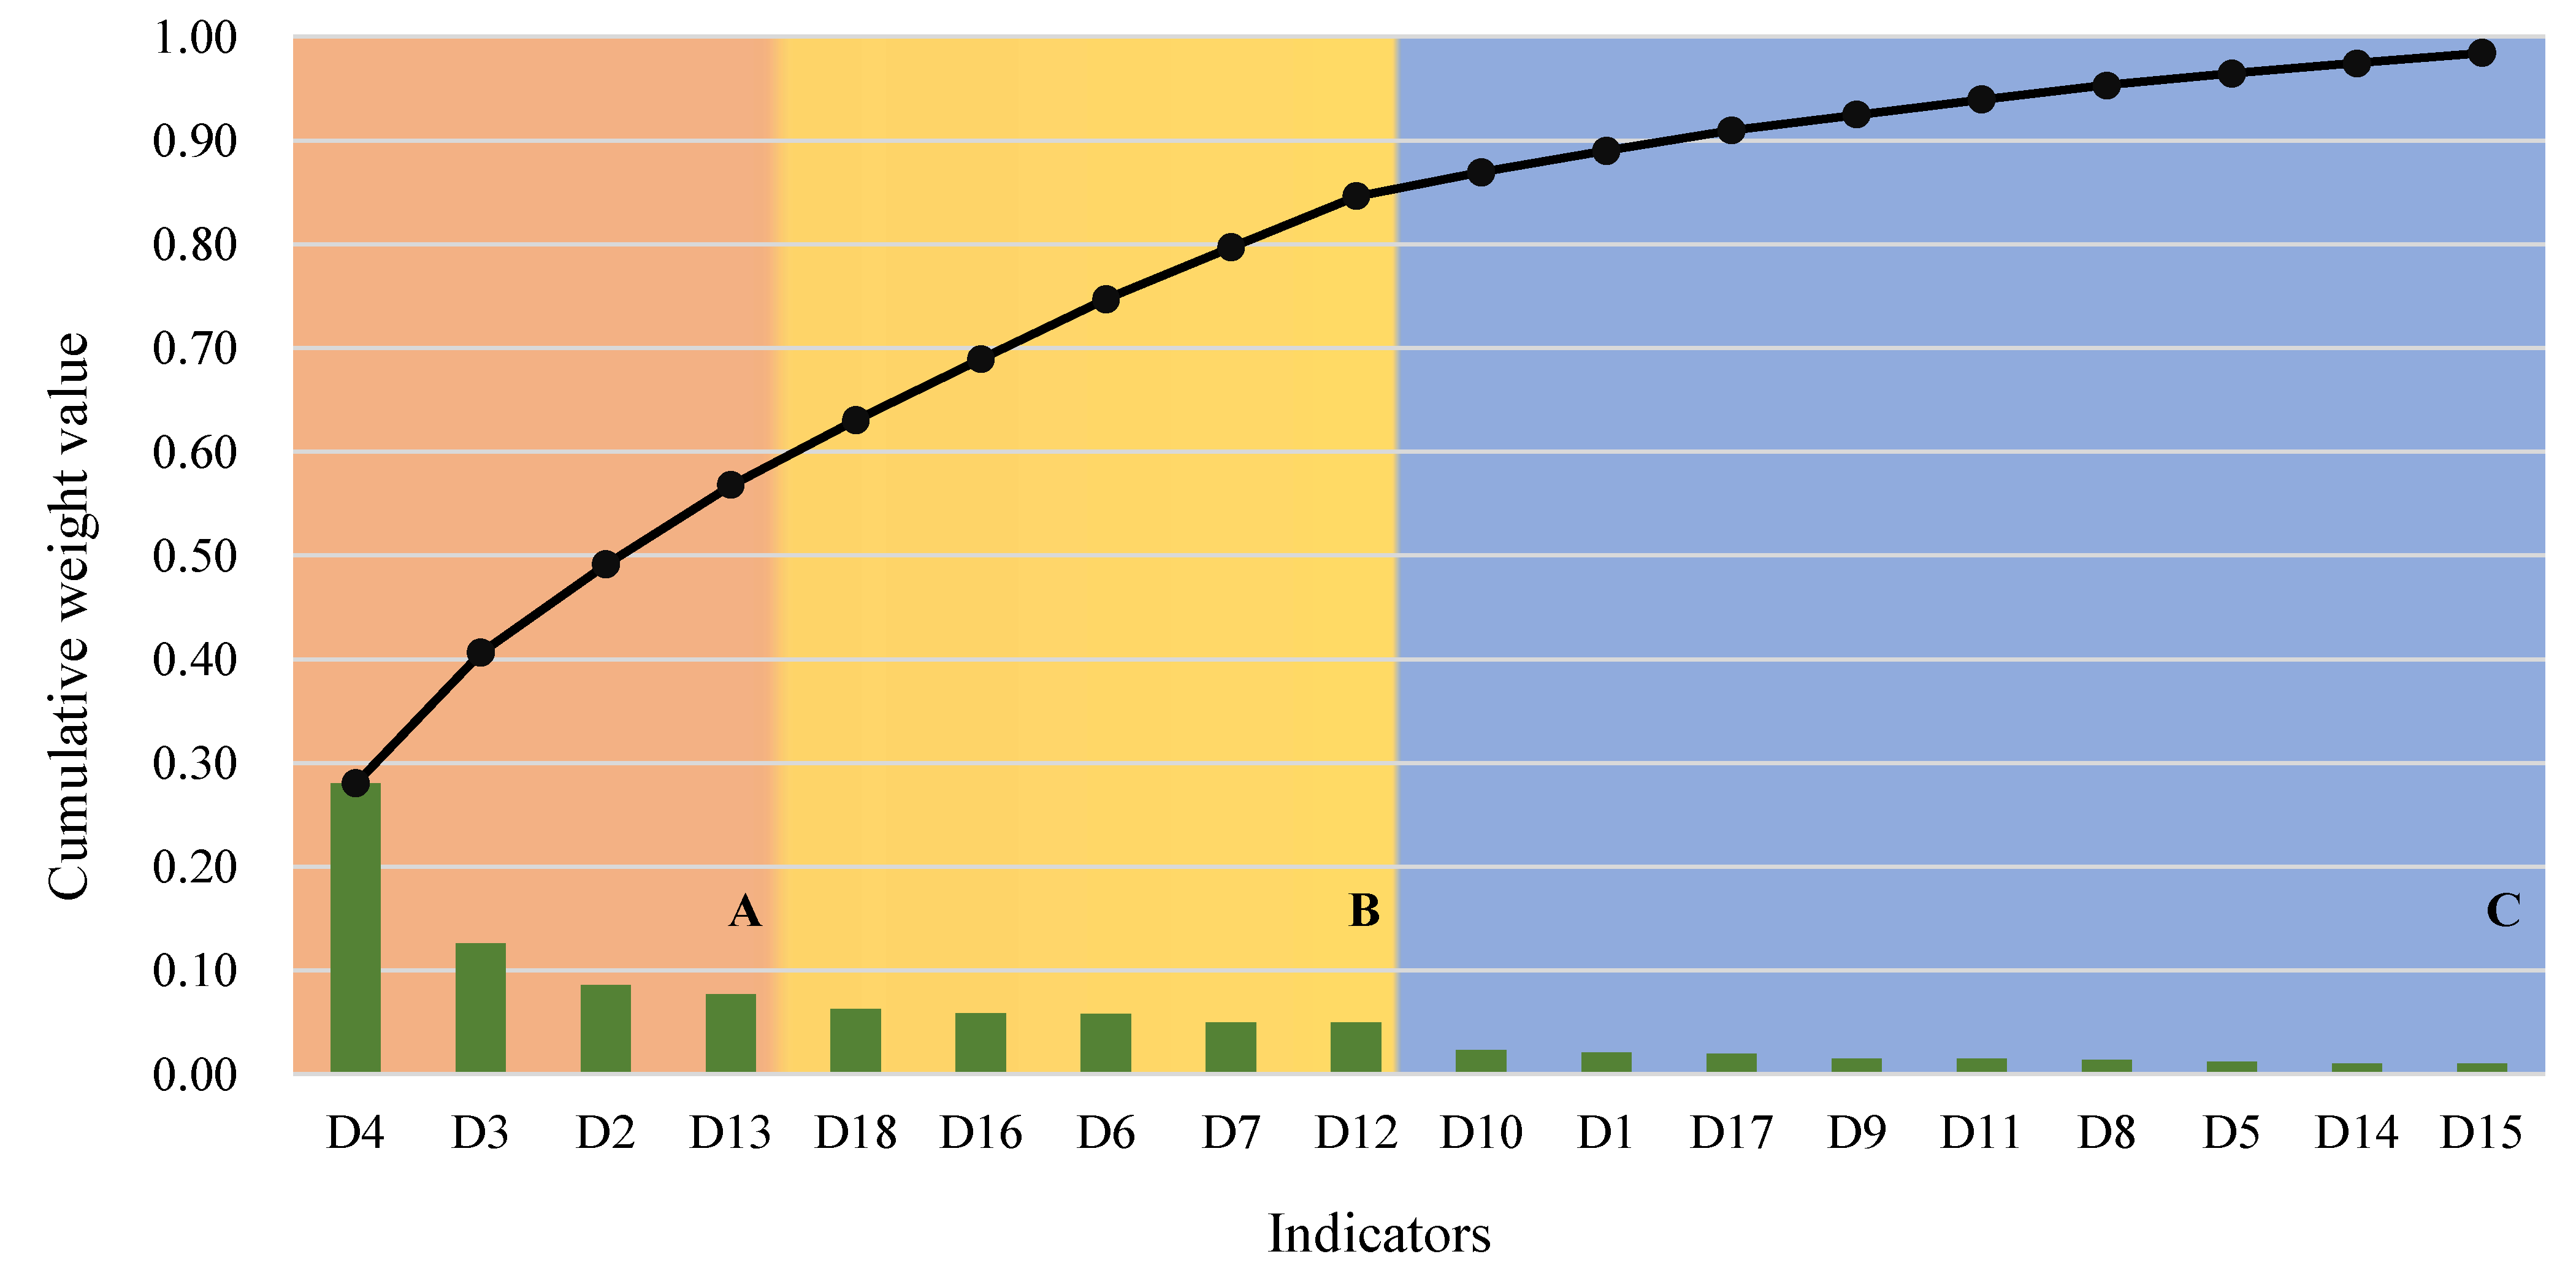
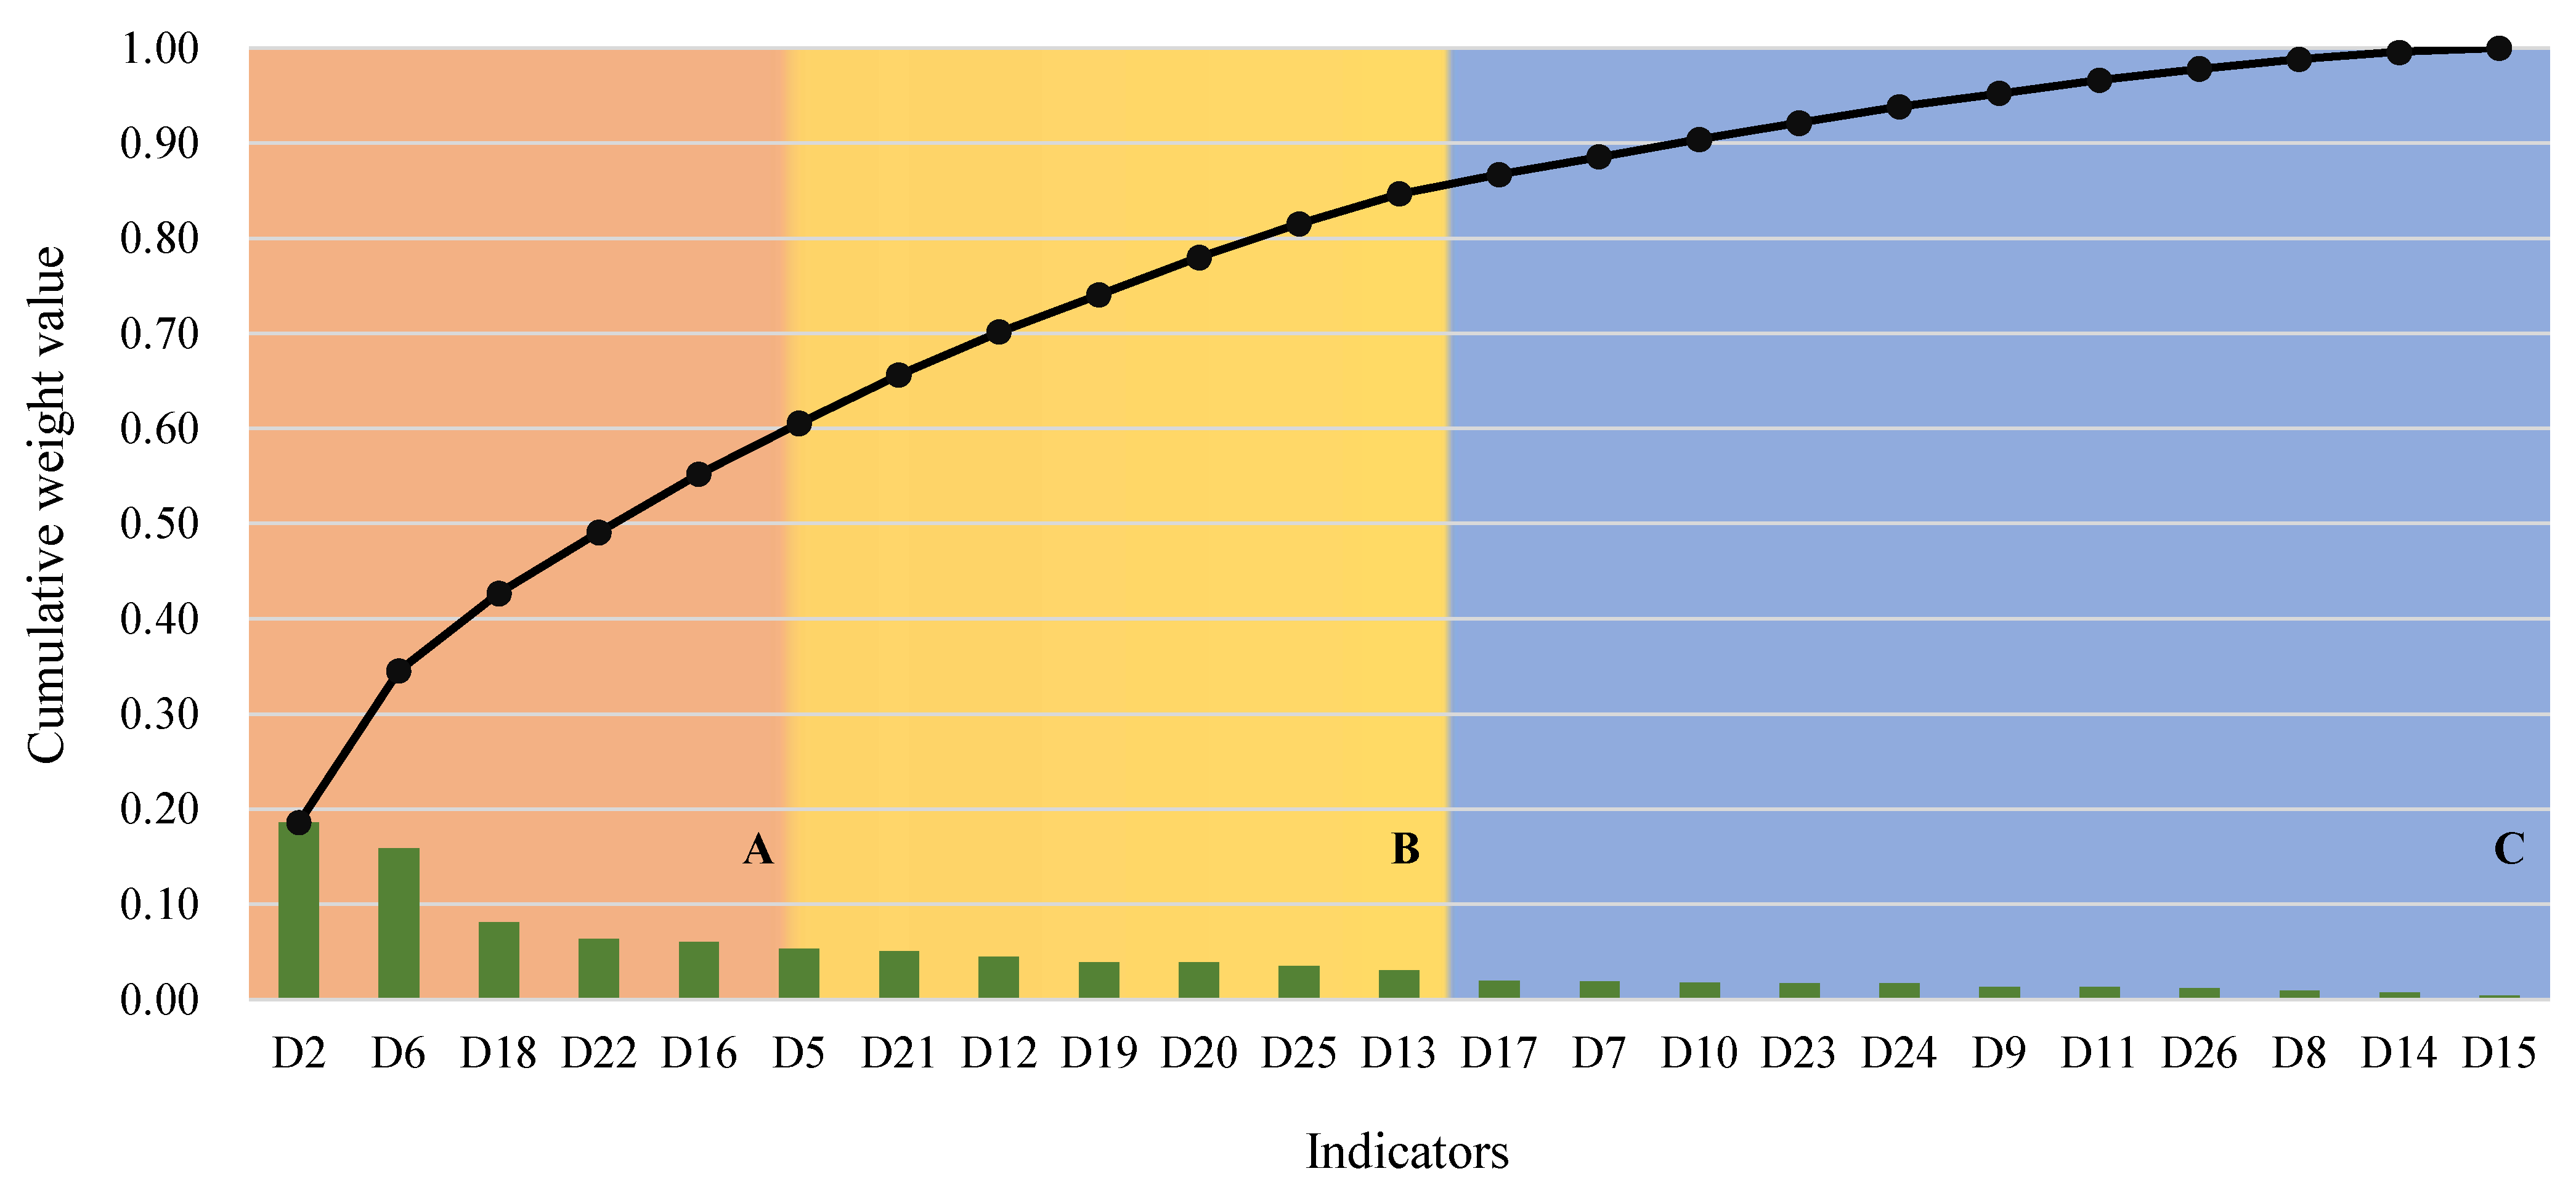
3.3. Index Screening Based on the ABC Method

In the IVIS test evaluation index system, the evaluation index for testing under different scenarios may be constrained by economic costs, test equipment, and other constraints, and thus the evaluation index needs to be screened. After obtaining the importance ranking of the indicators in the IVIS integration test evaluation index system under closed conditions, we used the ABC method to identify key factors that are in small amounts but decisive [48]. To filter for the most important evaluation indicators, we classified the indicators obtained from the above hierarchical analysis measurement into ABC categories and constructed an ABC indicator analysis table.

4. Example Analysis of Scenarios

Since most of the functions of the IVIS are still in the research stage, researchers and experimenters have a more specialized understanding of IVIS, and therefore the 10 experts invited for the established hierarchy in this paper were all scholars from research institutions, university professors, and general researchers in related fields. After the comprehensive judgment matrix was obtained from the experts’ scoring table by taking the plural, the matrices that did not meet the consistency test were adjusted, and the overall ranking and weight values of the judgment matrix were calculated. The final judgment matrices all conformed to the consistency test.

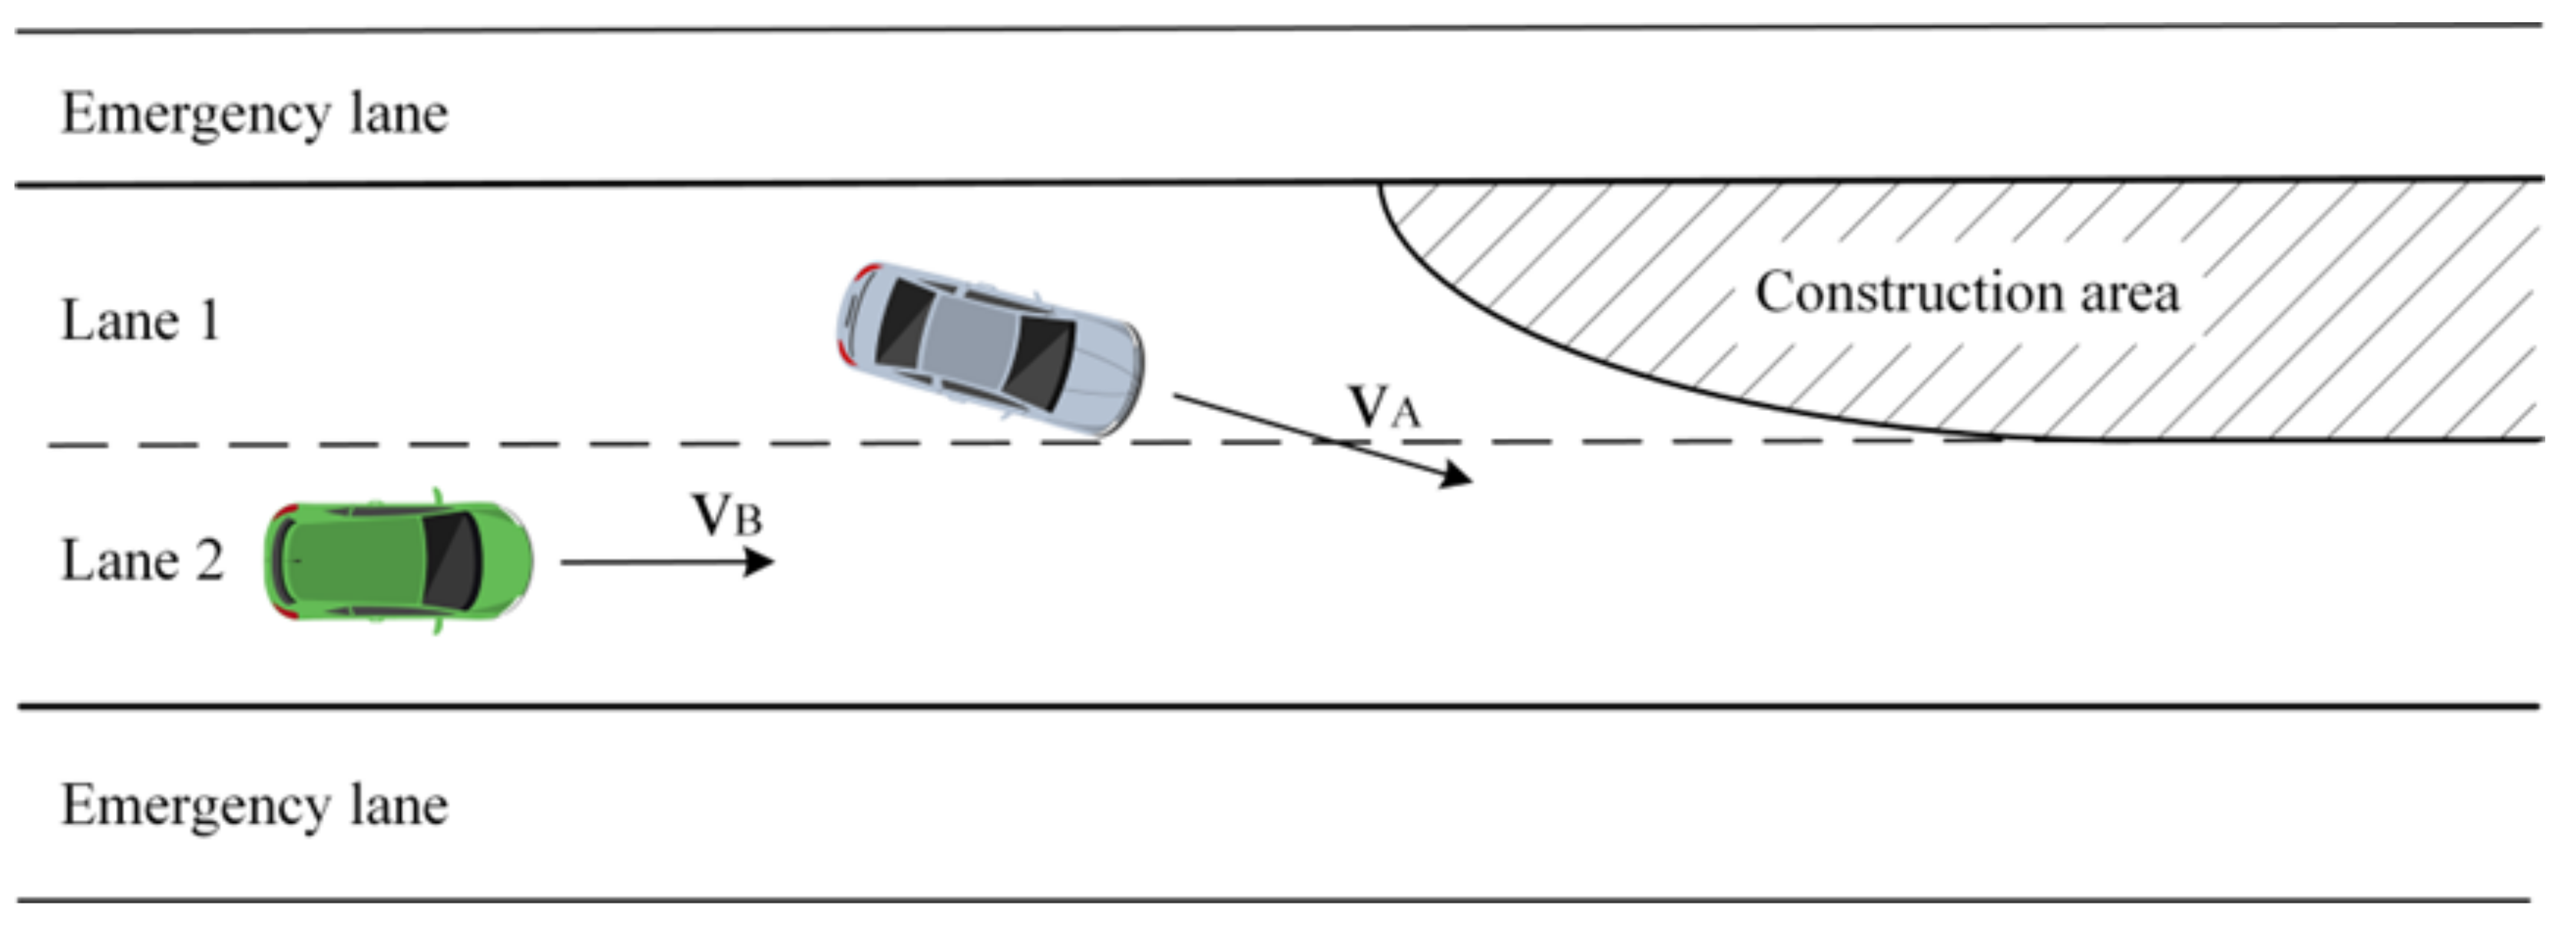
4.1. The Stress Test of the Highway Construction Area

In outlined in this section, the importance of the indicators for the evaluation of the IVIS highway construction area stress test under closed conditions was calculated according to the IVIS highway construction area stress test evaluation system, as shown in Figure 7. Taking the human criterion with safety as the target under closed conditions as an example, the judgment matrix and weights of each indicator were calculated as shown in Table 3, which were in the indicator layer under the human criterion for the importance of the safety impact of IVIS; the results of the weight hierarchy of each indicator of human criterion in the construction area were calculated as shown in Table 4.
Due to space limitations, all judgment matrices cannot be listed here. The total hierarchical weight results of indicators in the target layer in the construction area are shown in Table 5. From Table 5, it can be seen that among the stress test evaluation index system of the construction area of IVIS under closed conditions with safety as the target, the construction area safety measure D4 was the most significant factor affecting the overall safety of the construction area, followed by the construction area number of conflict points D3, while the construction area equipment sensing and identification delay D14 and the construction area RSU communication delay D15 were the least influential factors. The above results show that even though IVIS adopted advanced communication technology to assist road operation, communication was not enough to be the main factor affecting the system safety of IVIS. Ultimately, the safety protection of the construction area itself during the road construction period and the regularity of the travel routes in and around the area were the fundamental factors to avoid road risks in the highway construction area. This result may be slightly beyond the general perception; in fact, it is most likely related to the lack of trust in the current IVIS by the experts invited to the survey, which may change with the development of more accurate vehicle positioning and more instantaneous communication technologies.
According to the results of the AHP analysis of the abovementioned safety objectives for the stress test of the construction area, the index weight values were ordered and then accumulated, and the ABC index analysis diagram was drawn, as shown in Figure 9. As seen from Figure 9, the construction area safety measures D4, the construction area number of conflict points D3, and the vehicle–vehicle (V2V) communication delay D13 were A-type indicators, and the above indicators must be included in the test scope when testing and evaluating the IVIS for the construction area under closed conditions; the central cloud data security protection D18, the central cloud network communication security protection D16, the driver’s mental state D6, the OBU communication time delay D7, and the construction area total average speed D12 were B-type indicators, and when testing for construction area scenarios, one can consider whether such indicators need to be included in the testing scope according to the actual testing conditions and testing costs, as appropriate, while the remaining category C indicators can be tested without the need for a more comprehensive assessment of the security of the construction area stress test to save testing costs.

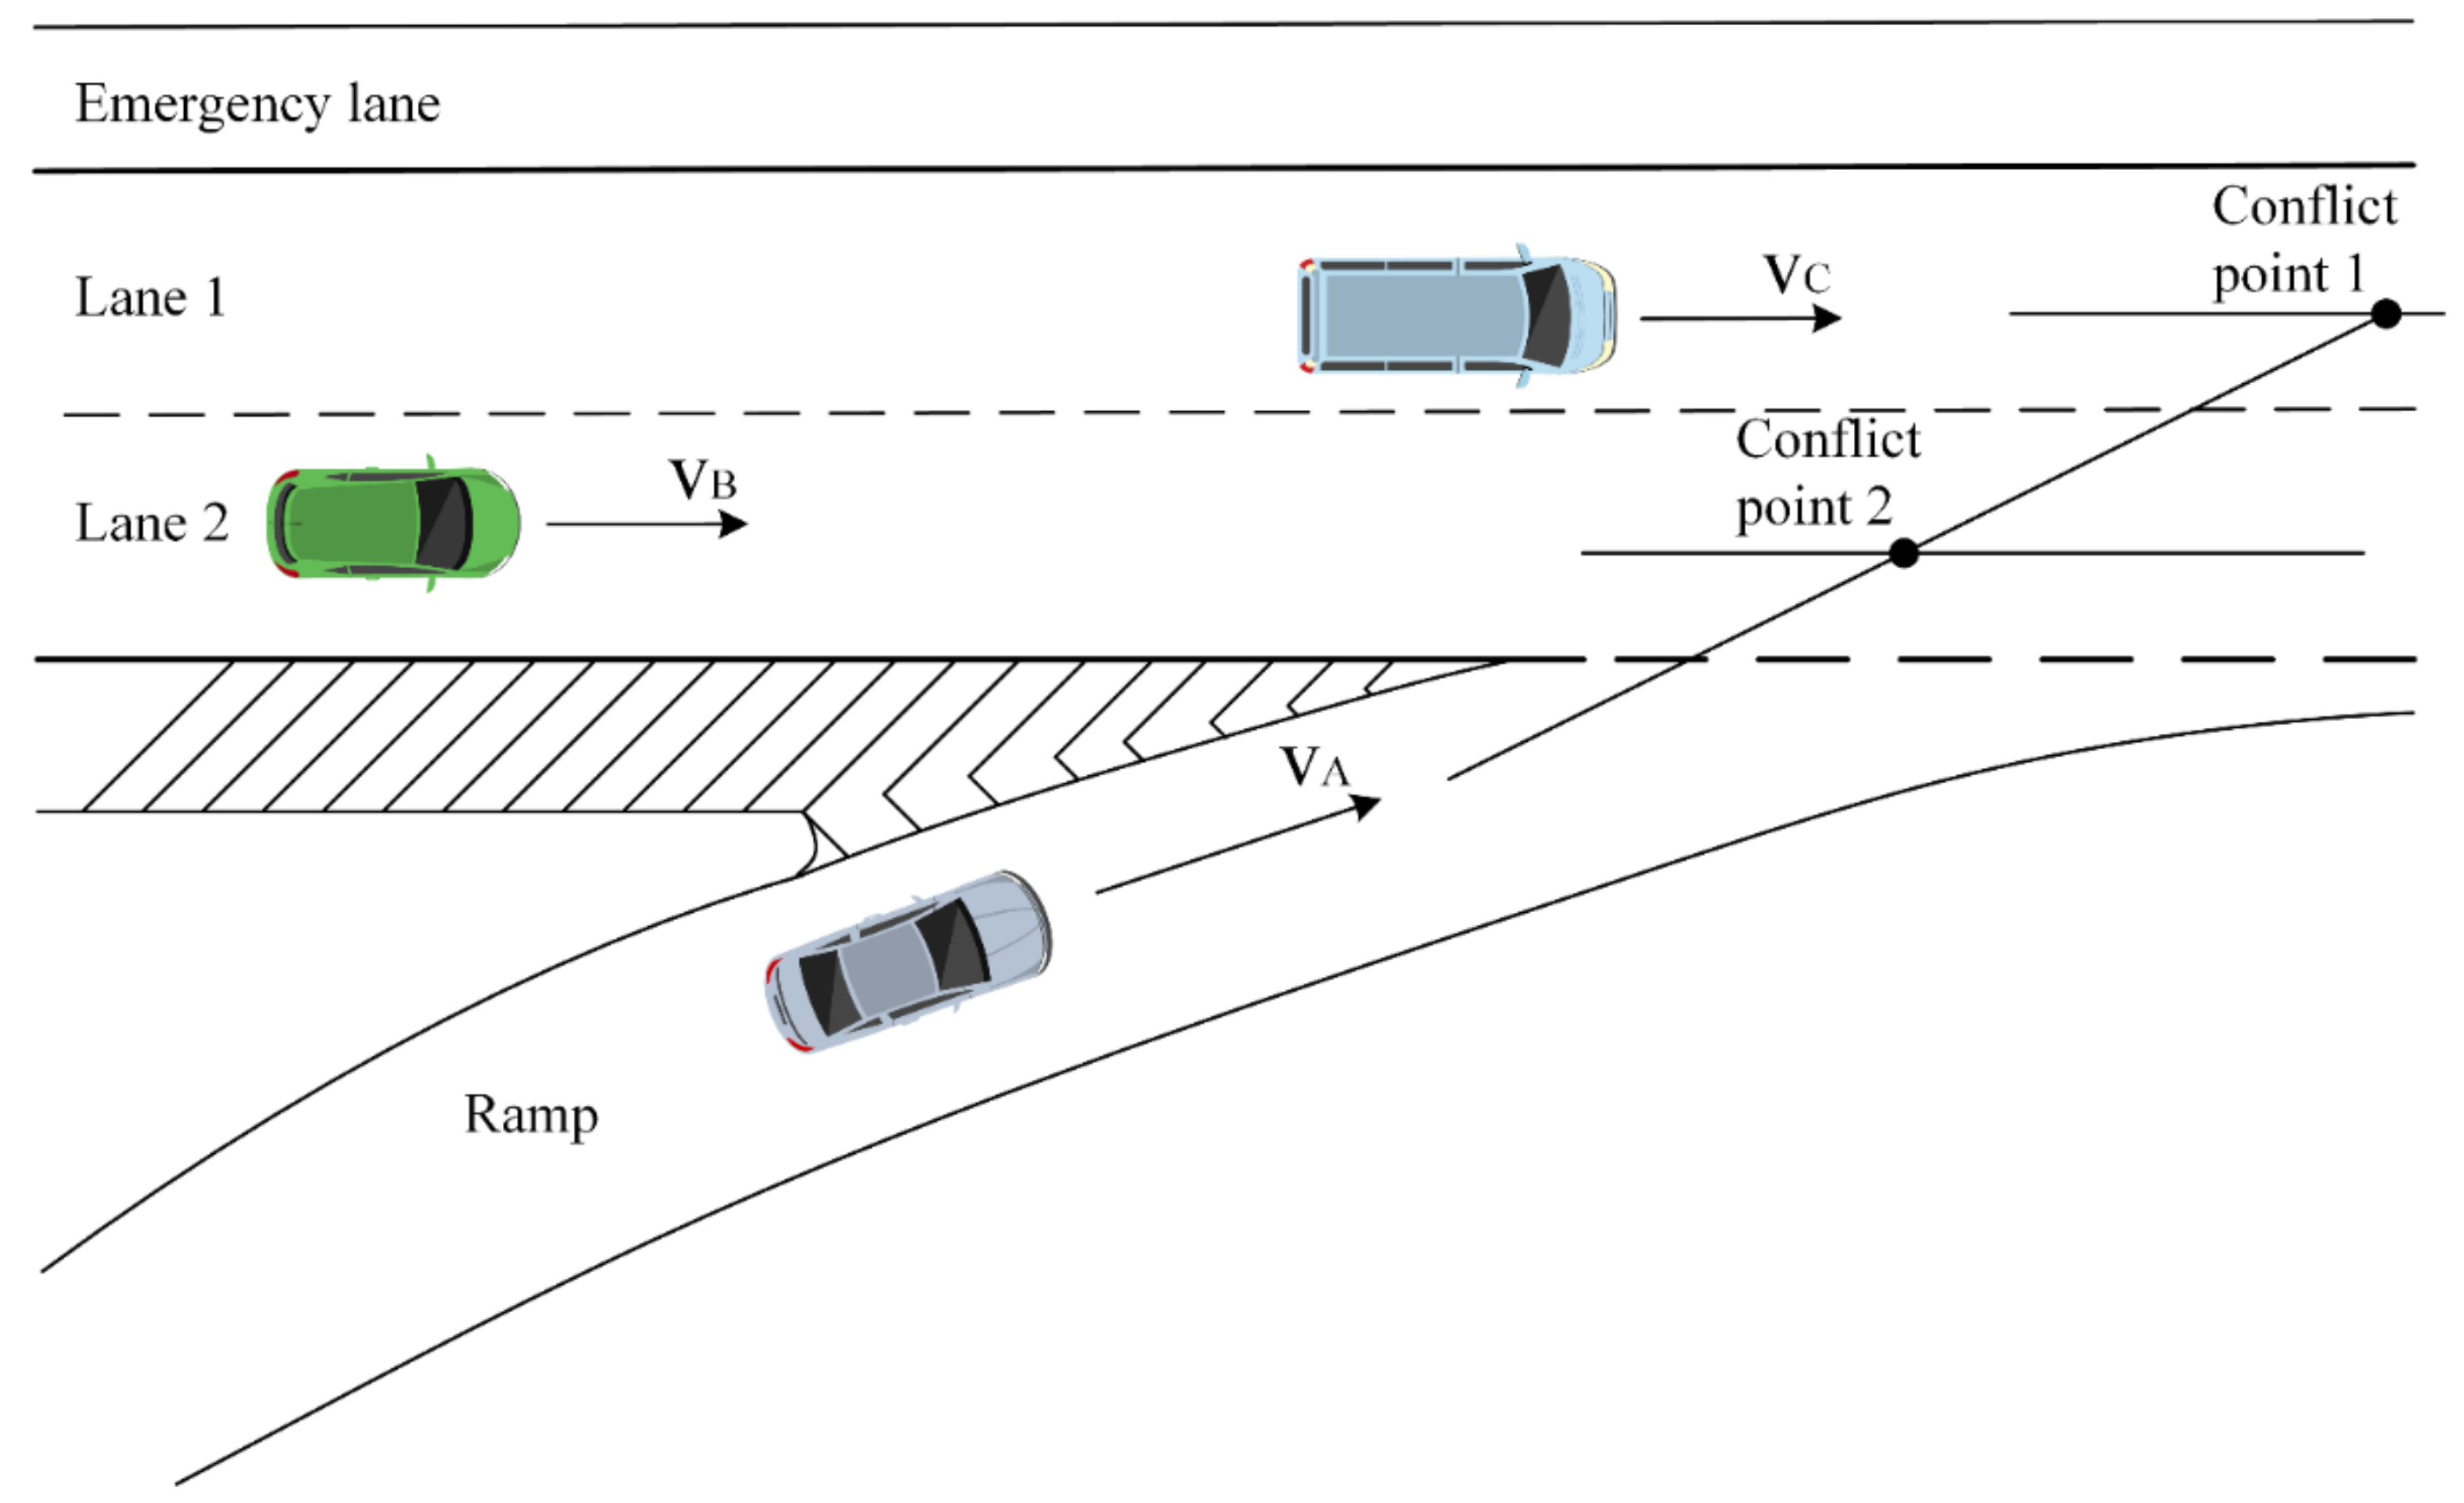
4.2. The Strength Test of the Highway Merging Area

In this section, we calculated the importance of the strength test evaluation indexes of the IVIS highway merging area under closed conditions according to Figure 8. Then, the total hierarchical weight results of indicators in the target layer in the merging area were as shown in Table 6.
As seen from Table 6, among the strength test index system of the merging area of IVIS under closed conditions with safety as the goal, the merging area single-vehicle speed D2 was the most significant factor affecting the overall safety of the merging area, followed by the driver’s mental state D6, while the merging area equipment sensing and identification delay D14 and the merging area RSU communication delay D15 were the least influential factors. The above results indicate that similar to the stress test index of the construction area, the influence of communication equipment on safety was not the most important, and the dangerous driving behavior (single-vehicle speed and driver’s mental state) in the merging section was the fundamental factor affecting safety in the strength test. This could be because, in the strength test in the merging area, the identification and response of the existing IVIS to extreme weather, extreme road conditions, and extreme communication only lies in detecting and sending information, but not yet well enough to perfectly handle with them, and thus the safety of the strength test in the merging area depends more on human driving behavior.
On the basis of the evaluation index weights and rankings shown in Table 6, the analysis chart of ABC indexes of the merging area under closed conditions was drawn, as shown in Figure 10. As seen from Figure 10, the merging area single-vehicle speed D2, the driver’s mental state D6, the central cloud data security protection D18, the lane change recognition accuracy in front D22, and the central cloud network communication security protection D16 were A-class indicators, and the above indicators must be included in the test scope when testing and evaluating for IVIS in the merging area under closed conditions; the driver’s driving age D5, the forward obstacle recognition accuracy D21, the merging area total average speed D12, the weather recognition accuracy of OBU D19, the road condition recognition accuracy of OBU D20, the road obstacle warning D25, and the V2V communication delay D13 were B-type indicators that can be considered according to the actual test conditions and test cost when testing for merging area scenarios. The remaining category C indicators can be tested without the need for a more comprehensive assessment of the security of the construction area pressure test to save testing costs.

5. Conclusions

In this paper, we conducted a demand analysis of IVIS stress tests and strength tests under closed conditions, and also constructed a test index framework around three aspects of multiple layers (target layer, criterion layer, subcriterion layer, and indicator layer), multiple scales (people, vehicle, road, and cloud), and multiple dimensions (IVIS system, infrastructure, and traffic participants), using AHP to conduct a study on the evaluation index system of IVIS stress tests under the scenarios of highway construction areas and IVIS strength tests under the scenarios of highway merging areas.
First, we constructed an IVIS test evaluation index screening method under closed conditions; then, we analyzed the stress test evaluation indexes on the basis of highway construction areas and strength test evaluation indexes based on highway merging areas; finally, we obtained classification indicators for different scenarios of the IVIS integration test under closed conditions, which helped in improving the extraction method of existing IVIS integration test indicators for comprehensive evaluation. The examples showed that those indicators related to driving behavior always reflect a more important influence on safety in different scenarios. The AHP-ABC extraction method also provides advantages for the intelligent networked environment and driving safety. In the intelligent networked environment, the indicators extracted by the method guide smart vehicles and smart infrastructure to certain technology development, and in driving safety, the extraction method can provide full coverage, high-security simulation testing, and verification indicators to ensure driving safety.
IVIS is constantly evolving, and the indicators and scenarios involved in this article may not be exhaustively considered due to the limitations of thinking. It should be noted in particular that due to the limited number of experts, the test indicators, screening methods, and test scenarios mentioned in this article can be further enhanced according to future technology development or richer actual scenarios. For example, we can discuss how to extract the test indicators for curved driving scenarios under closed conditions or further discuss the index evaluation system for typical scenarios of IVIS integration tests under semi-open conditions. The test index evaluation for intersection sites under semi-open conditions will be undertaken in future research.

Author Contributions

Methodology, J.C., Z.H. and K.L.; questionnaire survey, J.C. and Z.H.; data curation, J.C.; writing—original draft preparation, J.C.; writing—review and editing, K.L., H.L. and Y.H. All authors have read and agreed to the published version of the manuscript.

Funding

This research is supported by National Natural Science Foundation of China (grant no. 71871043).

Institutional Review Board Statement

Not applicable.

Informed Consent Statement

Not applicable.

Data Availability Statement

Not applicable.

Conflicts of Interest

The authors declare no conflict of interest.

References

  1. Wang, R.; Zhang, X.; Xu, Z.; Zhao, X.; Li, X. Research on Performance and Function Testing of V2X in a Closed Test Field. J. Adv. Transp. 2021, 2021, 1–18. [Google Scholar] [CrossRef]
  2. Quiroga, C.A. Performance Measures and Data Requirements for Congestion Management Systems. Transp. Res. Part C Emerg. Technol. 2000, 8, 287–306. [Google Scholar] [CrossRef]
  3. Rao, A.M.; Velmurugan, S.; Lakshmi, K.M.V.N. Evaluation of Influence of Roadside Frictions on the Capacity of Roads in Delhi, India. Transp. Res. Procedia 2017, 25, 4771–4782. [Google Scholar] [CrossRef]
  4. Gressai, M.; Varga, B.; Tettamanti, T.; Varga, I. Investigating the Impacts of Urban Speed Limit Reduction through Microscopic Traffic Simulation. Commun. Transp. Res. 2021, 1, 100018. [Google Scholar] [CrossRef]
  5. Wang, S.; Chen, C.; Zhang, J.; Gu, X.; Huang, X. Vulnerability Assessment of Urban Road Traffic Systems Based on Traffic Flow. Int. J. Crit. Infrastruct. Prot. 2022, 38, 100536. [Google Scholar] [CrossRef]
  6. Zhang, S.T.; Chu, L.; Yao, L.; Yang, Y.; Zhang, H. The Design of Regenerative Braking System with a Pedal Emulator. Adv. Mater. Res. 2013, 694, 1602–1607. [Google Scholar] [CrossRef]
  7. Meng, D.; Zhang, L.; Yu, Z. A Dynamic Model for Brake Pedal Feel Analysis in Passenger Cars. Proc. Inst. Mech. Eng. Part D J. Automob. Eng. 2015, 230, 955–968. [Google Scholar] [CrossRef]
  8. Blau, J. Creative Destruction [Car Crash Testing]. IEEE Spectr. 2002, 39, 55–56. [Google Scholar] [CrossRef]
  9. Wang, R.; Zhao, X.; Xu, Z.; Yang, Y. CAVTest: A Closed Connected and Automated Vehicles Test Field of Chang’an University in China. SAE Int. J. Connect. Autom. Veh. 2021, 4, 423–435. [Google Scholar] [CrossRef]
  10. Roudbari, A.; Nateghi, A.; Yousefi-Khanghah, B.; Asgharpour-Alamdari, H.; Zare, H. Resilience-Oriented Operation of Smart Grids by Rescheduling of Energy Resources and Electric Vehicles Management during Extreme Weather Condition. Sustain. Energy Grids Netw. 2021, 28, 100547. [Google Scholar] [CrossRef]
  11. Li, K.; Luo, S.; Fan, L.; Hu, S.; Zhou, X.; Tu, R.; Zhang, H.; Jin, X.; Zhao, X.; Su, L. Investigation on the Performance and Characteristics of a Heat Pump System for Electric Vehicles under Extreme Temperature Conditions. Case Stud. Therm. Eng. 2021, 27, 101308. [Google Scholar] [CrossRef]
  12. Yang, Y.; Chen, G.; Wang, D. A Security Risk Assessment Method Based on Improved FTA-IAHP for Train Position System. Electronics 2022, 11, 2863. [Google Scholar] [CrossRef]
  13. Newman-Askins, R.; Ferreira, L.; Bunker, J. Intelligent Transport Systems Evaluation: From Theory to Practice. In Proceedings of the 21st ARRB and 11th REAAA Conference, Cairns, Australia, 18–23 May 2003; p. 21. [Google Scholar]
  14. Oliveira, E.; Portugal, L.; Junior, W. Determining Critical Links in a Road Network: Vulnerability and Congestion Indicators. Procedia Soc. Behav. Sci. 2014, 162, 158–167. [Google Scholar] [CrossRef] [Green Version]
  15. He, F.; Liu, Y.; Ma, L. A Traffic Congestion Assessment Method for Urban Road Networks Based on Speed Performance Index. Procedia Eng. 2016, 137, 425–433. [Google Scholar] [CrossRef] [Green Version]
  16. Jackson, S.S. Safety Aware Platooning of Automated Electric Transport Vehicles. Master’s Thesis, Utah State University, Logan, UT, USA, 2013; p. 1746. [Google Scholar] [CrossRef]
  17. Zhou, W.; Zhu, Y.; Zhao, X.; Xu, Z.; Wang, R. Data-Driven Vehicle Cut-In Test Cases Generation for Testing of Autonomous Driving on Highway. In Proceedings of the CICTP 2020 Conference, Xi’an, China, 17–20 December 2021; American Society of Civil Engineers: Reston, VA, USA, 2020; pp. 892–904. [Google Scholar]
  18. Genders, W.; Razavi, S.N. Impact of Connected Vehicle on Work Zone Network Safety through Dynamic Route Guidance. J. Comput. Civ. Eng. 2016, 30, 4015020. [Google Scholar] [CrossRef]
  19. Kolosz, B.; Grant-Muller, S. Appraisal and Evaluation of Interurban ITS: A European Survey. IEEE Trans. Intell. Transp. Syst. 2014, 16, 1070–1087. [Google Scholar] [CrossRef]
  20. Yu, H.; Lin, Y.; Ren, Y.; Chao, W. Comprehensive Evaluation Method of IVIS Based on Multi-Objective Decision. In Proceedings of the CICTP 2020, Xi’an, China, 17–20 December 2021; pp. 1290–1302. [Google Scholar]
  21. Hsieh, M.-C.; Chen, L.-X.; Lee, Y.-C.; Liu, Q.-M. A Simulation-Based Study of the Effect of Brake Light Flashing Frequency on Driver Brake Behavior from the Perspective of Response Time. Behav. Sci. 2022, 12, 332. [Google Scholar] [CrossRef]
  22. Zhang, Y.; Tian, B.; Xu, Z.; Gong, S.; Gao, Y.; Cui, Z.; Chen, X. A Local Traffic Characteristic Based Dynamic Gains Tuning Algorithm for Cooperative Adaptive Cruise Control Considering Wireless Communication Delay. Transp. Res. Part C Emerg. Technol. 2022, 142, 103766. [Google Scholar] [CrossRef]
  23. Hu, M.; Zhao, X.; Hui, F.; Tian, B.; Xu, Z.; Zhang, X. Modeling and Analysis on Minimum Safe Distance for Platooning Vehicles Based on Field Test of Communication Delay. J. Adv. Transp. 2021, 2021, 5543114. [Google Scholar] [CrossRef]
  24. Javed, M.A.; Ben Hamida, E.; Znaidi, W. Security in Intelligent Transport Systems for Smart Cities: From Theory to Practice. Sensors 2016, 16, 879. [Google Scholar] [CrossRef] [Green Version]
  25. Huang, W.; Wen, D.; Geng, J.; Zheng, N.-N. Task-Specific Performance Evaluation of UGVs: Case Studies at the IVFC. Intell. Transp. Syst. IEEE Trans. 2014, 15, 1969–1979. [Google Scholar] [CrossRef]
  26. Cartenì, A.; Regna, M.; Henke, I.; Di Bartolomeo, M.I. A Cost-Benefit Analysis of a Fully-Automated Driverless Metro Line in a High-Density Metropolitan Area in Italy. In Proceedings of the International Conference on Environment and Electrical Engineering IEEE (EEEIC and I & CPS Europe), Genova, Italy, 19 June 2019. [Google Scholar] [CrossRef]
  27. Leviäkangas, P.; Lähesmaa, J. Profitability Evaluation of Intelligent Transport System Investments. J. Transp. Eng.-Asce 2002, 128, 276–286. [Google Scholar] [CrossRef]
  28. Li, H.; Ni, F.; Dong, Q.; Zhu, Y. Application of Analytic Hierarchy Process in Network Level Pavement Maintenance Decision-Making. Int. J. Pavement Res. Technol. 2018, 11, 345–354. [Google Scholar] [CrossRef]
  29. Deng, F.; Wang, C.; Liang, X. Fuzzy Comprehensive Evaluation Model for Flight Safety Evaluation Research Based on an Empowerment Combination. In Proceedings of the 10th International Conference on Management Science and Engineering Management, Kanazawa, Japan, 28–31 July 2017; pp. 1479–1491. [Google Scholar] [CrossRef]
  30. Cartenì, A.; Henke, I.; Mallozzi, F.; Molitierno, C. A Multi-Criteria Analysis as A Rational Evaluation Process for Building a New Highway in Italy. WIT Trans. Ecol. Environ. 2022, 217, 713–723. [Google Scholar] [CrossRef] [Green Version]
  31. Turoń, K.; Kubik, A.; Chen, F. What Car for Car-Sharing? Conventional, Electric, Hybrid or Hydrogen Fleet? Analysis of the Vehicle Selection Criteria for Car-Sharing Systems. Energies 2022, 15, 4344. [Google Scholar] [CrossRef]
  32. Turoń, K. Selection of Car Models with a Classic and Alternative Drive to the Car-Sharing Services from the System’s Rare Users Perspective. Energies 2022, 15, 6876. [Google Scholar] [CrossRef]
  33. Awasthi, A.; Chauhan, S.S. Using AHP and Dempster–Shafer Theory for Evaluating Sustainable Transport Solutions. Environ. Model. Softw. 2011, 26, 787–796. [Google Scholar] [CrossRef]
  34. Yang, Y.H.; Chen, Y.; Tang, Z.D. Analysis of the Safety Factors of Municipal Road Undercrossing Existing Bridge Based on Fuzzy Analytic Hierarchy Process Methods. Transp. Res. Rec. 2021, 2675, 915–928. [Google Scholar] [CrossRef]
  35. Lu, X.; Lu, J.; Yang, X.; Chen, X. Assessment of Urban Mobility via a Pressure-State-Response (PSR) Model with the IVIF-AHP and FCE Methods: A Case Study of Beijing, China. Sustainability 2022, 14, 3112. [Google Scholar] [CrossRef]
  36. Anthopoulos, L.; Kolovou, P. A Multi-Criteria Decision Process for EV Charging Stations’ Deployment: Findings from Greece. Energies 2021, 14, 5441. [Google Scholar] [CrossRef]
  37. Sun, Y.; Wang, J.; Li, C.; Liu, K. Competitiveness Evaluation of Electric Bus Charging Services Based on Analytic Hierarchy Process. World Electr. Veh. J. 2022, 13, 81. [Google Scholar] [CrossRef]
  38. Mo, S.C.; Wang, Y.H.; Xiong, F. Identification and Prioritization of Key Health Hazards to Workers in Roadway Construction. Transp. Saf. Environ. 2022, 4, 9. [Google Scholar] [CrossRef]
  39. Kukreti, A.; Singh, R.; Bansal, R. Happy Voyage: Application of Total Quality Management-TQM in Indian Tourism Industry with Specific Reference to Uttarakhand. Int. J. Adv. Manag. Econ. 2020, 9, 2278–3369. [Google Scholar] [CrossRef]
  40. Antony, J.; McDermott, O.; Sony, M. Revisiting Ishikawa’s Original Seven Basic Tools of Quality Control: A Global Study and Some New Insights. IEEE Trans. Eng. Manag. 2021, 68, 1–16. [Google Scholar] [CrossRef]
  41. Ali, K.; Johl, S.K. Critical Success Factors of Total Quality Management Practices Using Pareto Analysis. Int. J. Product. Qual. Manag. 2022, 36, 353–381. [Google Scholar] [CrossRef]
  42. Fotopoulos, C.; Kafetzopoulos, D.; Gotzamani, K. Critical Factors for Effective Implementation of the HACCP System: A Pareto Analysis. Br. Food J. 2011, 113, 578–597. [Google Scholar] [CrossRef]
  43. Ransikarbum, K.; Pitakaso, R.; Kim, N. A decision-support model for additive manufacturing scheduling using an integrative analytic hierarchy process and multi-objective optimization. Appl. Sci. 2020, 10, 5159. [Google Scholar] [CrossRef]
  44. Ransikarbum, K.; Pitakaso, R.; Kim, N.; Ma, J. Multicriteria decision analysis framework for part orientation analysis in additive manufacturing. J. Comput. Des. Eng. 2021, 8, 1141–1157. [Google Scholar] [CrossRef]
  45. Hu, M.; Gao, Y.; Zhao, X.; Tian, B.; Xu, Z. Constraint-Following Approach for Platoon Control Strategy of Connected Autonomous Vehicles. J. Adv. Transp. 2022, 2022, 8623410. [Google Scholar] [CrossRef]
  46. Morris, A.P.; Haworth, N.; Filtness, A.; Nguatem, D.-P.A.; Brown, L.; Rakotonirainy, A.; Glaser, S. Autonomous Vehicles and Vulnerable Road-Users—Important Considerations and Requirements Based on Crash Data from Two Countries. Behav. Sci. 2021, 11, 101. [Google Scholar] [CrossRef]
  47. Min, H.; Fang, Y.; Wang, R.; Li, X.; Xu, Z.; Zhao, X. A Novel On-Ramp Merging Strategy for Connected and Automated Vehicles Based on Game Theory. J. Adv. Transp. 2020, 2020, 2529856. [Google Scholar] [CrossRef]
  48. Karuppusami, G.; Gandhinathan, R. Pareto Analysis of Critical Success Factors of Total Quality Management: A Literature Review and Analysis. TQM Mag. 2006, 18, 372–385. [Google Scholar] [CrossRef]
Figure 1. Demand matching of typical and extreme scenarios of IVIS.
Electronics 11 03830 g001
Figure 2. Flow chart of the steps in this paper.
Electronics 11 03830 g002
Figure 3. The upper part of the closed IVIS valuation index framework.
Electronics 11 03830 g003
Figure 4. The indicator set of the IVIS.
Electronics 11 03830 g004
Figure 5. The highway construction area.
Electronics 11 03830 g005
Figure 6. The on-ramp merging area.
Electronics 11 03830 g006
Figure 7. Evaluation index framework of the highway construction area stress test of IVIS under closed conditions.
Electronics 11 03830 g007
Figure 8. Evaluation index framework for the strength test in the highway merging area of IVIS under closed conditions.
Electronics 11 03830 g008
Figure 9. Construction area ABC indicator analysis chart.
Electronics 11 03830 g009
Figure 10. Merging area ABC indicator analysis chart.
Electronics 11 03830 g010
Table 1. Review of current IVIS evaluation studies.
Current IVIS Evaluation Studies
Traffic OperationCAVs Working Conditions
Efficiency EvaluationsSafety EvaluationsVehicle Components or Functions
Travel time [1]Speed [16]brake pedal evaluation [6,7]
Driver behavior and
market penetration [13]
TTC [17,18]crash testing [8,21]
Vulnerability [14]economic and environmental
efficiency evaluations [19,20]
communication delay [22,23]
Speed [15] communication safety [24]
the overall CAV performance [25]
Table 2. Judgment matrix scale and meaning.
Level of ImportanceDefinition (Element i with Respect to Element j)
1Equally important
3Slightly more important
5Significantly more important
7Strongly more important
9Extremely more important
CountdownInverse value of element i over element j
Table 3. B1 judgment matrix and weights in the construction area.
Criteria LayerSubcriteria LayerIndicator LayerD1D2D3D4D5D6Indicator Weight on the Subcriteria LayerSubcriteria Weight on the Criterion LayerCriteria Weight on the Target Layer
B1C1D1111/31/5 0.1020.50.406
D2111/31/3 0.116
D33311/3 0.264
D45331 0.519
C2D2 11/31/331/30.0560.5
D3 311/3510.286
D4 331310.107
D5 1/31/51/311/50.229
D6 311510.321
Table 4. B1 hierarchical weight results in the construction area.
IndicatorsSubcriteria Weight on the Criterion LayerThe Indicator Total Weight on the Criterion Layer
C1C2
0.5000.500
Construction area traffic volume D10.102 0.051
Construction area single-vehicle speed D20.1160.1070.111
Construction area number of conflict points D30.2640.2290.247
Construction area safety measures D40.5190.3210.420
Driver’s driving age D5 0.0560.028
Driver’s mental state D6 0.2860.143
Table 5. Total hierarchical weight results of indicators in the target layer in the construction area.
IndicatorsB1B2B3B4Total Weight of IndicatorsSort
0.4060.3570.0800.157
Construction area traffic volume D10.051 0.02111
Construction area single-vehicle speed D20.1110.112 0.0853
Construction area number of conflict points D30.2470.072 0.1262
Construction area safety measures D40.4200.1390.750 0.2801
Driver’s driving age D50.028 0.01116
Driver’s mental state D60.143 0.0587
OBU communication time delay D7 0.139 0.0508
Construction area average single-vehicle travel time D8 0.037 0.01315
Construction area total average queue length D9 0.042 0.01513
Construction area total average travel time D10 0.064 0.02310
Construction area average saturation D11 0.042 0.01514
Construction area total average speed D12 0.138 0.0499
V2V communication delay D13 0.214 0.0764
Construction area equipment sensing and identification delay D14 0.125 0.01017
Construction area RSU communication delay D15 0.125 0.01018
Central cloud network communication security protection D16 0.3750.0596
Central cloud network communication delay D17 0.1250.02012
Central cloud data security protection D18 0.5000.0635
Table 6. Total hierarchical weight results of indicators in the target layer in the merging area.
IndicatorsB1B2B3B4Total Weight of IndicatorsSort
0.3710.3710.0940.163
Merging area single-vehicle speed D20.4290.073 0.1861
Driver’s driving age D50.143 0.0536
Driver’s mental state D60.429 0.1592
OBU communication time delay D7 0.051 0.01914
Merging area average single-vehicle travel time D8 0.027 0.01021
Merging area total average queue length D9 0.037 0.01418
Merging area total average travel time D10 0.048 0.01815
Merging area average saturation D11 0.037 0.01419
Merging area total average speed D12 0.121 0.0458
V2V communication delay D13 0.084 0.03112
Merging area equipment sensing and identification delay D14 0.081 0.00822
Merging area RSU communication delay D15 0.047 0.00423
Central cloud network communication security protection D16 0.3750.0615
Central cloud network communication delay D17 0.1250.02013
Central cloud data security protection D18 0.5000.0813
Weather recognition accuracy of OBU D19 0.106 0.0399
Road condition recognition accuracy of OBU D20 0.106 0.03910
Forward obstacle recognition accuracy D21 0.138 0.0517
Lane change recognition accuracy in front D22 0.172 0.0644
Communication delay of RSU by electromagnetic interference D23 0.186 0.01716
Communication delay of RSU by natural disasters D24 0.186 0.01717
Road obstacle warning D25 0.375 0.03511
Road condition recognition accuracy of RSU D26 0.125 0.01220
Publisher’s Note: MDPI stays neutral with regard to jurisdictional claims in published maps and institutional affiliations.

