1. Introduction
In recent years, illegal acts such as drug trafficking, smuggling, border crossing and smuggling have been prohibited in border areas, and the workload of border patrol tasks has only increased. Considering the problem of limited patrol force, the relevant management departments have equipped border patrol staffing with drones or handheld portable reconnaissance equipment [
1], which has greatly improved the management capability of the border, while reducing the risk of border patrol and solving many of the existing problems of traditional border patrol [
2]. However, the use of UAV (Unmanned Aerial Vehicle) platforms and portable reconnaissance equipment for border patrol missions has also raised some issues that need to be further addressed, the most important of which is the ability of the patrol reconnaissance equipment to detect border patrol objects. Most of the existing UAV and reconnaissance equipment are equipped with high-definition optical cameras, which can acquire objects at different distances, but at the same time will generate a large amount of image video data. However, the computing power of edge devices is generally insufficient, so it is important to develop a border patrol detection model that can be easily deployed on edge devices such as UAV platforms and handheld portable reconnaissance terminals. The traditional method of border patrol reconnaissance is mainly through close reconnaissance, or the use of long-range photographic equipment to capture images and video data of suspicious areas, and then use the communication transmission equipment carried to transmit the data to the rear for analysis and judgment. However, subject to technical problems, the detection field of view is limited, inefficient and ineffective, which is a very prominent problem. With the continuous development of computer technology, faster, more accurate, more efficient object detection technology has emerged.
In recent years, deep learning has been greatly developed. Whether deep learning can be used in the field of object detection is also being studied by scholars. An important turning point in the field of object detection occurred when AlexNet [
3] was proposed. As a result, the scope of object detection application research has been expanded. Thus far, deep learning has been widely used in various fields of computer vision, which has important research significance and application value in national security, military [
4], transportation [
5], medical [
6] and life.
After the emergence of Alex Net, Ross B Girshick et al. [
7] proposed R-CNN in 2014, and then the R-CNN algorithm underwent the evolution of Fast R-CNN and Faster R-CNN. Compared to the traditional detection algorithm, the performance has been greatly improved. Since then, more and more detection algorithms based on convolutional neural networks have been proposed, such as MSCNN [
8], M2Det [
9], EfficientNet [
10], etc., and the accuracy and detection speed are constantly improving.
According to different network design paradigms, we classify existing object detection algorithms into one-stage detection algorithms and two-stage detection algorithms. The above detection algorithm is a two-stage detection algorithm, which has a high detection accuracy, but a slow detection speed, and is not applicable to the problem of border patrol object detection proposed in this paper. In order to solve this problem, this paper uses the representative one-stage detection algorithm YOLOv5 [
11] as the baseline model, which is the representative one-stage detection algorithm of the YOLO series. Compared to the YOLOv1-4 [
12,
13,
14,
15] detection algorithm and the two-stage detection algorithm, the most prominent features of the YOLOv5 detection algorithm are its fast detection speed and high detection accuracy, which can meet the requirements of real-time.
In this study, a border patrol object detection algorithm, TP-ODA, was designed for the carriage of UAV platforms or portable border patrol reconnaissance equipment. As the most widely used detection algorithm of the current YOLO series, the YOLOv5 detection algorithm has made a good balance between detection accuracy and detection speed, but there are still many redundant parameters in its network, which need to be further improved. We therefore propose a lightweight and less resource intensive border patrol object detection algorithm. First, the Ghost structure is improved based on the lightweight attention module and is combined with the benchmark network to rebuild the feature extraction network. Then, the bounding box loss function of the benchmark algorithm was modified to solve the problem of sample detection box imbalance. Finally, a depth-separable convolution was introduced, and the neck network was reconstructed, while the feature fusion module PDOEM (Patrol Duty Object Detection Efficient Modules) was designed to optimize the feature fusion structure of the algorithm. The experiments were conducted on our self-built border patrol task dataset BDP (Border Defense Patrol), which was prepared for this study. The results show that the TP-ODA (Typical Border Patrol-Object Detection Algorithm) network reduces many parameters and reduces the size, which is very suitable for border patrol object detection tasks. Compared to previous studies, the main contributions of this paper are as follows.
1. In order to improve the feature extraction capability of the network for different dimensions and improve the performance degradation of the model after compression, we proposed a lightweight feature extraction structure BP-Sim, which takes into account the functions of the original feature extraction structure and reduces the occupation of computing resources. Aiming at the unbalance problem of the sample detection frame of the benchmark model, the EIOU loss function is introduced to further improve the detection accuracy of the model.
2. In order to further compress the volume of the model and reduce the resource occupation, we designed the feature fusion module PDOEM to improve the fusion ability of the model to the deep feature information. Combined with the depth-separable convolution, the neck feature fusion network of the model was reconstructed.
3. To address the problem of the confidentiality of the information involved in the border patrol domain and the existing public datasets that cannot be well used for border patrol detection tasks, the border patrol task dataset BDP is constructed to train and evaluate the performance of the object detection model.
The rest of this paper is structured as follows.
Section 2 describes some of the most important related works.
Section 3 describes the proposed the object detection network.
Section 4 describes the experimental preparation. The experimental results and analysis are described in
Section 5. Finally, a summary and outlook are given in
Section 6.
2. Related Work
At present, series detection algorithms are widely used, and many scholars have undertaken a lot of research work in common detection fields. In medicine, the detection algorithm is used to detect breast tumors [
16] and to fight against COVID-19 [
17,
18]. In the field of agriculture, it is used to detect plant diseases [
19] and pests and for crop production [
20]. In industrial applications, it is used to detect defects on the surface of steel strips [
21]. In the transportation field, it is used to solve road congestion [
22] and road failure problems [
23].
Many scholars have also done a lot of research in the field of military object detection [
24,
25]. As our border patrol object detection task is not only a military object detection task, with the complexity of security maintenance, border patrol, reconnaissance and duty operation tasks, the border patrol object detection algorithm is required to have a certain generalization detection performance, but also the ability to detect military objects. Guangdi Zheng et al. [
26] used the YOLOv3 algorithm for the detection of low-resolution infrared objects present on the terrestrial battlefield and trained the model with the aid of visible samples. Hui Peng et al. [
4] used the YOLO detection algorithm to detect five common military weapons in order to obtain a fuller sense of the battlefield situation. Xingkui Zhu et al. [
27] proposed TPH-YOLOv5 based on the YOLOv5x network, combining the transformer and CBAM, and used a larger network to detect small objects in UAV aerial photography. M. Krišto et al. [
28] used the YOLOv3 detection model to detect abnormal behaviors in border areas and found the case of sneaking around objects and illegal border crossings in a timely manner.
From the above study, it can be concluded that the YOLO series detection algorithm generalizes well and the detectability can basically meet the needs of various fields. However, based on our research, we believe that the existing detection algorithms for detecting border patrol objects still need to address two aspects:
1. Most studies have improved the detection accuracy of military-type objects in complex environments and UAV aerial images, but the model resource consumption has increased accordingly, which poses a serious limitation for embedded devices with limited computing power.
2. Border patrol object detection differs from traditional image detection in that the data obtained during border patrol has obvious peculiarities because of the various forms of data collection. The first is that the border patrol objects have strong regional restrictions and can only be collected in special areas, and the second is that most of the border patrol objects are in the state of obscuration and camouflage, so the quality of the collected images is not high, so for the object detection model, objects with a camouflage nature and tiny objects in aerial images are difficult to detect.
In order to apply large neural network models to UAV platforms and portable reconnaissance equipment, we have conducted an in-depth study of network model parameter reduction. Lightweight detection networks have gained more attention because they can reduce the resource footprint of the model and speed up detection by reducing a small amount of detection accuracy. The core idea of the detection algorithm compression is to reduce the computational complexity and spatial complexity of the model by modifying the way the network is constructed while ensuring the model accuracy as much as possible, so that the neural network detection algorithm can be deployed in UAVs with limited computational performance, embedded edge devices such as portable reconnaissance devices, thus establishing a link from academic research to practical applications.
Currently, there are two main types of model volume optimizations. One type is compression of the model, using methods such as knowledge distillation and model de-branching to reduce the number of parameters and unnecessary computational consumption of the model, which has a limited scope for model compression and a large impact on accuracy. We therefore chose another type of light-weighting method for optimization. This class of optimization method mainly introduces the idea of lightweight networks in the structure of benchmark models, such as SqueezeNet [
29], MobileNet series [
30,
31], ShuffleNet series [
32,
33], Xception [
34], etc. By using different convolution methods and structures, the models are made lighter. Currently, it is common to use lightweight networks to optimize benchmark models for object detection tasks in common scenarios. A common approach is to use lightweight backbone networks in large detection models, such as Youchen Fan et al. [
35] used YOLOv3 and improved with GhostNet to have good detection results when detecting infrared images of vehicles. Minghua Zhang et al. [
36] proposed light-weighting using MobileNetV2 and depth-separable convolution for detecting underwater objects; J. Feng et al. [
37] used MobileNet as the backbone network to modify the original model for detecting rail defects. Tianhao Wu et al. [
38] adapted the network structure of YOLOv5 and designed the YOLOv5-Ghost algorithm for use on a CARLA vehicle and a distance detection system in a virtual environment. The aforementioned study significantly reduced the model resource consumption, but the detection accuracy was not high.
While research work on lightweight networks has great application, there has been little research in the area of border patrol object detection. In response to the current situation, we have designed a border patrol object detection model that is less resource intensive and more efficient in detection.
3. Method
The basic framework of the YOLOv5 detection model mainly includes Input, Backbone, Neck, Prediction and four other parts. Input part: Mainly adjust the image to 640
640 ratio, and zoom, enhance and other processing. The Backbone module uses the Darknet-53 network to facilitate the training of the model and the extraction of multiple scale features. The Neck module draws on the function of fusing multi-scale feature information completed by FPN [
39] and PANet [
40]. This part can fuse the feature information of different depths so as to reduce the loss of semantic information due to feature extraction, so that the model training can obtain more training information, which is conducive to the improvement in algorithm performance. The Prediction part is composed of three detection heads, which are used to predict the feature map and to obtain the position and category of the detected object in the image.
3.1. The Improved Network Structure
In order to make the model less resource intensive, we compared various lightweight networks and finally chose GhostNet to optimize the backbone network. In order to improve the feature representation of the detected object, we embed the lightweight attention mechanism module SimAM into the GhostNet network and design the BP-Sim (Border Patrol-SimAM module) structure to optimize the feature extraction network, which further reduces the parameters of the model while improving the accuracy. In addition, in order to improve the feature fusion performance of the model, the PDOEM feature fusion module is designed and combined with depth separable convolution to reconstruct the feature fusion structure, and finally, the EIOU loss function is introduced to optimize the design for the problem that the loss function in the original benchmark model has the problem of sample detection box imbalance leading to the decrease in detection accuracy and the slowdown of the model convergence.
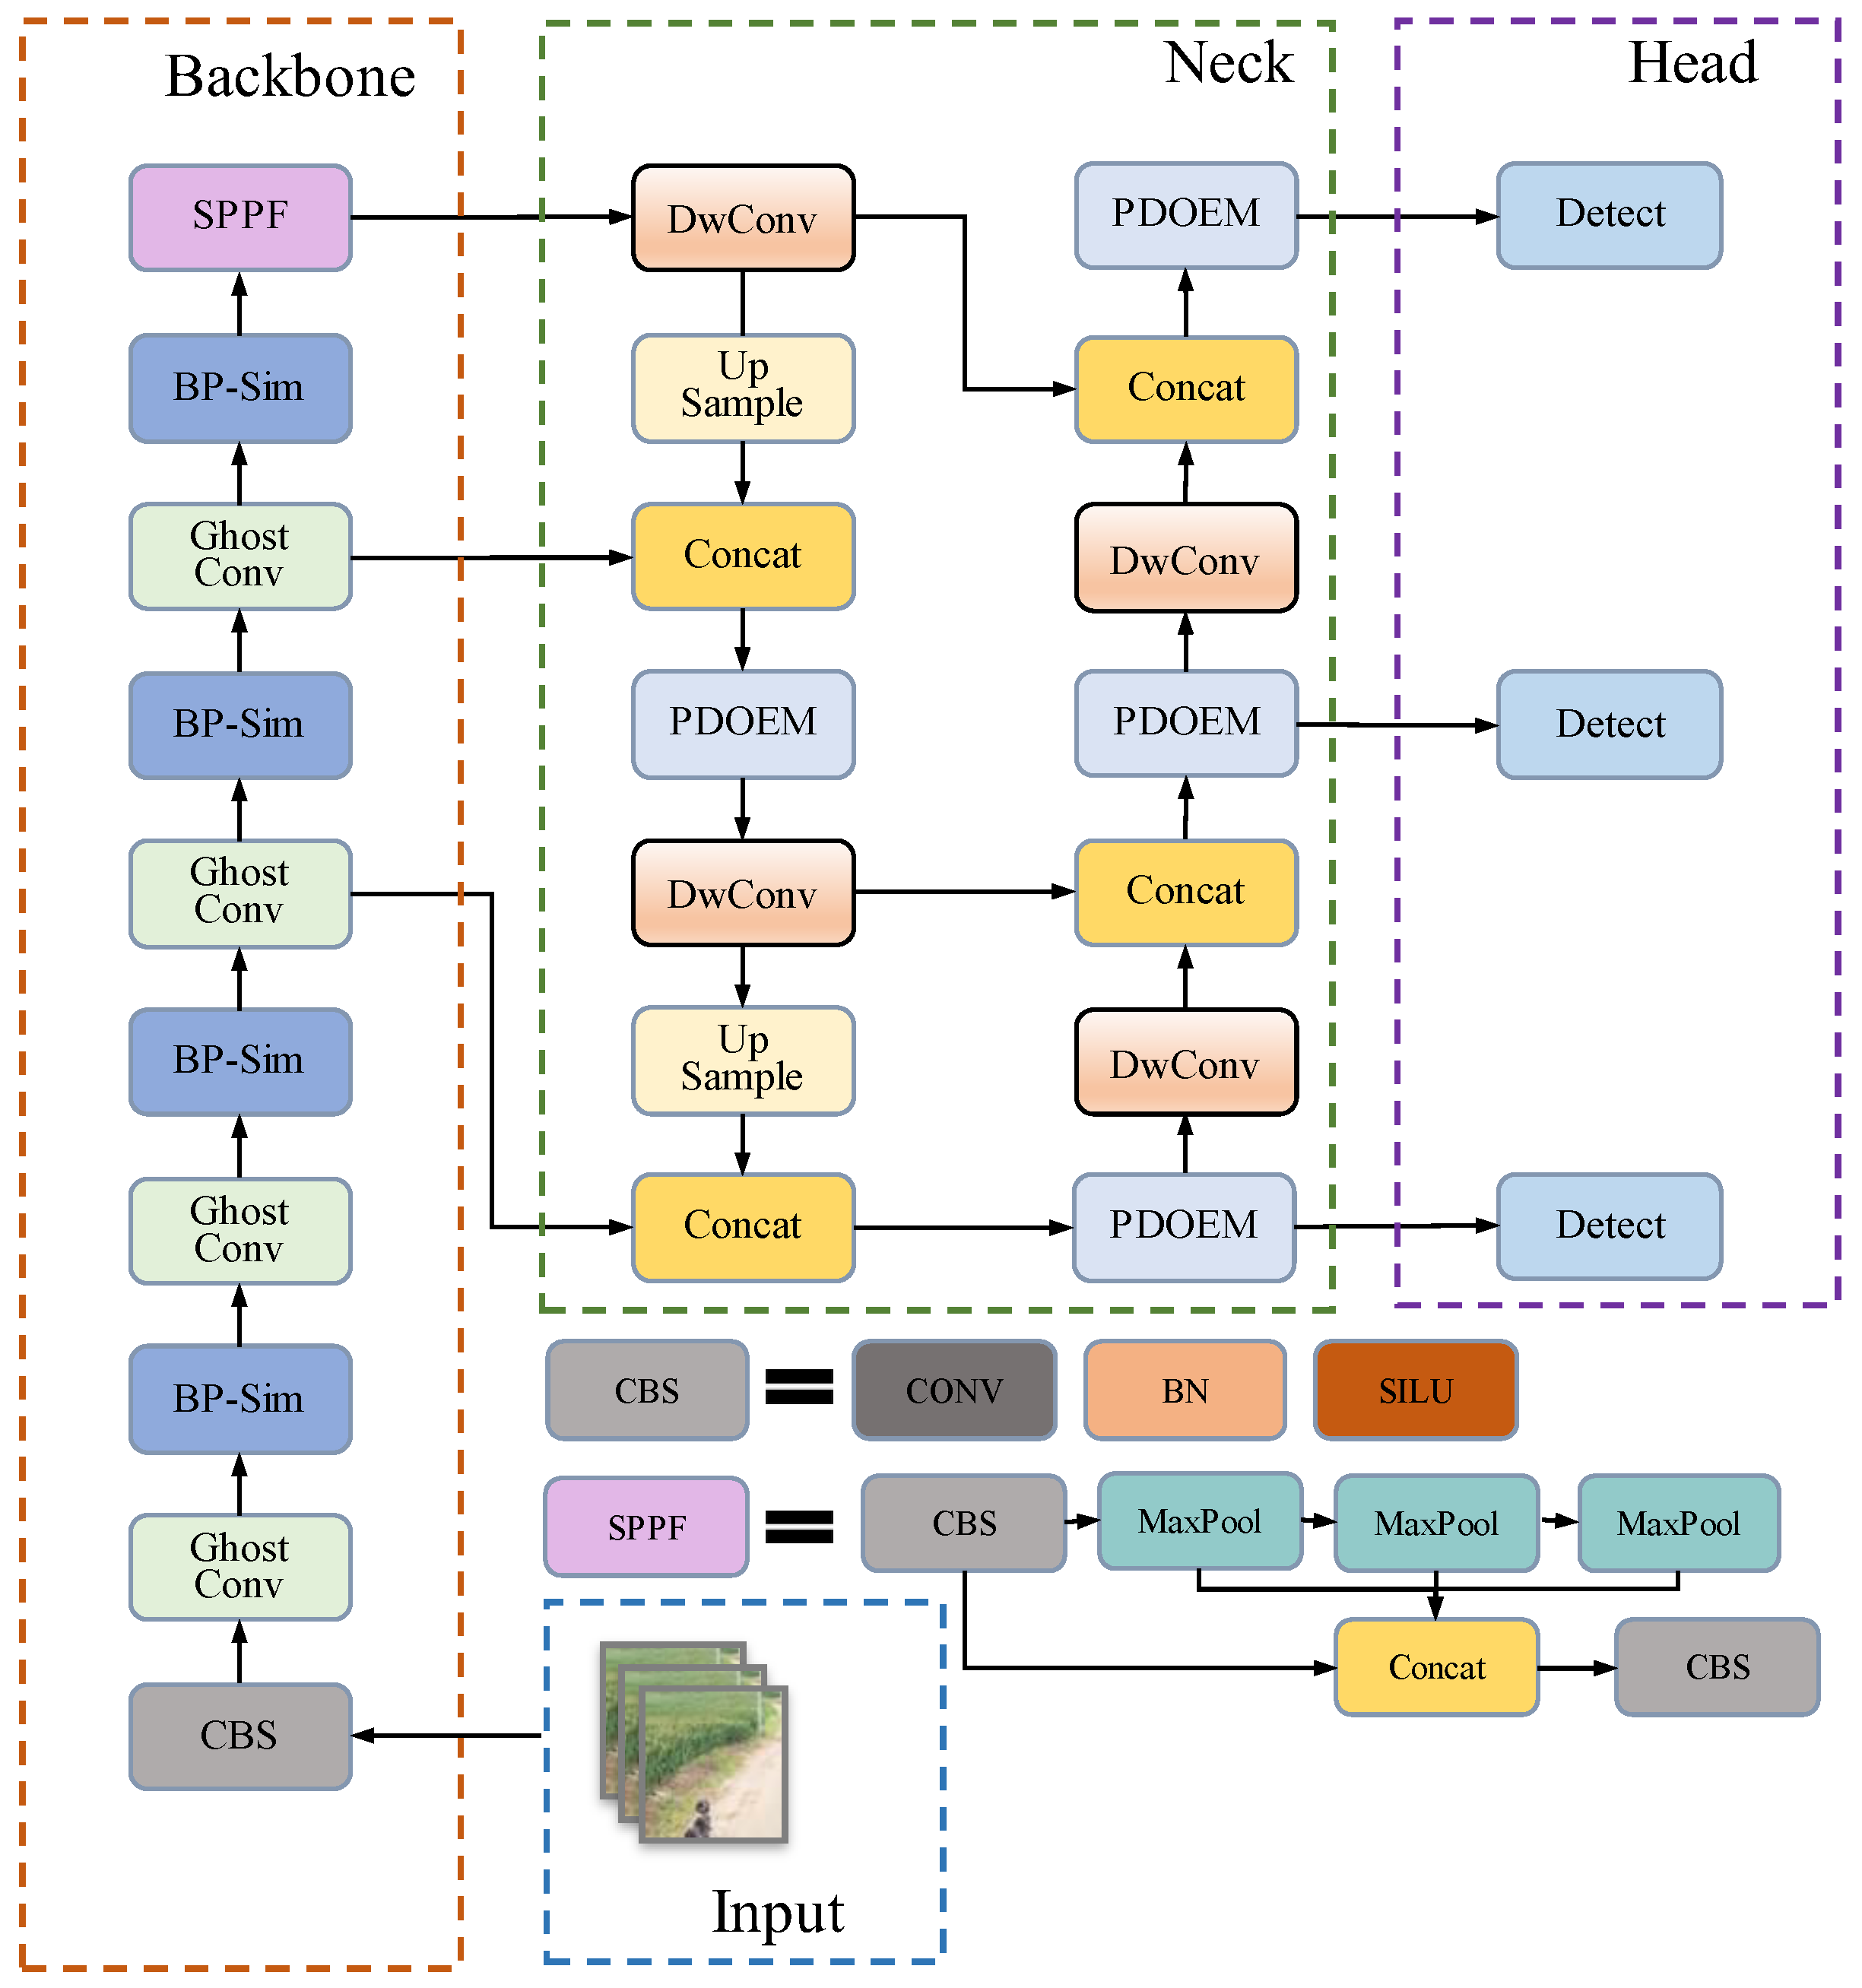
In
Figure 1, the images are input into the backbone network, and feature extraction and slicing are first performed using ordinary convolution, and then the processed images are input into GhostConv and BP-Sim structures, and the feature images after the above operations are divided into multiple levels and passed to the Neck for concat operation. In the Neck structure, the feature information is extracted using depth-separable convolution, then the feature map is resized after upsampling and connected with the feature information of the backbone part, and finally the feature map obtained from the concat operation is input to the PDOEM module for information mining.
3.2. Lightweight Network Design Module
Border patrol missions using UAVs or portable reconnaissance devices require not only the accurate detection of suspicious objects in the border area, but also requires minimizing the resource consumption of the network to meet the edge device load requirements. Next, we optimize the design of the backbone part of the benchmark network.
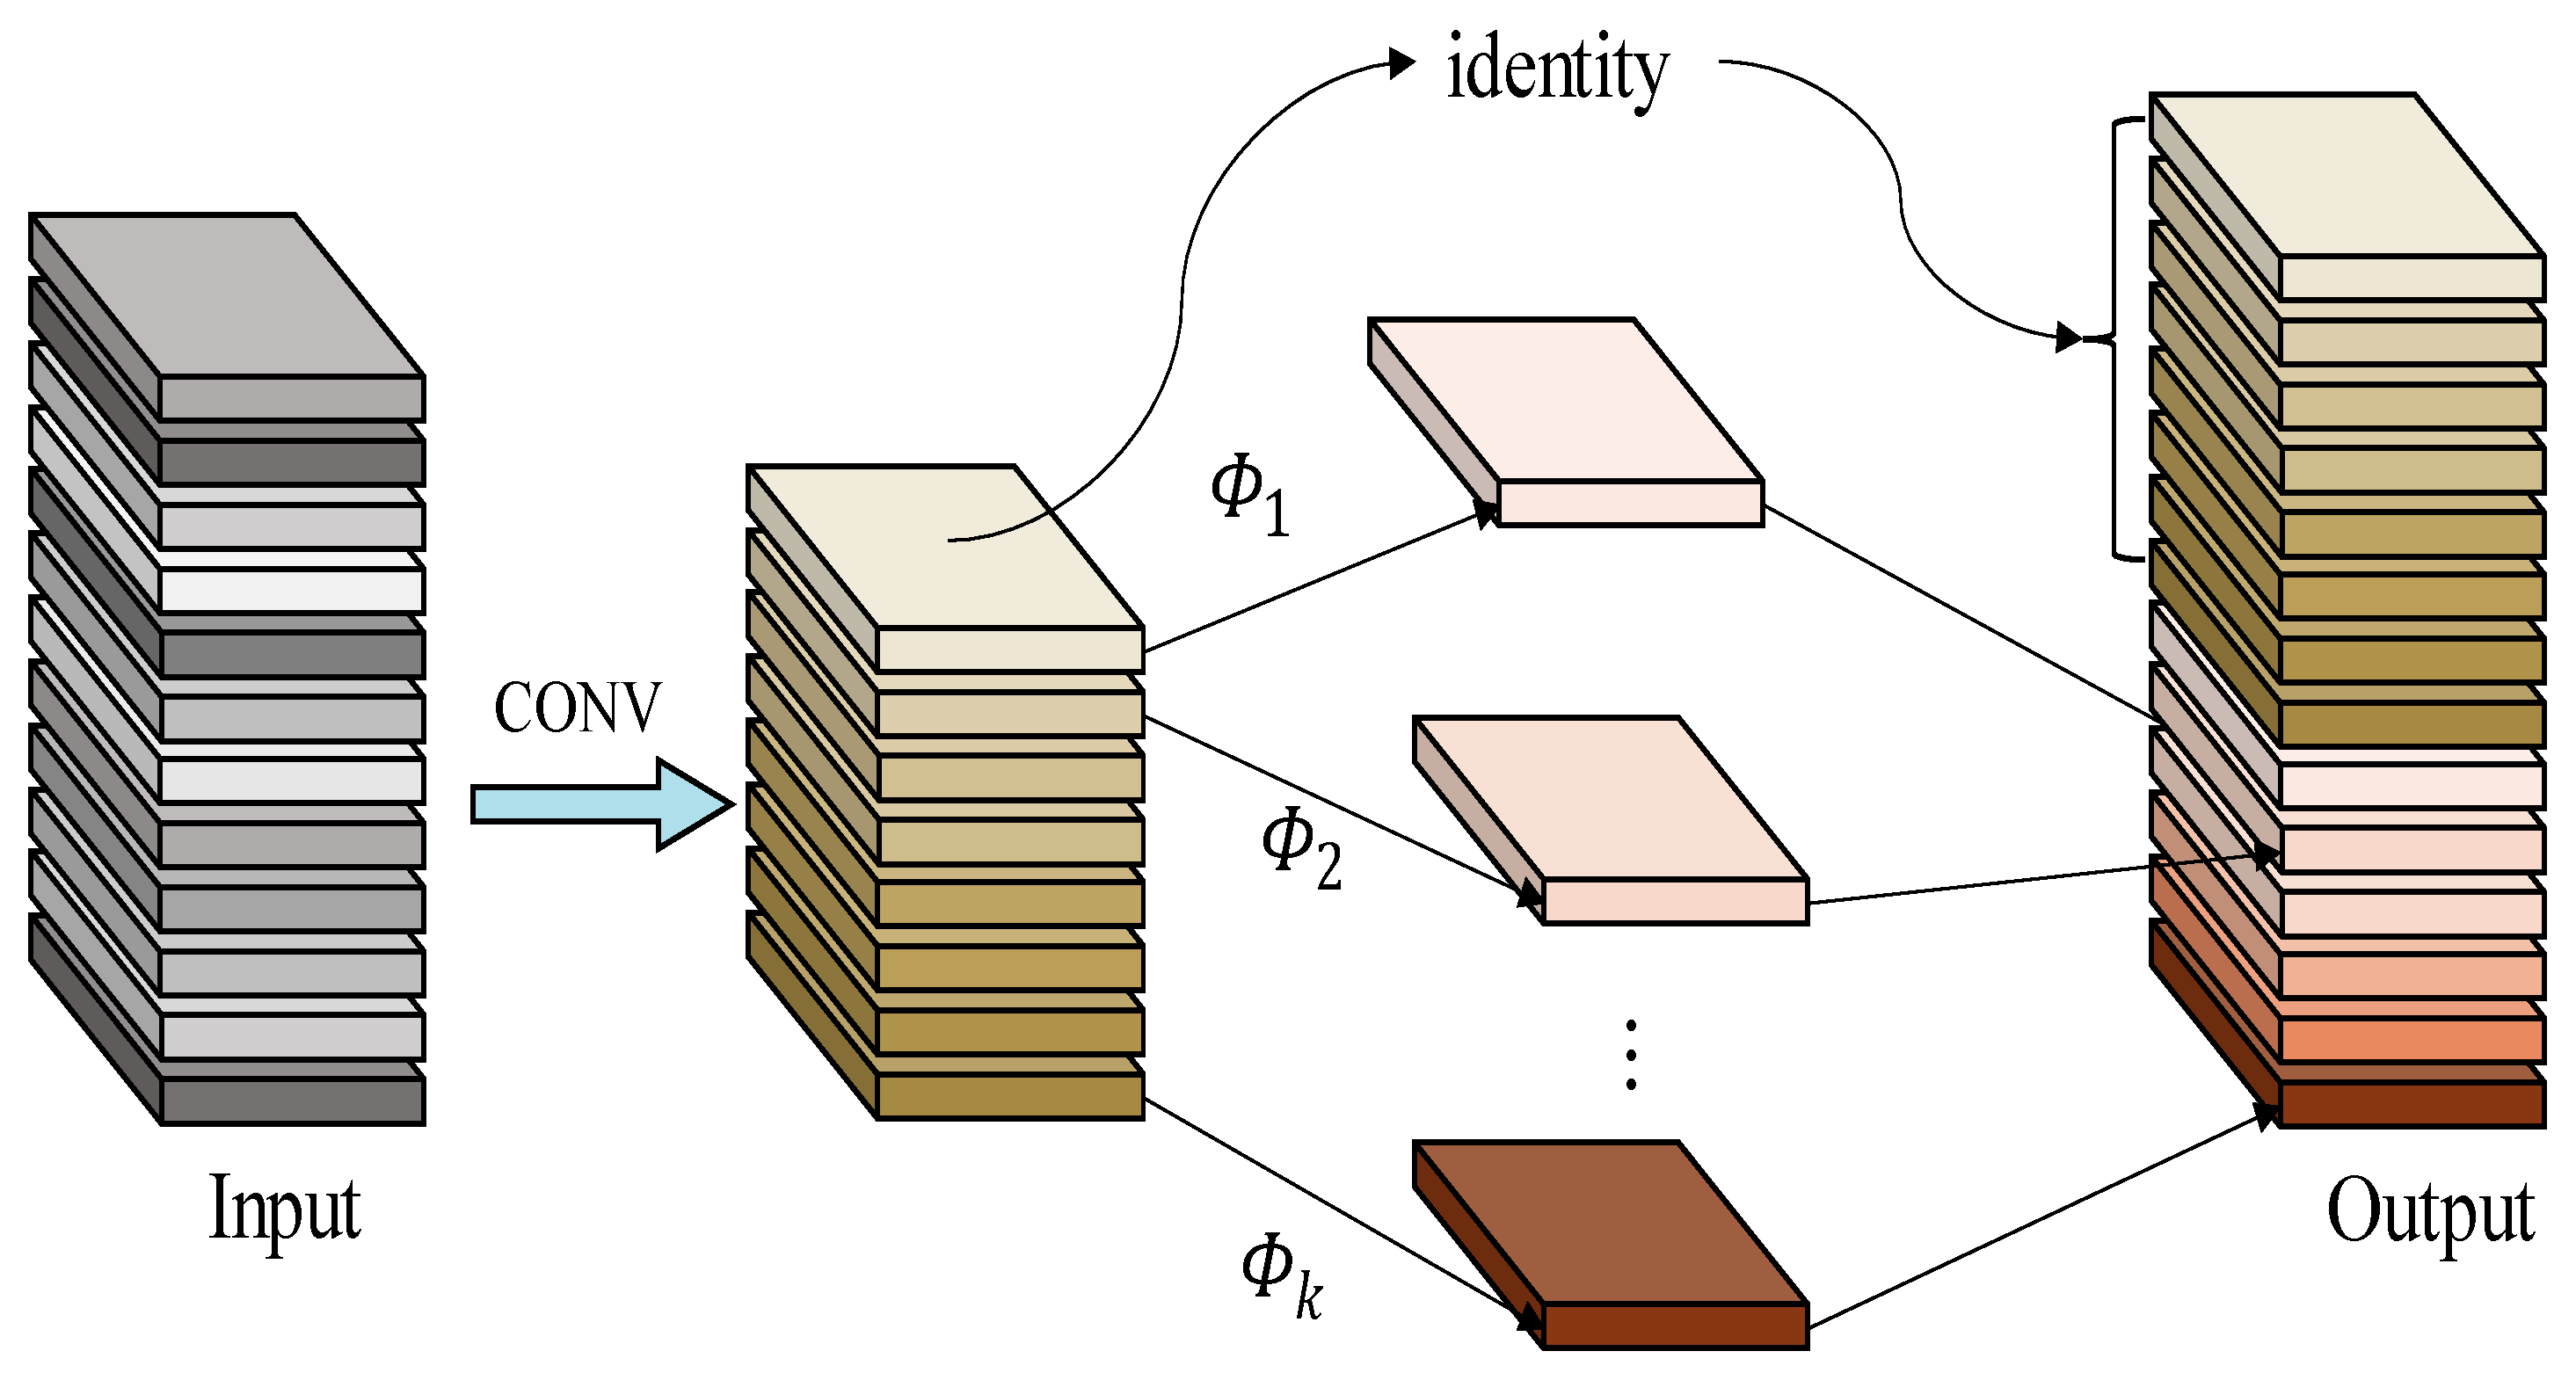
The common convolution operation is to apply the convolution kernel to the local image, slide the high latitude and low latitude in the local image, then form the correspondence in space and complete the convolution, and obtain the convolution kernel after many repetitions. The above operation enables the model to achieve better accuracy through multiple training, but it also requires many convolution operations, which has an enormous consumption of computational resources. Due to this problem, some lightweight networks remove some redundant features by removing some of the redundant feature information while reducing the model performance to achieve the effect of streamlining the model. However, some scholars’ research proves that the redundant feature information also exists in the redundant features contributing to the model’s comprehensive understanding of image data, which becomes an important part of the model performance improvement. As shown in
Figure 2, it is with this in mind that, instead of trying to eliminate redundant feature maps, GhostNet uses cheaper computation to obtain redundant feature maps. According to our previous research on the lightweight network, it is concluded that GhostNet [
41,
42] is more prominent in terms of comprehensive performance. Therefore, we will carry out further optimization of the detection model’s resource footprint in conjunction with GhostNet.
The backbone of the benchmark network uses many traditional convolutional neural networks, which are mainly used to extract image features. These networks contain a large number of parameters that occupy a large amount of computational resources and memory. Therefore, influenced by GhostNet idea, we use the Ghost convolutional network to replace part of traditional convolutional networks in the backbone network.
3.3. Feature Information Extraction Module
In the actual border patrol environment, which contains multiple types of environments such as desert, snow, jungle, and grass, the use of UAV platforms or other reconnaissance equipment for detection can lead to low image quality, blurred object backgrounds, and loss of feature information due to the harsh natural environment. The presence of these factors greatly increases the detection difficulty of the network. Studies in recent years have concluded that the use of attention mechanism modules can enhance the network’s ability to extract image feature information. Therefore, to improve the model’s ability to extract effective feature information and not to increase the model’s excessive number of parameters and computational effort, we designed the BP-Sim and PDOEM modules in the network.
The improvement steps for the backbone network are: Considering that the backbone network is not sufficient for processing image information with different dimensions of feature semantic information, especially in the case of border patrol image data, which are mostly blurred images, top view captured images and diverse scales. We first optimized the feature extraction structure. Considering that the direct use of the lightweight network in the optimization process of the benchmark network would lead to a reduction in the detection accuracy of the model, and that the original bottleneck connection network contained a large number of parameters, we redesigned the bottleneck structure of the model by modifying the bottleneck network on the basis of the original C3 structure, removing part of the regular convolutional network from this structure and the BP-Sim network is obtained by replacing the regular convolutional module with a lighter convolutional module and embedding the SimAM [
43,
44] attention mechanism. The network exploits the sensitivity of the attention mechanism with useful information to improve the network’s ability to mine feature information. The BP-Sim bottleneck structure feature extraction structure is shown in
Figure 3.
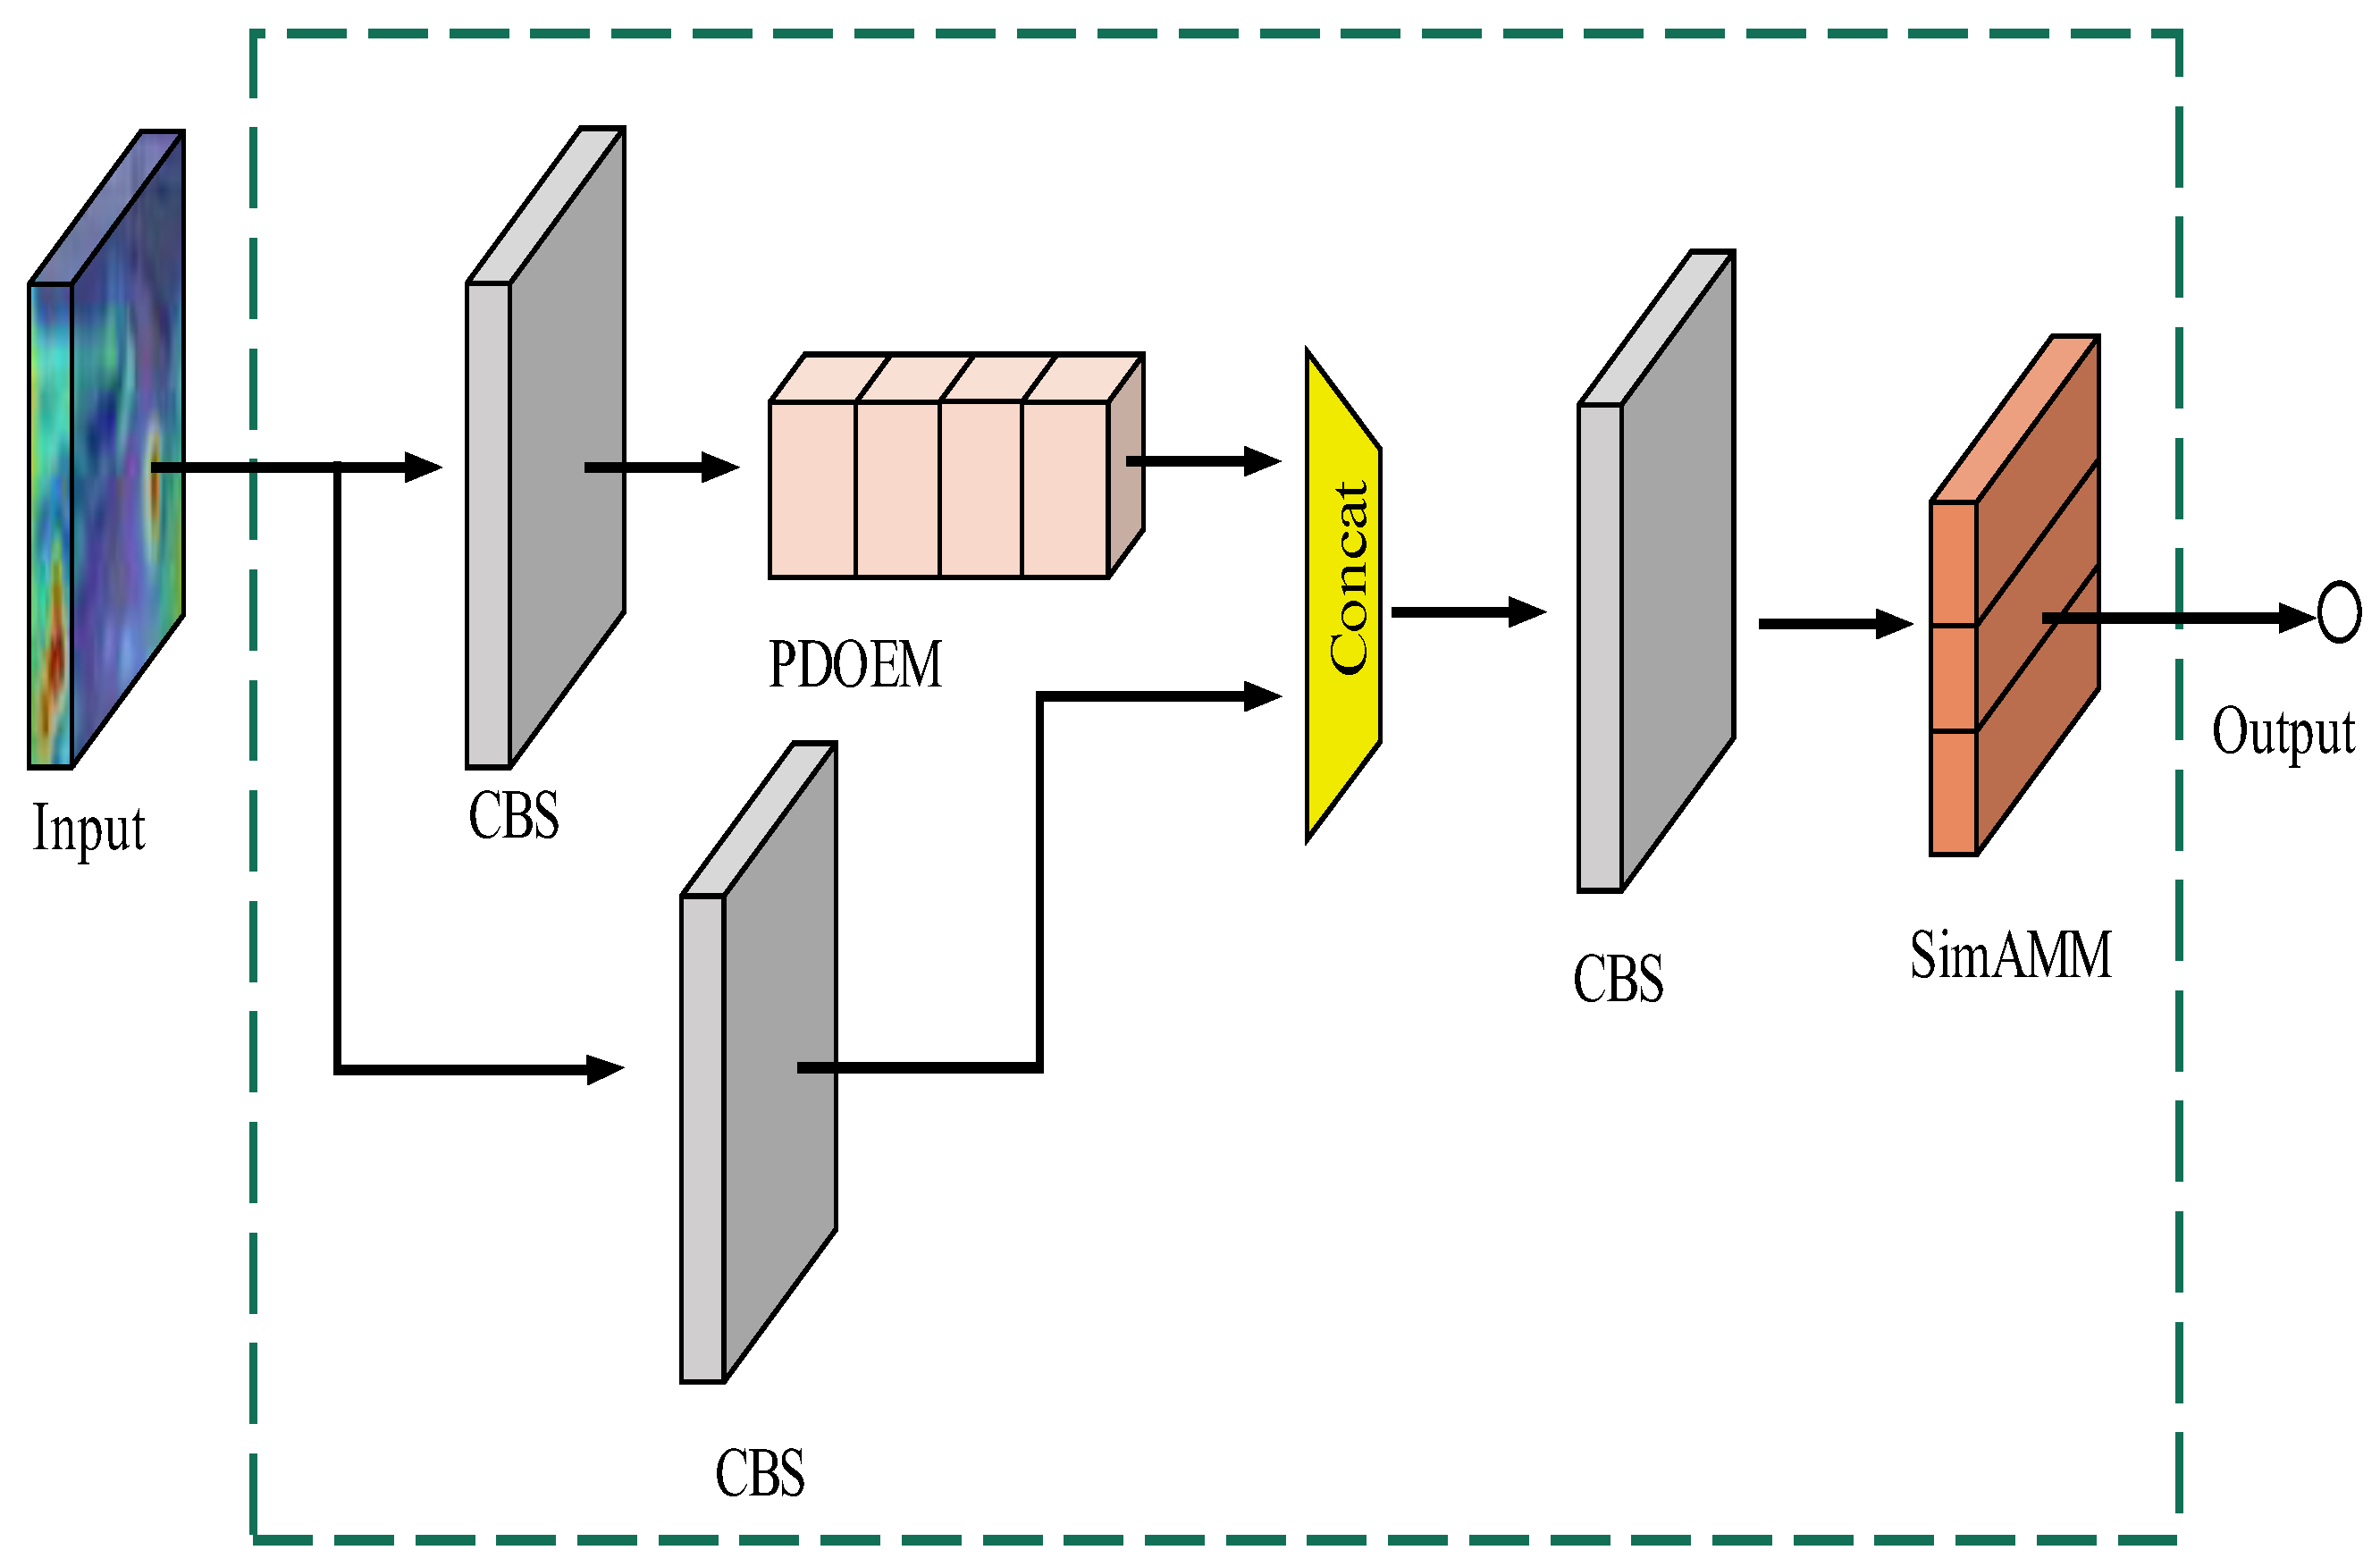
In
Figure 3, the feature image first goes through traditional convolution to obtain one input edge of concat operation; in the other input, the feature map is extracted using traditional convolution, and while going through PDOEM for dimensionality reduction and enhancement, difficult feature information mining is performed with the help of the attention mechanism in this module, and the obtained feature information is connected with another edge of the feature extraction; finally, the connected feature map is extracted and information is mined again.
The existing attention module is commonly used to improve the output results of each layer. This kind of operation usually generates one-dimensional or two-dimensional weights along the channel or spatial dimension and treats the positions in the space or channel equally, which will lead to the limitation of the model’s cue discrimination ability. In order to realize the effect brought by the attention mechanism to the model, SimAM referred to the idea of spatial inhibition in neuroscience and gave higher priority to the neurons with obvious spatial inhibition effects.
where
and
denote the object neuron and the input feature
other neurons in the same channel
, respectively,
is
t and
linear transformation.
and
are linearly varying weights and biases, i is the spatial dimension index,
M is the number of channel neurons, and
and
are two different values. For the convenience of use and operation, the binary label is used for the above, and a regularization term is added to the energy function formula to obtain the final energy function formula. According to the principle that each channel has
M energy functions, the analytical solution Formula (4) is obtained:
Including the
and
is the mean and variance of all neurons except
t. The minimum energy Equation (5) is obtained:
According to Equation (5), the lower the energy, the more different the neuron is from the surrounding neurons. Therefore, the importance of each neuron can be obtained by
. SimAM uses the operation of scaling instead of adding the feature refinement, and the refinement process of the whole module is shown in Equation (6).
3.4. Improvement of Feature Fusion Module
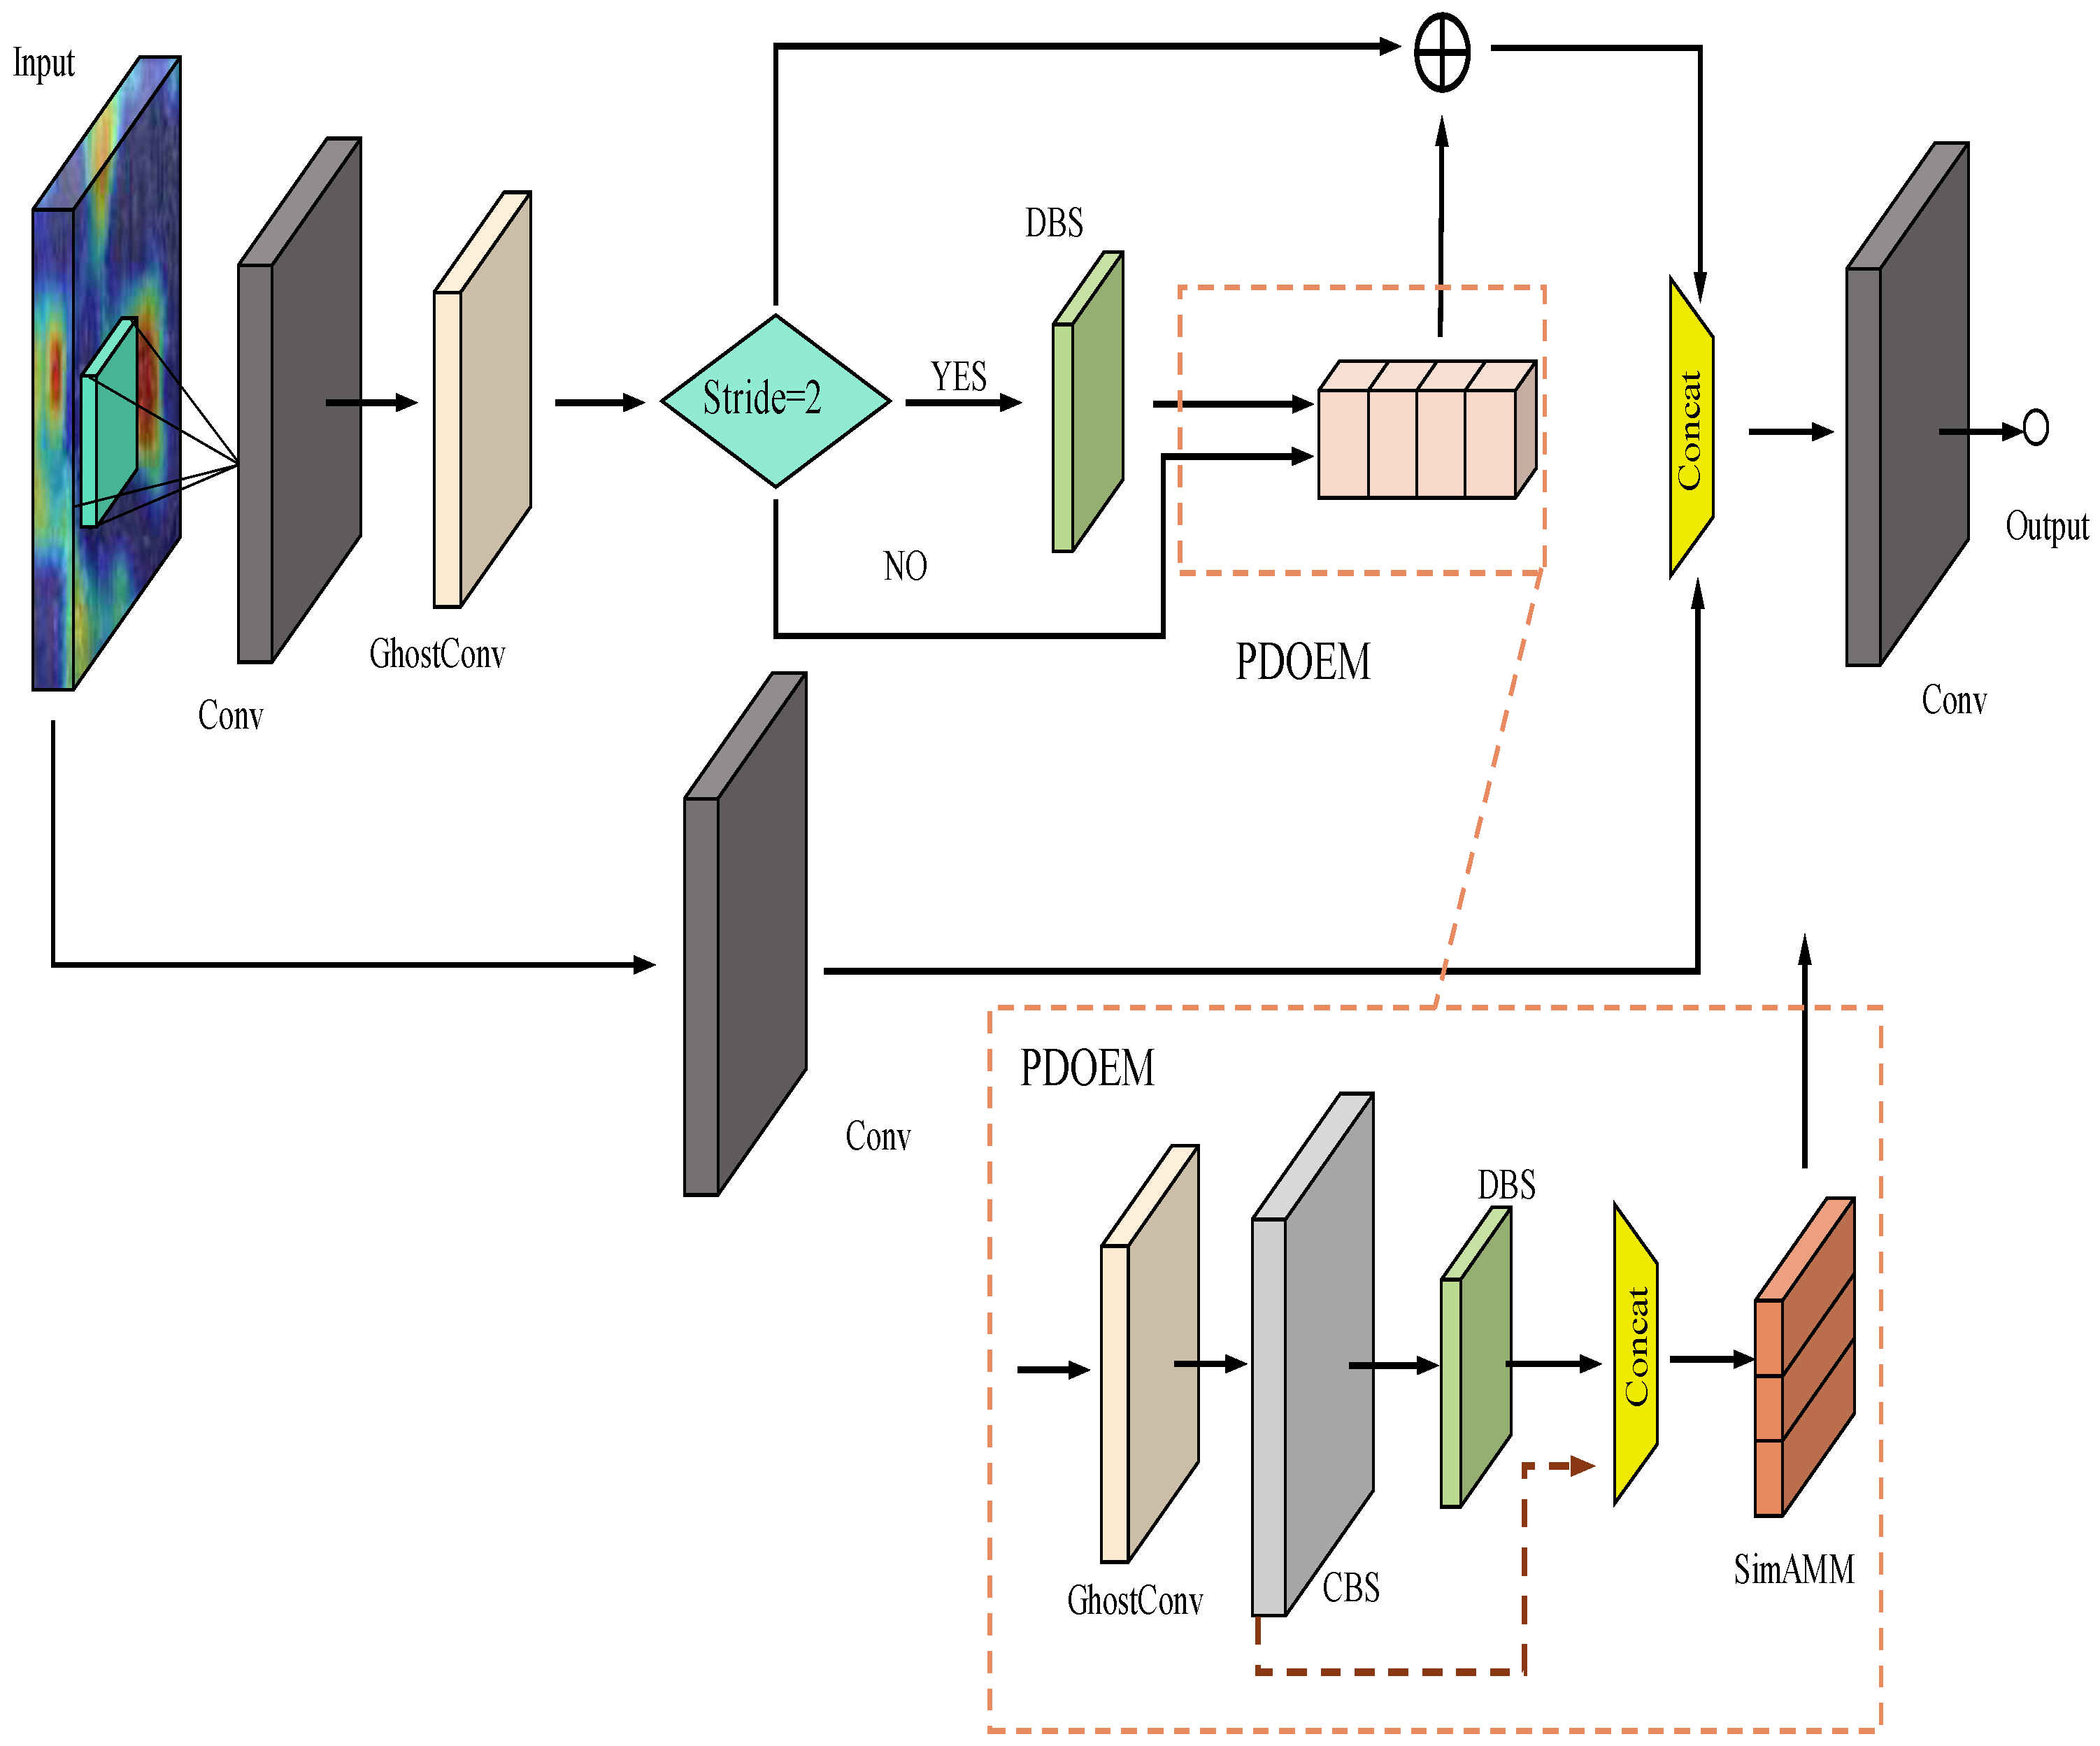
As the baseline network uses more common convolutional modules, and the traditional convolutional modules are large in size and have a large number of parameters. Therefore, we modified the backbone part of the baseline model and replaced the general convolutional module in the backbone with the GhostConv module, which reduces the number of parameters of the model with little reduction in accuracy. Inspired by this idea, we also replaced the basic convolutional module in the neck network with GhostConv, but the training results were not very good. In response to the experimental results, we considered that the model also needs to capture useful feature information and suppress noise information when performing feature fusion, so we kept part of the general convolution in the Neck network and replaced the original convolution module with the depth separable convolution, and connected SimAM after the DBS convolution module, and finally built the PDOEM feature fusion module, as shown in
Figure 4 We use the PDOEM module to replace some of the normal convolutional modules in the Neck part in order to improve the situation of the inadequate extraction of high-level feature information and waste of computational resources when the network is fused with features, and because the addition of the attention module does not use too many computational resources, it is important for the model compression design and overall performance improvement.
3.5. Loss Function Improvement
The loss function in the YOLO family of models is mainly composed of three parts: Bounding Box loss function, object confidence loss function and class loss function. In the YOLOv5 model, CIOU open is used to calculate the loss of the bounding box by default. CIOU is based on DIOU [
45] with the addition of the influence factor
. Where
denotes the weight parameter and
is used to measure the consistency of the aspect ratio, taking the
influence factor into account can further consider the relationship between the prediction frame and the real frame, improve the regression accuracy when the real frame and the prediction frame IOU are larger or even included, and enhance the suppression of the model loss function. The effect improves the suppression of the model loss function, and finally improves the model convergence accuracy.
However, as reflected by
in Equations (8) and (9), the aspect ratio difference of the CIOU loss function cannot reflect the real aspect difference and confidence value, which hinders the similarity optimization of the model and reduces the convergence speed of the model. Therefore, in the study by Zhang et al., based on the CIOU loss function, the aspect ratio of the model was decomposed and the EIOU [
46] loss was refined. The EIOU loss function is defined, as shown in Equation (10):
This loss function consists of three parts: Overlap loss, center distance loss, width and height loss. Where and represent the width and height of the minimum bounding box. The EIOU loss function retains the advantages of CIOU loss function, and at the same time, considering the situation that the gradient is too large to affect the training accuracy caused by the imbalance problem of the Bounding box samples, the idea of Focal loss is introduced on the basis of the EIOU loss function, and the Focal EIOU loss function is proposed after the combination. The definition is shown in Equation (11). The and in the formula represent the coefficients that control the degree of outlier suppression. Focal EIOU loss function separates the low quality and high-quality anchor boxes from classifying the training samples.
4. Experiment Preparation
In this section, the border patrol dataset BDP used in the experiments, the experimental environment configuration, and the model performance evaluation metrics are introduced.
4.1. Introduction to the Dataset
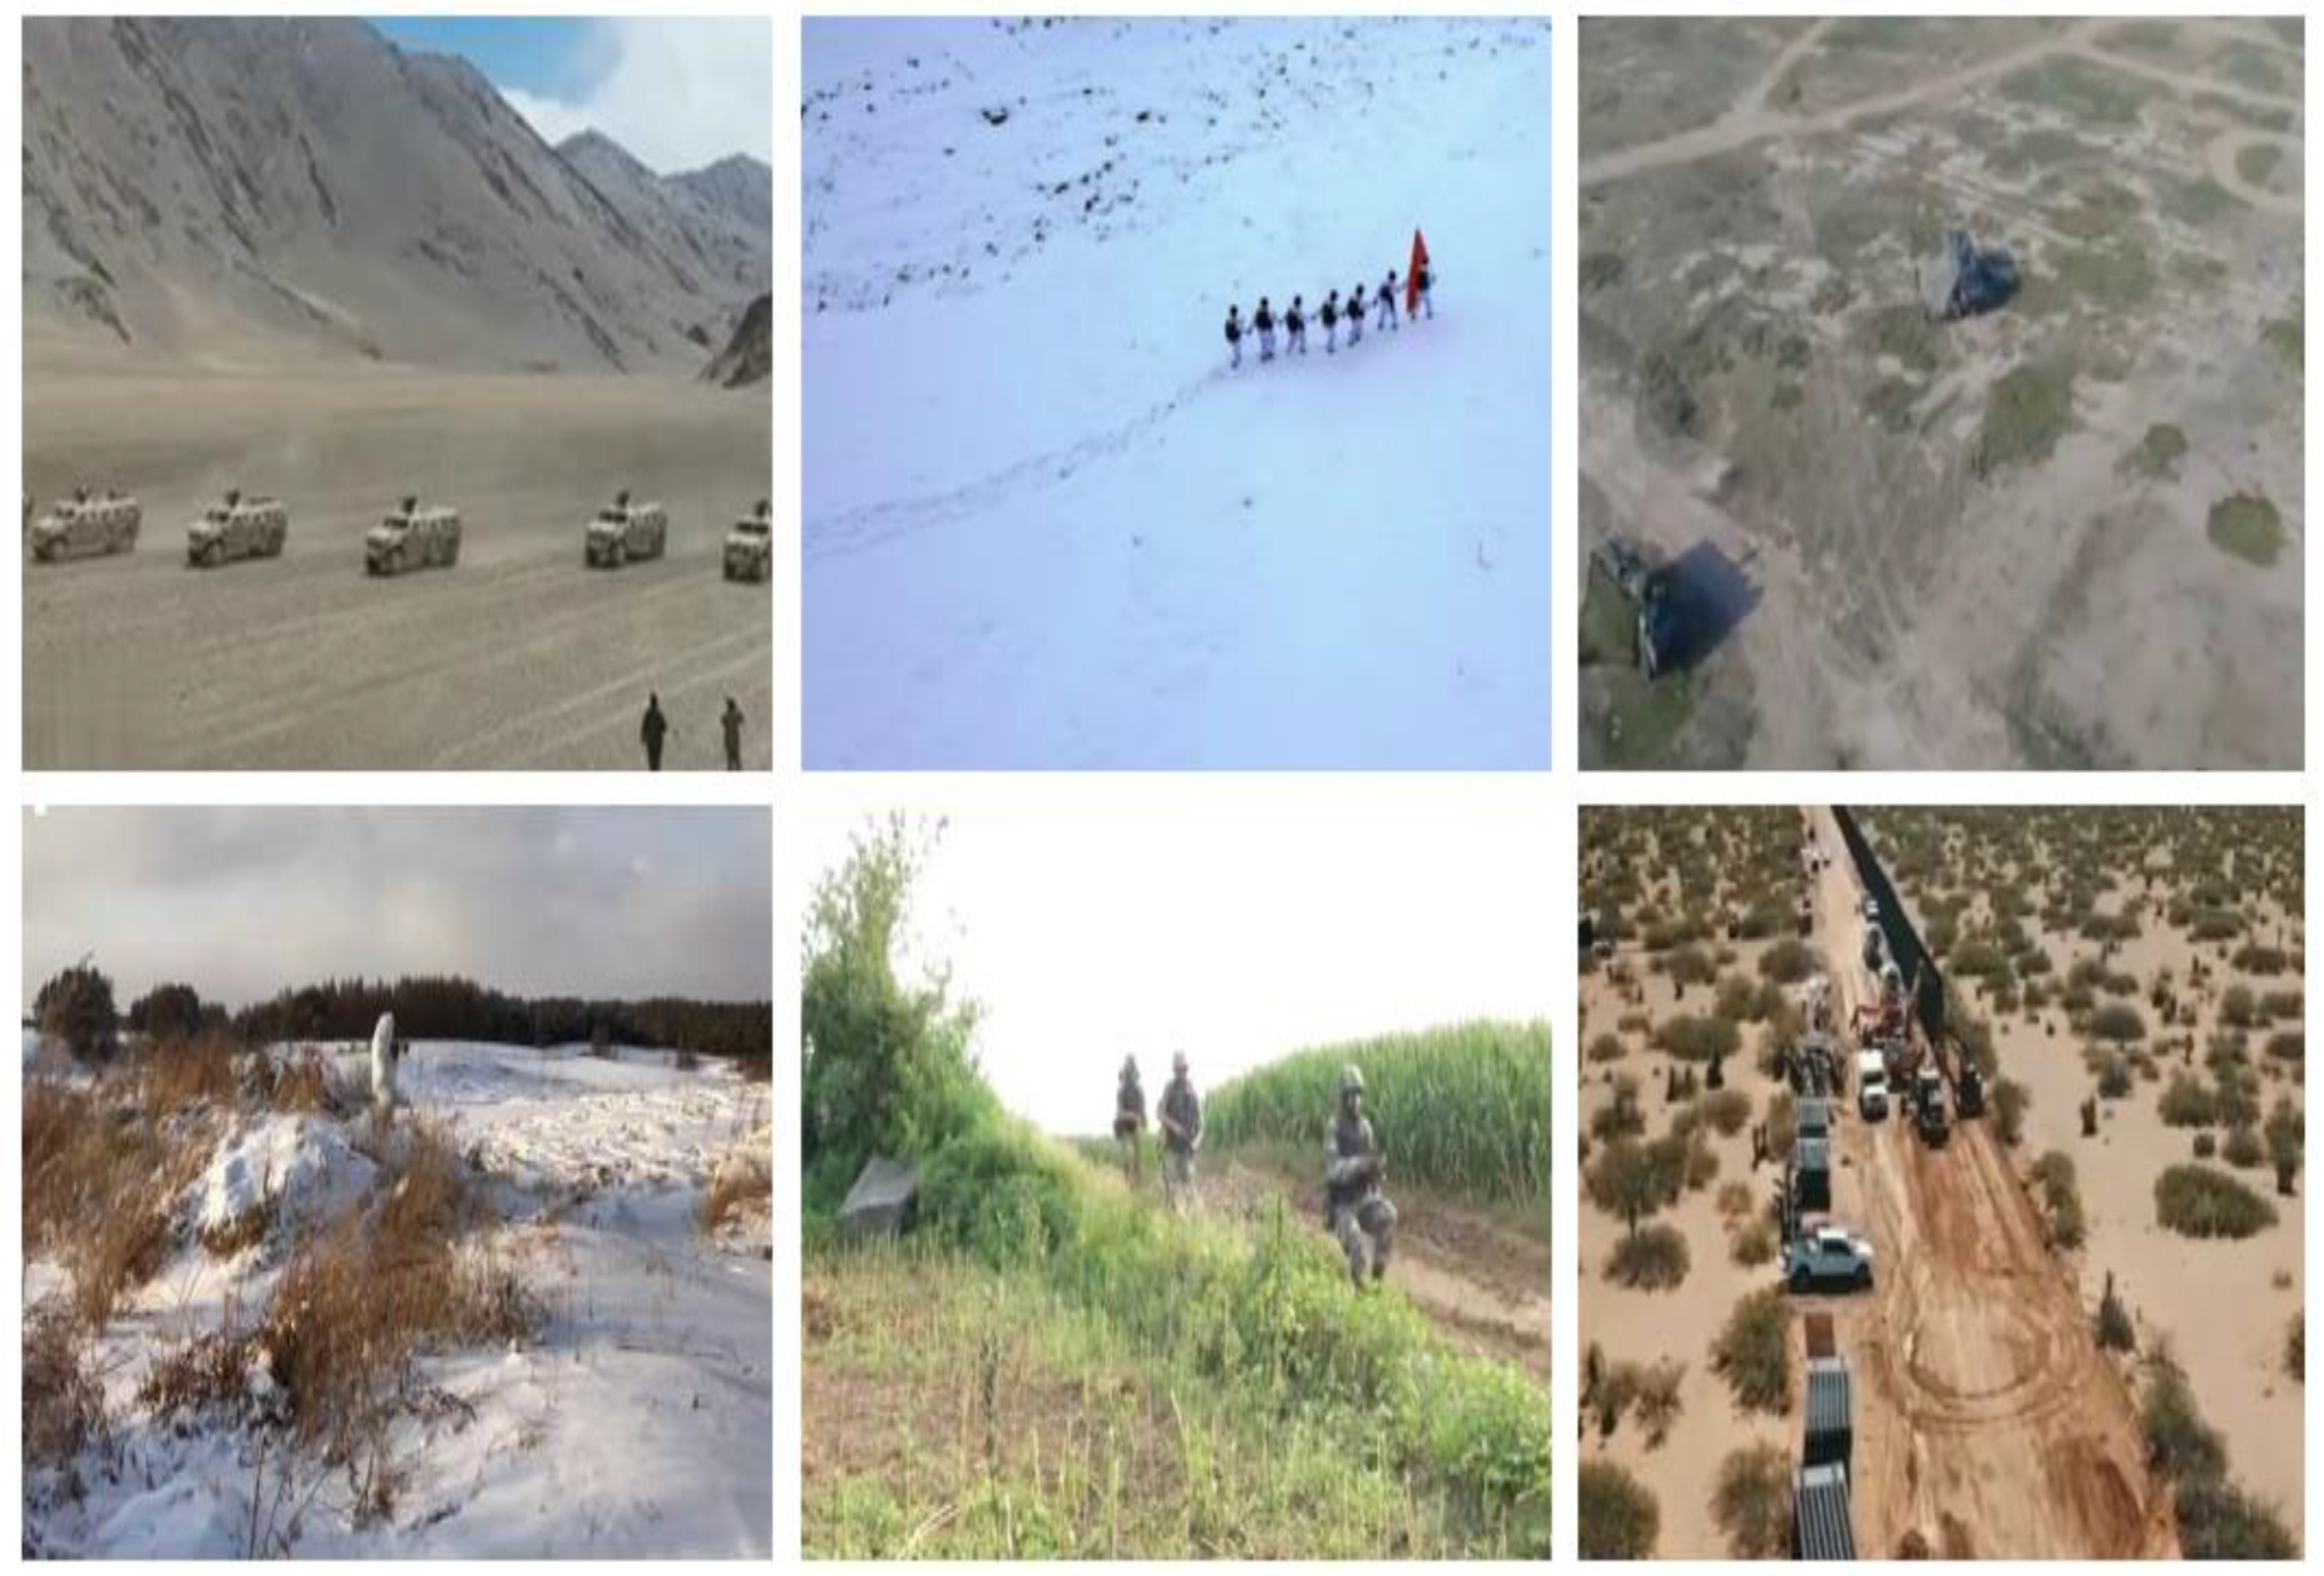
Due to the confidentiality of the information involved in the field, the image information related to border patrol is relatively scarce, so this paper creates the BDP dataset by offline collection, online collection of public video information, and network images. The BDP dataset has a total of more than 2600 samples, containing a total number of 11,000 labeled boxes, involving different tasks, different natural scenes of pedestrians, soldiers on duty, vehicles, camouflage vehicles, trucks and other common objects at the border. Some of the sample images of the dataset are shown in
Figure 5. Due to the various methods of data collection, involving aerial photography, overhead cameras and some portable photographic devices, the dataset has various scales and complex image backgrounds, and some of the model objects are obscured, blurred, and individual features are difficult to be extracted completely. We normalized the dataset and then used the image annotation software LabelImg for annotation. The dataset is divided into the training set, test set and validation set in the ratio of 8:1: 1 for training and performance testing of the model.
4.2. Introduction to Experimental Environment
The experimental platform for the experiments in this paper were performed on a workstation on Ubuntu20.04. The GPU is NVIDIA TITAN V 12 G. The neural network is built with Pytorch1.10 as the basic framework and programmed with Python language, and the specific parameters are shown in
Table 1.
4.3. Evaluation Indicators
In order to verify the comprehensive performance of the TP-ODA algorithm, this paper mainly selects mAP@0.5 (the average AP of all categories when the IOU is set to 0.5), mAP@0.5:0.95 (the average mAP under different IOU thresholds), FPS, GFLOPs, the number of parameters and the model size to evaluate the model performance.
The mAP value is the average value of all AP values, which can be used to evaluate the detection effect of the algorithm for multi-class objects. AP represents the result of evaluating the detection results of each class, which is related to the precision value and recall value of the model. The specific definition is as follows
TP, FP, and FN represent the number of correct detections, false detections, and missed detections, respectively. TP represents the number of instances that themselves belong to this class of objects and can be accurately detected by the model. In contrast, FP represents the number of instances that do not belong to this class of objects themselves, but are misjudged as such objects due to insufficient model performance. Here, true positive (TP) is the number of positive samples predicted to be positive, false positive (FP) is the number of samples predicted to be positive but is actually negative, and false negative (FN) is the number of samples predicted to be negative but is actually positive.
The size of the model is the size of the model stored after the final model training. The detection speed of the detection model is measured by the number of images per second (FPS) denoting the number of images that can be processed per second, and T denoting the time it takes to process an image. The average FPS detection time includes the inference time of the model, the average detection processing time, and the non-maximum suppression processing time.
5. Experimental Process
For the application scenario of the UAV border patrol detection, which is the focus of the paper, improving the detection speed of the model, reducing the parameters and computation of the model, and reducing the consumption of memory resources of the model are the main requirements for model selection while maintaining the detection accuracy of the model.
5.1. Implementation Details
Model training process: To prevent overfitting and skipping the optimal solution, the momentum factor is set to 0.937, and the stochastic gradient descent method is used to adjust the parameters. The batchsize is set to 32. Epochs were trained for 300 rounds, with an initial learning rate of 0.01 for the first 200 rounds and a weight decay of 0.0005 for the last 100 rounds. The overlap coefficient of the Mixup was set to 0.7. When the loss function and accuracy are gradually stable, the optimal weight of the algorithm is obtained. In the image preprocessing process, the image size is resized to 640×640 before being input into the network for training.
The YOLOv5 model includes a variety of different structures depending on the depth and width of the network. In this paper, some YOLOv5 models with different depths and widths are selected for experiments. As the detection objects in the VisDrone2019 [
47] dataset involve common objects, such as vehicles and pedestrians, and the characteristics of small and dense objects are similar to the characteristics of a part of the objects on patrol, we first use the Visdrone2019 dataset to carry out the baseline model selection experiment. The training process does not load the pre-training weights, a batchsize of 16, epochs are iterated 300 times, and the other parameters are selected as the default parameters of the algorithm for training. The model after training is tested on the test dataset in the Visdrone2019 dataset, and the relevant parameters are shown in
Table 2.
As can be seen from
Table 2, the YOLOv5x model has the highest detection accuracy, but the slowest detection speed, the largest amount of model calculation and parameters, and the largest memory occupation. The YOLOv5s model has the smallest memory, the smallest amount of calculation and the smallest number of parameters, but the detection accuracy and the detection accuracy are low. The accuracy difference between the YOLOv5x model and YOLOv5x model is 7.2%, but the model occupies a large amount of memory, calculation and the number of parameters, and the model detection speed is increased by 64.58%. Therefore, the YOLOv5 model has the advantages of fast detection speed, small overall model size and high detection accuracy, which meets the needs of the patrol duty object detection studied in this paper. At the same time, considering the real-time requirements of the task and the limited computing resources of the edge devices to be carried out in the future. Therefore, this paper chooses the YOLOv5s model as the baseline model, analyzes the existing and possible future problems of the actual task, makes objected improvements to the baseline model, and proposes a detection algorithm TP-ODA that is more suitable for patrol duty detection tasks.
5.2. Ablation Experiments
We use the model after improving the loss function for training and detection on the BDP dataset.
Table 3 represents the improved experimental results. From the experimental results, we know that the detection performance of the baseline detection algorithm on the BDP dataset is good. Compared to the baseline model, the mAP of the improved loss function detection algorithm is improved by 2.1% and the FPS is improved by 8.3%. From the experimental results, it is clear that the improvement in the loss function has more practical significance for the border patrol detection task proposed in this paper.
To verify the effectiveness of the other improvement modules used in this paper for the algorithm, we conducted ablation experiments on the BDP dataset. To ensure the fairness of the model evaluation, we set the same parameters for each variable.
The experimental procedure and the resulting relevant parameters are shown in
Table 4,
Table 5 and
Table 6. To test the performance of the algorithm for detecting images of different scale sizes, the detected images are adjusted to the sizes of 640 and 1024 in this thesis and input to the model for detection. However, according to the actual computational capacity of the edge devices, the number of images input to the network in a single pass is adjusted in the experiments, and the batchsize is set to 1, which means that only 1 image is input to the model for detection at a time, so as to mimic the situation that the UAV platform or other patrol reconnaissance devices have a limited number of images to process in a single pass due to less computational resources. The comprehensive experimental results show that the TP-ODA proposed in this chapter has better performance for the UAV border patrol object detection task. The specific experimental detection results are as follows.
Model 1 mainly improves the imbalance problem of the detection box sample of the model. As can be seen from the three groups of experimental data in
Table 4,
Table 5 and
Table 6, the detection accuracy and detection speed of the model are improved. Based on Model 1, Model 2 is designed for lightweight, and inspired by the idea of GhostNet, the ordinary convolutional neural network is optimized. The experimental results show that, after Model 2 was replaced with a module that consumes less computational resources, the detection accuracy in the three sets of experiments was reduced by 2.5%, 1.6% and 2.8%, respectively, but the number of model parameters and computational effort were reduced substantially, including a 46.1% reduction in model volume, a 48.64% reduction in the number of parameters, a 48.73% reduction in GFLPOS, and a 3.7% increase in detection speed.
Considering the patrol task that the improved algorithm will use, and aiming at the complex and diverse detection background, we build Model 3 based on Model 2, mainly by adding a lightweight feature information extraction module BP-Sim in the network. The purpose is to enhance the effective information expression ability of the detection object in the complex patrol task environment, and to have better sensitivity to the useful features of each dimension of the border patrol image. The experimental results show that the detection accuracy of Model 3 is improved by 1.8%, 2.0% and 1.3%, the model size is reduced by 19.74%, the number of parameters is reduced by 19.44%, and the GFLOPs is reduced by 18.52%. In the comparison of detection speed, Model 3 is increased by 2.54%, 22.41% and 2.56%, respectively.
To address the impact of noise information when fusing features and the large size of the neck network of the benchmark model, this study adds the feature fusion module PDOEM to the neck network on the basis of Model 3. From the results of the three sets of experiments, it can be seen that the detection accuracy of the model was improved by 0.7%, 0.8%, and 3.4%, respectively, and the model volume was reduced by 16.39%, the parameter volume is reduced by 17.24%, and the GFLOPs was reduced by 16.67%. In terms of detection speed, except for the 2nd group of experiments in which the detection speed of the model increased by 15.49%, the other two groups of experiments decreased by 2.57% and 3.33%, but still belonged to the model with high detection efficiency.
5.3. Model Comparison Experiment
In order to illustrate the performance of the improved algorithm in this paper, we selected some images from the border patrol detection dataset for detection. The main characteristics of the selected graphics are: Highly similar detection environment, blurred object background, diverse number of objects, etc. The selected objects are mainly vehicle objects and soldiers on duty commonly found in border patrol. In addition, this section selects representative detection models from various types of detection models for comparison experiments. The experimental comparison results are shown in
Figure 6,
Figure 7 and
Figure 8 and
Table 7.
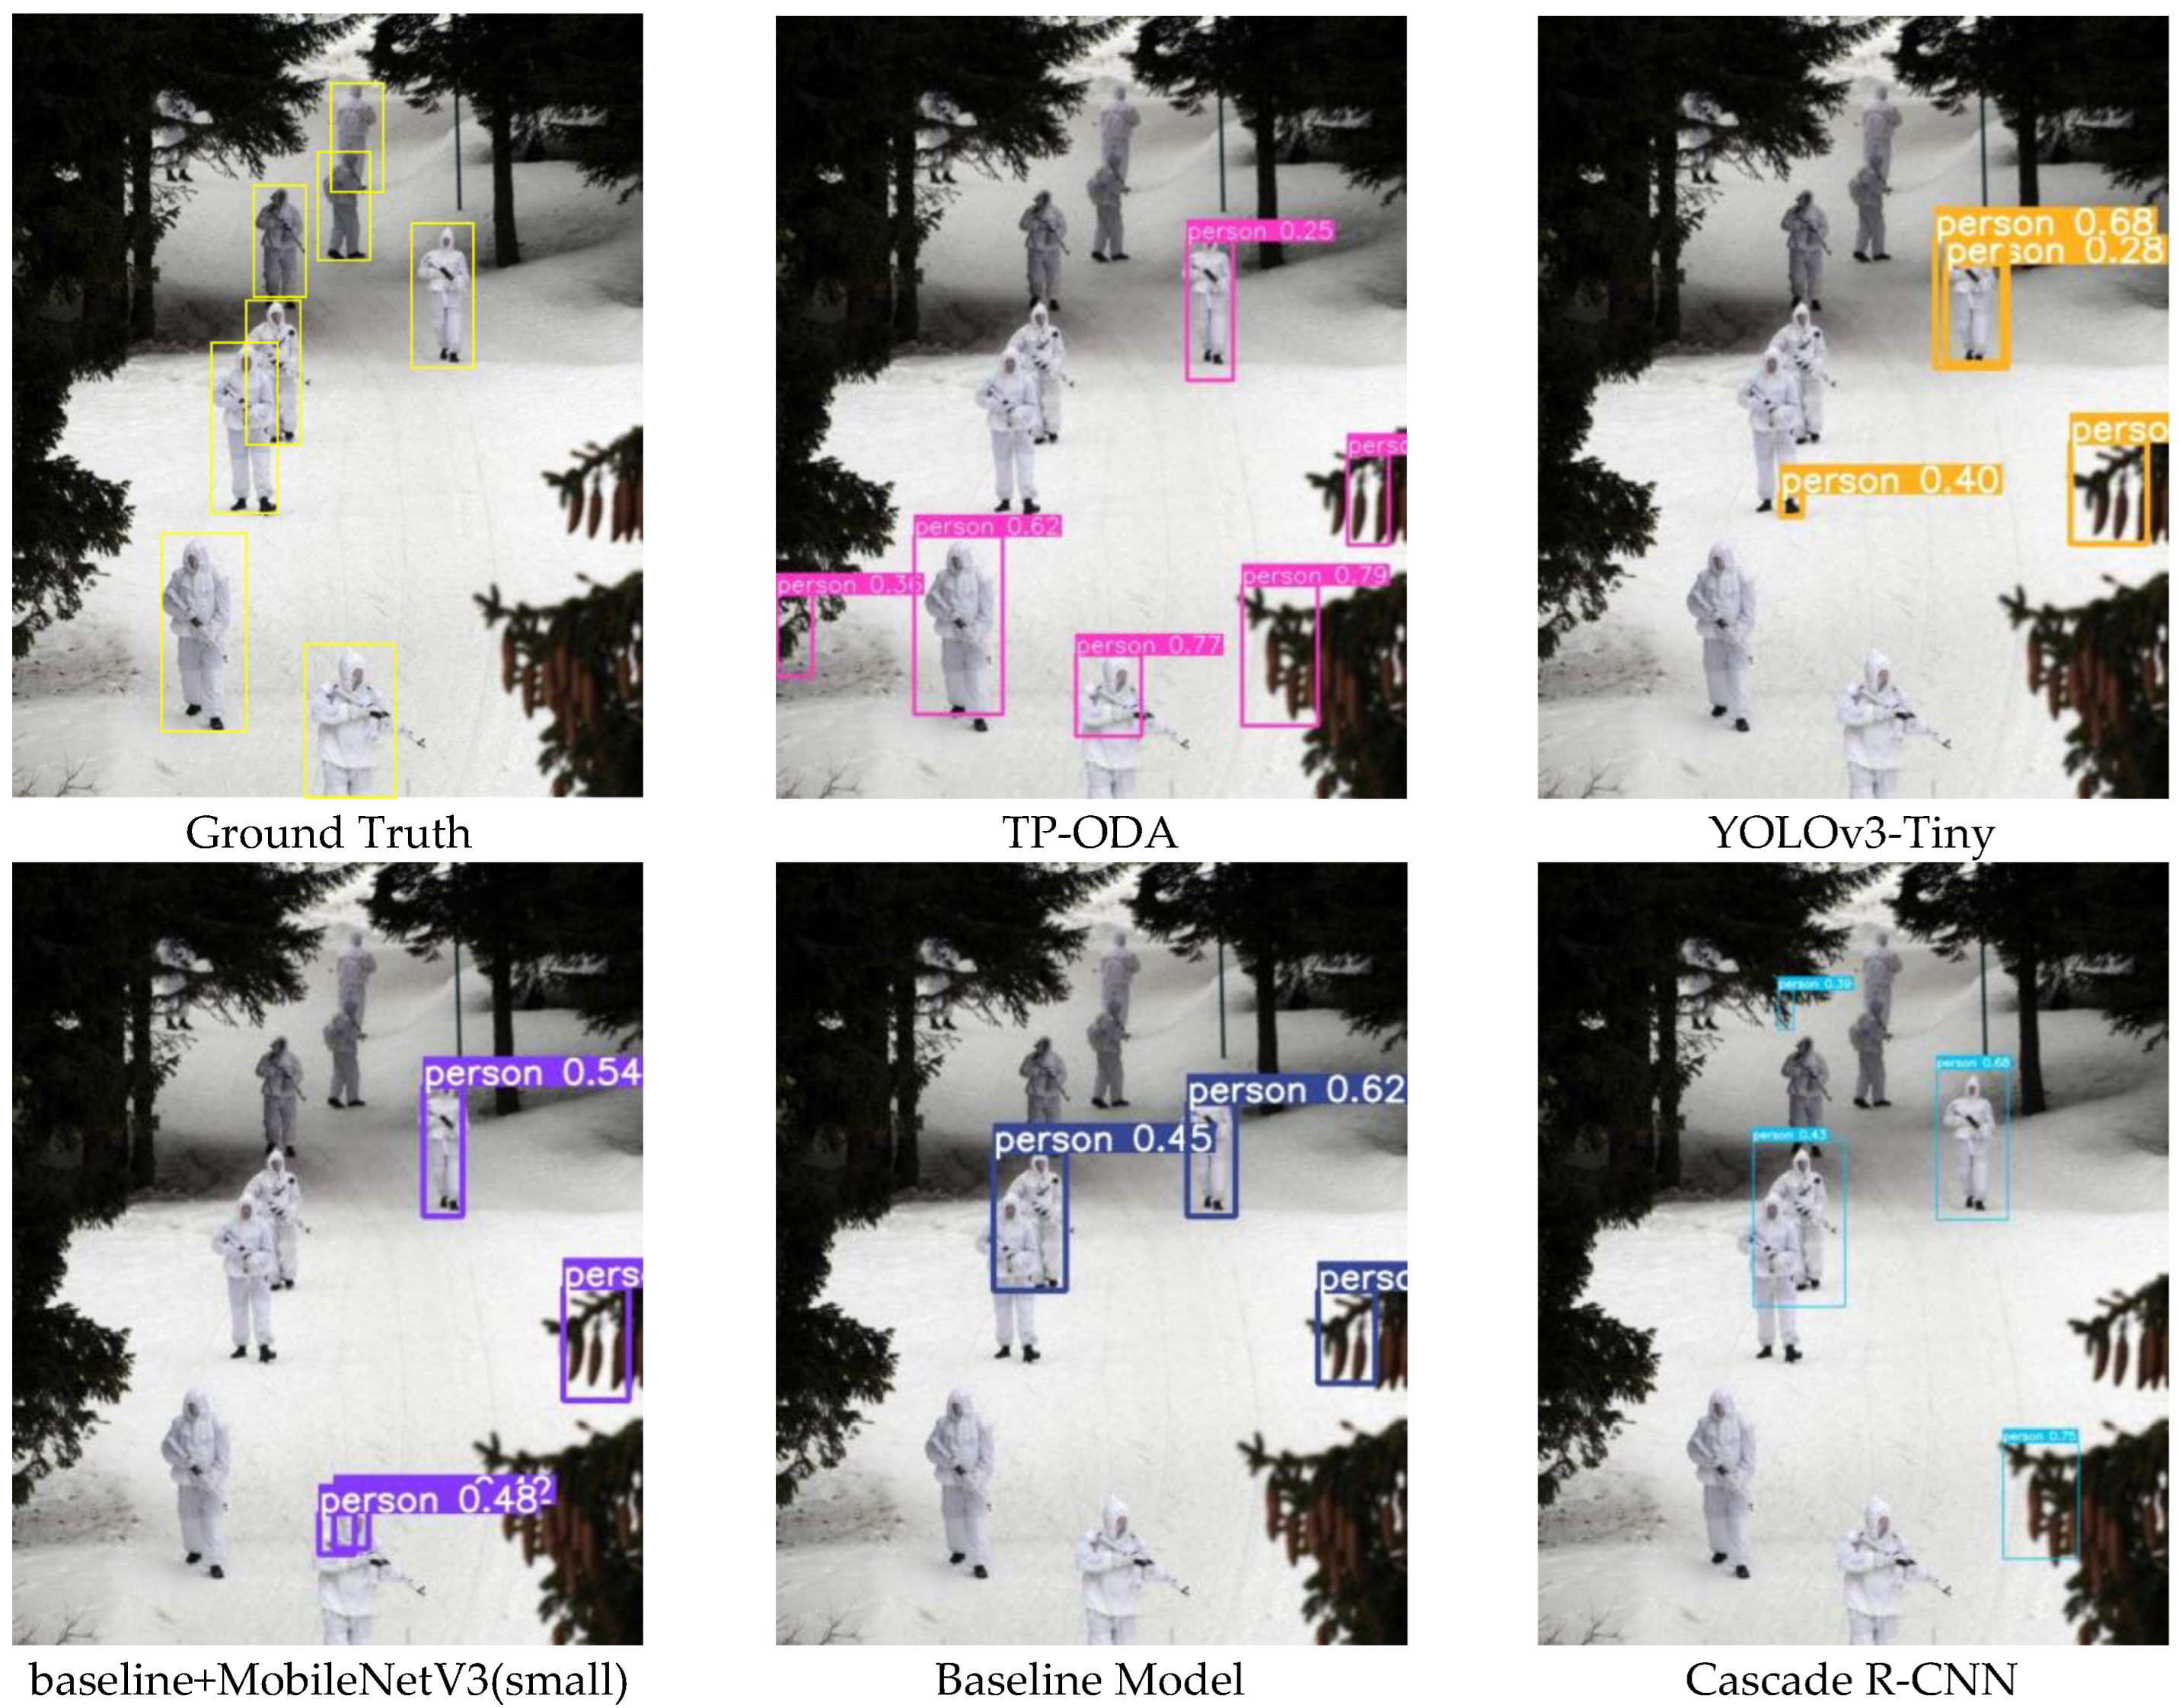
The detected environment in
Figure 6 is a snowy scene, and the detected objects have a high similarity to the detection background, which is very challenging for the model. From the results, it can be seen that all the detections have missed and false detections. The Cascade R-CNN algorithm and the TP-ODA algorithm both detect three objects, and the benchmark model detects two objects, but also three object false detections, and the Cascade R-CNN only has one object. The experimental results show that the improved algorithm in this chapter is slightly less accurate than the Cascade R-CNN and better than the benchmark algorithm and other detection algorithms on this class of object detection task.
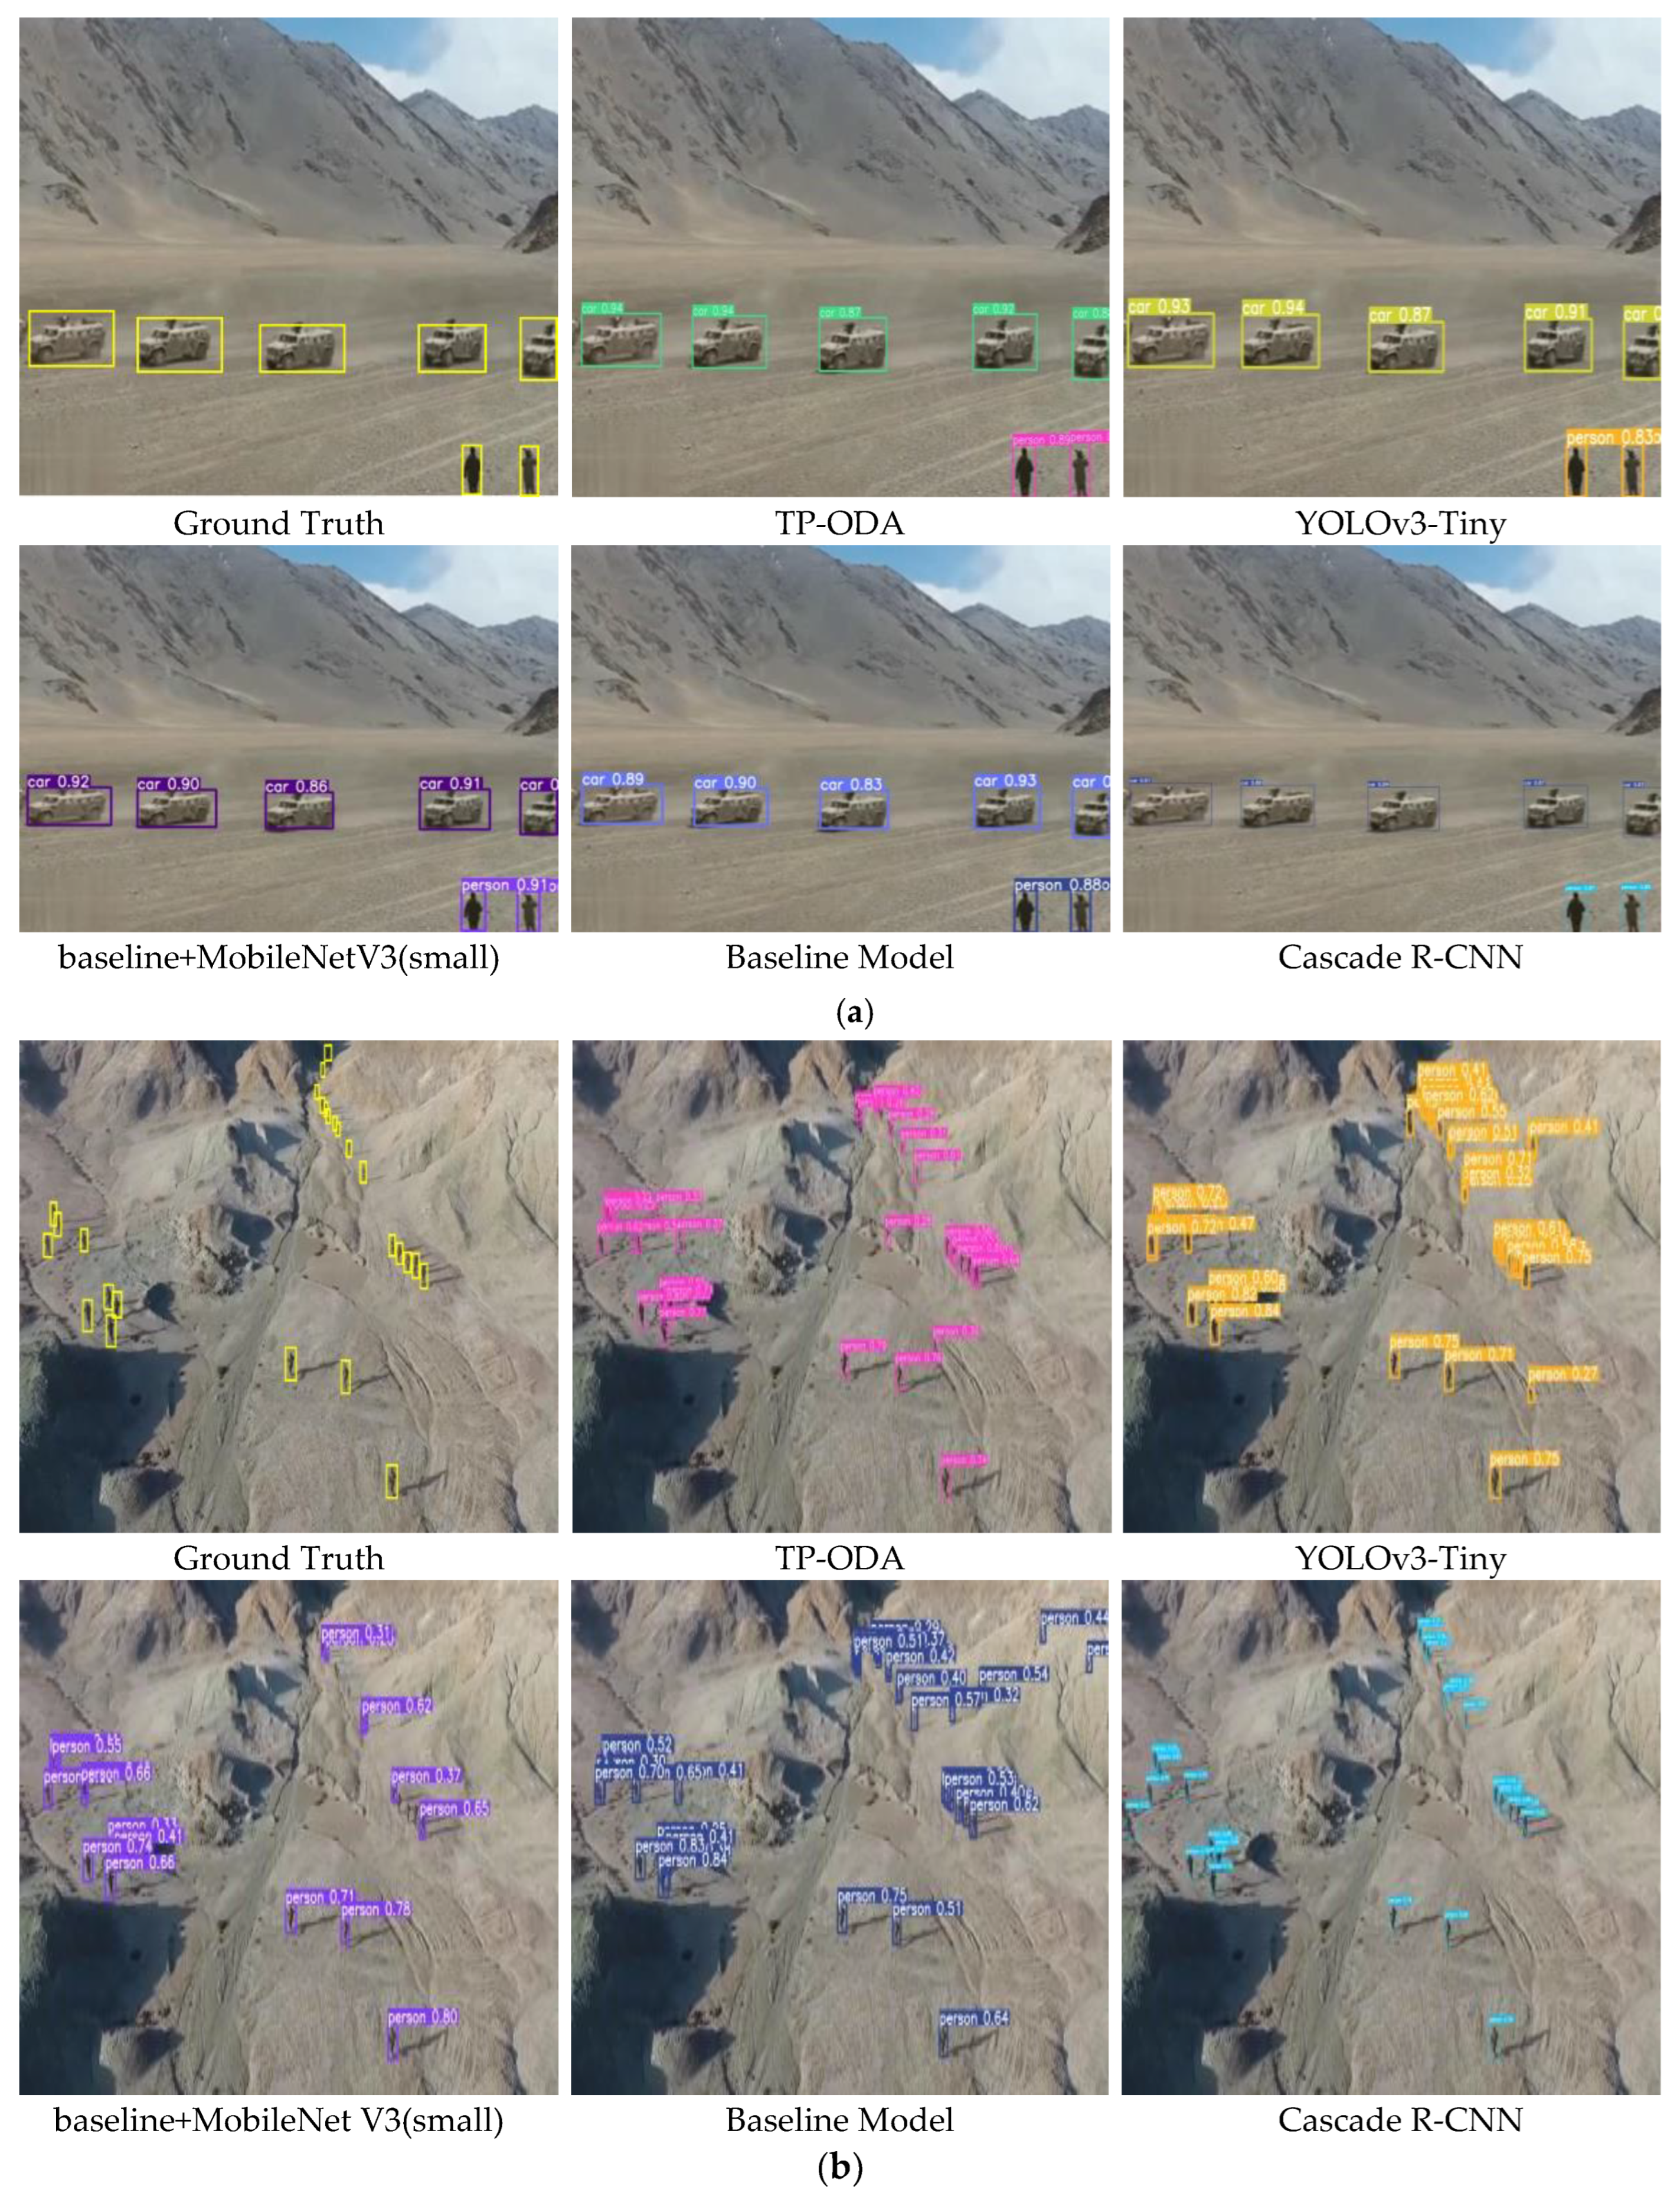
Figure 7 shows two sets of detected objects against a desert background, involving detection categories of soldiers and vehicles on duty. The main characteristics of this group of images are the large number of objects and the small size of the objects. From the results of the two sets of experiments, it can be concluded that all the detection algorithms can detect the vehicle objects and the algorithms have good overall performance, but when detecting pedestrian objects in this type of scene, the YOLOv3-Tiny and Baseline+MobileNetV3 detection algorithms show different degrees of missed detection, and the baseline model and TP-ODA show false detection, with the baseline. The Cascade R-CNN detection algorithm does not show false detections or missed detections, but the TP-ODA algorithm has a higher confidence value in the detection results, which is closer to the real frame.
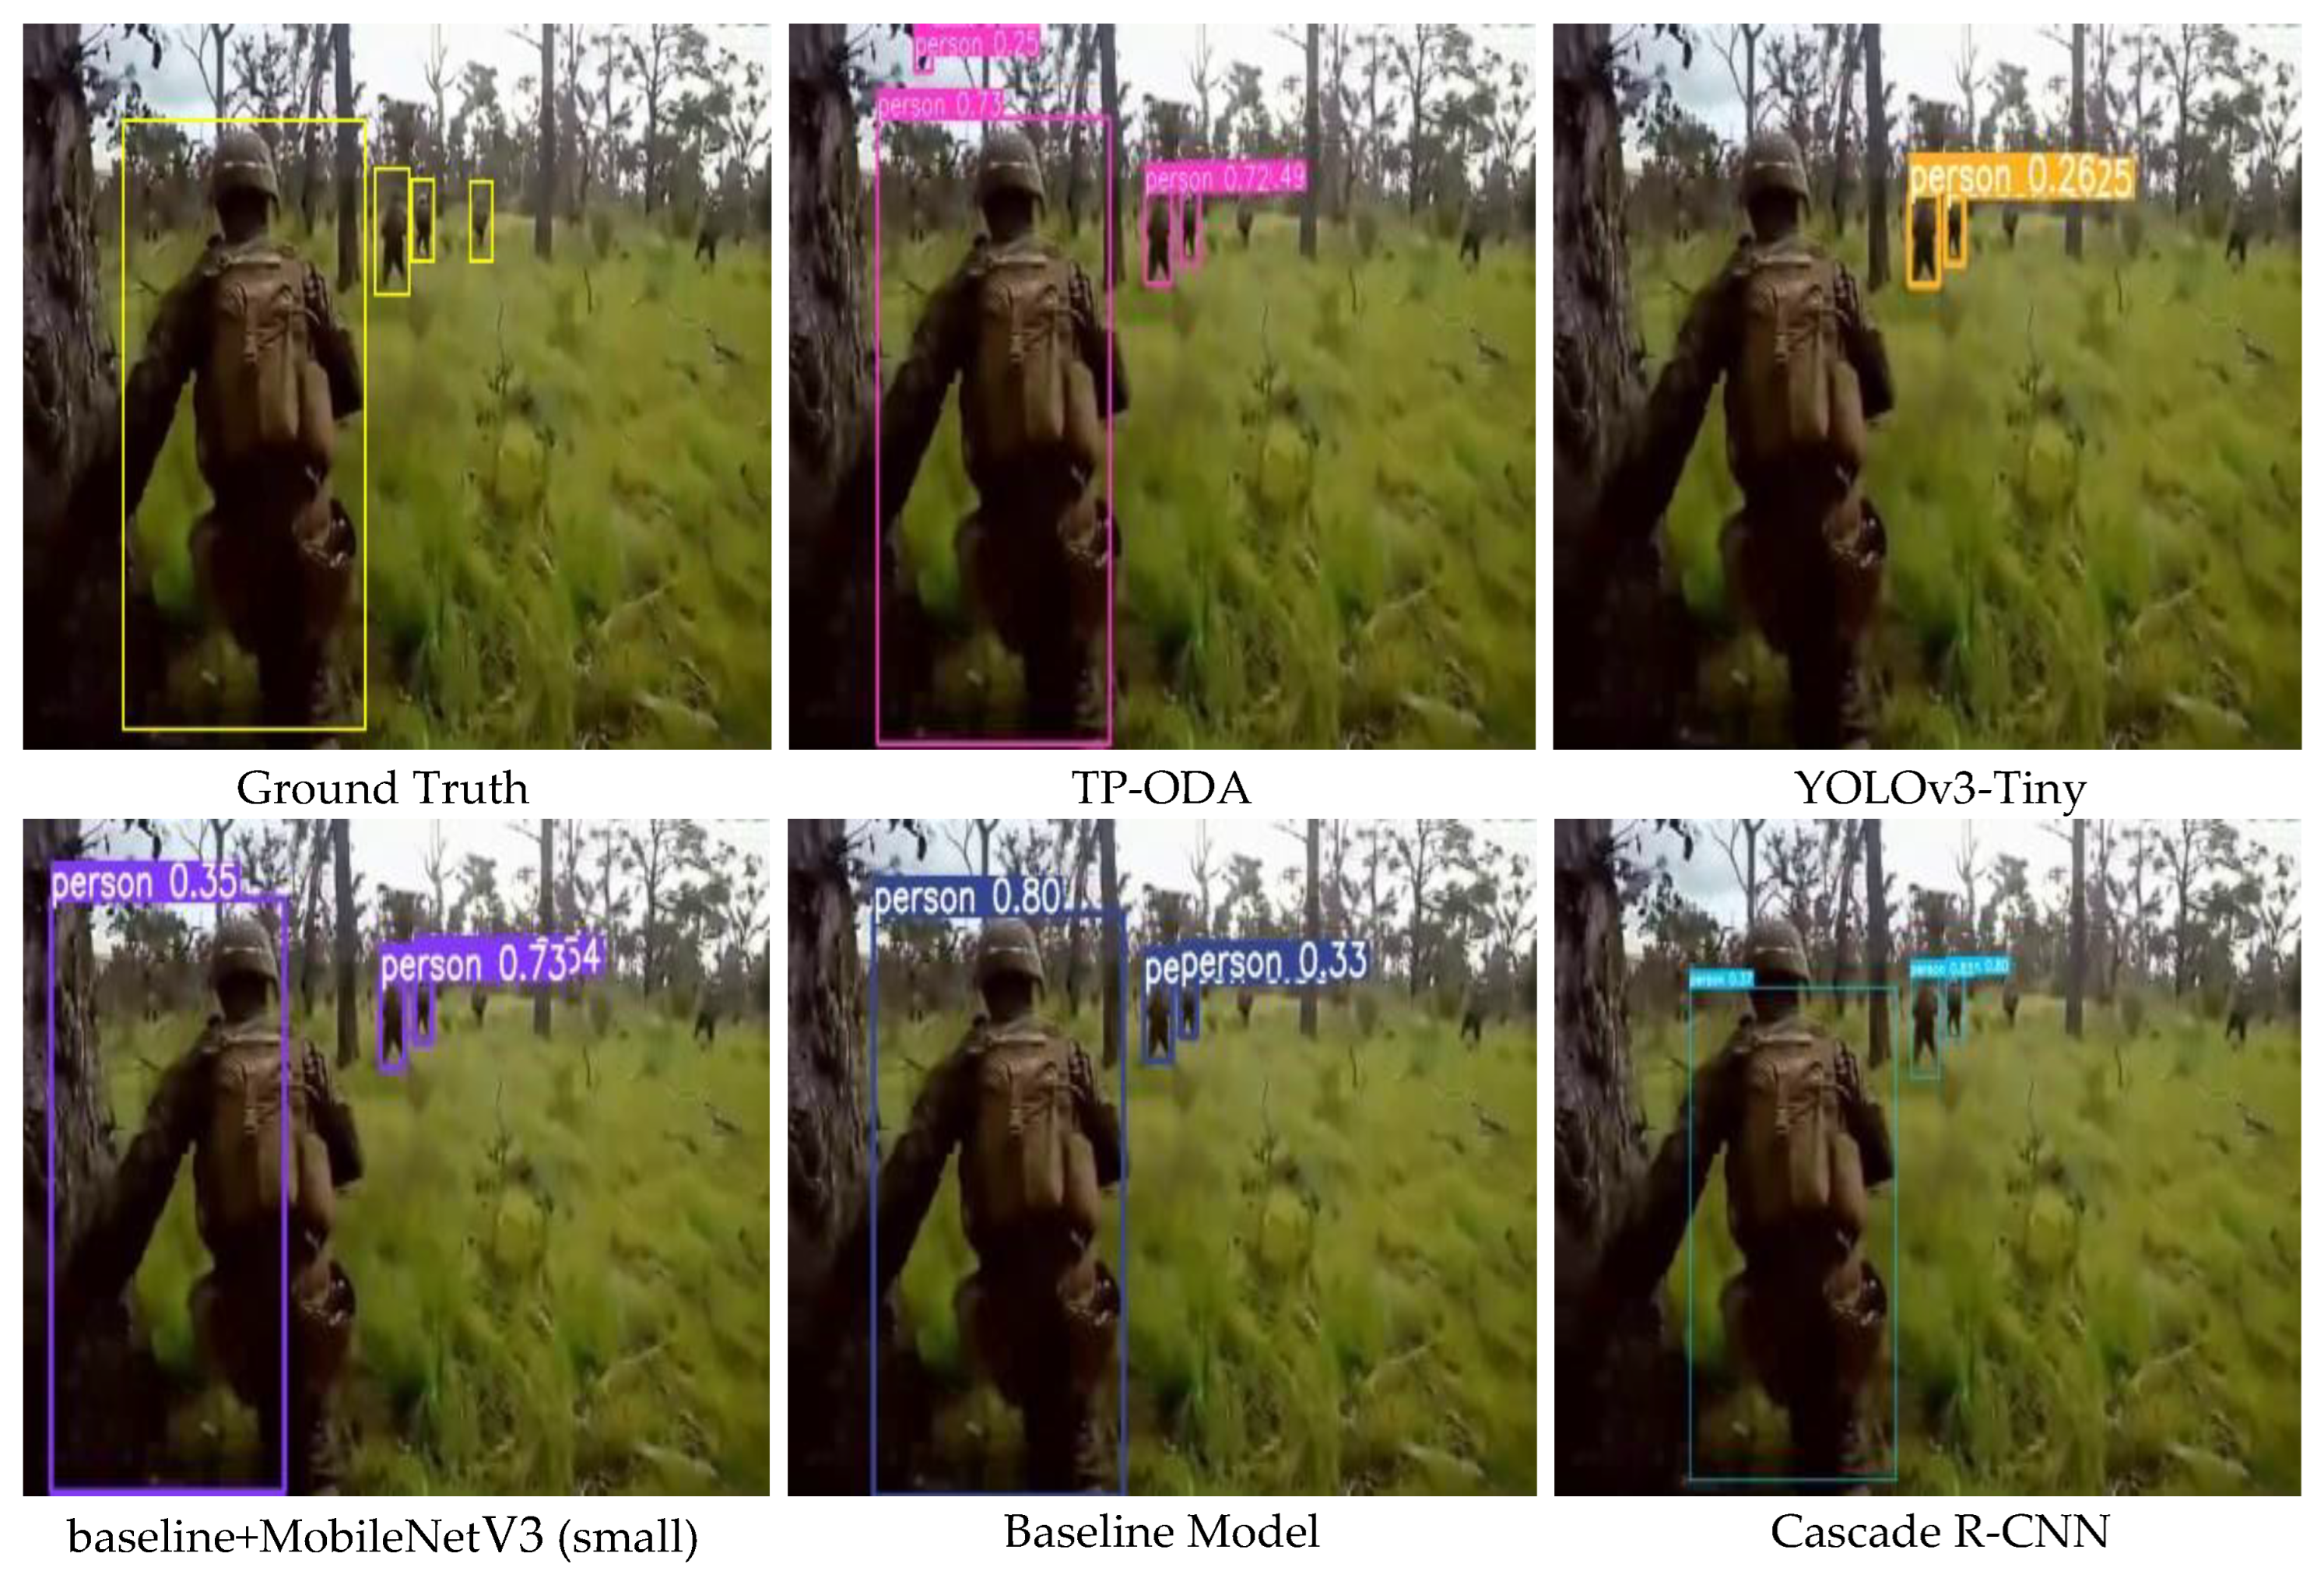
Figure 8 shows the detected objects in the jungle environment, which are mainly characterized by the different scales of the objects to be detected, and the fuzzy and complex detection backgrounds. All five sets of experimental results failed to detect all the objects, among which the YOLOv3-Tiny detection algorithm had more missed detections, and only two objects were detected in both sets of data. the Baseline model and TP-ODA detected three objects, which was better than the other models. While the TP-ODA algorithm showed one false detection case, the detection results were closer to the true value.
Table 6 indicates that the results of the TP-ODA model with other models for comparison experiments. In the experimental results, the detection algorithm in this paper guarantees the detection speed and detection accuracy, and the number of parameters and computation volume of the model are significantly reduced, and the accuracy is improved by 2.9%, the model parameter volume is reduced by 65.76%, the model volume is reduced by 63.83%, and the computation volume is reduced by 65.19% compared to the benchmark model. In the detection speed comparison experiments, the model with ShuffleNet v2 for light processing has the fastest inference speed with a FPS of 133, which exceeds the detection speed of the benchmark model by 23.14% and that of TP-ODA by 13.67%, but the model computation and the number of parameters are higher than those of the TP-ODA algorithm by more than two-fifths and the model volume is larger. In terms of detection accuracy, the two-stage network shows a stronger advantage, with the accuracy value exceeding that of the TP-ODA algorithm by 2.24%, but the comprehensive performance of the algorithm in this paper is more advantageous in completing the border patrol detection task in terms of the comprehensive model size, detection accuracy and detection speed.
6. Conclusions
In this study, we designed a lightweight detection network for detecting border patrol objects for use with the UAV platforms and portable reconnaissance equipment often used by border patrols. In order to be better used on edge devices, we used the YOLOv5 detection algorithm as the benchmark model and took the reduction of network size and the consumption of computational resources as the starting point. We proposed the TP-ODA detection network in three aspects: Volume compression of the model, improving the semantic information representation of object features and optimizing the loss function of the model, and verify through experiments that the improvement module has a positive effect on the improvement of the model. Synthesizing the improvement work in this paper, the following conclusions can be drawn: We used stacking to reconstruct the backbone network using the lightweight module, reducing the resource consumption by nearly one-third, while using BP-Sim to further optimize the feature extraction function of the network and enhance the detection capability of the model for border patrol hard-to-detect images. Then, we used the EIOU loss function to improve the problem of the detection frame sample imbalance leading to accuracy degradation and convergence slowdown; finally, we designed the feature fusion module PDOEM for the problem of the large size of the neck network feature fusion structure, which further compresses the model while reducing the impact of noise information on the model feature fusion and further enhances the difficult sample feature information mining capability.
This paper verifies, through ablation experiments, that the introduced method and designed module have good effects on algorithm performance improvement, and further verifies that the TP-ODA detection algorithm has better detection performance in the border patrol detection task by comparing it with other lightweight algorithms and common detection algorithms and meets the requirements of the border patrol detection task for real-time and accuracy.
Combining the experimental results and conclusions of this paper, the next research directions are also clarified as follows.
1. The border patrol detection task is an all-weather task, and the next step of the model performance improvement needs to consider training in a richer and more diverse task environment.
2. The improved model will be mounted into resource-constrained edge devices to test the detection performance of the algorithm in reality, and to be able to find the problems with the model in such a way to further improve the algorithm performance.


