Article

Enhancing Sentiment Analysis via Random Majority Under-Sampling with Reduced Time Complexity for Classifying Tweet Reviews

by
Saleh Naif Almuayqil
1,
Mamoona Humayun
1,*,
N. Z. Jhanjhi
2,
Maram Fahaad Almufareh
1 and
Navid Ali Khan
2
1
Department of Information Systems, College of Computer and Information Sciences, Jouf University, Sakakah 72311, Saudi Arabia
2
School of Computer Science, SCS, Taylor’s University, Subang Jaya 47500, Malaysia
*
Author to whom correspondence should be addressed.
Electronics 2022, 11(21), 3624; https://doi.org/10.3390/electronics11213624
Submission received: 5 October 2022 / Revised: 31 October 2022 / Accepted: 3 November 2022 / Published: 6 November 2022

Abstract

:
Twitter has become a unique platform for social interaction from people all around the world, leading to an extensive amount of knowledge that can be used for various reasons. People share and spread their own ideologies and point of views on unique topics leading to the production of a lot of content. Sentiment analysis is of extreme importance to various businesses as it can directly impact their important decisions. Several challenges related to the research subject of sentiment analysis includes issues such as imbalanced dataset, lexical uniqueness, and processing time complexity. Most machine learning models are sequential: they need a considerable amount of time to complete execution. Therefore, we propose a model sentiment analysis specifically designed for imbalanced datasets that can reduce the time complexity of the task by using various text sequenced preprocessing techniques combined with random majority under-sampling. Our proposed model provides competitive results to other models while simultaneously reducing the time complexity for sentiment analysis. The results obtained after the experimentation corroborate that our model provides great results producing the accuracy of 86.5% and F1 score of 0.874 through XGB.

1. Introduction

Sentiment analysis is often referred to as opinion mining; it is a technique that identifies, and extracts required information from source information. It helps businesses comprehend the sentiment of their brands, services, and products through feedback from online discussions of the customers [1]. On social platforms such, as Twitter, a considerable amount of consumer-generated material is created daily, and this trend is likely to carry on with increased user content in the future [2]. The amount of consumer-generated data (for example tweets on Twitter) would be beneficial as a primary source for making many different decisions in various areas. These data can be utilized to comprehend people’s sentiment, which are indeed a valuable resource. It is a known fact that understanding the emotions of other people can be useful in figuring out related issues so that tactics can be applied to solve these issues.
The Internet and other online technologies have drastically changed how our society operates. Facebook and Twitter are only two examples of the social network domains that are often used for knowledge and plan sharing, business and trade specific promotion, politics-related and ideology-related campaigning, and/or product and service specific promotion [3]. Typically, social network domains are examined through a range of perspectives, including collection of business specific intelligence for the advertising of products, monitoring for unlawful behavior to detect and counteract cyber threats, and utilizing opinion mining to assess customer reviews [4]. In the past few years, research academics have been devoting attention to investigating sentiment analysis. In this context, a number of strategies have been created, proposed, and tested [5].
The primary techniques for sentiment analysis are:
  • Lexicon techniques [6]
  • Machine Learning techniques [7]
  • Deep Learning techniques [8]
  • Hybrid techniques [9]
Words are categorized according to their emotional meanings in the lexicon-based approach [6]. Common word categorizations include either two or three, +ve and −ve in case of two and neutral is added in case of three. Sometimes comprehensive sentiment is performed which includes five categories by introducing two new labels as very positive and very negative. High-quality sentiment dictionaries with big corpora of words categorized in the aforementioned categories are necessary for the lexicon-based approach’s [7] efficacy. The necessity to use a significant amount of the semantic literature to identify useful words for opinion mining can be a considerable problem of this method [10]. Both supervised methods [11] as well as unsupervised methods [12] are taken into consideration in the ML-based strategy for sentiment analysis.
To decrease the time requirements for text labelling and enhancing its quality, it is logical to develop semi-automatic techniques which employ sentiment dictionaries [13]. We split our dataset into a training set and a testing set after a labelling process was completed. The TF-IDF or word2vec can be used to extract information from texts in the next stage. After that, ML related classifiers such as Random Forest—RF, Support Vector Machine—SVM, and Decision Tree—DT were used to classify the texts. Unsupervised learning [14] does not use pre-labelled data and does not require human supervision. Clustering technique, which is an unsupervised approach, is commonly used. K-means algorithm is an example of such technique. This approach gathers relevant data and finds common attributes by using centroids as the cluster’s nucleus. Even though clustering algorithms are not dependent on the initial step of dataset readiness by human specialists, they can be sensitive with respect to the centroid’s positioning. The clustering techniques combines samples based on implicit criteria for categorization.
Feature extraction approaches are often used for text classification such as sentiment analysis using ML and DL methods [15]. Standard ML and DL methods are used for various tasks including image and text processing [16]. DL approaches [15,16] that aims to enhance text classification performance were the focus of numerous recent research studies due to their enhanced performance when trained through significant data [17,18]. This has been thoroughly covered in the literature when it comes to the employment of various neural networks including deep-neural-networks (D-NNs), recurrent-neural-networks (R-NNs), and convolutional-neural-networks (C-NNs), respectively [8]. A DNN is a particular kind of neural network (NN) with many layers, which includes an input layer that examines the incoming data; there are some hidden layers that abstract from these data, and a final output neuron which forecasts a result. A transformer-based model was also utilized using DistilBERT for sentiment analysis [19]. Hybrid approaches are also very common for sentiment analysis as several techniques can be combined to enhance the sentiment analysis results. Several techniques can be combined, such as when lexicon techniques are combined with machine learning to produce better results [20].
The current sentiment analysis research is focused on the two aforementioned techniques in Figure 1. The absence of integrated sentiment analysis tools and methods allows customers to chime in, experiment with, and check various algorithms based on personal choices. This discussion has demonstrated the growing need to present a sentiment analysis methodology that would reduce the gap revealed by the preceding investigations [21]. However, there are many challenges associated with sentiment analysis [22]. The first one has to do with vagueness where one term might be viewed as good in one scenario, whereas in another scenario, it might be viewed as negative. A second challenge is that people do not always express their ideas the same manner. When utilizing social media sites, such as Twitter or blogs, people frequently express various points of view in the same statement, which is easy for a person to grasp but more difficult for a computer to understand. The third one has to do with the class inequality in the dataset and time complexity to process large amounts of data [21,22]. The datasets are often highly imbalanced and required a long processing time when classification tasks such as sentiment analysis are involved [23]. The oversampling technique is the most explored, but under-sampling is often disregarded [24]. Therefore, a comprehensive model is necessary to address these issues. In this paper we present the following contributions:
  • Proposing a detailed model for enhanced sentiment analysis that handles class imbalance while utilizing random majority under-sampling to reduce time complexity.
  • Manual selection of pre-eminent features for sentiment analysis with respect to the dataset.
  • Determining the effective text preprocessing order for Twitter to enable accurate under-sampling without leading to the issue of under-fitting.
  • Exploring the actual impact of under-sampling against non-under-sampled data.
The rest of the paper is organized as follows:
  • Section 2 discusses the literature review in detail. It includes ML and DL techniques for sentiment analysis.
  • Section 3 presents the methodology of our model with a step-by-step process.
  • Section 4 lists the details of the dataset and presents the results with various classifiers.
  • Section 5 showcases the results with visualizations.

2. Literature Review

A detailed review of the prior research being conducted in the fields of sentiment analysis is presented in this section of the literature review. There are various research papers where authors have analyzed the sentiments expressed by people on Twitter and classified the tweets as +ve, −ve, or neutral. A lot of the literature related to sentiment analysis is available to be explored but as our paper is focused on resampling and machine learning, therefore we will primarily focus on those studies. A taxonomy of the previous literature is provided in Table 1 which focuses on ML related as well as DL related methods for sentiment analysis.

3. Methodology

This section provides a comprehensive model for enhanced sentiment analysis through random majority under-sampling with reduced time complexity.

3.1. Proposed Model

In this study, a detailed model is created comprising all the functional elements required for sentiment analysis. This model follows a modular approach which combines various opinion mining theories with a specific attention on improvements in time complexity and class imbalance. The presented model comprises unique components that control various functions internally to manipulate the tweet text. We are creating a sentiment analysis pipeline to automate the entire model except the initial part where feature selection is required. It involves several modules starting with feature selection which is task specific (i.e., sentiment analysis). The rest of the steps are task independent which includes preprocessing of the tweet text, lemmatization, text embedding’s and RMU to classify the tweet into one of the sentiments. Figure 2 provides a comprehensive look at our model and all its components.

3.1.1. Feature Selection

Feature selection is about choosing, operating, and metamorphosing the input data into attributes that can be utilized by the supervised machine learning algorithms. Choosing the best features is an important step in achieving the best performance for a model. For our study, we needed to choose and combine certain features to achieve the best outcome of our data. We selected the column ‘tweetID’ for individual identification of the tweets within the dataset. We merged the attributes ‘text’ that holds the tweets and the attribute ‘negative reasons’. These features were merged to enhance the natural language content of the tweets for better opinion mining. For example, when we combine the features ‘text’ and ‘negative reasons’, it provides a better response to identify negative tweets. Table 2 provides an example of two separate features, but when these two features are combined their text becomes one feature ‘text+ negative reasons’ which can be used to train our classifier.

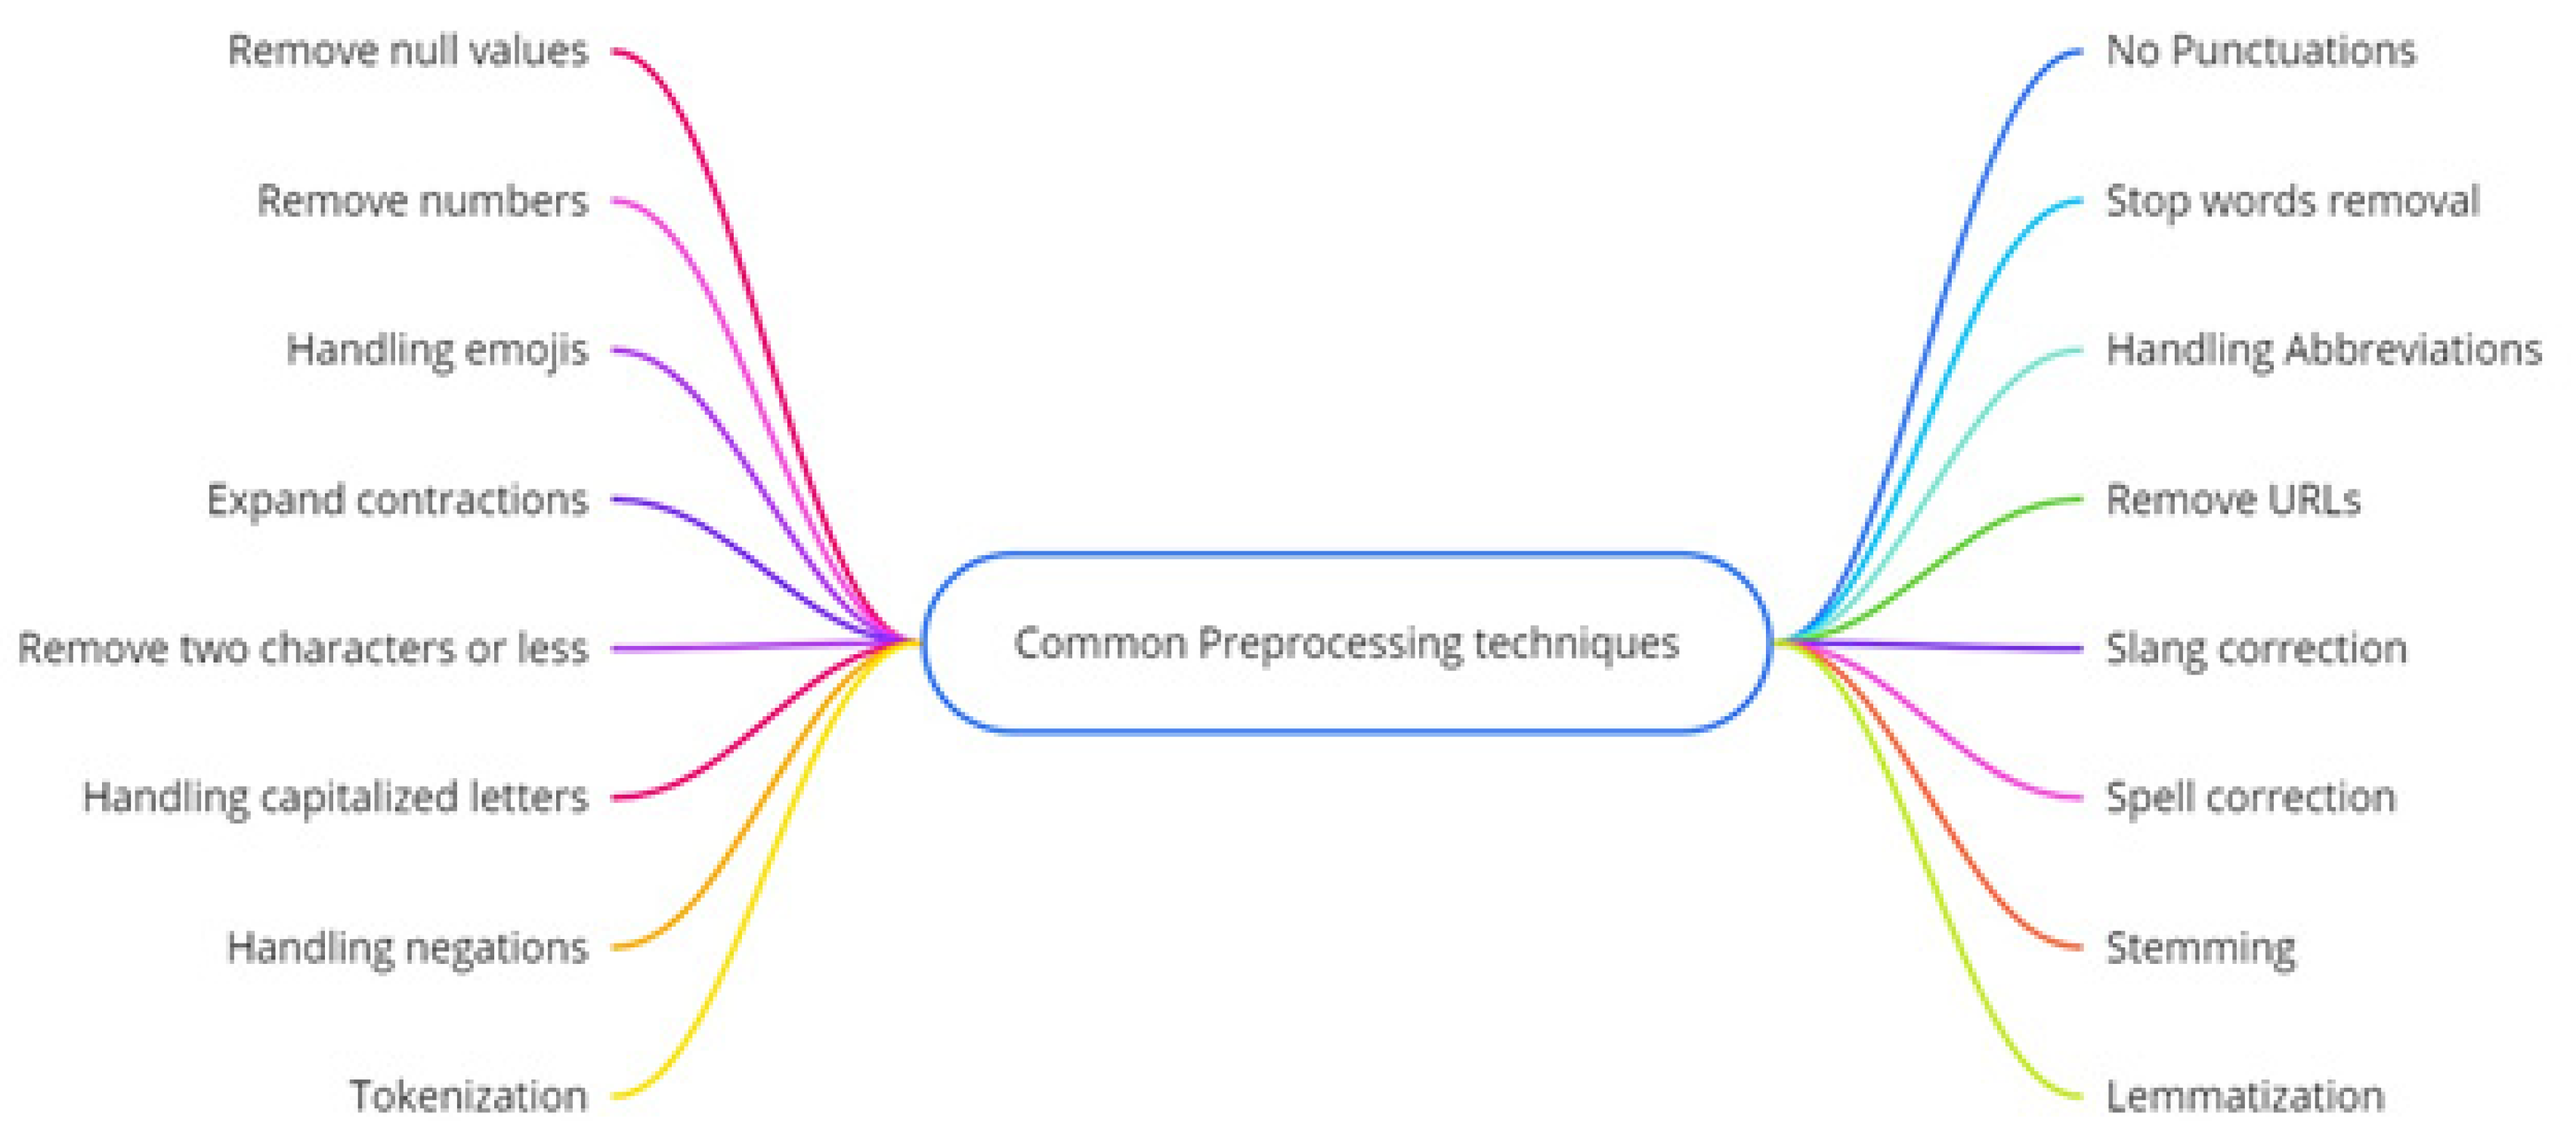
3.1.2. Text Cleaning

The second part of model focuses on text cleaning. At this stage, all the information that is not required is removed from the data. Various steps that can be used for preprocessing the text are shown below in Figure 3.
  • Transform to lowercase:
Transforming the characters to lowercase is an essential preprocessing step as it can considerably shorten the time required to process the text. For humans it is easy to comprehend that the words ‘great’ and ‘Great’ are the same, but a computer would consider these words as two different features that are required to be processed separately. Table 3 provides the transformation results of lowercasing the text.
  • Dealing with contractions:
An item that is formed by either condensing or merging 2 words is called a contraction. These terms include ‘won’t’ (will + not), ‘shouldn’t’ (should + not), etc. Expanding these contractions is an important preprocessing step for most NLP related tasks. Table 4 provides the outcome after the contractions have been expanded.
  • Tokenization:
It is a method of splitting a sequence of data such as textual data into tokens. This can be carries out at word, sentence, or paragraph level, or other meaningful components. Table 5 below shows the outcome after tokenization.
  • Removing words less than two characters:
Even after cleaning the data, there were certain meaningless words that were still present in the dataset. To remove these words, we employed a regular expression to remove words that were two character or less than that. Since these words are not providing useful information, therefore they are excluded from the dataset. Table 6 provides sample text and the effect of removing repetitive words from the text.
  • Delete repetitive words:
As we are using Twitter data, therefore it is essential to keep in mind that the words with hashtags repeat regularly and thus they do not provide key information to train our classifier. Therefore, excluding terms which begin with ‘@’ can be helpful. For example, airline name or a person’s name is mentioned as a hashtag, but they are not going to helpful in terms of sentiment analysis, therefore these words were removed. Table 7 shows the results of removing repeating words from the text.
  • Deleting punctuations:
Punctuation contains symbols including full stops, commas, question marks, exclamation marks, semi-colons, colons, ellipses, and brackets. Using string.punctuation, we eliminated punctuations from the text. Some punctuations were not deleted by the automated method, and they had to be removed through regular expression separately. Table 8 provides the results after the punctuations are removed.
  • Digit Deletion:
We excluded digits from the text because they did not provide any key information for the task of sentiment analysis. However, that is usually not the case for every NLP task. Table 9 shows the impact of digit deletion from the sample text.
  • Abbreviations and Slangs:
This phase consists of correcting any internet-related terminology or acronyms. We use preset dictionaries and incorporate them to translate slang or abbreviations to their real versions. For example, GOAT stands for “Greatest of All Time,” while OMG is for “Oh my goodness” or “Oh my God”. Table 10 shows the impact of handling slangs and abbreviations from the sample text.
  • Removing Stop-words:
The words that occur in English language most commonly such as ‘the’, ‘a’, ‘an’, and ‘in’. As these words are not going to provide useful information for sentiment analysis therefore, we are excluding these words from the tweet text. Table 11 shows the impact of stop word removal from the sample text.
  • Spelling mistakes:
Dealing with spelling mistakes can be an important preprocessing step that can be quite beneficial. Because users often make spelling errors, it might result in many word attributes belonging to the same root form. For example, various users may misspell the term ‘abbreviation’ in different ways, resulting in separate word attributes that must be evaluated, using extra time. Table 12 shows the impact of spell correction from the sample text.

3.1.3. Text Normalization

The technique of reducing a token to its basic shape is referred to as lemmatization. Stemming is another method which reduces an infectious phrase to its base shape. The Porter-2 technique [27] can also be used as it transforms every token to its stem shape. POS tagging and ‘WordNetLemmatizer()’ were used to do lemmatization. We picked lemmatization because it produces better results than stemming but takes much longer. We had to choose between quality and time, and we picked quality by utilizing lemmatization. Even though we are trying to reduce the time complexity for sentiment analysis, the impact of using lemmatization is worth the extra time for our case.

3.1.4. Word Representation

To generate features from our text, we will use the word2vec model. Word2vec algorithm utilizes a NN-based model to find word representations from a textual corpus. It is critical to complete this step prior to oversampling since it will significantly reduce processing time. Word2vec function create similar embeddings for words that occur in the same context.

3.1.5. Under-Sampling

To solve the issue of class imbalance, many techniques have been proposed through the use of DL [43] and ML. The oversampling approach is the most popular of all. The strategy’s central premise is to create various synthetic sample ratios while oversampling the minority class [44]. In normal circumstances, data loss becomes the main issue with the under-sampling method [45], but in case of bigger datasets we can achieve class balance while reducing the time complexity of the model by utilizing random majority under-sampling. In this technique, the size of the majority classes will be reduced to match the size of the less dominant classes. The samples will be removed randomly. Looking at the dataset, we can see most of the tweets are representing the negative class as compared to the other two classes. Figure 4 below shows the imbalance between the classes.

3.1.6. Sentiment Classification

It is an automated method of recognizing the text and categorizing it as +ve, −ve, or neutral depending on the emotions presented by consumers. SC utilizes NLP to check subjective data which helps you recognize how consumers feel about your products, services, or brand. In our study, we have utilized various ML algorithms to check the results of our model. ML classifiers, such as RF, MNB, SVM, GB, XGB, and DT, are the algorithms that have been used for experimentation. Although the results obtained through machine learning classifiers are mostly task dependent meaning that certain classifiers perform well for specific tasks such as sentiment analysis. In our case, XGB classifier performed the best, which was unexpected since most other research shows that RF classifier performs better. One possible reason for that might be the use of RMU to balance the data, which reduced the total number of samples for our classifier.

3.2. Dataset

For our research we utilize the Twitter US Airline Sentiment dataset which contains a total of 14640 tweets from several airlines. Twitter US Airline Sentiment dataset is used for sentiment analysis task which includes each major US airline’s issues. These Twitter data were scrapped in 2015, and volunteers were requested to first identify +ve, −ve, and neutral tweets, before classifying negative causes (such as “late flight” or “rude service”). This dataset utilizes tweets to determine client satisfaction. The information includes tweets from six different airlines. We will train the classifier using the customers’ tweets to predict the unseen data. We divided the dataset 75/25, with 75% training examples and 25% test examples. Table 13 lists the features of the dataset. The dataset was initially imbalanced, but since we applied random majority under-sampling on our training data, therefore some of the samples are removed from the dataset.

4. Results and Discussion

This segment contains the findings as well as discussion. We start by laying out the computer hardware as well as the software set up used for testing. Later, we discuss numerous assessment methods and performance of our model in relation to them. We used a variety of performance measurements, including precision, recall, F-measure. We also compared different ML classifiers.
Sentiment Analysis findings are affected by a number of things, including data pretreatment. Another critical component is the choice of classification algorithm to train and test the Twitter data. We examined the data with a variety of classifiers, including SVM, naive Bayes, and others, to determine the best classifier. XGB classifier outperformed other classifiers with respect to accuracy as well as F1 score.

4.1. Experimental Setup

All the experiments were tested using a machine with a 3.1 GHz Intel core i5 10th generation CPU, 16 GB of RAM, and a 500 GB solid state drive. Spyder was used to design and implement the model and conduct experiments in the Python computer programming language. Spyder is an open-source development environment for python developed by spyder project contributors.

4.2. Evaluation Metrics

The criteria utilized to evaluate our model in this work include accuracy and F1 measure. These measures are comparable with those employed in earlier research. In binary classification problems, we can use the following formulas to calculate these values.
P r e c i s i o n   =   T P F P + T P
R e c a l l   =   T P F N + T P  
F 1   =   2 * p r e c i s i o n * r e c a l l p r e c i s i o n + r e c a l l
However, in order to generalize to multi-class problems, we present different definitions for precision and recall while the formula for F1 stays the same. For the equations below ‘S’ refers to the value in the confusion matrix (i.e., values such as true positives, true neutrals and true negatives), ‘i’ refers to rows and ‘j’ refers to columns and ‘c’ refers to class number.
Precision: It is the fraction of occurrences where we correctly declared ‘i’ out of all instances where the algorithm declared ‘i’.
P r e c i s i o n c   =   S i i / S i i   +   Σ j = 1   t o   n ; i j   S i j
Recall: It is the fraction of occurrences where we correctly declared ‘i’ out of all of the instances where the actual state of the world is ‘i’.
R e c a l l c   =   S i i / S i i   +   Σ j = 1   t o   n ; i j   S j i
The precision and recall scores for each class may then be combined using various ways to obtain the overall precision and recall values for the model. Weighted average, micro average, and macro average are the three basic methods to calculate overall precision and recall. For our research, we provide the results by using weighted average precision, recall, and F1 score is calculated using Equation (3).
10-Fold Cross Validation: We utilized 10-fold cross validation for our classifiers to provide accurate assessment of the results. With this strategy, we have one dataset that is randomly divided into ten sections. We utilize nine of them for training and one tenth for testing. This technique is repeated ten times, with each tenth reserved for testing.

4.3. Classification Results

XGB classifier generated the best sentiment analysis scores with our Twitter data with an accuracy of 86.5% and weighted F1 score of 0.874. The confusion matrix below shows our classifier’s real versus expected labels. The horizontal axis displays the actual labels, while the vertical axis displays the classifier’s predictions. From lower right to the upper left, the light green diagonal values represent the “true positives” of the +ve, neutral, and −ve sentiment classes, respectively. Figure 5a,b provide confusion matrix for XGB and RF classifier, respectively, but they use only one-fold to create the confusion matrix, due to the limitations of the python library. The confusion matrix for multi-class classification can be created by using cross table that counts the number of occurrences between the true/actual classification and the predicted classification (known as two raters). Because the classes are placed in the rows and columns in the same order, the correctly categorized elements are positioned on the main diagonal from top left to bottom right and correspond to the number of times the two raters agree [46].
SVM and GB classifiers also generated good results for Sentiment Analysis with the supplied dataset, with an accuracy of 84.7% and 83.5%, respectively. The confusion matrix below compares our classifier’s actual versus expected labels using the SVM classifier. Figure 6a,b provide confusion matrix for SVM and GB classifier, respectively.

4.4. Comparison: Under-Sampling vs. No Oversampling

The results show that our under-sampling method provides competitive results in comparison to the results obtained without resampling. This under-sampling technique also reduces the time required to process the results for sentiment analysis. For our system, under-sampling takes less time to produce results by taking only 50% of the time in most cases in comparison to the no-resampling method. Since the RMU was applied to the training dataset, there is possibility of underfitting, which can be considered as a limitation. Under-sampling technique will become even more useful when the dataset is extremely large. Since the dataset used in our study was different from other studies that used under sampling techniques for sentiment analysis therefore it was omitted. Instead, a comparison with no resampling is provided. Table 14 provides a comparison in terms of accuracy and F1 score between under sampling and non under sampling results for various classifiers. Time is calculated for individual classifiers in both cases (i.e., RMU vs no-resampling) after the preprocessing has been completed. Time is calculated for each k-fold and then averaged over 10-folds. We can see that XGB produces the best results while consuming less amount of time in comparison to RF and GB. NB is the fastest but produces the worst results. DT produces comparable results while reducing the time significantly.

5. Discussion with Visualization

5.1. Positive Tweets before and after Preprocessing

We have utilized the word cloud that shows the words with the most impact in categorizing a tweet as positive. Figure 7a,b shows the difference between the results of preprocessing by comparing the top 200 words that were present in positive tweet class before and after the preprocessing. The words such as ‘JetBlue’ and ‘SouthwestAir’ were removed because these words do not represent positive sentiment. It is important to understand the impact of preprocessing step through visualization as we can see in Figure 7 that a lot of words that were not useful for identifying positive tweets are removed through preprocessing steps to provide a much cleaner text for sentiment analysis. Certain words, such as ‘much’ and ‘amp’, were kept in the text because these words were useful in providing better results. This makes sense as these words describe something that is not neutral. That means they either refer to something positive or something negative.

5.2. Neutral Tweets before and after Preprocessing

We have presented word clouds bellow which depict the top terms that influenced the categorizing of a tweet as neutral. The majority of terms in the neutral emotion word cloud are not carrying any positive or negative feeling. Figure 8a,b shows the difference between the results of preprocessing by comparing the top 200 words that were present in neutral tweet class before and after the preprocessing.

5.3. Negative Tweets before and after Preprocessing

We have presented the word clouds below which depict the top words that had an influence in categorizing a tweet as negative. The names of the airlines and other useless words were removed so that negative sentiment words become visible. Figure 9a,b shows the difference between the results of preprocessing by comparing the top 200 words that were present in positive tweet class before and after the preprocessing. It is important to understand the impact of the preprocessing step through visualization, as we can see in Figure 9 that a lot of words that were not useful for identifying negative tweets are removed through preprocessing steps to provide a much cleaner text for sentiment analysis. As we can see in Figure 9a, there are many random words, but these words were removed in Figure 9b as they were not required for negative tweets. In contrast, words such as ‘customer service’ and ‘service issue’ are more prominent after the preprocessing was applied.

6. Conclusions

This research addressed all of the design, execution, and assessment aspects of our extensive SA model in great detail. When using the Twitter dataset, the XGB classifier delivers the highest accuracy (86.5%). The tweet text alone is frequently insufficient to yield accurate categorization results. As a result, it is crucial to consider the dataset’s additional properties. For each bad tweet in the dataset, the attribute “negative reasons” was stated. The classification results for the negative class were therefore improved by merging the “negative reasons” and “negative reasons gold” with tweet content. Although that could result in a minor overfitting, it was decided to include it in the final text as the terms indicated in the −ve reasons can be valuable to anticipate unknown data.
Given that class imbalance is a problem in the majority of datasets, handling unbalanced data is crucial for each dataset. Resampling approach should thus be a part of your process. If the dataset is really huge, we can employ majority class under-sampling as we did for our study which can reduced the time complexity. In the alternative, we can also employ oversampling of the less dominant class if our dataset is smaller. However, if the dataset is very unbalanced, the classifier may over fit the class that is less dominating, which might result in a greater generalization error. We decided to use under-sampling as the dataset is not as severely unbalanced. We come to the conclusion that the area of sentiment analysis has greatly benefited from our model of sentiment analysis. Future studies can examine the effects of transformer-based techniques and develop a new sentiment analysis model for unbalanced datasets that can deal with multiclass classification issues with reduced time complexity.

Author Contributions

Conceptualization, S.N.A.; Data curation, M.H.; Formal analysis, M.H. and N.A.K.; Funding acquisition, S.N.A. and M.F.A.; Investigation, M.H., M.F.A. and N.A.K.; Methodology, M.H. and N.A.K.; Project administration, N.Z.J.; Resources, S.N.A.; Supervision, N.Z.J.; Writing—original draft, N.A.K.; Writing—review and editing, M.H. All authors have read and agreed to the published version of the manuscript.

Funding

This work was funded by the Deanship of Scientific Research at Jouf University under Grant Number (DSR2022-RG-0105).

Institutional Review Board Statement

Not applicable.

Informed Consent Statement

Not applicable.

Data Availability Statement

Not applicable.

Conflicts of Interest

The authors declare no conflict of interest.

References

  1. Medhat, W.; Hassan, A.; Korashy, H. Sentiment analysis algorithms and applications: A survey. Ain Shams Eng. J. 2014, 5, 1093–1113. [Google Scholar] [CrossRef] [Green Version]
  2. Alwakid, G.; Osman, T.; El Haj, M.; Alanazi, S.; Humayun, M.; Sama, N.U. MULDASA: Multifactor Lexical Sentiment Analysis of Social-Media Content in Nonstandard Arabic Social Media. Appl. Sci. 2022, 12, 3806. [Google Scholar] [CrossRef]
  3. Wang, C.; Zhang, P. The Evolution of Social Commerce: The People, Management, Technology, and Information Dimensions. Commun. Assoc. Inf. Syst. 2012, 31, 5. [Google Scholar] [CrossRef]
  4. Davies, A.; Ghahramani, Z. Language-independent Bayesian sentiment mining of Twitter. In Proceedings of the 5th SNA-KDD Workshop, San Diego, CA, USA, 21 August 2011; pp. 99–107. [Google Scholar]
  5. Pang, B.; Lee, L. Opinion Mining and Sentiment Analysis. Found. Trends Inf. Retr. 2008, 2, 1–135. [Google Scholar] [CrossRef] [Green Version]
  6. Taboada, M.; Brooke, J.; Tofiloski, M.; Voll, K.; Stede, M. Lexicon-Based Methods for Sentiment Analysis. 2011. Available online: http://direct.mit.edu/coli/article-pdf/37/2/267/1798865/coli_a_00049.pdf (accessed on 20 August 2022).
  7. Jain, P.K.; Pamula, R.; Srivastava, G. A systematic literature review on machine learning applications for consumer sentiment analysis using online reviews. Comput. Sci. Rev. 2021, 41, 10043. [Google Scholar] [CrossRef]
  8. Yadav, A.; Vishwakarma, D.K. Sentiment analysis using deep learning architectures: A review. Artif. Intell. Rev. 2019, 53, 4335–4385. [Google Scholar] [CrossRef]
  9. Ali, I.; Hameed, N. Hybrid Tools and Techniques for Sentiment Analysis: A Review. Int. J. Multidiscip. Sci. Eng. 2017, 8. Available online: https://www.researchgate.net/publication/318351105 (accessed on 22 August 2022).
  10. Arabnia, H.R.; Deligiannidis, L.; Hashemi, R.R.; Tinetti, F.G. Information and Knowledge Engineering; CSREA Press, Center for the Study of Race and Ethnicity in America: Providence, RI, USA, 2018. [Google Scholar]
  11. Rustam, F.; Khalid, M.; Aslam, W.; Rupapara, V.; Mehmood, A.; Choi, G.S. A performance comparison of supervised machine learning models for COVID-19 tweets sentiment analysis. PLoS ONE 2021, 16, e0245909. [Google Scholar] [CrossRef]
  12. Vashishtha, S.; Susan, S. Fuzzy rule based unsupervised sentiment analysis from social media posts. Expert Syst. Appl. 2019, 138, 112834. [Google Scholar] [CrossRef]
  13. Wassan, S.; Chen, X.; Shen, T.; Waqar, M.; Jhanjhi, N.Z. Amazon Product Sentiment Analysis using Machine Learning Techniques Amazon Product Sentiment Analysis using Machine Learning Techniques View project employing recent technologies for digital governance View project Amazon Product Sentiment Analysis using Machine Learning Techniques. Rev. Argent. 2021, 30, 695–703. [Google Scholar] [CrossRef]
  14. Jing, N.; Wu, Z.; Wang, H. A hybrid model integrating deep learning with investor sentiment analysis for stock price prediction. Expert Syst. Appl. 2021, 178, 115019. [Google Scholar] [CrossRef]
  15. Dzisevic, R.; Sesok, D. Text Classification using Different Feature Extraction Approaches. In Proceedings of the 2019 Open Conference of Electrical, Electronic and Information Sciences (eStream), Vilnius, Lithuania, 25 April 2019; pp. 1–4. [Google Scholar] [CrossRef]
  16. Humayun, M.; Alsayat, A. Prediction Model for Coronavirus Pandemic Using Deep Learning. Comput. Syst. Sci. Eng. 2022, 40, 947–961. [Google Scholar] [CrossRef]
  17. Yang, L.; Li, Y.; Wang, J.; Sherratt, R.S. Sentiment Analysis for E-Commerce Product Reviews in Chinese Based on Sentiment Lexicon and Deep Learning. IEEE Access 2020, 8, 23522–23530. [Google Scholar] [CrossRef]
  18. Chakraborty, K.; Bhatia, S.; Bhattacharyya, S.; Platos, J.; Bag, R.; Hassanien, A.E. Sentiment Analysis of COVID-19 tweets by Deep Learning Classifiers—A study to show how popularity is affecting accuracy in social media. Appl. Soft Comput. 2020, 97, 106754. [Google Scholar] [CrossRef] [PubMed]
  19. Dogra, V.; Singh, A.; Verma, S.; Kavita; Jhanjhi, N.Z.; Talib, M.N. Analyzing DistilBERT for Sentiment Classification of Banking Financial News. In Intelligent Computing and Innovation on Data Science; Springer: Singapore, 2021; pp. 501–510. [Google Scholar] [CrossRef]
  20. Zainuddin, N.; Selamat, A.; Ibrahim, R. Hybrid sentiment classification on twitter aspect-based sentiment analysis. Appl. Intell. 2017, 48, 1218–1232. [Google Scholar] [CrossRef]
  21. Birjali, M.; Kasri, M.; Beni-Hssane, A. A comprehensive survey on sentiment analysis: Approaches, challenges and trends. Knowl.-Based Syst. 2021, 226, 107134. [Google Scholar] [CrossRef]
  22. Hussein, D.M.E.-D.M. A survey on sentiment analysis challenges. J. King Saud Univ.-Eng. Sci. 2018, 30, 330–338. [Google Scholar] [CrossRef]
  23. Humayun, M.; Khalil, M.I.; Alwakid, G.; Jhanjhi, N.Z. Superlative Feature Selection Based Image Classification Using Deep Learning in Medical Imaging. J. Healthc. Eng. 2022, 2022, 7028717. [Google Scholar] [CrossRef]
  24. Almuayqil, S.N.; Humayun, M.; Jhanjhi, N.Z.; Almufareh, M.F.; Javed, D. Framework for Improved Sentiment Analysis via Random Minority Oversampling for User Tweet Review Classification. Electronics 2022, 11, 3058. [Google Scholar] [CrossRef]
  25. Hasan, A.; Moin, S.; Karim, A.; Shamshirband, S. Machine Learning-Based Sentiment Analysis for Twitter Accounts. Math. Comput. Appl. 2018, 23, 11. [Google Scholar] [CrossRef] [Green Version]
  26. Prusa, J.; Khoshgoftaar, T.M.; Dittman, D.J.; Napolitano, A. Using Random Undersampling to Alleviate Class Imbalance on Tweet Sentiment Data. In Proceedings of the 2015 IEEE International Conference on Information Reuse and Integration, San Francisco, CA, USA, 13–15 August 2015; pp. 197–202. [Google Scholar] [CrossRef]
  27. Sayyed, Z.A. Study of Sampling Methods in Sentiment Analysis of Imbalanced Data. 2021. Available online: http://arxiv.org/abs/2106.06673 (accessed on 27 August 2022).
  28. Ghosh, K.; Banerjee, A.; Chatterjee, S.; Sen, S. Imbalanced Twitter Sentiment Analysis using Minority Oversampling. In Proceedings of the 2019 IEEE 10th International Conference on Awareness Science and Technology (iCAST), Morioka, Japan, 23–25 October 2019; pp. 1–5. [Google Scholar] [CrossRef]
  29. Rao, K.N.; Reddy, C.S. A novel under sampling strategy for efficient software defect analysis of skewed distributed data. Evol. Syst. 2019, 11, 119–131. [Google Scholar] [CrossRef]
  30. Zhou, S.; Li, X.; Dong, Y.; Xu, H. A Decoupling and Bidirectional Resampling Method for Multilabel Classification of Imbalanced Data with Label Concurrence. Sci. Program. 2020, 2020, 8829432. [Google Scholar] [CrossRef]
  31. Aljarah, I.; Al-Shboul, B.; Hakh, H. Online Social Media-Based Sentiment Analysis for US Airline Companies. 2017. Available online: https://www.researchgate.net/publication/315643035 (accessed on 5 September 2022).
  32. Liu, Y.; Bi, J.-W.; Fan, Z.-P. Multi-class sentiment classification: The experimental comparisons of feature selection and machine learning algorithms. Expert Syst. Appl. 2017, 80, 323–339. [Google Scholar] [CrossRef] [Green Version]
  33. Catal, C.; Nangir, M. A sentiment classification model based on multiple classifiers. Appl. Soft Comput. 2017, 50, 135–141. [Google Scholar] [CrossRef]
  34. Eler, D.M.; Grosa, D.; Pola, I.; Garcia, R.; Correia, R.; Teixeira, J. Analysis of Document Pre-Processing Effects in Text and Opinion Mining. Information 2018, 9, 100. [Google Scholar] [CrossRef] [Green Version]
  35. Obiedat, R.; Qaddoura, R.; Al-Zoubi, A.M.; Al-Qaisi, L.; Harfoushi, O.; Alrefai, M.; Faris, H. Sentiment Analysis of Customers’ Reviews Using a Hybrid Evolutionary SVM-Based Approach in an Imbalanced Data Distribution. IEEE Access 2022, 10, 22260–22273. [Google Scholar] [CrossRef]
  36. Bibi, M.; Abbasi, W.A.; Aziz, W.; Khalil, S.; Uddin, M.; Iwendi, C.; Gadekallu, T.R. A novel unsupervised ensemble framework using concept-based linguistic methods and machine learning for twitter sentiment analysis. Pattern Recognit. Lett. 2022, 158, 80–86. [Google Scholar] [CrossRef]
  37. Mubarok, M.S.; Adiwijaya; Aldhi, M.D. Aspect-based sentiment analysis to review products using Naïve Bayes. In AIP Conference Proceedings; AIP Publishing: Melville, NY, USA, 2017. [Google Scholar] [CrossRef] [Green Version]
  38. Bahadir, C.D.; Wang, A.Q.; Dalca, A.V.; Sabuncu, M.R. Deep-Learning-Based Optimization of the Under-Sampling Pattern in MRI. IEEE Trans. Comput. Imaging 2020, 6, 1139–1152. [Google Scholar] [CrossRef]
  39. Guzmán-Ponce, A.; Valdovinos, R.M.; Sánchez, J.S.; Marcial-Romero, J.R. A New Under-Sampling Method to Face Class Overlap and Imbalance. Appl. Sci. 2020, 10, 5164. [Google Scholar] [CrossRef]
  40. Ghazi, D.; Szpakowicz, S. Prior versus Contextual Emotion of a Word in a Sentence. Association for Computational Linguistics. 2012. Available online: www.wjh.harvard.edu/ (accessed on 7 September 2022).
  41. Agarwal, B.; Mittal, N. LNCS 7817-Optimal Feature Selection for Sentiment Analysis. In Computational Linguistics and Intelligent Text Processing; Springer: Berlin/Heidelberg, Germany, 2013. [Google Scholar]
  42. Badjatiya, P.; Gupta, S.; Gupta, M.; Varma, V. Deep Learning for Hate Speech Detection in Tweets. In Proceedings of the 26th International Conference on World Wide Web Companion, Perth, Australia, 3–7 April 2017; pp. 759–760. [Google Scholar] [CrossRef] [Green Version]
  43. Dablain, D.; Krawczyk, B.; Chawla, N.V. DeepSMOTE: Fusing Deep Learning and SMOTE for Imbalanced Data. IEEE Trans. Neural Netw. Learn. Syst. 2022, 1–15. [Google Scholar] [CrossRef]
  44. Mukherjee, A.; Mukhopadhyay, S.; Panigrahi, P.K.; Goswami, S. Utilization of Oversampling for multiclass sentiment analysis on Amazon Review Dataset. In Proceedings of the 2019 IEEE 10th International Conference on Awareness Science and Technology (iCAST), Morioka, Japan, 23–25 October 2019. [Google Scholar] [CrossRef]
  45. Alnatara, W.D.; Khodra, M.L. Imbalanced Data Handling in Multi-label Aspect Categorization using Oversampling and Ensemble Learning. In Proceedings of the 2020 International Conference on Advanced Computer Science and Information Systems (ICACSIS), Depok, Indonesia, 17–18 October 2020; pp. 165–170. [Google Scholar] [CrossRef]
  46. Grandini, M.; Bagli, E.; Visani, G. Metrics for Multi-Class Classification: An Overview. 2020. Available online: http://arxiv.org/abs/2008.05756 (accessed on 10 September 2022).
Figure 1. Sentiment Analysis techniques.
Electronics 11 03624 g001
Figure 2. Model for sentiment analysis via under-sampling.
Electronics 11 03624 g002
Figure 3. Common preprocessing techniques.
Electronics 11 03624 g003
Figure 4. Class distribution.
Electronics 11 03624 g004
Figure 5. (a) Confusion matrix–XGB classifier with best accuracy (b) Confusion matrix–RF classifier with second best accuracy.
Electronics 11 03624 g005
Figure 6. (a) Confusion matrix–SVM classifier with best accuracy and (b) confusion matrix–GB classifier with second best accuracy.
Electronics 11 03624 g006
Figure 7. (a) Word Cloud of positive tweets—before preprocessing and (b) Word Cloud of positive tweets—after preprocessing.
Electronics 11 03624 g007
Figure 8. (a) Word Cloud of neutral tweets—before preprocessing and (b) Word Cloud of neutral tweets—after preprocessing.
Electronics 11 03624 g008
Figure 9. (a) Word Cloud of negative tweets—before preprocessing and (b) Word Cloud of negative tweets—after preprocessing.
Electronics 11 03624 g009
Table 1. Sentiment Analysis literature review.
CitePurposePositiveFindings
[25]A ensemble technique which utilizes a sentiment analyzer via techniques based on machine learning for the purpose of sentiment analysisA unique contrast of opinion lexicons including Senti_Word_Net and Text_Blob is shown to reveal the most useful one that can be used.The study only provides accuracy as a performance measure. Other measures might be needed to validate the results.
[26]Study examines the impact of sampling through the use of random under-sampling with multiple splits of +ve/−ve class distribution. Experimental results reveal that Random Under-sampling enhances classification performance considerably when compared to no data sampling.This technique may lead to underfitting on certain datasets.
[27]This paper looks at the various sampling techniques for sentiment analysis on two different severely unbalanced datasets. One dataset comprises online user evaluations from the food portal Epicurious, while the other contains comments sent to Planned Parenthood.An information gain-based attribute selection approach is utilized to limit the number of attributes to a manageable space. A variety of sample approaches were then used to ameliorate the class imbalance problem, which were then examined.None
[28]In opinion mining, real user tweets were utilized to systematically check the impact of class inequality problem. To deal with challenge of class inequality, the up-sampling of the less dominant class was utilized.Results reveal that minority over-sampling dependent approaches can deal with the challenge of class label inequality to a considerable margin.Approach was not checked for the problems of multi-class classification.
[29]The study focuses on fixing the problem of class imbalance and reduce the least useful instances from the dominant subgroups.The study detects the most mis-classified instances based on KNN successfully.The approach may not perform as well for certain smaller datasets
[30]The study decreases the label variation by separating the hugely coeval item of the pre-dominant and less-dominant instances and checking the impact of those instances during re-sampling.The study shows the usefulness of the algorithm especially with data that have decent disparity between dominant and less dominant instances.The parameters used in the study directly influences the results of the algorithm
[31]This study performs Sentiment Analysis on the replies of the customers regarding different airlines through feature engineering and ML.Feature engineering technique is utilized to select the most useful attributes, that not only increases the usefulness of the model but also reduces the time required to train.The label inequality in the classes in some of the bigger datasets can lead to problem of overfitting
[32]A feature engineering method is used in order to detect the most useful attributes which can be utilized for training an ML based technique.This study provides enhanced accuracy in comparison to the base method via effective feature selection. The approach might not work well for imbalanced datasets.
[33]In this study, the influence of various categorization systems on Turkish opinion mining is being investigated.The results show that using different classifiers can enhance the results for singular classifiersMulti-classification models can offer promising results, but it is not yet fully matured.
[34]The implementation of an appropriate preprocessing method may result in enhanced sentiment categorization results.This study successfully demonstrates that combining numerous preprocessing techniques is crucial in selecting the best classification outcomes.Datasets with class inequality are not explored.
[35]It provides a hybrid technique that combines SVM algorithm with PSO and multiple up-sampling approaches to handle the class imbalance problem.The research proves that the advised technique is useful and provides better results when compared to the other options in every parameter investigated.Languages other than Arabic can be investigated for this technique.
[36]An original unsupervised machine learning strategy formed on hierarchical categorization is advised for sentiment analysis on Twitter network.The results acquired using this unsupervised learning approach are comparable to those obtained using other supervised learning methods.Unigrams are used to examine Boolean and TF-IDF functions. Different versions of n-gram can also be studied. Larger datasets could also be investigated.
[37]Sentiment analysis was utilized to assess and find sentiment polarity from reviews of various products depending on a specific product feature.This study was divided into three phases: data pretreatment with POS tagging, selection of features with Chi Square, and sentiment polarity classification with Nave Bayes.Review dataset was small. Experimentation on larger dataset might reveal different results
[38]Providing a formulation that allows a data-driven optimized under-sampling pattern at a particular sparsity level.Under-sampling masks are data-dependent, and they vary based on the imaged anatomy, but their performance is good with different reconstruction methodsNone
[39]2-stage under-sampling strategy that integrates a clustering algorithm for removing noisy samples and cleaning the decision boundary with the minimal spanning tree algorithm for dealing with class inequalityAn exhaustive experimental analysis demonstrates that the novel algorithm outperforms other under-sampling approaches using conventional classification models.Strategy is only tested for binary classification problems. Its performance on multi-classification problems still needs to be explored
[40]Provide a strategy for classifying sentences by emotion classes that takes into account the contextual emotion of a word as well as the structure of the phrase.This potential strategy surpasses both a Bag-of-Words representation-based method and a model based solely on the preceding emotions of words.Automatically differentiating between antecedent and contextual emotionwith an emphasis on investigating aspects are important.
[41]Unigrams and bigrams are retrieved from the text and used to construct composite features. Adjectives and adverbs based on Part of Speech (POS) are also retrieved. To extract important features, several feature selection approaches are applied. The impact of different feature sets on sentiment categorization is also examined using ML approaches.The effects of various feature categories are studied using four typical datasets. Experiment findings reveal that composite features derived from dominant unigram and bigram features outperform other features in sentiment categorization.With respect to accuracy and execution time, the Boolean-MNB method outperforms the Support Vector Machine for sentiment analysis.
[42]The purpose of this study is to be able to identify a tweet as racist, sexist, or neither, considering the challenges associated with the natural language.Experiments are performed with various DL algorithms to learn semantic word embeddings so that the complexity can be dealt with.None
Table 2. Combining features.
TextNegative Reasons
@VirginAmerica it’s really aggressive to blast obnoxious “entertainment” in your guests faces & they have little recourseBad Flight
@VirginAmerica you guys messed up my seating... I reserved seating with my friends and you guys gave my seat away... I want free internetCustomer Service Issue
Table 3. Outcome of lower-case transformation.
Sample TextAfter LowercaseSentiment
This was a wonderful experience. I must commend you for a wonderful Flightthis was a wonderful experience. i must commend you for a wonderful flightPositive
Table 4. Outcome after dealing with contractions.
Sample TextDealing with ContractionsSentiment
they shouldn’t have delayed the flight now i won’t be able to reach on timethey should not have delayed the flight now i will not be able to reach on timeNegative
Table 5. Outcome after tokenization.
Sample TextTokenizationSentiment
they should not have delayed the flight‘they’ ‘should’ ‘not’ ‘have’ ‘delayed’ ‘the’ ‘flight’Negative
Table 6. Outcome after removing words less than two characters.
Sample TextRemoving Repeating WordsSentiment
we should fly and go before the rain startsshould fly and before the rain startsNegative
Table 7. Outcome after deleting repetitive words.
Sample TextRemoving Repeating WordsSentiment
@JetBlue they should not have delayed the flightthey should not have delayed the flightNegative
Table 8. Outcome after deleting punctuations.
Sample TextDeleting PunctuationsSentiment
flight was amazing, but took longer than expected.flight was amazing but took longer than expectedNeutral
Table 9. Outcome after removing digits from sample tweet.
Sample TextDigit DeletionSentiment
was flight 717 delayed should have been the air 30 min agowas flight delayed should have been air min agoNegative
Table 10. Outcome after dealing with abbreviations and slangs.
Sample TextHandling Slangs and AbbreviationsSentiment
your flight vouchers never seem apply nyc flightsyour flight vouchers never seem apply new york city flightsNegative
Table 11. Output after removing stop-words.
Sample TextRemoving Stop-WordsSentiment
your flight vouchers never seem to apply to new york city flightsflight vouchers never seem apply new york city flightsNegative
Table 12. Outcome after spelling mistake correction.
Sample TextSpell CorrectionSentiment
flight went well many thanks wondrful expirinceflight went well many thanks wonderful experiencePositive
Table 13. Feature description of selected dataset.
Dataset Attributes Details
Text Text of the tweet as typed by the user.
Airline Official name of the airline
Airline-Sentiment-Confidence A numbered attribute which shows the trust rate of grouping the text to one of the categories.
Airline-Sentiment Class label of tweets (+ve, neutral, −ve).
Negative Reason The reason to consider a tweet as −ve as per the experts.
Negative-Reason-Confidence The amount of trust in deciding the −ve reason with respect to a −ve text.
Retweet Count A numerical value that represents retweets for a tweet.
Table 14. Classification results.
ClassifiersAccuracyWeighted F1-Score
RMU RMU Time (Seconds)No-ResamplingNR Time (Seconds)RMU RMU Time (Seconds)No-ResamplingNR Time (Seconds)
XGB86.5%96 s88.8%177 s0.874102 s0.883180 s
RF86.2%234 s88.3%456 s0.872244 s0.881460 s
SVM84.7%126 s85.9%345 s0.865132 s0.875355 s
GB83.5%324 s84.4%846 s0.855320 s0.871840 s
DT83.1%18 s83.8%30 s0.84829 s0.85748 s
NB76.5%4 s68.5%8 s0.72815 s0.70529 s
Publisher’s Note: MDPI stays neutral with regard to jurisdictional claims in published maps and institutional affiliations.

