Article

Infrared Weak and Small Target Detection Based on Top-Hat Filtering and Multi-Feature Fuzzy Decision-Making

School of Automation, Central South University, Changsha 410083, China
*
Author to whom correspondence should be addressed.
Electronics 2022, 11(21), 3549; https://doi.org/10.3390/electronics11213549
Submission received: 28 September 2022 / Revised: 22 October 2022 / Accepted: 28 October 2022 / Published: 31 October 2022

Abstract

:
Infrared weak and small target detection in a complex background has always been a research hotspot in the fields of area defense and long-range precision strikes. Among them, the single-frame infrared weak and small target detection technology is even more difficult to study due to factors such as lack of target motion information, complex background, and low signal-to-noise ratio. Aiming at the problem of a high false alarm rate in infrared weak and small target detection caused by the complex background edges and noise interference in infrared images, this paper proposes an infrared weak and small target detection algorithm based on top-hat filtering and multi-feature fuzzy decision-making. The algorithm first uses the multi-structural element top-hat operator to filter the original image and then obtains the suspected target area through adaptive threshold segmentation; secondly, it uses image feature algorithms, such as central pixel contrast, regional gradient, and directional gradient, to extract the feature information of the suspected target at multiple scales, and the fuzzy decision method is used for multi-feature fusion to achieve the final target detection. Finally, the performance of the proposed algorithm and several existing comparison algorithms are compared using the measured infrared sequence image data of five different scenarios. The results show that the proposed algorithm has obvious advantages in various performance indicators compared with the existing algorithms for infrared image sequences in different interference scenarios, especially for complex background types, and has a lower performance under the condition of ensuring the same detection rate and false alarm rate and in meeting the real-time requirements of the algorithm.

1. Introduction

As an important target detection technology at present, infrared search and tracking systems are widely used in military detection, target positioning, object tracking, and other fields due to their unique advantages, such as high resolution, strong smoke penetration ability, and simple structure [1,2,3]. Relevant scholars have carried out a lot of research on infrared weak and small target detection, but the detection of high-threat targets, such as UAVs and missiles, still faces huge difficulties. Due to the long imaging distance, complex background, influence of spatial noise, and the interference of the imaging equipment [4], these targets often appear as point-like weak targets on the image, lacking structure and texture information [5]. The signal-to-noise ratio is low, and the detection is difficult; so, it is necessary to design an algorithm that can effectively detect it in complex backgrounds. In recent years, more and more infrared weak and small target detection algorithms have been proposed; these can be divided into two categories: single-frame detection and multi-frame detection. Multi-frame detection utilizes the continuity between image sequences; this can suppress the image background with strong correlation and enhance the target area with obvious changes [6]. Currently, the commonly used multi-frame detection algorithms include three-dimensional filtering [7], multi-level hypothesis testing [8], and a new efficient adaptive spatial filter [9]. Compared with multi-frame detection algorithms, single-frame detection has the advantages of good real-time performance and fast response. Single-frame detection uses the difference between the gradient and the gray distribution of the target area and the background area to detect the target. The mainstream single-frame weak and small target detection includes filtering-based detection algorithms. For example, Deshpande [10] suppresses the background through max-mean and max-median filtering. Bai et al. proposed top-hat operator filtering using open operation [11]. However, these algorithms are very sensitive to strong noise points and edges in the background and are not suitable for infrared weak and small target detection in complex scenes. Moreover, because the size of the weak and small targets is unknown, the filter window is too large or too small for the target size, which will affect the detection effect. Human visual system (HVS) detection algorithms have received extensive attention due to their simplicity and excellent performance. Chen et al. [12] first proposed the local contrast measure (LCM) and the multi-scale local contrast measure (MLCM), based on the pixel difference between the target area and the surrounding background. Although it can detect objects in simple backgrounds, it has an obvious plaque effect and has a low detection rate in complex backgrounds. On this basis, Han et al. proposed an improved local contrast measure algorithm (ILCM) [13]; although it can enhance the target, it is more sensitive to high-pixel noise and background areas. To overcome edge interference in images, Zhang et al. proposed an algorithm based on local intensity and gradient (LIG) [14] that exploits the gradient features of edges to remove the interference. After that, the multi-scale patch-based local contrast measure (MPCM) [15], the multi-scale relative local contrast measure (MRLCM) [16], and the double local contrast measure (DLCM) [17] were successively proposed; these improved the anti-interference ability of the algorithm to a certain extent; however, when the target is submerged in the complex background, these algorithms still perform poorly. In addition, using filtering or a local window to traverse the entire image increases the detection time; thus, it cannot be applied in some practical applications with strict real-time requirements.
In order to improve the problem of the weak detection performance of the existing algorithms in image interference areas such as edges and noises, this paper proposes an infrared weak and small target detection algorithm based on multi-structural element top-hat filtering and multi-feature fuzzy decision-making [18]. The algorithm first preprocesses the original image with the multi-structural element top-hat and improves the universality of the top-hat operator with targets of different sizes by designing an adaptive filtering window. Secondly, adaptive threshold segmentation is performed on the processed image to obtain the targets of the suspected regions. Compared with the existing algorithms that need to constantly try to select the segmentation coefficient k, this paper designs an adaptive calculation method for the segmentation coefficient k. Then, according to the physical characteristics of the target, various features such as central pixel contrast and regional gradient are extracted for each suspected region. Finally, the real target area is determined according to the fuzzy decision method. The experiments show that the algorithm proposed in this paper has a lower false alarm rate and a shorter processing time than the existing algorithms under the same detection rate and has strong real-time and practicality.

2. Methodology

In this paper, an infrared weak and small target detection algorithm based on multi-structural element top-hat filtering and multi-feature fuzzy decision-making is proposed. The overall structure of the algorithm is shown in Figure 1. The algorithm is divided into two parts: image preprocessing and fuzzy decision-making. First, the original infrared image is inputted, and the multi-structural element top-hat filter is used to preprocess the image to achieve the effect of initially suppressing the background and enhancing the high-pixel area. Using adaptive threshold segmentation processing, the suspected target area is screened out. Secondly, according to the physical characteristics of the small infrared targets, this paper proposes four feature extraction algorithms by citing or based on existing algorithms, extracting multiple features from the suspected target area, eliminating the suspected target through fuzzy decision-making, and determining the real target location.

2.1. Multi-Structural Element Top-Hat Filtering

The top-hat algorithm is one of the current infrared weak and small detection algorithms. It mainly includes the open operation processing of the erosion and expansion of the image. The erosion can filter the image to achieve the effect of reducing the target and eliminating noise smaller than the size of the structure element. Dilation is employed to use structural elements to supplement the image, absorb the background around the target, highlight the target, and fill the target hole.
The top-hat operation is expressed as
g = f ( f b )
where f represents the original image, b represents the structural element, and f b represents the opening operation and is specifically represented as f b = ( f Θ b ) b . Θ represents the erosion operation, and represents the dilation operation.
When detecting weak and small infrared targets, the size of the structural element should be equal to or slightly larger than the target size, but the target size is unknown. If the selected structural element is too small, the size of the structural element will be smaller than the actual size of the target, and the target will be suppressed, as shown in Figure 2a, which leads to the failure of the detection of larger targets.
Similarly, when the size of the detected target is small and the size of the structural element selected is too large, the pixel size of the weak target is too small relative to the size of the structural element, resulting in a decrease in the detection rate. Therefore, this paper uses a multi-structural element top-hat filtering algorithm that adaptively selects the size of the structural element. First, multi-structural element processing is performed on the input image to obtain different local pixel weights, and then, the adaptive response G m u l is obtained.
G m u l = m a x { g 1 , g 2 , , g n }
where g i represents f ( f Θ b i ) b i , and b i represents the i th structural element.
Top hat filtering can enhance the target with a large difference in gray value from the surrounding background and can suppress the more uniform background in the image. At the same time, the use of multiple structural elements can avoid the problem of missed detection and false detection caused by a target size which is too large or too small compared with the filter window size. However, due to noise, edge, and other interferences in the image, the image filtered by the top-hat filtering still cannot effectively detect the target.
In this paper, three structural element sizes of 2 × 2, 3 × 3, and 5 × 5 are selected for different infrared sequences and are calculated and adaptively selected, as shown in Figure 2b.

2.2. Adaptive Threshold Segmentation

After top-hat filtering, the background area is initially suppressed, the contrast of the target area is significantly improved compared with the background, and the signal-to-noise ratio is effectively improved, but there are still interferences, such as noise and edge clutter. In the resulting image after top-hat filtering, the area with higher pixels represents a greater probability of being the target. Therefore, this paper further removes the low-pixel area and obtains the suspected target area through adaptive threshold segmentation. The expression of the threshold value selected by this algorithm in the threshold segmentation is:
T h = μ + K × σ
where σ represents the standard deviation of the image after top-hat filtering, µ represents the pixel average value of the image after filtering, and K represents the segmentation coefficient.
If the maximum pixel value can be segmented as Km, the expression calculated at this time is the formula shown below:
K m = m a x ( f ( x , y ) ) μ σ
where f(x,y) is the pixel in the filtered image.
If it can only segment the average value of non-zero pixels in the filtered image, at this time K is recorded as Kmean, and the expression calculating Kmean at this time is shown in the formula.
K m e a n = m e a n ( f ( x , y ) ) u σ | f ( x , y ) 0
For mean(f(x,y)), it is:
0 < m e a n ( f ( x , y ) ) < m a x ( f ( x , y ) )
m a x ( f ( x , y ) ) < m e a n ( f ( x , y ) ) + m a x ( f ( x , y ) ) < 2 × m a x ( f ( x , y ) )
Therefore:
T h = m e a n ( f ( x , y ) ) + m a x ( f ( x , y ) ) 2
Th is a value between half of the maximum pixel and the maximum pixel and can be adaptively adjusted according to the complexity of the image.
Because the background is relatively simple, it is easier to distinguish the real target after top-hat filtering compared to the image with a complex background. Therefore, when selecting the suspected target area, the number of suspected targets in the complex background image should be larger than that in the simple background image because the number of non-zero pixels in the image after the top-hat filtering of the complex background image is much larger than that of the simple background image. Therefore, the mean of the non-zero pixels in Equation (5) after complex image filtering is close to the mean value of all the pixels, while the mean of the non-zero pixels after the filtering of the image in a simple background is much larger than the mean value of all the pixels, achieving the effect of adaptive threshold segmentation according to the complexity of the image. Therefore, the final threshold segmentation coefficient is
K = K m + K m e a n 2
After the segmentation coefficients are calculated, threshold segmentation is performed on the filtered image according to Equation (9).
f ( x , y ) = { 0                               i f f 0 ( x , y ) T h f 0 ( x , y )         i f f 0 ( x , y ) > T h }
After threshold segmentation, a grayscale image containing the real target and the suspected target is obtained, and then, the suspected target is eliminated, and the position of the real target is determined through multi-feature fuzzy decision-making.

2.3. Multi-Feature Fuzzy Decision-Making

In the infrared image, the difference between the target, the background and the edge is obvious in different features. Usually, small infrared targets are generally in the form of circular patches or dots, showing the characteristics of high central pixels and radiating to the surroundings, similarly to the two-dimensional Gaussian function. The difference between adjacent pixels in the background area is usually small, or the pixels in the edge area change greatly along a certain direction. The noise often appears as an isolated bright spot without the feature of spreading around, which is quite different from the target. Relying on the above feature differences, after the original image is subjected to top-hat filtering and threshold segmentation to obtain the saliency map of the suspected target, this paper performs the fuzzy decision through multi-feature extraction to determine the target position.
First, the suspected target area in the suspected target saliency map is extracted. As the number of pixels in the suspected target area is affected by the target size, this paper adaptively selects the feature extraction window size according to the size of the suspected target area in the salient image after threshold segmentation. Then, according to the physical characteristics of the target, the existing algorithm is cited and improved to calculate the multiple feature values of the suspected area, including the filtered pixel maximum value, the central pixel contrast, the regional gradient, and the sum of the directional gradients of the window.

2.3.1. Maximum Pixel Value after Filtering

After the image is filtered by top-hat filtering, the larger the value of the pixel, the greater the probability of belonging to the target area; so, the maximum value of each suspected target window is processed to obtain Ij.
I j = m a x { f ( x , y ) } | ( f ( x , y ) D j ) ( j = 0 , 1 , 2 n )
In the formula, Dj is the jth suspected target area, f(x,y) is the pixel value of the pixel in the area, and n is the total number of suspected target areas.

2.3.2. Sum of Orientation Gradients

According to the characteristic that the central image of the target has a high value and radiates around, this paper proposes the feature calculation of the sum of the directional gradients. The window is divided into the 8 directions of {0°, 45°, 90°, …, 360°}, and the gradient of each direction of the window is calculated separately. Taking a 5 × 5 window as an example, the sum of the directional gradient Lj expressed as
L j = = 8 × f 0 ( x , y ) f θ ( x , y ) d m a x ( θ = 0 , 45 , 360 )
In the formula, Lj represents the directional gradient sum of the jth window, f0(x,y) represents the pixel value in the center of the window, and f0(x,y)d max represents the pixel value of the pixel furthest from the center point in the window in the direction of θ, as shown in Figure 3a.

2.3.3. Center Pixel Contrast

The local contrast algorithm utilizes the characteristics of the target surrounded by the background. By calculating the ratio of the central high-pixel area to the surrounding low-pixel area surrounding the background, the target area is highlighted, and the background area is suppressed. Inspired by the local contrast, this paper proposes the central pixel contrast. The specific expression is:
Q j = f 0 ( x , y ) 2 1 N j 1 i = 1 N j f i j ( x , y )
where f0(x,y) represents the pixel value in the center of the window, Nj represents the number of pixels in the jth window, and fij(x,y) represents the pixel size of a pixel in the window. So, 1 / ( N j 1 ) i = 1 N j f i j ( x , y ) represents the pixel average of the window, excluding the center point.

2.3.4. Regional Gradient

In the suspected target area, there is a background edge area with a high pixel value, and this area has the characteristic of having a large difference between the pixels on both sides of the edge, such as the edge of the cloud layer, the junction of the sea surface and the sky, etc. Figure 4 lists the background edge areas of several suspected targets, including the junction area between the ground and vegetation, the junction area between vegetation and rocks, and the junction area between the sky and clouds. These boundaries are obviously different from the Beijing pixels on both sides. They are usually wrongly detected as targets in detection, resulting in a high false alarm rate.
In this paper, the region gradient is used to eliminate the interference caused by the edge region to the target detection. As the edge distribution presents three situations: horizontal, vertical, and inclined, this paper calculates the regional gradient from the four channels, respectively. Taking the 5 × 5 window as an example, the schematic diagram of the algorithm is shown in Figure 3b.
Figure 3 shows the four channels of the inclined area, the vertical area, and the horizontal area, respectively. The calculation expression of the area gradient is
W j i = D r f ( x , y ) D b f ( x , y ) N ( i = 1 , 2 , 3 , 4 )
In the formula, W j i represents the regional gradient of the jth channel of the ith suspected target window, Dr and Db represent the pixels of the red area and the blue area, respectively, and N is the number of pixels in the blue area or the red area.
The regional gradient expression of the jth suspected window Wj is:
W j = 1 m a x { W j 1 , W j 2 , W j 3 , W j 4 }
The 4 groups of feature sequences obtained by the above algorithm are formed into a feature matrix R:
R = [ I 1 , I 2 , I 3 I j L 1 , L 2 , L 3 L j Q 1 , Q 2 , Q 3 Q j W 1 , W 2 , W 3 W j ]

2.3.5. Nonlinear Fuzzy Decision

According to the established eigenmatrix, this paper designs a method of processing eigenvalues through a nonlinear algorithm to establish a fuzzy relation matrix. The algorithm is specifically expressed as:
U i j = {                                         0                                                               i f     R i j 1 j n = 1 j R i j < 0 R i j × e ( R i j 1 j n = 1 j R i j ) / 1 j n = 1 j R i j           i f     R i j 1 j n = 1 j R i j > 0 }
The nonlinear algorithm can omit the normalization step and eliminate the area with eigenvalues smaller than the mean value in the suspected target area through constraints. Finally, the fuzzy relationship matrix is obtained.
U = [ U 12 , U 12 , U 13 U 1 j U 21 , U 22 , U 23 U 2 j U 31 , U 32 , U 33 U 3 j U 41 , U 42 , U 43 U 4 j ]
After the fuzzy relationship matrix is established, the weight vector is established by analyzing the influence of each eigenvector in determining the real target. This paper designs a method to determine the weight vector through the intra-class spacing. First, the eigenvectors of each group are normalized, and secondly, for eigenvectors with large intra-class spacing, in order to effectively eliminate the suspected target area, a larger weight should be selected. For a certain eigenvector, the expression for calculating the intra-class distance is:
d 2 ( Ω i ) = 1 N i N i k = 1 N i l = 1 N i d 2 ( X k ( i ) , X l ( i ) )
where Ωi represents the feature vector of the i th group, and N i is the number of elements in the vector.
Then, obtain the weight vector A
A = [ d 2 ( Ω 1 ) , d 2 ( Ω 2 ) , d 2 ( Ω 3 ) , d 2 ( Ω 4 ) ]
Multiply A and U to obtain the fuzzy decision probability matrix, as shown in Equation (18); select the suspected window corresponding to the maximum decision probability of being judged as the real target area, as shown in Equation (19).
B = A U = [ b 1 , b 2 , b 3 b j ]
b r e a l = m a x { b 1 , b 2 , b 3 }
Firstly, compared with other feature fusion algorithms, due to the large difference in the value of each group of eigenvalues and the unknown distance between the values, other algorithms cannot reasonably determine the weight of each group of eigenvalues, which affects the determination of the target. Secondly, for each group of eigenvalue index operations, the smaller eigenvalue is effectively suppressed, and the larger eigenvalue is highlighted, which is more conducive to target determination. At the same time, the normalization operation is omitted. Thirdly, the nonlinear fuzzy decision effectively filters out the suspected region with a low eigenvalue, which reasonably saves the operation time compared with other algorithms.
Finally, the effectiveness of the algorithm for different regions of the image is discussed.
(1)
For a more uniform and simple background, top-hat filtering can suppress the background and enhance the target.
(2)
For bright noise, the center pixel contrast can effectively suppress it and further enhance the target.
(3)
For complex edge areas, the regional gradient can effectively suppress them, and the contrast of the center pixel can also suppress some edges.
(4)
For the target, all four features can enhance it.
Therefore, it is effective to combine top-hat filtering with multi-feature fuzzy decision-making.

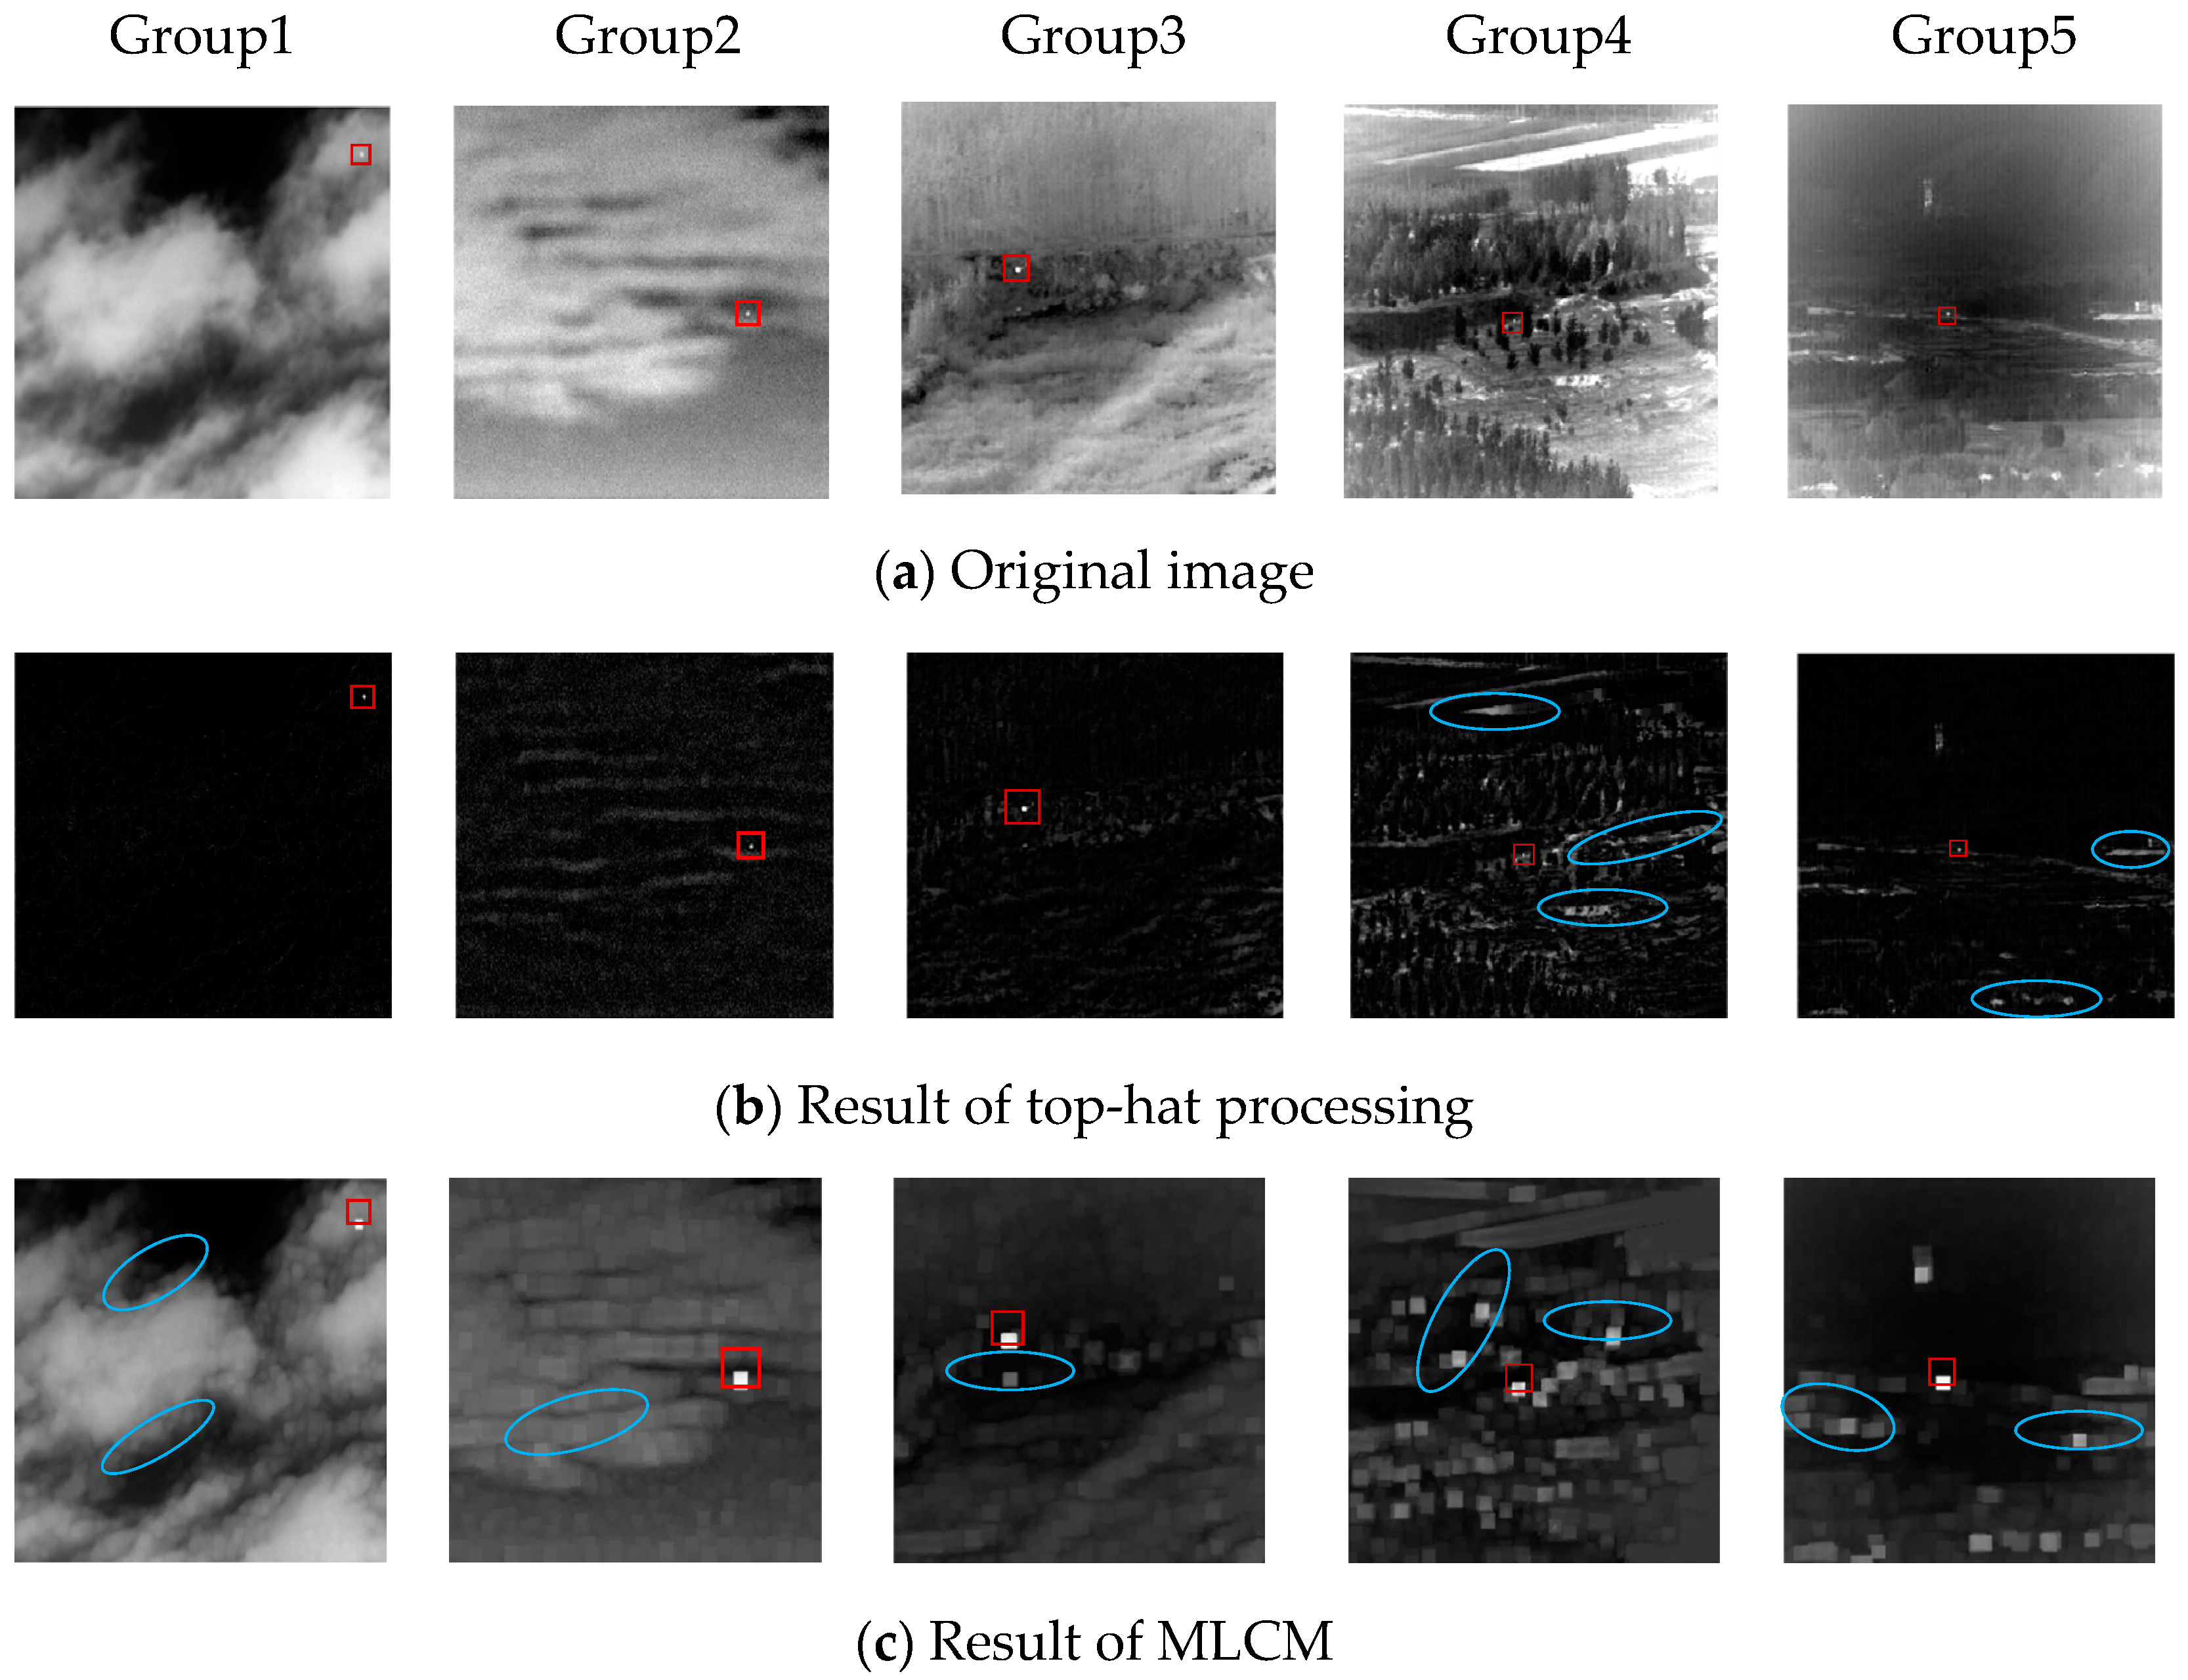
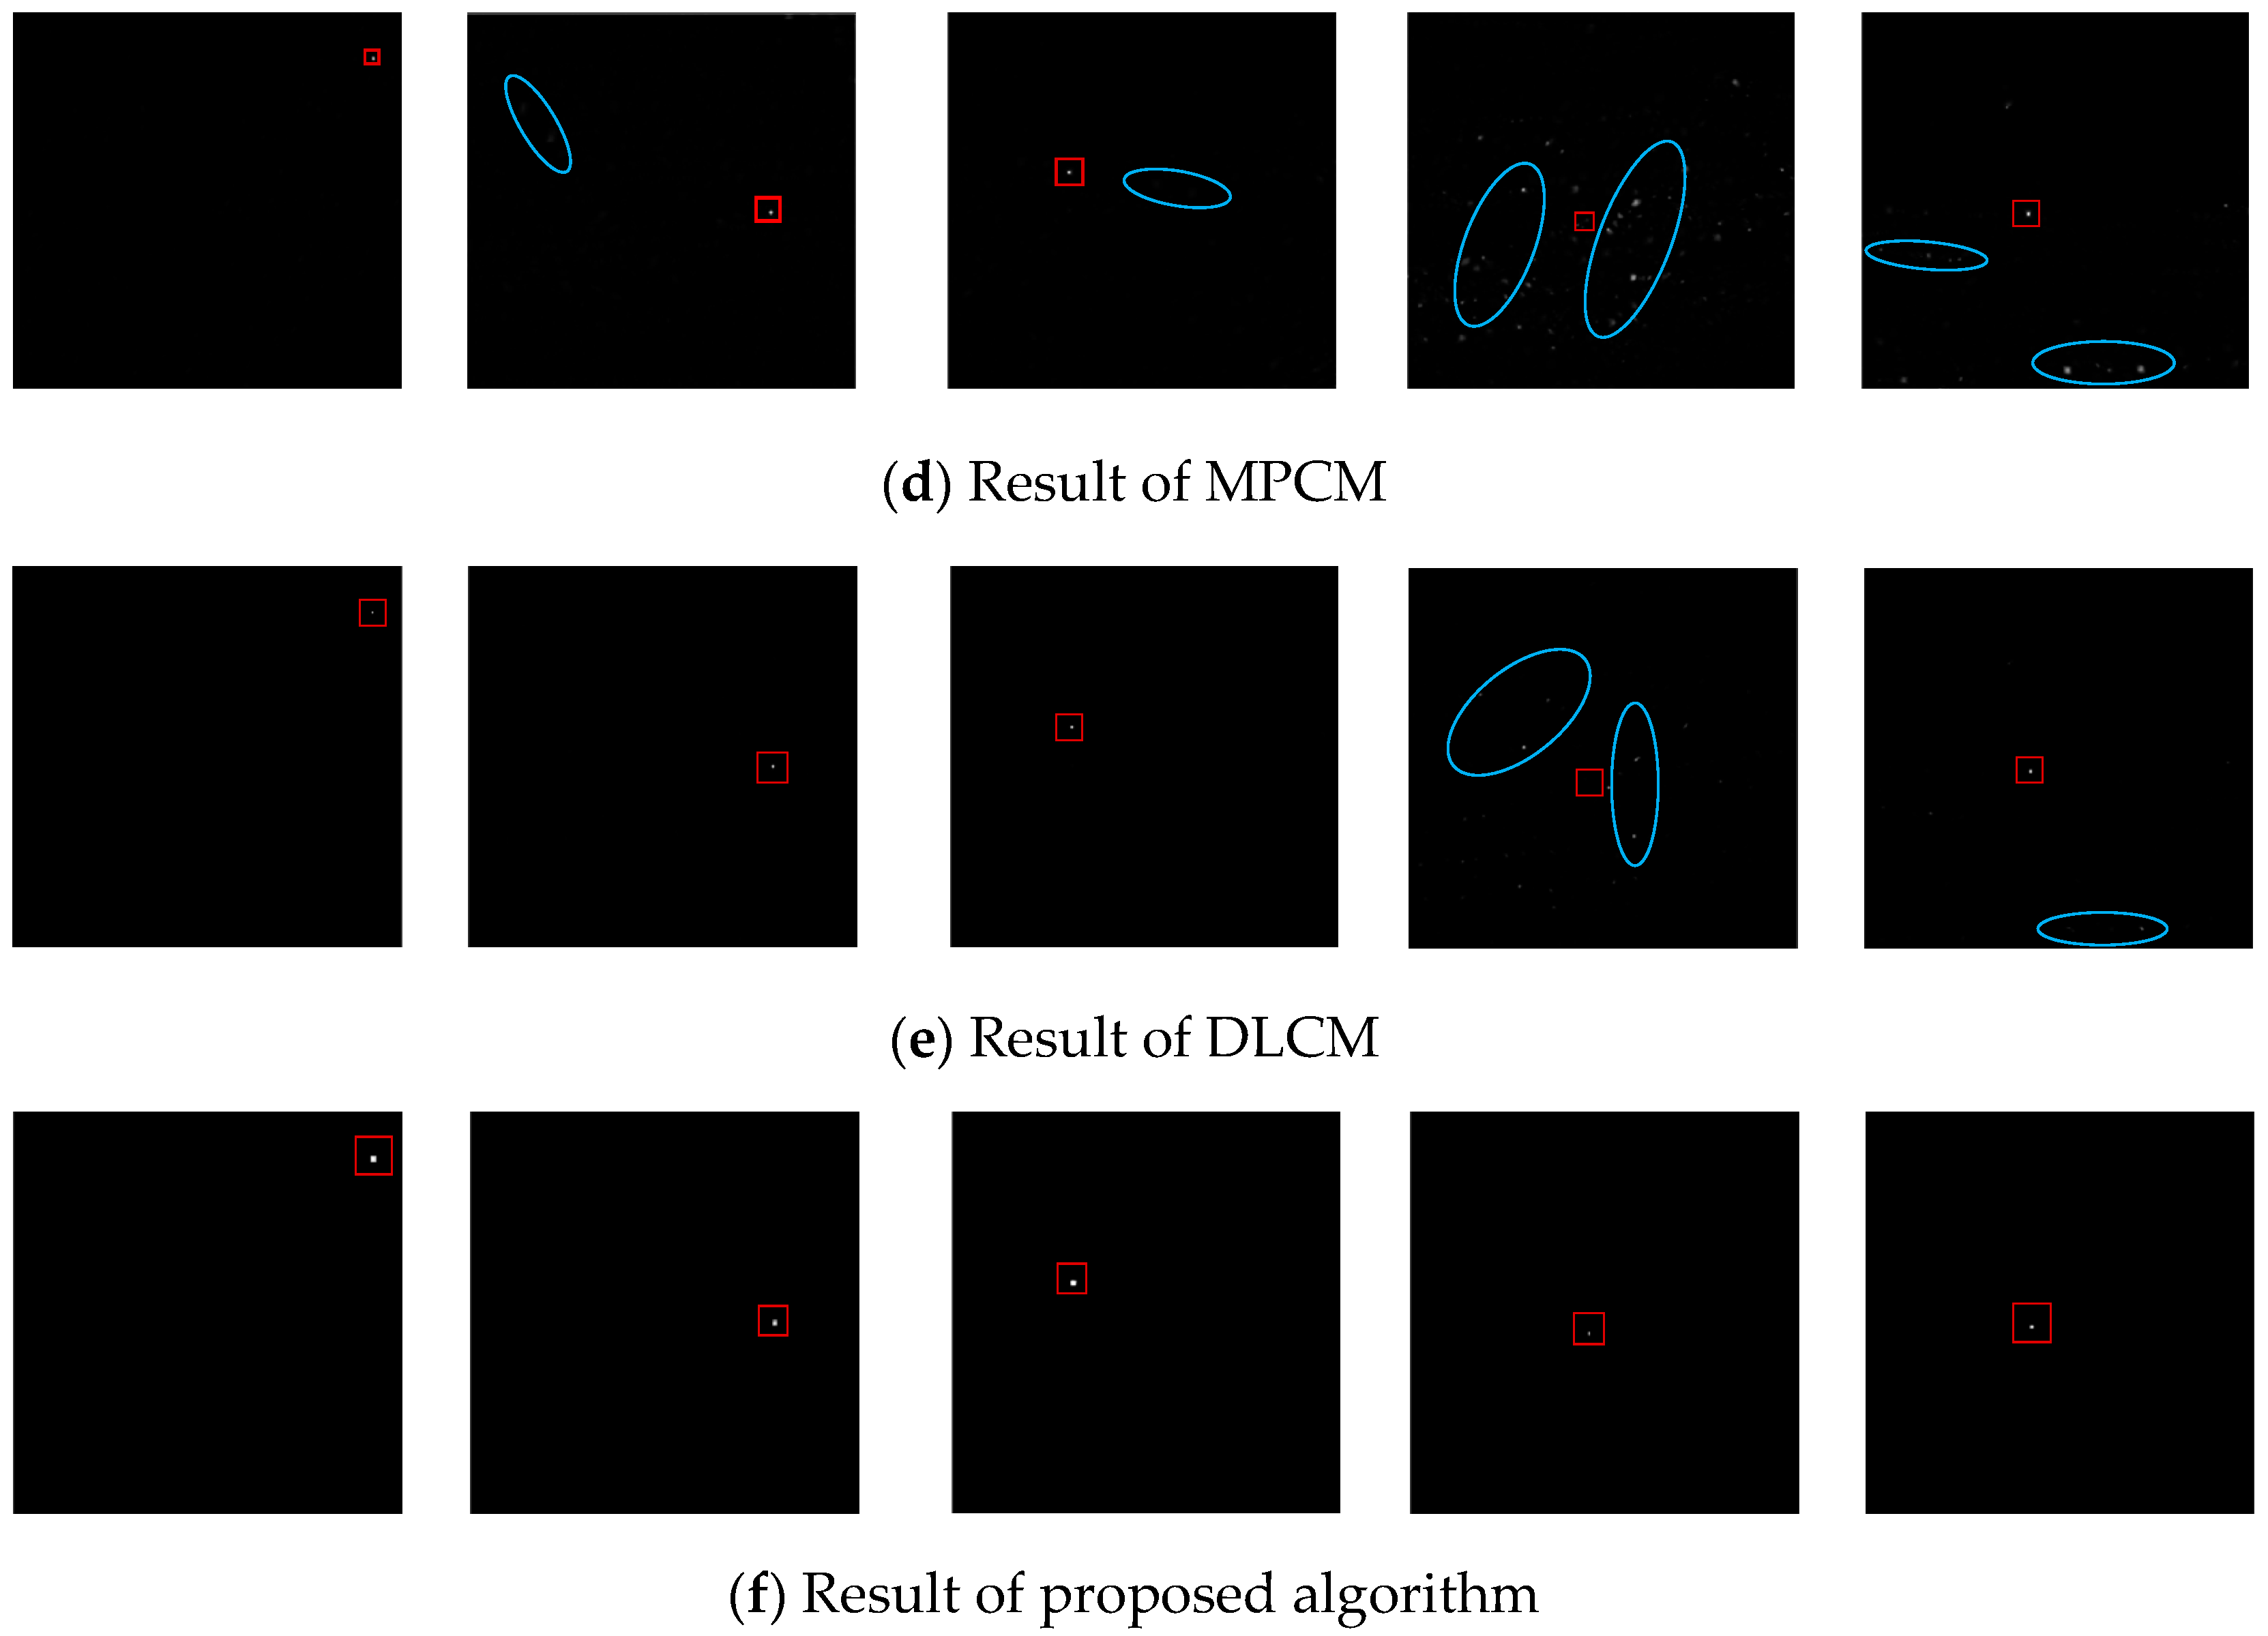
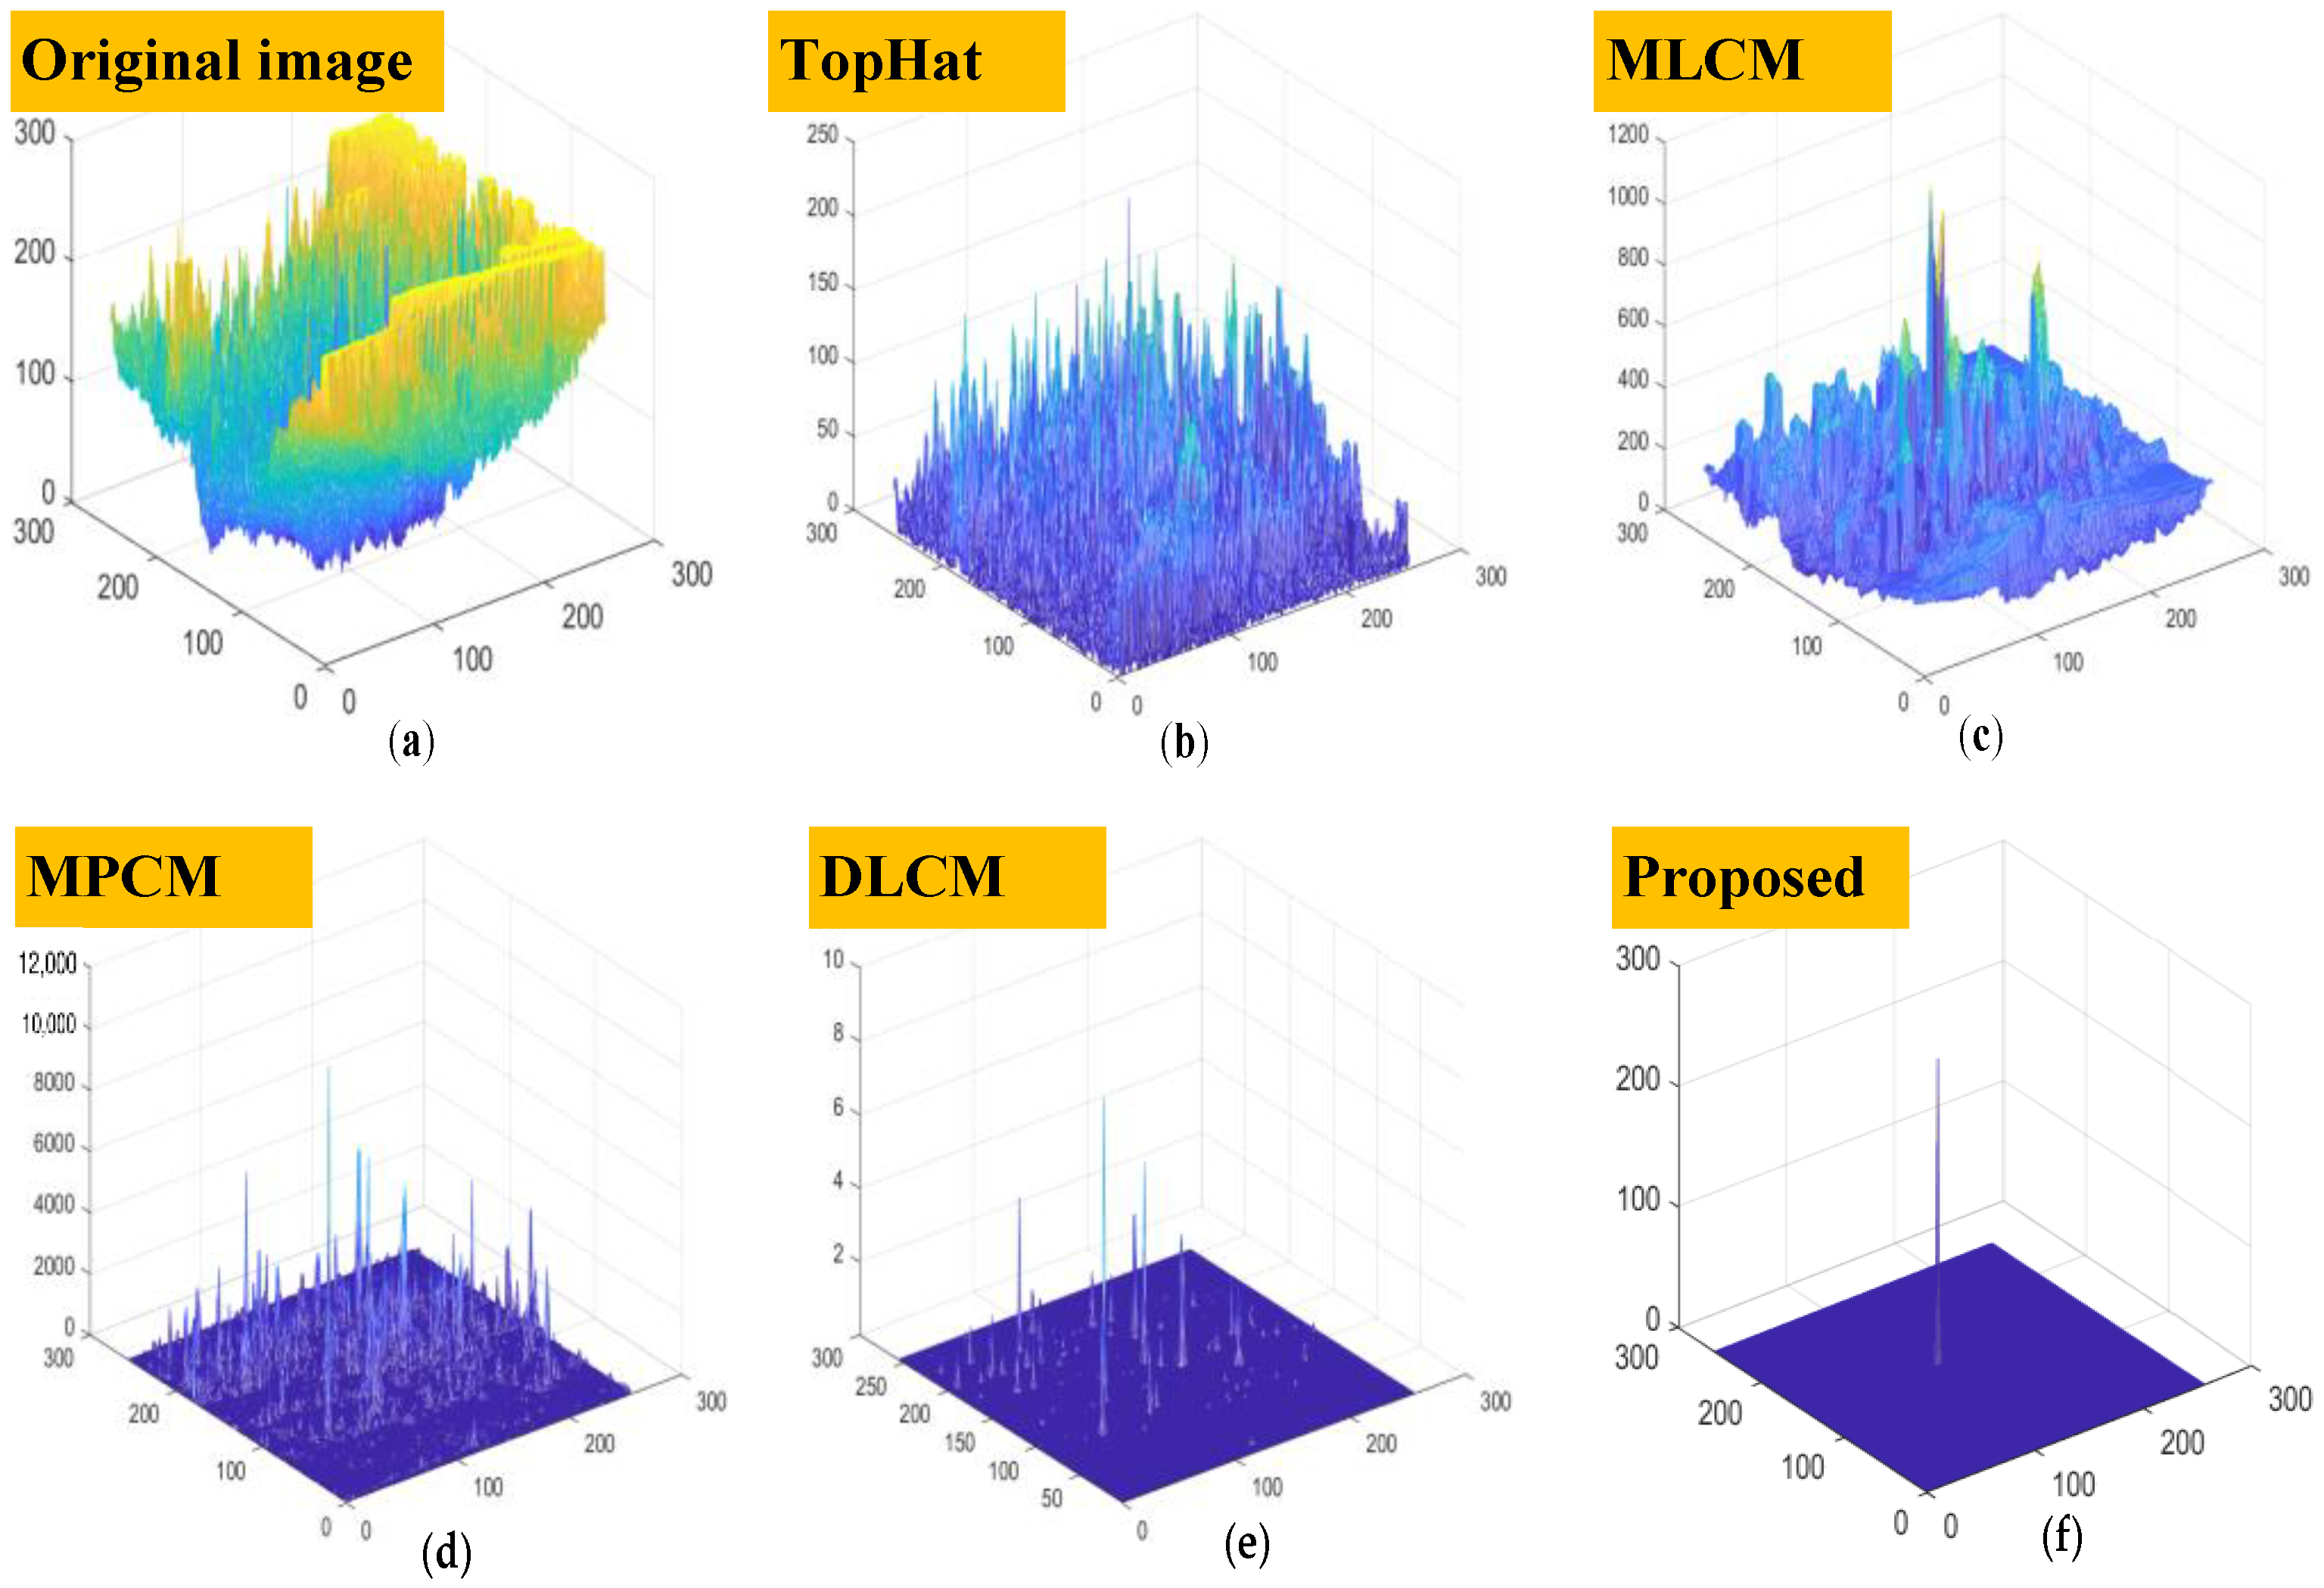
3. Experimental Results and Discussions

In this section, in order to verify the effectiveness of the algorithm proposed in this paper, five complex scenes with different target sizes are selected for target detection. These datasets come from the datasets used in the target detection algorithms commonly used in the references. The detailed parameters of the dataset are shown in Table 1. The test platform of the algorithm in this paper is equipped with a Core i7. -11800H laptop with 16 GB memory, the manufacturer is DELL, and the country of origin of the equipment is the United States, and the test software is MATLAB 2019b. Figure 5a shows single-frame images of each sequence.
This paper compares several commonly used infrared target detection algorithms, including: the classic top-hat [9], MLCM [12], MPCM [14], and DLCM [16]. Among these, the top-hat algorithm can highlight the effect of the multi-feature fuzzy decision-making algorithm in this paper. The LCM and MLCM are the classic target detection algorithms, and the DLCM is the current infrared weak and small target detection algorithm with excellent performance.
This paper selects background suppression factor (BSF), signal to clutter ratio gain (SCRG), receiver operating curve (ROC), and the running time to compare and evaluate the performance of different algorithms. BSF can reflect the ability of the algorithm to suppress the background; the specific expression is:
B S F = σ i n / σ o u t
where σin and σout represent the standard deviation of the gray value of the background in the original image and the output image, respectively.
The SCRG is used to evaluate the ability of the algorithm to enhance the target, and the specific expression is:
S C R G = S C R o u t / S C R i n
S C R = | μ t μ b | / σ b
In the formula, SCRin and SCRout represent the S C R of the original image and the output image, respectively, and SCR represents the signal-to-noise ratio of the image, which reflects the salience of the target.
For an image processed by a certain algorithm, the larger the value of the SCRG, the better the enhancement effect of the algorithm on the target and the larger the value of BSF, the stronger the ability of the algorithm to suppress the background.
In order to test the performance of the algorithm proposed in this paper, Figure 5a–f lists the detection results of five algorithms, such as the top-hat and MLCM, for the same frame image of each sequence in turn. The signal-to-noise ratio is an important indicator of image quality. The signal-to-noise ratio is the ratio of the mean value of the signal to the standard deviation of the background. Therefore, the higher the SNR, the more obvious the target is. From Figure 5, we can see that the traditional top-hat algorithm only considers the expansion and erosion of adjacent pixels; the ability to suppress the background edge is poor, and the noise in the image cannot be effectively eliminated. The MLCM algorithm also has a weak ability to suppress the edge background, and the plaque effect is obvious. The signal-to-noise ratio of the images processed by these two algorithms is not very effective. The MPCM adds the feature of a directional gradient, on the basis of the MLCM, to improve the algorithm’s suppression of edges, but it is easily disturbed by noise and brighter areas in complex backgrounds. The DLCM has improved the detection performance, but the detection rate of small targets with a pixel size below 3 3 is still not high in the highly complex background; in addition, it is easy to misjudge the brighter areas in the background as the target. The MPCM and DLCM significantly improve the signal-to-noise ratio of images by enhancing the suppression of the edges and clutter in the background, but significant noise can still be observed in Figure 5. On the basis of top-hat filtering, the algorithm proposed in this paper eliminates the suspected targets in the image through threshold segmentation and fuzzy decision, selects the most suitable suspected targets, and eliminates the background clutter in the image. The obtained image has a higher signal-to-noise ratio than the existing algorithm.
In order to compare the detection effects more intuitively, the article lists the 3D images of the detection results of sequence 4, as shown in Figure 6. The 3D images take the image length and width as the X-axis and Y-axis, respectively, and the pixels as the Z-axis. As shown in Figure 6, after the classic top-hat operator and MLCM are processed, there is still a lot of clutter, and it is difficult to segment the target even by threshold segmentation. The selection range of the segmentation coefficient K is required to be more precise. The MPCM and DLCM algorithms filter out most of the clutter in the background, but they are still sensitive to some noise areas, and the false alarm rate is high.
Table 2 lists the combined SCRG and BSF of the images processed by the five algorithms, including the top-hat and MLCM. It can be seen from the BSF and SCRG calculation results of the different algorithms that the traditional algorithms such as the top-hat and LCM are weak in suppressing complex backgrounds and are more sensitive to interference such as clutter, resulting in smaller a BSF and SCRG of the processed images. Compared with the traditional algorithms, the improved algorithms such as the DLCM have greatly improved BSF and SCRG in simple background image processing, but for complex high-noise scenes, the performance improvement is small. The algorithm in this paper performs multi-feature extraction on the basis of the top-hat and selects the correct target after effectively eliminating the suspected target window. Compared with the existing algorithms, the BSF and SCRG of the proposed algorithm are significantly improved. In particular, when the SCRG in the table is Inf (infinity) it means that the clutter around the target is completely eliminated.
The real-time performance of the algorithm is another important indicator to measure the detection performance of the algorithm. In order to test the real-time performance of the algorithm proposed in this paper, the comparison algorithm and the algorithm in this paper are used to process 20 frames of images randomly selected from each sequence, and the average time used by each algorithm is calculated. The test results are shown in Table 3. It can be seen from Table 3 that the classic top-hat operator has the fastest detection speed, the MLCM and MPCM have the longest processing time, and the DLCM is faster than the MLCM. The algorithm proposed in this paper selects the suspected window for feature calculation based on the top-hat operator with the shortest time. Top-hat filtering enhances the target and suppresses the background by expanding and eroding the image. It is fast because it uses single-window filtering. The MLCM and MPCM algorithms filter images through multi-scale windows, which greatly increases the processing time. On the basis of the MLCM, the DLCM saves multi-scale windows; so, its speed is improved, but at the same time, the window size is increased, and the processing time is longer than that of the top-hat. On the basis of the top-hat filtering with the shortest time, the algorithm in this paper selects an adaptive number of suspected windows for processing and only extracts features from the suspected window area, reducing the calculation parameters and thus effectively improving the processing speed.
As a commonly used evaluation index for comparing the performance of target detection algorithms, the ROC curve can intuitively show the detection rate and false alarm rate of different algorithms. The false positive rate (FPR) is defined as the ratio of the number of detected false targets and the total number of pixels in the whole image; the true positive rate (TPR) is defined as the ratio of the number of detected true targets and the total number of real targets. The horizontal axis of the ROC curve is the false alarm rate of the target, and the vertical axis is the detection rate of the target. The larger the area enclosed by the curve and the horizontal axis, the better the performance of the algorithm. Figure 7a–e includes the ROC curves of sequences 1 to 5 processed by the five algorithms.
In Figure 7, it can be seen that the false alarm rate and the detection rate of the classic top-hat operator and the MLCM algorithm are poor in the detection of the complex background images in sequences 1–5; the algorithms have a lower TPR of the curves, and with the increase in TPR, the FPR of the algorithm also increases accordingly, which is mainly due to the noise, and the areas with higher gray values, such as edge areas, are more sensitive. From the curve, we can find that the performance of the MPCM and DLCM is improved compared with the MLCM, especially for the relatively simple backgrounds of sequence 2 and sequence 5. However, for sequences 3 and 4, with complex background and noise effects, it can be seen that due to the interference of background clutter or noise, when the TPR is high, some of the existing clutter cannot be eliminated, resulting in a high FPR. Apart from the other sequences of sequence 4, the algorithm in this paper has correctly detected the target area and effectively removed the background clutter. Therefore, the curve is as shown in the figure, and the TPR is 1. In addition, no false detection is caused by clutter interference; so, the FPR is 0. For sequence 4, with a complex background and more noise and clutter interference, it can be seen from the curve in Figure 7d that the detection rate of the existing algorithms is very low due to the false detection of noise points as targets. Compared with the existing algorithms, the detection rate of this algorithm has been significantly improved, and when the TPR is high, the FPR is significantly reduced.

4. Conclusions

In this paper, with the aim of improving the traditional top-hat operator to predict the suspected target area, fuzzy decision-making is incorporated to determine the suspected target. The multi-structural element top-hat operator filters the original image and extracts the suspected target area through threshold segmentation. Due to the integration of multiple feature extraction algorithms, this paper defines an adaptive calculation method for the segmentation coefficients. Compared with the randomness and ambiguity of the selection of the segmentation coefficients in the existing algorithms, the operation of parameter adjustment is omitted. The feature extraction algorithm is designed based on the physical characteristics of infrared weak and small targets, and the multi-feature extraction of the filtered image improves the anti-interference ability of the algorithm against the background and noise. For the extracted feature results, this paper designs a nonlinear algorithm to construct the fuzzy matrix. The experimental test results and evaluation results demonstrate that the proposed algorithm has obvious advantages in its detection performance compared with the existing algorithms. However, as the suspected window with the largest decision probability is selected as the real target, it is less applicable when there are multiple targets in the image.

Author Contributions

Conceptualization, D.Y. and Z.B.; methodology, Z.B.; software, Z.B.; validation, D.Y., Z.B. and J.Z.; formal analysis, Z.B.; investigation, Z.B.; resources, D.Y.; data curation, D.Y.; writing—original draft preparation, Z.B.; writing—review and editing, J.Z.; visualization, Z.B.; supervision, D.Y.; project administration, D.Y.; funding acquisition, D.Y. All authors have read and agreed to the published version of the manuscript.

Funding

PleThis work was supported in part by the National Key R&D Program of China under Grant 2021YFC3090402.

Data Availability Statement

Exclude this statement.

Conflicts of Interest

The authors declare no conflict of interest.

References

  1. Huang, K.; Mao, X. Detectability of infrared small targets. Infrared Phys. Technol. 2010, 53, 208–217. [Google Scholar] [CrossRef]
  2. Liu, D.; Cao, L.; Li, Z.; Liu, T.; Che, P. Infrared Small Target Detection Based on Flux Density and Direction Diversity in Gradient Vector Field. IEEE J. Sel. Top. Appl. Earth Obs. Remote Sens. 2018, 11, 2528–2554. [Google Scholar] [CrossRef]
  3. Gao, C.; Meng, D.; Yang, Y.; Wang, Y.; Zhou, X.; Hauptmann, A.G. Infrared Patch-Image Model for Small Target Detection in a Single Image. IEEE Trans. Image Process. 2013, 22, 4996–5009. [Google Scholar] [CrossRef] [PubMed]
  4. Shao, X.; Fan, H.; Lu, G.; Xu, J. An improved infrared dim and small target detection algorithm based on the contrast mechanism. of human visual system. Infrared Phys. Technol. 2012, 55, 403–408. [Google Scholar] [CrossRef]
  5. Thanh, N.T.; Sahli, H.; Hao, D.N. Infrared Thermography for Buried Landmine Detection: Inverse Problem Setting. IEEE Trans. Geosci. Remote Sens. 2008, 46, 3987–4004. [Google Scholar] [CrossRef]
  6. Dai, Y.; Wu, Y. Reweighted Infrared Patch-Tensor Model with Both Nonlocal and Local Priors for Single-Frame Small Target Detection. IEEE J. Sel. Top. Appl. Earth Obs. Remote Sens. 2017, 10, 3752–3767. [Google Scholar] [CrossRef] [Green Version]
  7. Reed, I.S.; Gagliardi, R.M.; Shao, H.M. Application of Three-Dimensional Filtering to Moving Target Detection. IEEE Trans. Aerosp. Electron. Syst. 1983, AES-19, 898–905. [Google Scholar] [CrossRef]
  8. Chen, X. A new framework of multistage parametric inference. Proc. SPIE 2010, 7666, 7666. [Google Scholar]
  9. Halder, A.; Shekhar, S.; Kant, S.; Mubarki, M.A.; Pandey, A. A New Efficient Adaptive Spatial Filter for Image Enhancement. In Proceedings of the 2010 Second International Conference on Computer Engineering and Applications, Bali, Indonesia, 19–21 March 2010; pp. 244–246. [Google Scholar]
  10. Deshpande, S.D.; Er, M.H.; Venkateswarlu, R.; Chan, P. Max-mean and Max-median filters for detection of small-targets. Proc. SPIE 1999, 3809, 74–83. [Google Scholar]
  11. Bai, X.; Zhou, F. Analysis of new top-hat transformation and the application for infrared dim small target detection. Pattern Recognit. 2010, 43, 2145–2156. [Google Scholar] [CrossRef]
  12. Chen, C.L.P.; Li, H.; Wei, Y.; Xia, T.; Tang, Y.Y. A Local Contrast Method for Small Infrared Target Detection. IEEE Trans. Geosci. Remote Sens. 2014, 52, 574–581. [Google Scholar] [CrossRef]
  13. Han, J.; Ma, Y.; Zhou, B.; Fan, F.; Liang, K.; Fang, Y. A Robust Infrared Small Target Detection Algorithm Based on Human Visual System. IEEE Geosci. Remote Sens. Lett. 2014, 11, 2168–2172. [Google Scholar] [CrossRef]
  14. Zhang, H. Infrared small target detection based on local intensity and gradient properties. Infrared Phys. Technol. 2018, 89, 88–96. [Google Scholar] [CrossRef]
  15. Wei, Y.; You, X.; Li, H. Multiscale patch-based contrast measure for small infrared target detection. Pattern Recognit. 2016, 58, 216–226. [Google Scholar] [CrossRef]
  16. Han, J.; Liang, K.; Zhou, B.; Zhu, X.; Zhao, J.; Zhao, L. Infrared Small Target Detection Utilizing the Multiscale Relative Local Contrast Measure. IEEE Geosci. Remote Sens. Lett. 2018, 15, 612–616. [Google Scholar] [CrossRef]
  17. Wu, L.; Ma, Y.; Fan, F.; Wu, M.; Huang, J. A Double-Neighborhood Gradient Method for Infrared Small Target Detection. IEEE Geosci. Remote Sens. Lett. 2021, 18, 1476–1480. [Google Scholar] [CrossRef]
  18. Felix, R.; Reddig, S.; Adelhof, A. Multiple attribute decision making based on fuzzy relationships between objectives and its application in metal forming. In Proceedings of the Second IEEE International Conference on Fuzzy Systems, San Francisco, CA, USA, 28 March–1 April 1993; Volume 1, pp. 378–383. [Google Scholar] [CrossRef]
Figure 1. Algorithmic overall structure diagram.
Electronics 11 03549 g001
Figure 2. (a) Comparison of detection failure and expected size of structural elements due to structural elements which are too small; (b) three structural elements selected in this algorithm.
Electronics 11 03549 g002
Figure 3. (a) Directional gradient calculation diagram; (b) four regional gradient channels.
Electronics 11 03549 g003
Figure 4. Edge areas in infrared images are displayed in red circle.
Electronics 11 03549 g004
Figure 5. (a) Original image; (b) result after top-hat processing; (c) result after MLCM processing; (d) result after MPCM processing; (e) result after DLCM processing; (f) result after algorithm processing in this paper. Red squares and blue circles represent targets and clutter respectively.
Electronics 11 03549 g005aElectronics 11 03549 g005b
Figure 6. Three-dimensional chart of detection result. (a) 3-D image of original image. (b) 3-D image of result of Top-Hat. (c) 3-D image of result of MLCM. (d) 3-D image of result of MPCM. (e) 3-D image of result of DLCM. (f) 3-D image of result of Proposed.
Electronics 11 03549 g006
Figure 7. (a) ROC curve of sequence 1 after algorithm processing; (b) ROC curve of sequence 2 after algorithm processing; (c) ROC curve of sequence 3 after algorithm processing; (d) ROC curve of sequence 4 after algorithm processing; (e) ROC curve of sequence 5 after algorithm processing.
Electronics 11 03549 g007
Table 1. Five sets of infrared image sequence dataset parameters.
ResolutionTarget SizeScenes DescriptionNumber
Group 1512 × 6407 × 7Strong edge interference100
Group 2200 × 2503 × 3Complex background interference80
Group 3256 × 2564 × 3Strong noise interference100
Group 4256 × 2562 × 1Strong noise and edge interference50
Group 5256 × 2562 × 3Strong noise interference80
Table 2. BSF and SCRG of different algorithms.
BSF
Group1Group2Group3Group4Group5
Top-Hat6.60290.45390.21840.44710.0415
MLCM11.32162.45392.58871.66970.8261
MPCM14.59954.14742.863514.77531.4810
DLCM43.010338.334248.683525.95592.3942
Proposed124.937086.1305113.913438.925716.0827
SCRG
Group1Group2Group3Group4Group5
Top-Hat4.47331.27060.36780.10220.3383
MLCM12.05315.07963.81971.18211.1743
MPCM10.346616.32932.76554.15631.7970
DLCM58.0185Inf87.247613.759023.3038
ProposedInfInf175.461248.219471.1720
Table 3. Real-time performance evaluation parameters (units: s).
GroupsImage ResolutionTop-HatMLCMMPCMDLCMProposed
Group 1512 × 6400.0025230.1667410.1897390.2110120.059314
Group 2200 × 2500.0013280.0576790.0706510.0616380.060824
Group 3256 × 2560.0011870.0619600.0621460.0703490.045858
Group 4256 × 2560.0012380.0621140.0618710.0676200.069425
Group 5256 × 2560.0014680.0706520.0679440.0696280.052984
Publisher’s Note: MDPI stays neutral with regard to jurisdictional claims in published maps and institutional affiliations.

