
Using Deep Learning Techniques in Forecasting Stock Markets by Hybrid Data with Multilingual Sentiment Analysis


Abstract
:1. Introduction
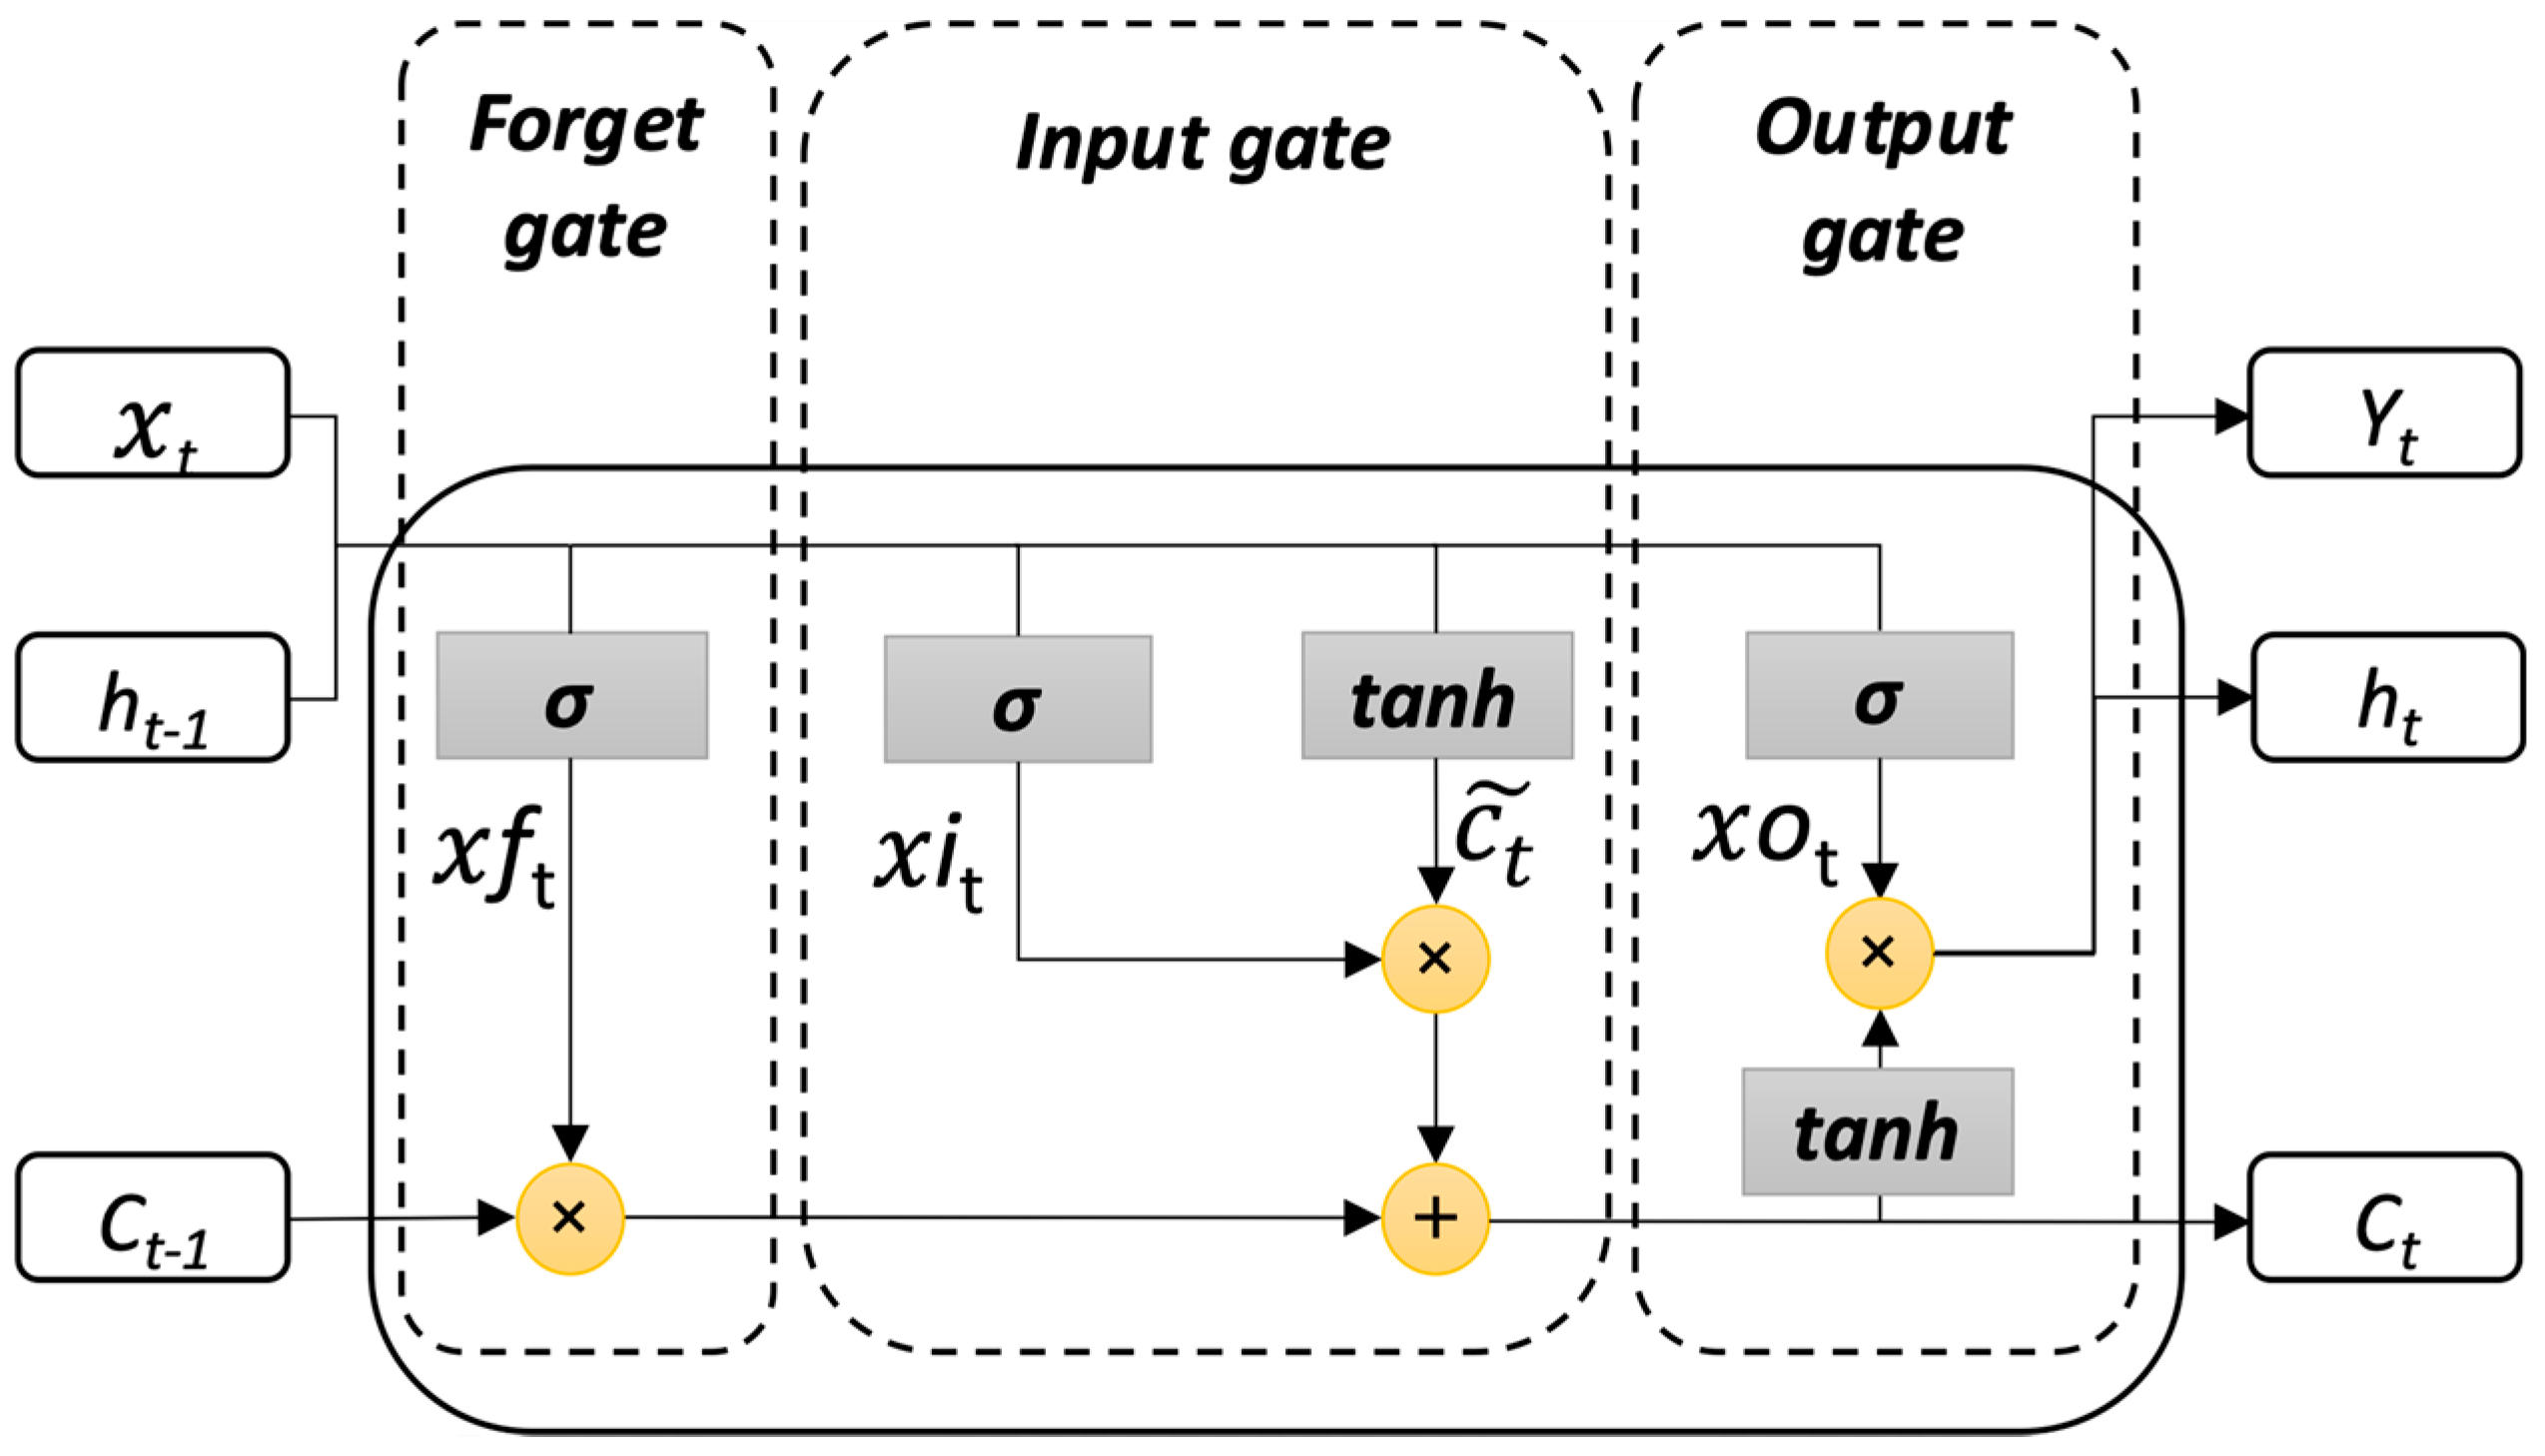
2. Long Short-Term Memory Networks
3. The Proposed Architecture for Predicting Stock Markets
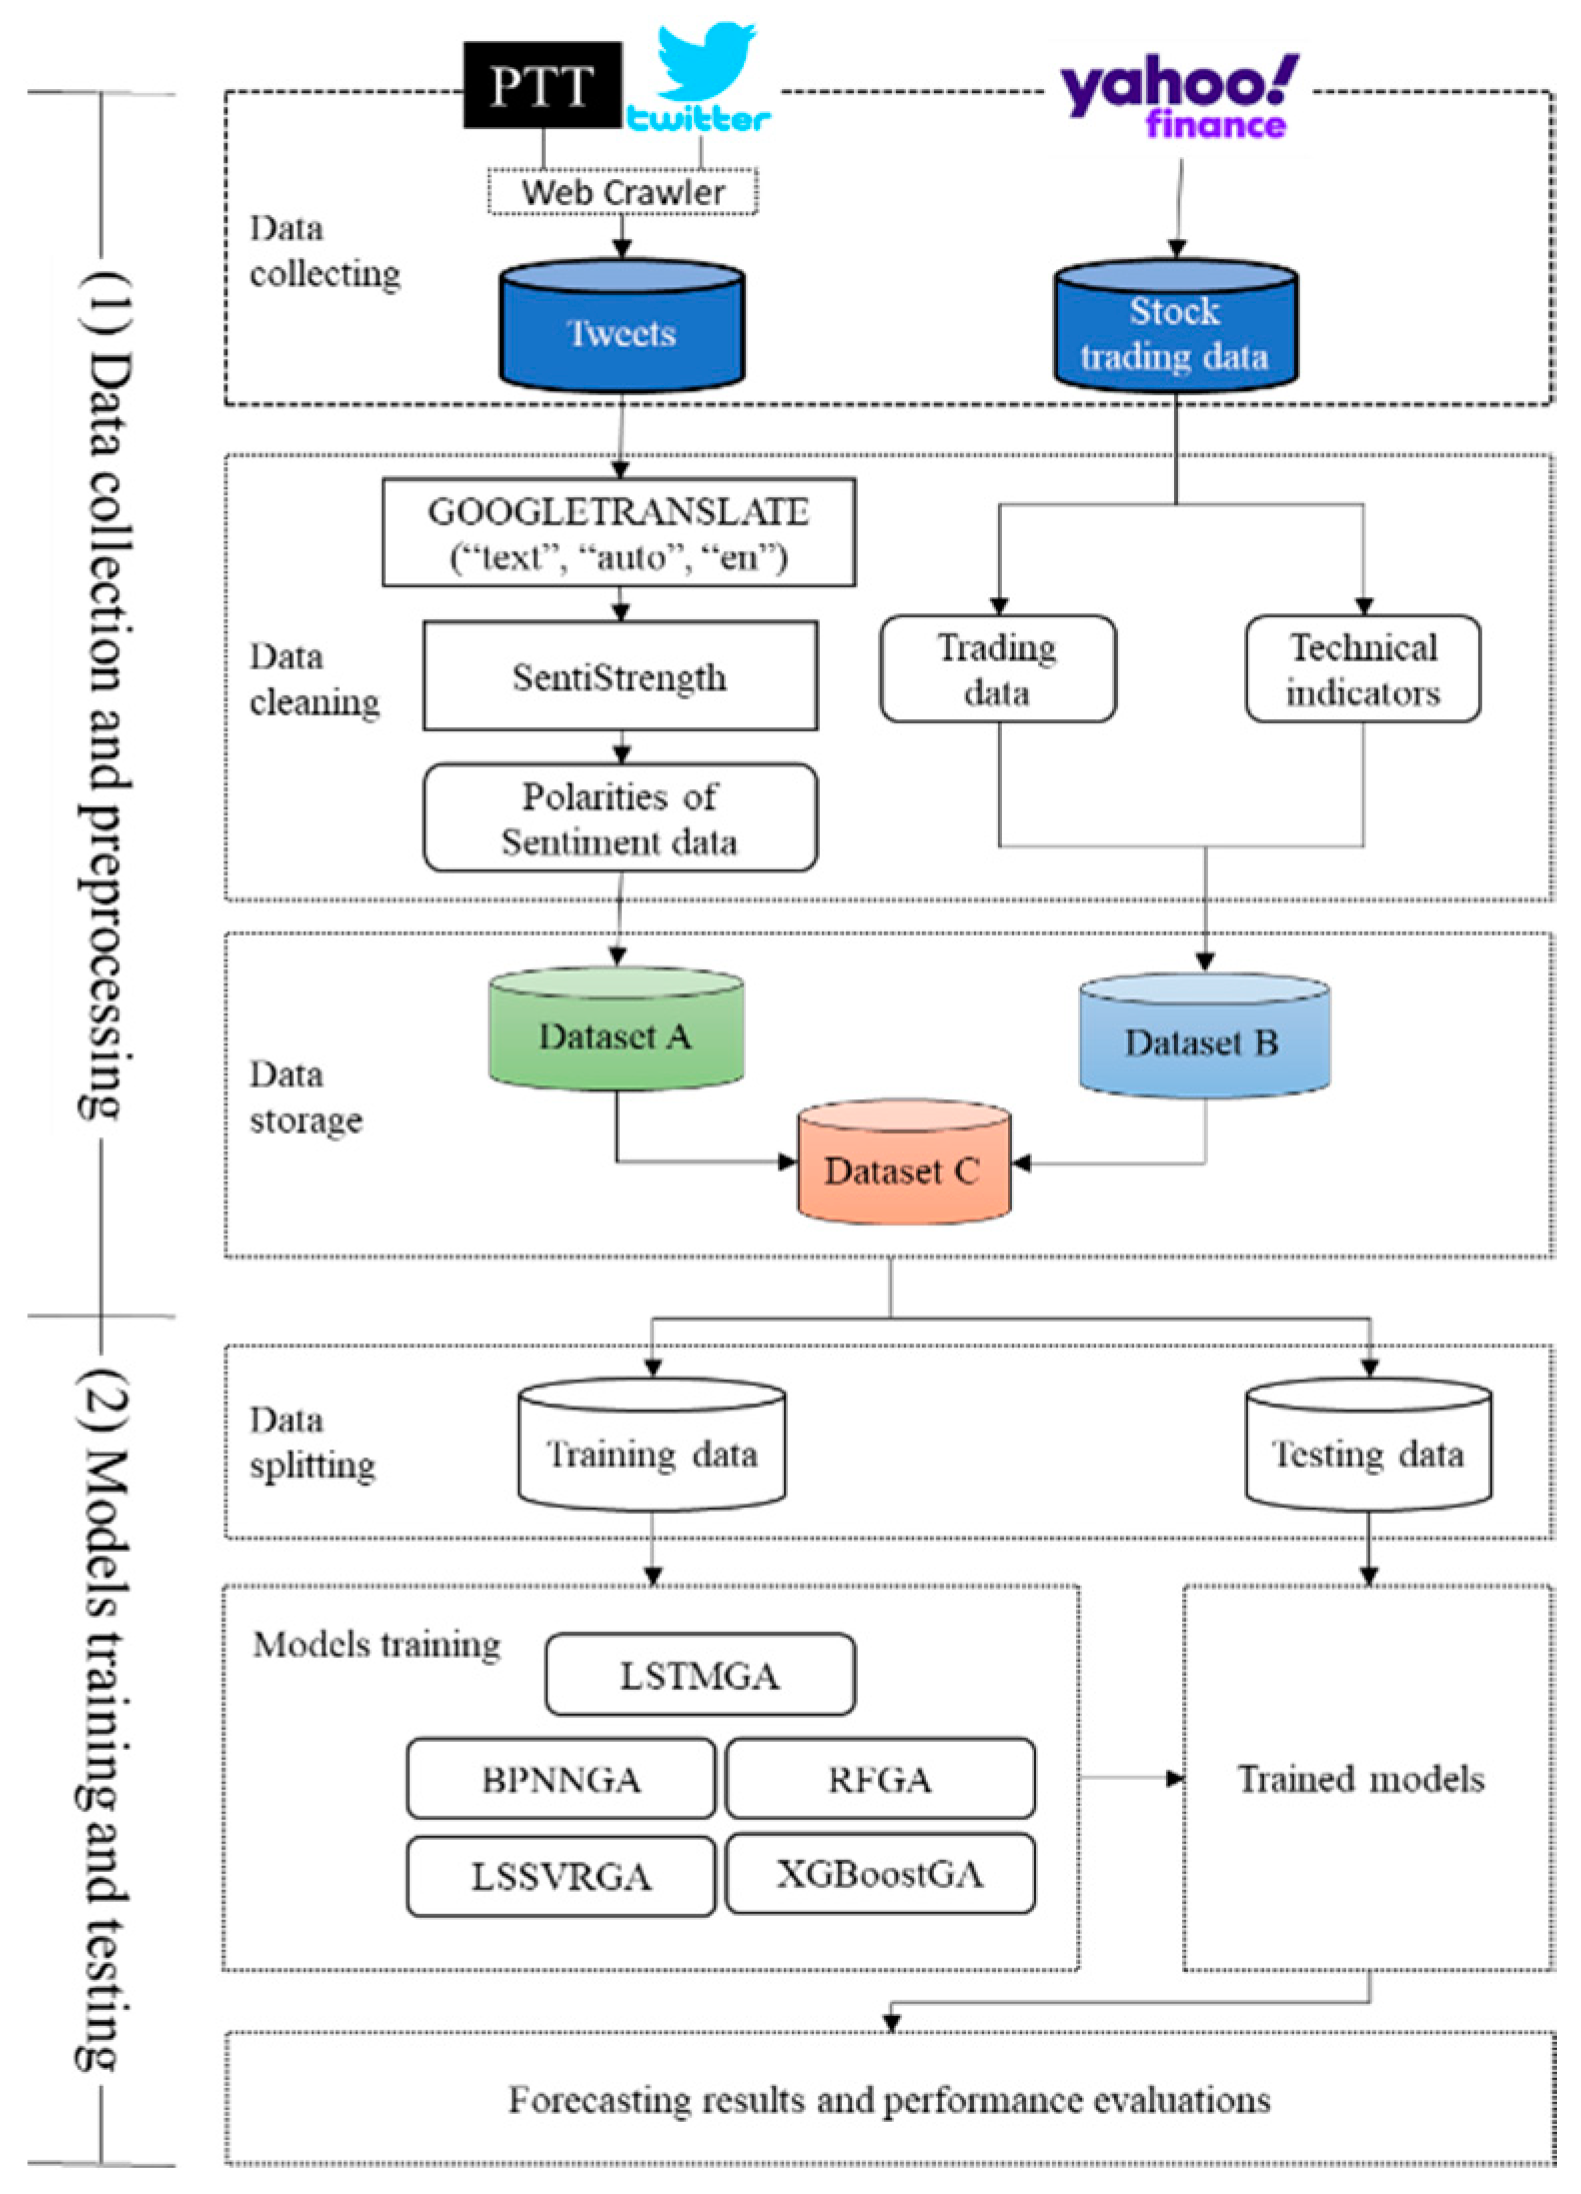
3.1. Data Collection and Preprocessing
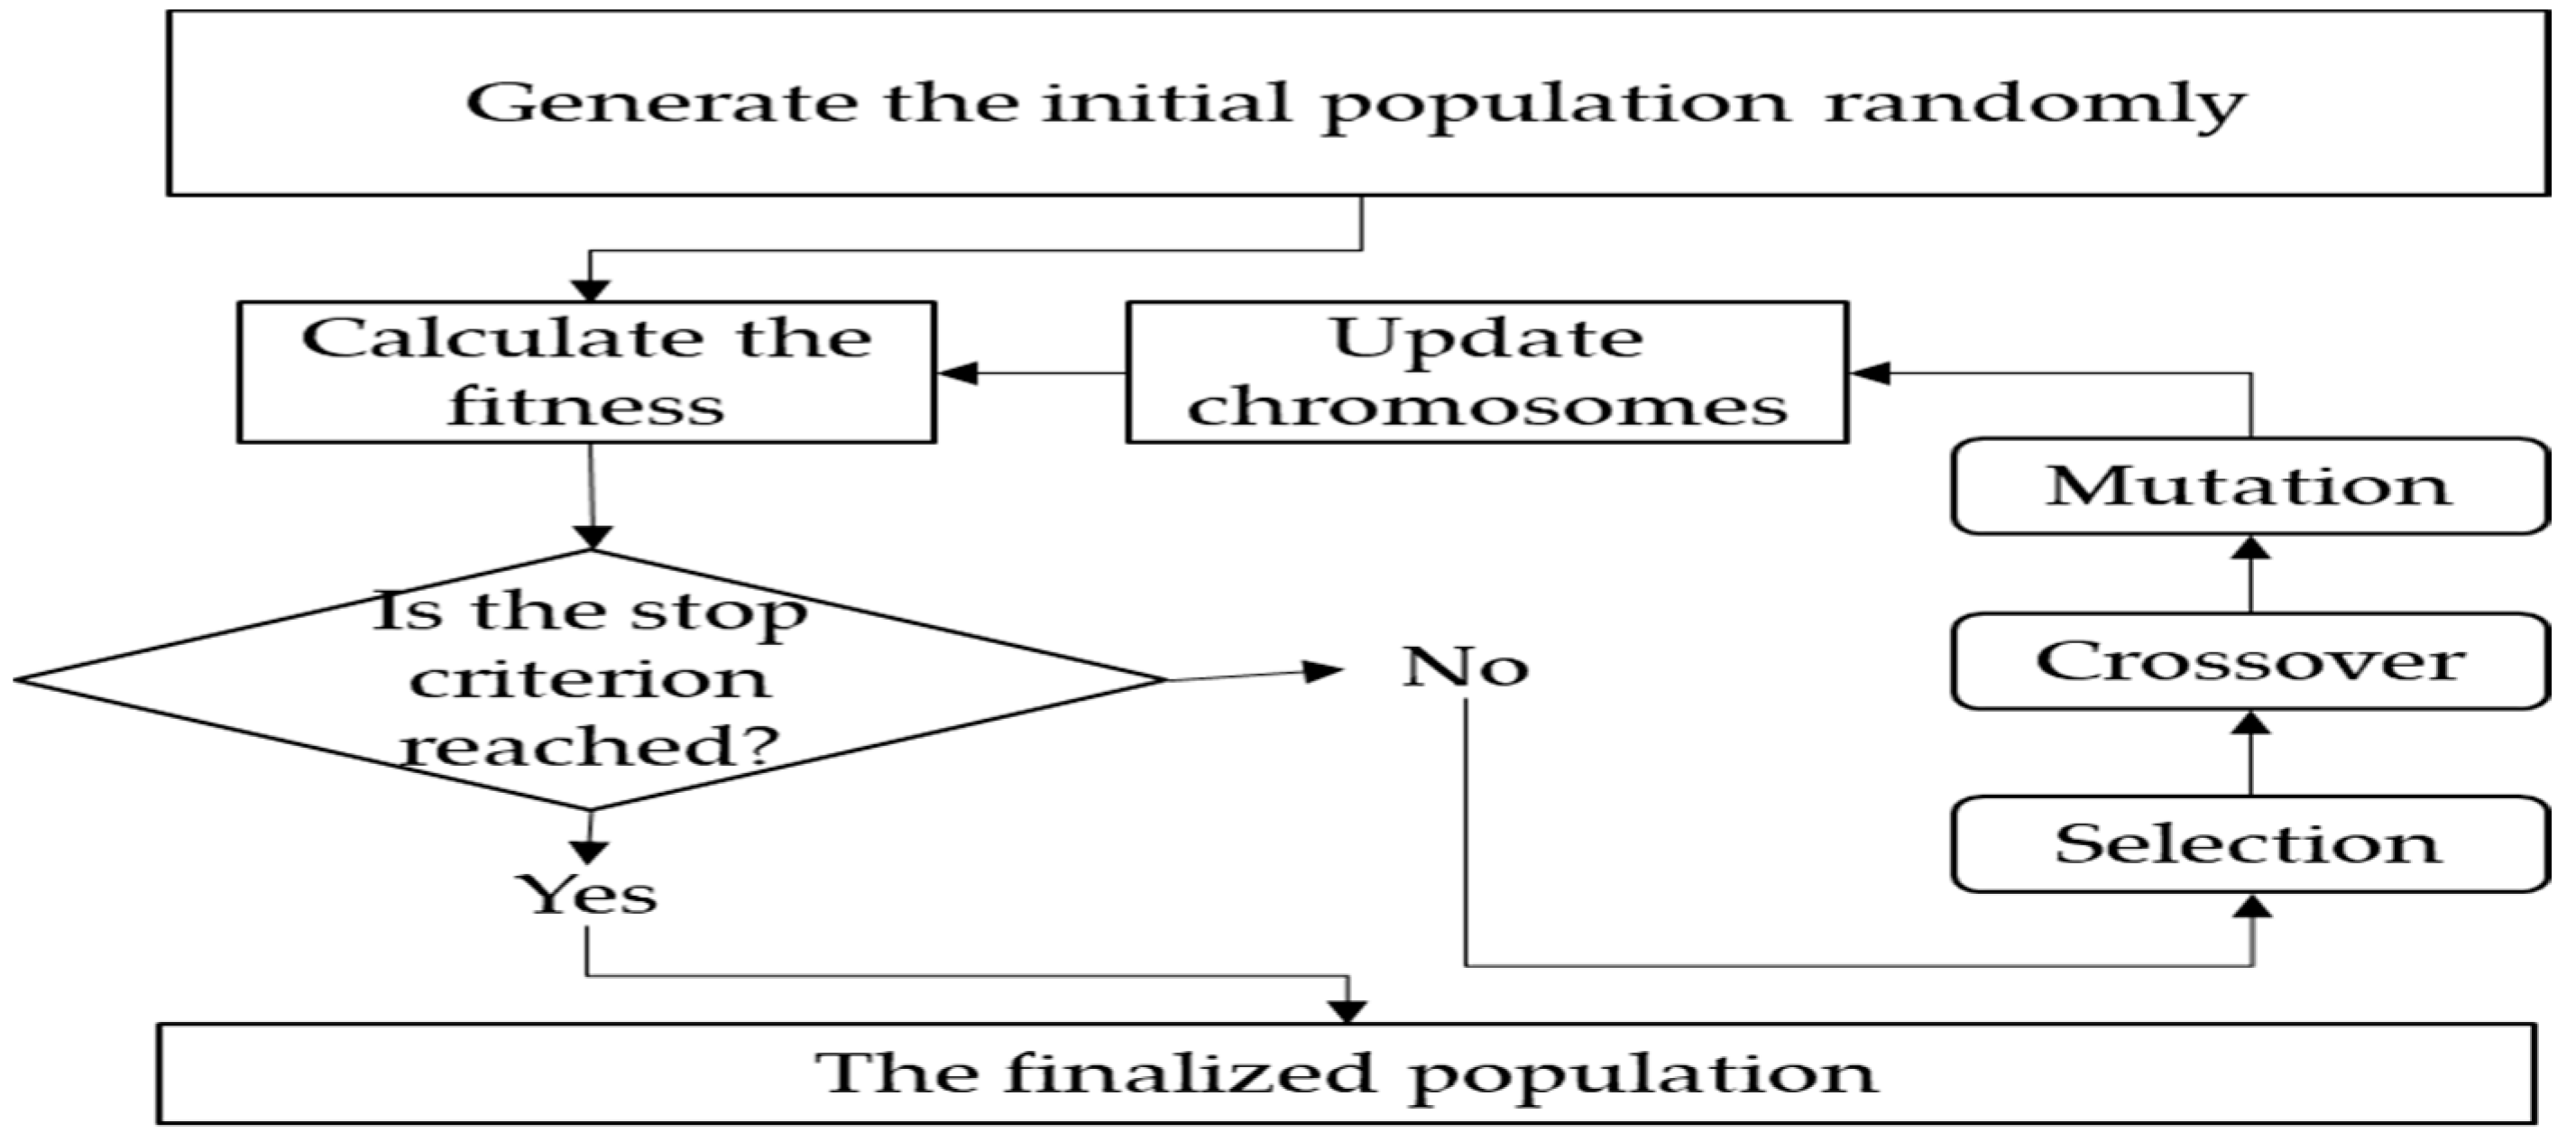
3.2. The Training and Testing of Models
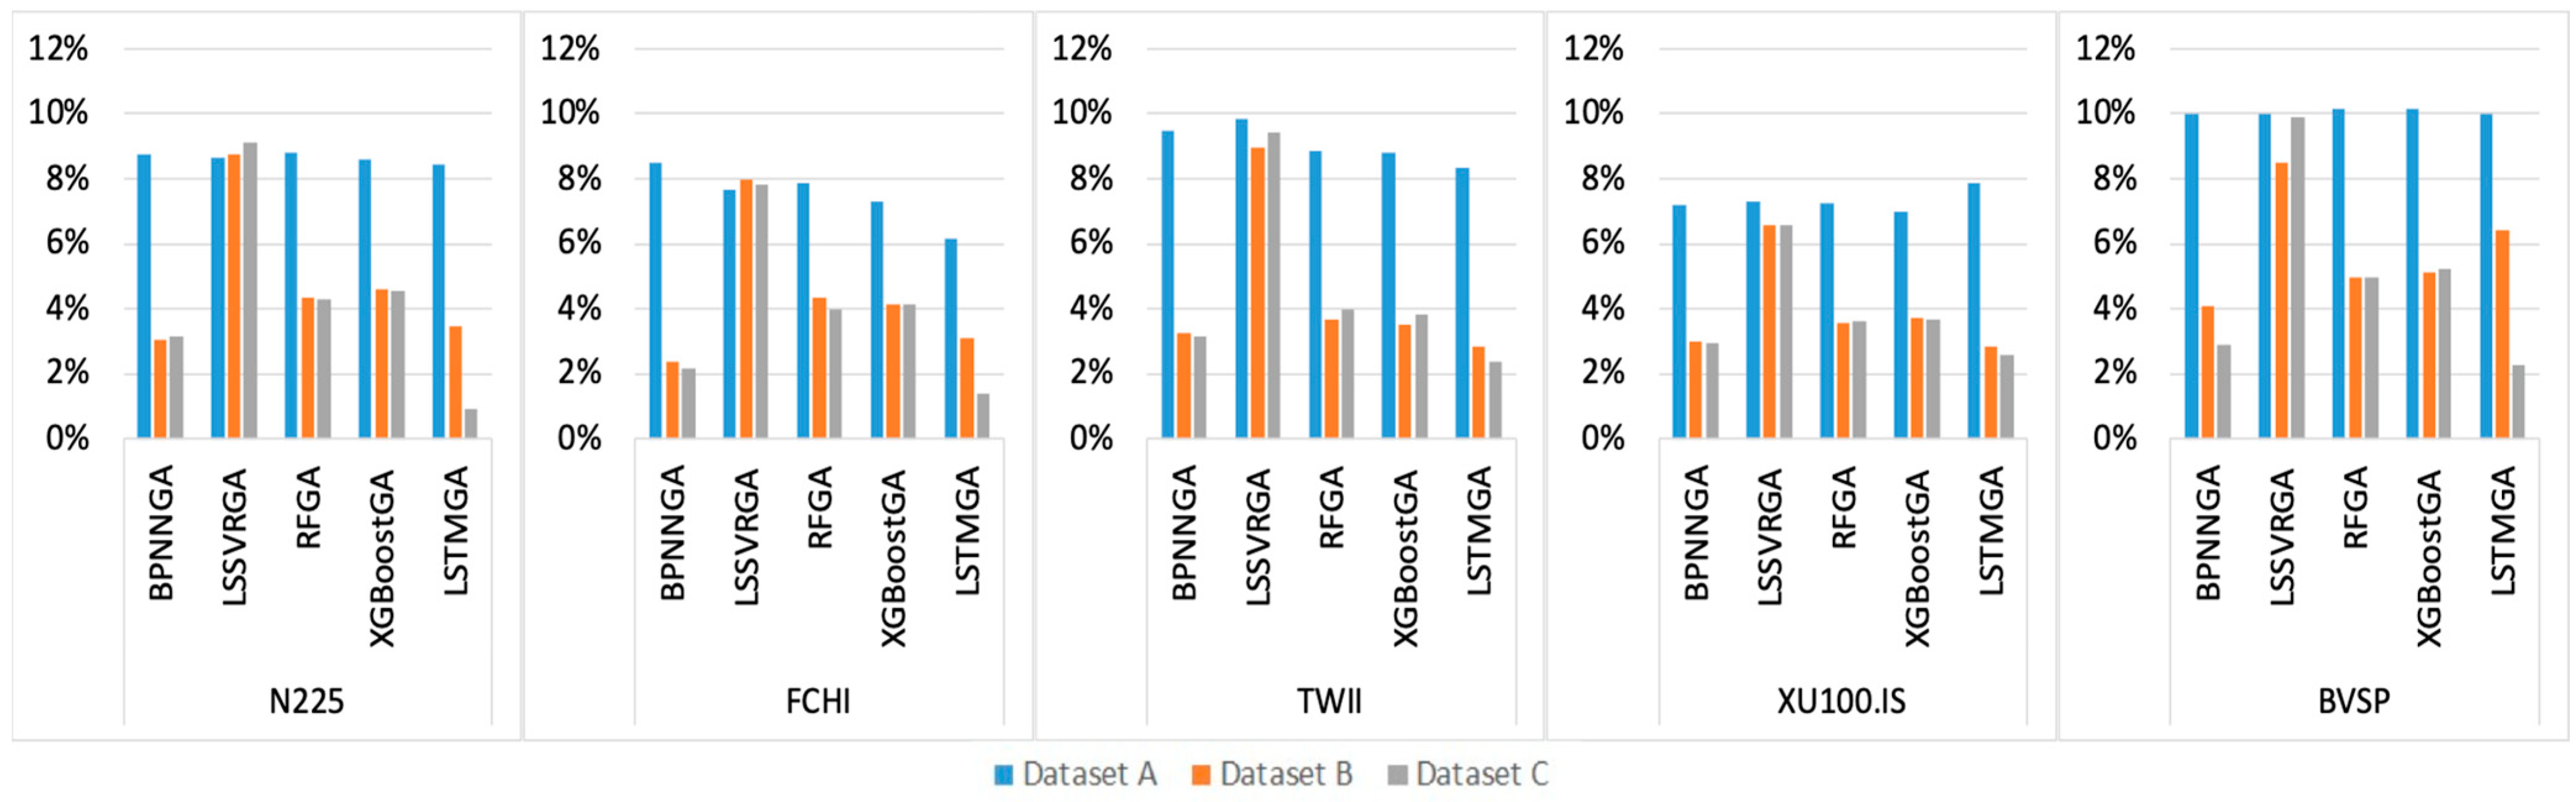
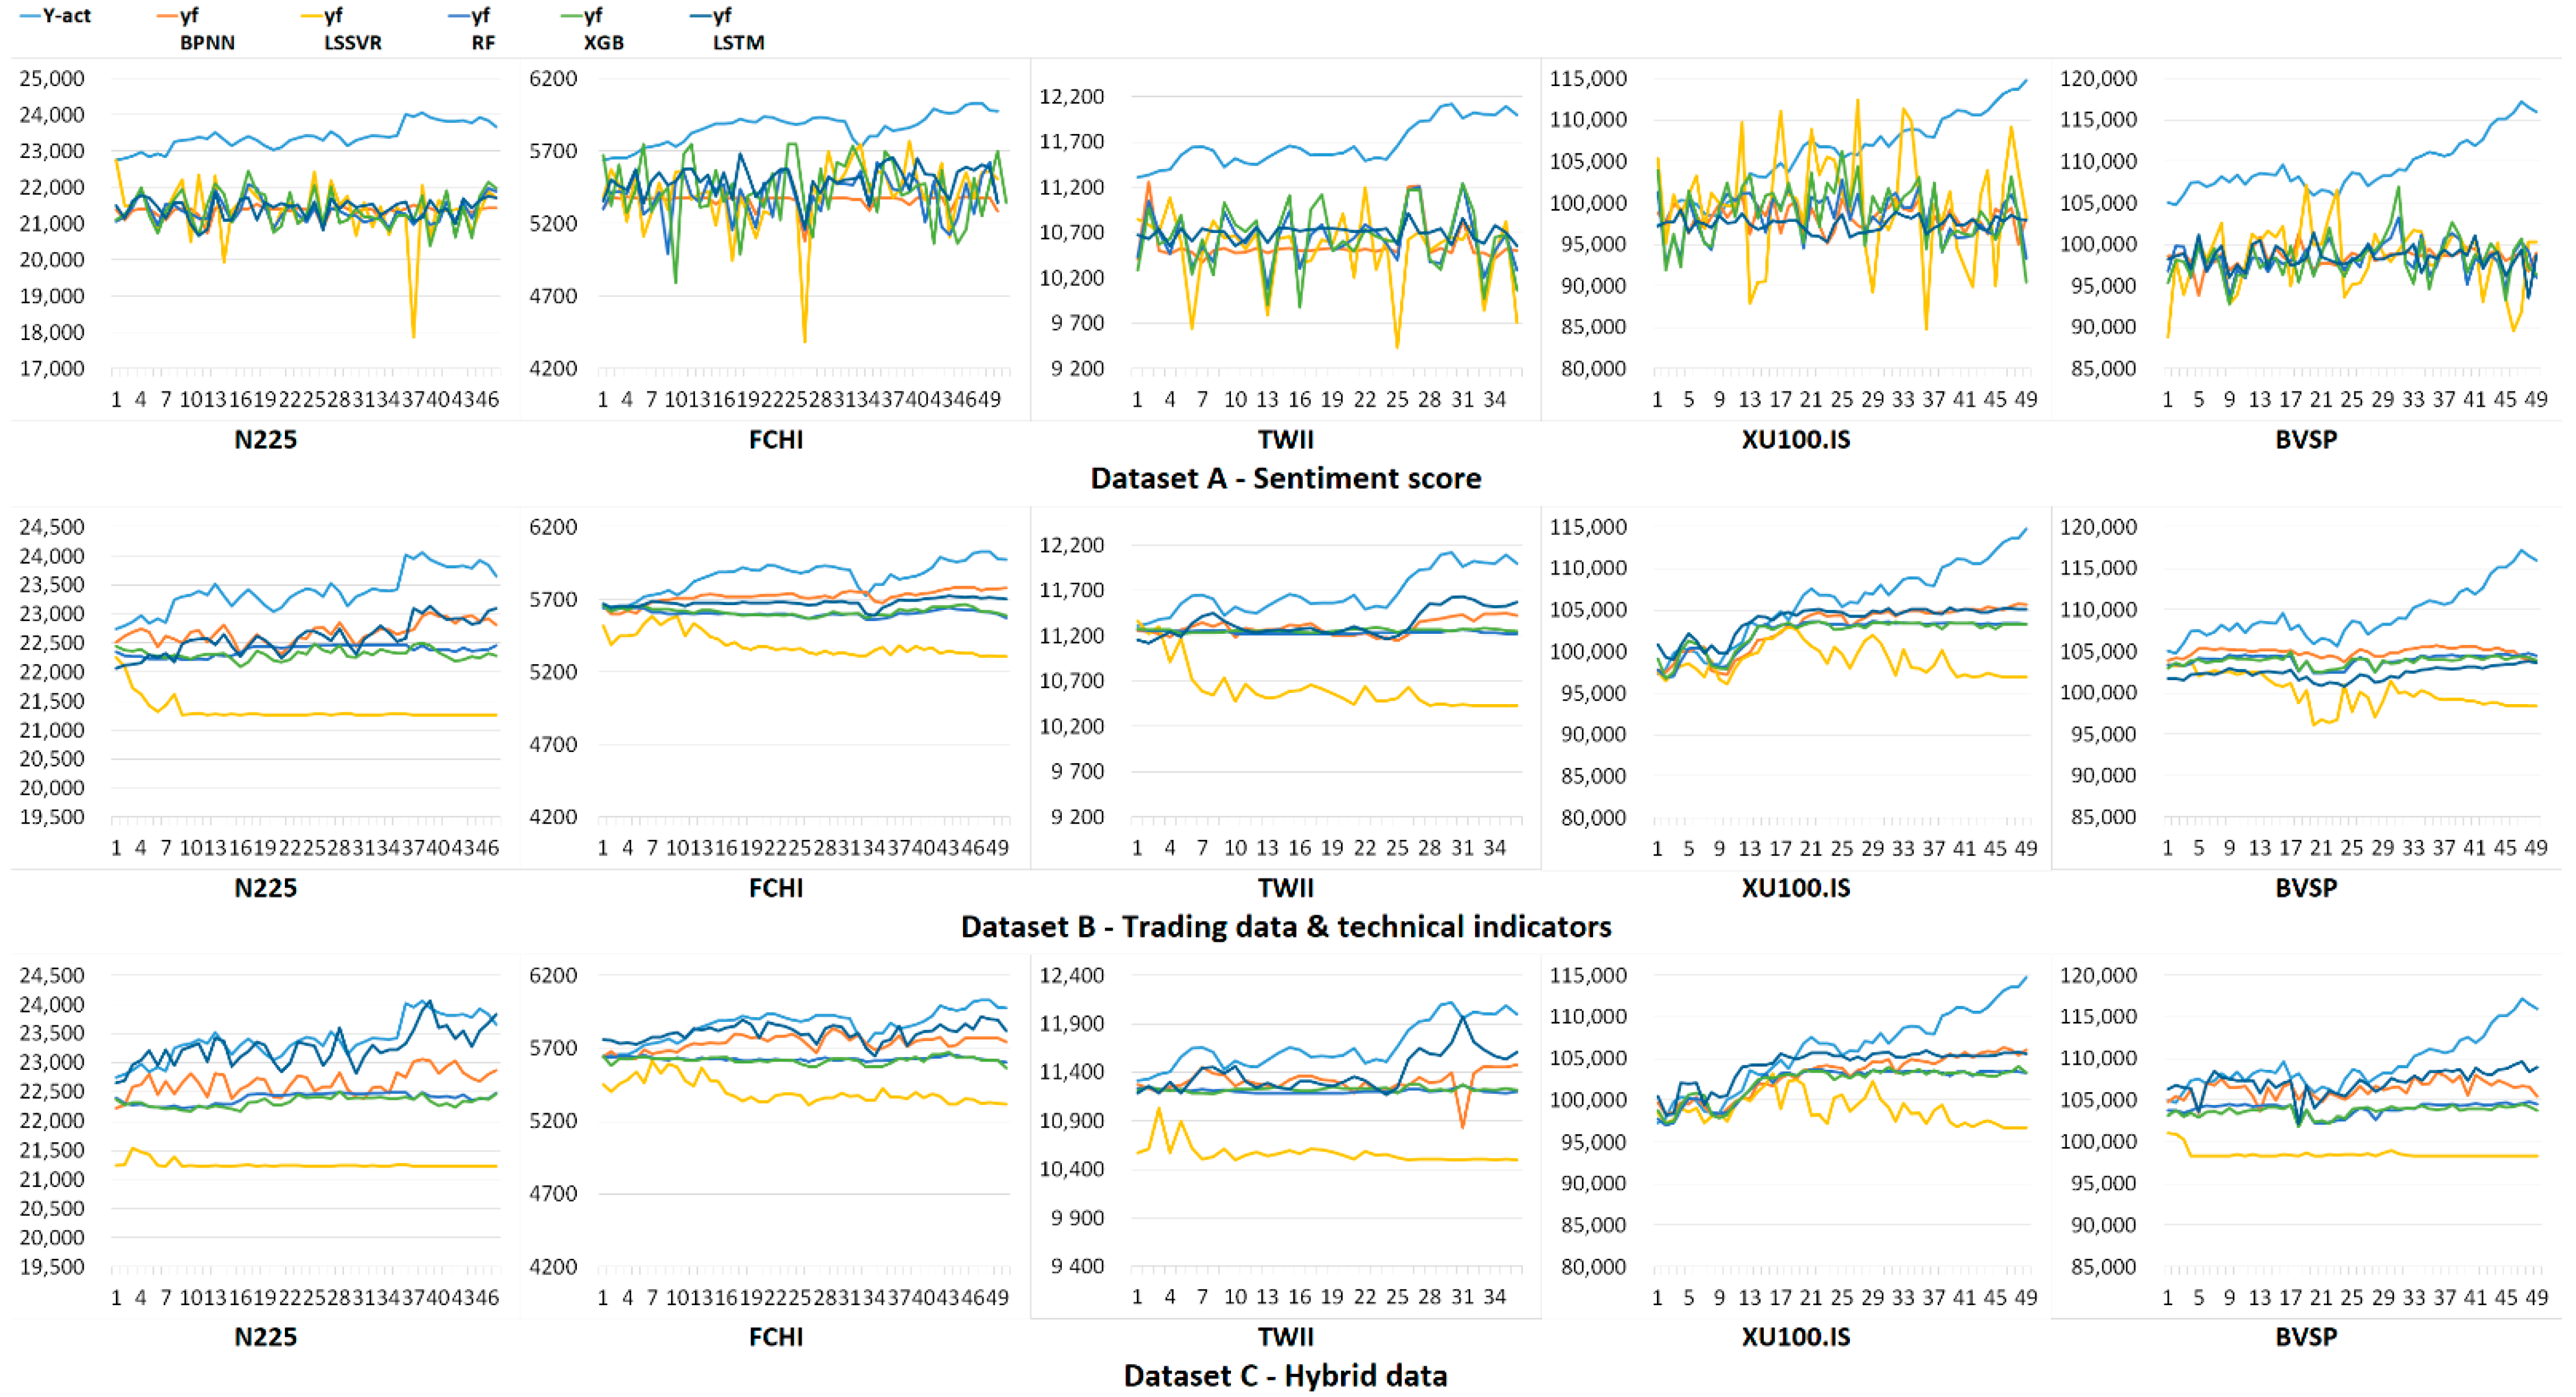
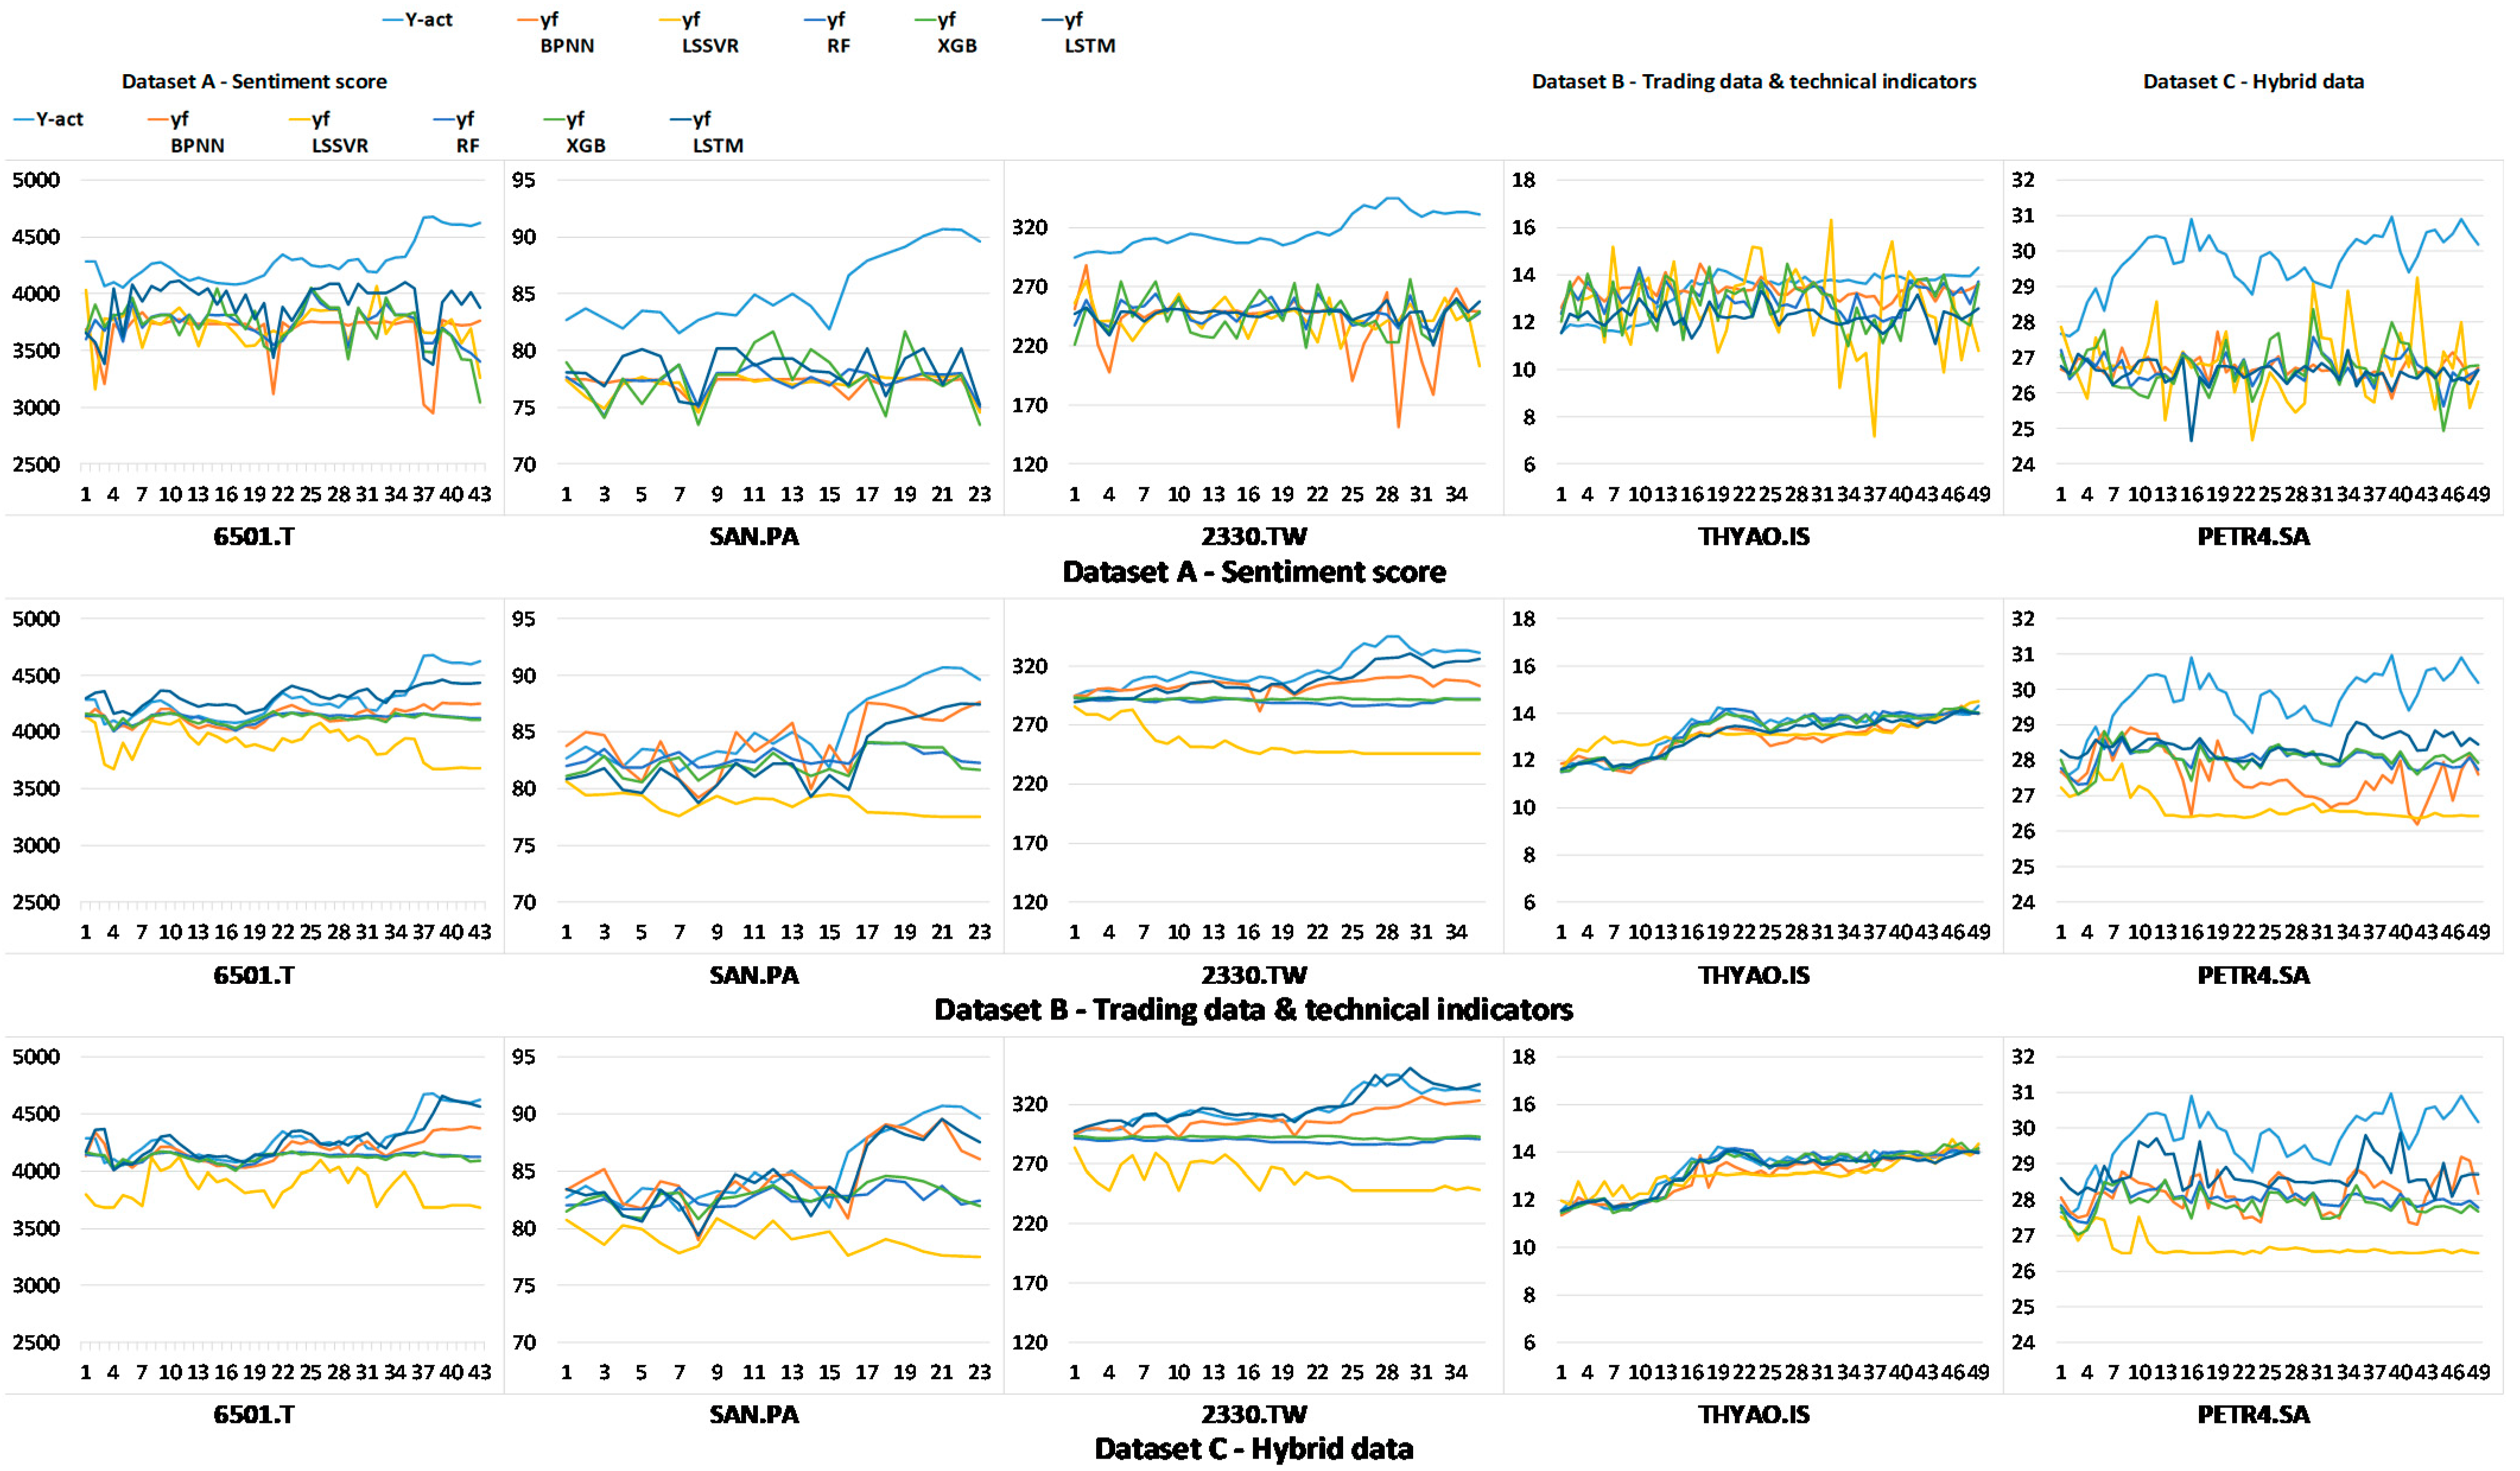
4. Numerical Results
5. Conclusions
Author Contributions
Funding
Conflicts of Interest
References
- Oliveira, N.; Cortez, P.; Areal, N. The impact of microblogging data for stock market prediction: Using twitter to predict returns, volatility, trading volume and survey sentiment indices. Expert Syst. Appl. 2017, 73, 125–144. [Google Scholar] [CrossRef] [Green Version]
- Broadstock, D.C.; Zhang, D. Social-media and intraday stock returns: The pricing power of sentiment. Financ. Res. Lett. 2019, 30, 116–123. [Google Scholar] [CrossRef]
- Wu, S.; Liu, Y.; Zou, Z.; Weng, T.-H. Silstm: Stock price prediction based on multiple data sources and sentiment analysis. Connect. Sci. 2022, 34, 44–62. [Google Scholar] [CrossRef]
- Ko, C.-R.; Chang, H.-T. Lstm-based sentiment analysis for stock price forecast. PeerJ Comput. Sci. 2021, 7, e408. [Google Scholar] [CrossRef] [PubMed]
- Ren, R.; Wu, D.D.; Liu, T. Forecasting stock market movement direction using sentiment analysis and support vector machine. IEEE Syst. J. 2018, 13, 760–770. [Google Scholar] [CrossRef]
- Gupta, I.; Madan, T.K.; Singh, S.; Singh, A.K. Hisa-smfm: Historical and sentiment analysis based stock market forecasting model. arXiv 2022, arXiv:2203.08143. [Google Scholar]
- Jing, N.; Wu, Z.; Wang, H. A hybrid model integrating deep learning with investor sentiment analysis for stock price prediction. Expert Syst. Appl. 2021, 178, 115019. [Google Scholar] [CrossRef]
- Wang, G.; Yu, G.; Shen, X. The effect of online investor sentiment on stock movements: An lstm approach. Complexity 2020, 2020, 4754025. [Google Scholar] [CrossRef]
- Shi, Y.; Zheng, Y.; Guo, K.; Ren, X. Stock movement prediction with sentiment analysis based on deep learning networks. Concurr. Comput. Pract. Exp. 2021, 33, e6076. [Google Scholar] [CrossRef]
- Chung, H.; Shin, K.-S. Genetic algorithm-optimized long short-term memory network for stock market prediction. Sustainability 2018, 10, 3765. [Google Scholar] [CrossRef] [Green Version]
- Fischer, T.; Krauss, C. Deep learning with long short-term memory networks for financial market predictions. Eur. J. Oper. Res. 2018, 270, 654–669. [Google Scholar] [CrossRef]
- Kamara, A.F.; Chen, E.; Pan, Z. An ensemble of a boosted hybrid of deep learning models and technical analysis for forecasting stock prices. Inf. Sci. 2022, 594, 1–19. [Google Scholar] [CrossRef]
- Lu, W.; Li, J.; Li, Y.; Sun, A.; Wang, J. A cnn-lstm-based model to forecast stock prices. Complexity 2020, 2020, 6622927. [Google Scholar] [CrossRef]
- Jin, Z.; Yang, Y.; Liu, Y. Stock closing price prediction based on sentiment analysis and lstm. Neural Comput. Appl. 2020, 32, 9713–9729. [Google Scholar] [CrossRef]
- Conneau, A.; Lample, G. Cross-lingual language model pretraining. Adv. Neural Inf. Process. Syst. 2019, 32, 7059–7069. [Google Scholar]
- Conneau, A.; Khandelwal, K.; Goyal, N.; Chaudhary, V.; Wenzek, G.; Guzmán, F.; Grave, É.; Ott, M.; Zettlemoyer, L.; Stoyanov, V. Unsupervised cross-lingual representation learning at scale. In Proceedings of the 58th Annual Meeting of the Association for Computational Linguistics, Online, 5–10 July 2020; pp. 8440–8451. [Google Scholar]
- Liu, Y.; Gu, J.; Goyal, N.; Li, X.; Edunov, S.; Ghazvininejad, M.; Lewis, M.; Zettlemoyer, L. Multilingual denoising pre-training for neural machine translation. Trans. Assoc. Comput. Linguist. 2020, 8, 726–742. [Google Scholar] [CrossRef]
- Palomino, D.; Ochoa-Luna, J. Palomino-ochoa at semeval-2020 task 9: Robust system based on transformer for code-mixed sentiment classification. In Proceedings of the Fourteenth Workshop on Semantic Evaluation, Barcelona (Online), Spain, 12–13 December 2020; pp. 963–967. [Google Scholar]
- Pei, Y.; Chen, S.; Ke, Z.; Silamu, W.; Guo, Q. Ab-labse: Uyghur sentiment analysis via the pre-training model with bilstm. Appl. Sci. 2022, 12, 1182. [Google Scholar] [CrossRef]
- Araújo, M.; Pereira, A.; Benevenuto, F. A comparative study of machine translation for multilingual sentence-level sentiment analysis. Inf. Sci. 2020, 512, 1078–1102. [Google Scholar] [CrossRef] [Green Version]
- Luo, J.; Zhu, G.; Xiang, H. Artificial intelligent based day-ahead stock market profit forecasting. Comput. Electr. Eng. 2022, 99, 107837. [Google Scholar] [CrossRef]
- Kanwal, A.; Lau, M.F.; Ng, S.P.; Sim, K.Y.; Chandrasekaran, S. Bicudnnlstm-1dcnn—a hybrid deep learning-based predictive model for stock price prediction. Expert Syst. Appl. 2022, 202, 117123. [Google Scholar] [CrossRef]
- Wang, C.; Chen, Y.; Zhang, S.; Zhang, Q. Stock market index prediction using deep transformer model. Expert Syst. Appl. 2022, 208, 118128. [Google Scholar] [CrossRef]
- Gao, R.; Cui, S.; Xiao, H.; Fan, W.; Zhang, H.; Wang, Y. Integrating the sentiments of multiple news providers for stock market index movement prediction: A deep learning approach based on evidential reasoning rule. Inf. Sci. 2022, 615, 529–556. [Google Scholar] [CrossRef]
- Kumar, G.; Singh, U.P.; Jain, S. An adaptive particle swarm optimization-based hybrid long short-term memory model for stock price time series forecasting. Soft Comput. 2022, 26, 12115–12135. [Google Scholar] [CrossRef] [PubMed]
- Aldhyani, T.H.; Alzahrani, A. Framework for predicting and modeling stock market prices based on deep learning algorithms. Electronics 2022, 11, 3149. [Google Scholar] [CrossRef]
- Ratchagit, M.; Xu, H. A two-delay combination model for stock price prediction. Mathematics 2022, 10, 3447. [Google Scholar] [CrossRef]
- Hochreiter, S.; Schmidhuber, J. Long short-term memory. Neural Comput. 1997, 9, 1735–1780. [Google Scholar] [CrossRef]
- Shahid, F.; Zameer, A.; Muneeb, M. Predictions for covid-19 with deep learning models of lstm, gru and bi-lstm. Chaos Solitons Fractals 2020, 140, 110212. [Google Scholar] [CrossRef]
- Li, W.; Kiaghadi, A.; Dawson, C. High temporal resolution rainfall–runoff modeling using long-short-term-memory (lstm) networks. Neural Comput. Appl. 2021, 33, 1261–1278. [Google Scholar] [CrossRef]
- Accarino, G.; Chiarelli, M.; Fiore, S.; Federico, I.; Causio, S.; Coppini, G.; Aloisio, G. A multi-model architecture based on long short-term memory neural networks for multi-step sea level forecasting. Future Gener. Comput. Syst. 2021, 124, 1–9. [Google Scholar] [CrossRef]
- Jin, N.; Yang, F.; Mo, Y.; Zeng, Y.; Zhou, X.; Yan, K.; Ma, X. Highly accurate energy consumption forecasting model based on parallel lstm neural networks. Adv. Eng. Inform. 2022, 51, 101442. [Google Scholar] [CrossRef]
- He, Q.-Q.; Wu, C.; Si, Y.-W. Lstm with particle swam optimization for sales forecasting. Electron. Commer. Res. Appl. 2022, 51, 101118. [Google Scholar] [CrossRef]
- Chen, H.; Li, X.; Wu, Y.; Zuo, L.; Lu, M.; Zhou, Y. Compressive strength prediction of high-strength concrete using long short-term memory and machine learning algorithms. Buildings 2022, 12, 302. [Google Scholar] [CrossRef]
- Lipton, Z.C.; Berkowitz, J.; Elkan, C. A critical review of recurrent neural networks for sequence learning. arXiv 2015, arXiv:1506.00019. [Google Scholar]
- Almalaq, A.; Edwards, G. A review of deep learning methods applied on load forecasting. In Proceedings of the 2017 16th IEEE International Conference on Machine Learning and Applications (ICMLA), Cancun, Mexico, 18–21 December 2017; pp. 511–516. [Google Scholar]
- Li, Z.; Luo, X.; Liu, M.; Cao, X.; Du, S.; Sun, H. Short-term prediction of the power of a new wind turbine based on iao-lstm. Energy Rep. 2022, 8, 9025–9037. [Google Scholar] [CrossRef]
- Puneeth, K.; Rudagi, S.; Namratha, M.; Patil, R.; Wadi, R. Comparative study: Stock prediction using fundamental and technical analysis. In Proceedings of the 2021 IEEE International Conference on Mobile Networks and Wireless Communications (ICMNWC), Tumkur, Karnataka, India, 3–4 December 2021; pp. 1–4. [Google Scholar]
- Nti, I.K.; Adekoya, A.F.; Weyori, B.A. A systematic review of fundamental and technical analysis of stock market predictions. Artif. Intell. Rev. 2020, 53, 3007–3057. [Google Scholar] [CrossRef]
- Ma, J.; Li, L. Data augmentation for chinese text classification using back-translation. J. Phys. Conf. Ser. 2020, 1651, 012039. [Google Scholar]
- Schnaider, K.; Schiavetto, S.; Meier, F.; Wasson, B.; Allsopp, B.B.; Spikol, D. Governmental response to the covid-19 pandemic-a quantitative ethnographic comparison of public health authorities’ communication in denmark, norway, and Sweden. In International Conference on Quantitative Ethnography; Springer: Berlin, Germany, 2021; pp. 406–421. [Google Scholar]
- Fuentes-Moraleda, L.; Diaz-Perez, P.; Orea-Giner, A.; Munoz-Mazon, A.; Villace-Molinero, T. Interaction between hotel service robots and humans: A hotel-specific service robot acceptance model (sram). Tour. Manag. Perspect. 2020, 36, 100751. [Google Scholar] [CrossRef]
- Leppert, K.; Saliterer, I.; Korać, S. The role of emotions for citizen engagement via social media—A study of police departments using twitter. Gov. Inf. Q. 2022, 39, 101686. [Google Scholar] [CrossRef]
- Thelwall, M.; Buckley, K.; Paltoglou, G. Sentiment strength detection for the social web. J. Am. Soc. Inf. Sci. Technol. 2012, 63, 163–173. [Google Scholar] [CrossRef] [Green Version]
- Thelwall, M.; Buckley, K.; Paltoglou, G.; Cai, D.; Kappas, A. Sentiment strength detection in short informal text. J. Am. Soc. Inf. Sci. Technol. 2010, 61, 2544–2558. [Google Scholar] [CrossRef] [Green Version]
- Li, X.; Xu, M.; Zeng, W.; Tse, Y.K.; Chan, H.K. Exploring customer concerns on service quality under the covid-19 crisis: A social media analytics study from the retail industry. J. Retail. Consum. Serv. 2022, 70, 103157. [Google Scholar] [CrossRef]
- Singh, S.P.; Adhikari, A.; Majumdar, A.; Bisi, A. Does service quality influence operational and financial performance of third party logistics service providers? A mixed multi criteria decision making-text mining-based investigation. Transp. Res. Part E Logist. Transp. Rev. 2022, 157, 102558. [Google Scholar] [CrossRef]
- Stieglitz, S.; Dang-Xuan, L. Emotions and information diffusion in social media—sentiment of microblogs and sharing behavior. J. Manag. Inf. Syst. 2013, 29, 217–248. [Google Scholar] [CrossRef]
- Liu, H.; Chen, C. Spatial air quality index prediction model based on decomposition, adaptive boosting, and three-stage feature selection: A case study in china. J. Clean. Prod. 2020, 265, 121777. [Google Scholar] [CrossRef]
- Samal, K.K.R.; Babu, K.S.; Das, S.K. Multi-output spatio-temporal air pollution forecasting using neural network approach. Appl. Soft Comput. 2022, 126, 109316. [Google Scholar] [CrossRef]
- Yang, L.; Shami, A. On hyperparameter optimization of machine learning algorithms: Theory and practice. Neurocomputing 2020, 415, 295–316. [Google Scholar] [CrossRef]
- Manna, A.K.; Rahman, M.S.; Shaikh, A.A.; Bhunia, A.K.; Konstantaras, I. Modeling of a carbon emitted production inventory system with interval uncertainty via meta-heuristic algorithms. Appl. Math. Model. 2022, 106, 343–368. [Google Scholar] [CrossRef]
- Tondut, J.; Ollier, C.; Di Cesare, N.; Roux, J.; Ronel, S. An automatic kriging machine learning method to calibrate meta-heuristic algorithms for solving optimization problems. Eng. Appl. Artif. Intell. 2022, 113, 104940. [Google Scholar] [CrossRef]
- Holland, J.H. Adaptation in Natural and Artificial Systems; The University of Michigan Press: Ann Arbor, MI, USA, 1975. [Google Scholar]
- Holland, J.H. Genetic algorithms. Sci. Am. 1992, 267, 66–73. [Google Scholar] [CrossRef]
- Hyndman, R.J.; Koehler, A.B. Another look at measures of forecast accuracy. Int. J. Forecast. 2006, 22, 679–688. [Google Scholar] [CrossRef] [Green Version]
- Lewis, C.D. Industrial and Business Forecasting Methods: A Practical Guide to Exponential Smoothing and Curve Fitting; Butterworth-Heinemann: Oxford, UK, 1982. [Google Scholar]
- Wilcoxon, F. Individual comparisons by ranking methods. In Breakthroughs in Statistics; Springer: Berlin, Germany, 1992; pp. 196–202. [Google Scholar]
- Tukey, J.W. Exploratory Data Analysis; Sage: Reading, MA, USA, 1977; Volume 2. [Google Scholar]
- Nuzzo, R.L. The box plots alternative for visualizing quantitative data. PM&R 2016, 8, 268–272. [Google Scholar]
- Moeini, B.; Haack, H.; Fairley, N.; Fernandez, V.; Gengenbach, T.R.; Easton, C.D.; Linford, M.R. Box plots: A simple graphical tool for visualizing overfitting in peak fitting as demonstrated with x-ray photoelectron spectroscopy data. J. Electron Spectrosc. Relat. Phenom. 2021, 250, 147094. [Google Scholar] [CrossRef]


| Ref. | The Proposed Deep Learning Method | Data Types | Problem Types | Stock Markets | |||
|---|---|---|---|---|---|---|---|
| Structured | Unstructured | Regression | Classification | Corporations’ Stock Price | Stock Market Index | ||
| Wu et al. [3] | LSTM | v | v | v | v | ||
| Gupta et al. [6] | LSTM | v | v | v | v | ||
| Kamara et al. [12] | EHTS (AB-CNN and CB-LSTM) | v | v | v | |||
| Luo et al. [21] | LSTM+ SFLA | v | v | v | |||
| Kanwal et al. [22] | BiCuDNNLSTM-1dCNN | v | v | v | v | ||
| Wang et al. [23] | Transformer | v | v | v | |||
| Gao et al. [24] | RNN-ER-GA | v | v | v | v | ||
| Kumar et al. [25] | PSO-LSTM | v | v | v | |||
| Aldhyani & Alzahrani [26] | CNN-LSTM | v | v | v | |||
| Ratchagit and Xu [27] | LSTM-DE | v | v | v | |||
| This study | LSTMGA | v | v | v | v | v | |
| Countries | Language | Codes | Names | Keywords | Number of Posts |
|---|---|---|---|---|---|
| Japan | Japanese | ^N225 | Nikkei 225 | “日経” | 6468 |
| 6501.T | Hitachi, Ltd. | “日立 株” | 1360 | ||
| France | French | ^FCHI | CAC 40 | “CAC” | 2563 |
| SAN.PA | Sanofi | “Sanofi action” | 304 | ||
| Taiwan | Traditional Chinese | ^TWII | TSEC weighted index | “台股” | 13,686 |
| 2330.TW | Taiwan Semiconductor Manufacturing Company Limited | “台積電 股票” | 21,649 | ||
| Turkey | Turkish | XU100.IS | BIST 100 | “xu100” | 18,143 |
| THYAO.IS | Türk Hava Yollari Anonim Ortakligi | “THYAO” | 21,398 | ||
| Brazil | Portuguese | ^BVSP | IBOVESPA | “Ibovespa” | 34,949 |
| PETR4.SA | Petróleo Brasileiro S.A.—Petrobras | “PETR4” | 9611 |
| Created at (UTC) | T Diff. | TR-Date Time | Text | Translation | Positive | Negative |
|---|---|---|---|---|---|---|
| 16 January 2019 20:57 | 3:00 | 16 January 2019 11:57 p.m. | herkes biliyor ANCAK; Neden yeni kişiler gelmek istemiyor veya çekiniyor bu DERSE? Bilgi var… Heyecan var… Para var… Bilgiyi paylaşan lider var. | everyone knows but; Why do new people don’t want or hesitate to come?<br>There is information. <br>There is excitement. <br>There is money.<br>There is a leader who shares the information.<br>Have fear.<br> Our timid nation is a hundred were given a hundred.<br>#bist# bist100#usdtry# Xu100# | 3 | −4 |
| KORKU var. çekingen milletimiz, yüz verildi mi de başa çıkılmaz. | ||||||
| #bist #bist100 #usdtry #XU100 #𝒷𝑒𝓁𝑒𝓃𝓈𝒶𝓎 | ||||||
| 17 January 2019 05:00 | 3:00 | 17 January 2019 8:00 a.m. | #XU100 mb kararina cok fazla anlam yuklenmis gibi bi his var icimde | #XU100 MB DECINE COK COK IN I COULD BI FISH LIKE MEANING | 2 | −1 |
| Independent Variables | Sentiment Scores of Posts | Independent Variables | Trading Data and Technical Indicators |
|---|---|---|---|
| Score −5 | Open | ||
| Score −4 | High | ||
| Score −3 | Low | ||
| Score −2 | Volume | ||
| Score −1 | K% | ||
| Score +1 | D% | ||
| Score +2 | William R% | ||
| Score +3 | RSI | ||
| Score +4 | MACD | ||
| Score +5 | PSY | ||
| MA | |||
| BIAS | |||
| Datasets | Content of Data | Variables |
|---|---|---|
| Data A | Sentiment scores of posts | |
| Data B | Trading data and technical indicators | – |
| Data C | Sentiment scores of posts, trading data, and technical indicators | – |
| Stock Market Indices/Corporation Stocks | Periods of Training Data (Date/Month/Year) | Periods of Testing Data (Date/Month/Year) |
|---|---|---|
| N225 | from 7 January 2019 to 23 October 2019 | from 24 October 2019 to 30 December 2019 |
| FCHI | from 3 January 2019 to 17 October 2019 | from 18 October 2019 to 31 December 2019 |
| TWII | from 3 January 2019 to 25 October 2019 | from 28 October 2019 to 31 December 2019 |
| XU100.IS | from 3 January 2019 to 18 October 2019 | from 21 October 2019 to 30 December 2019 |
| BVSP | from 3 January 2019 to 16 October 2019 | from 17 October 2019 to 30 December 2019 |
| 6501.T | from 7 January 2019 to 25 October 2019 | from 29 October 2019 to 30 December 2019 |
| SAN.PA | from 9 January 2019 to 14 October 2019 | from 16 October 2019 to 31 December 2019 |
| 2330.TW | from 3 January 2019 to 25 October 2019 | from 28 October 2019 to 31 December 2019 |
| THYAO.IS | from 3 January 2019 to 21 October 2019 | from 22 October 2019 to 30 December 2019 |
| PETR4.SA | from 3 January 2019 to 16 October 2019 | from 17 October 2019 to 30 December 2019 |
| Stock Market Indices | N225 | FCHI | TWII | XU100.IS | BVSP | |||||||||||
|---|---|---|---|---|---|---|---|---|---|---|---|---|---|---|---|---|
| Models | Parameters | Datasets | ||||||||||||||
| A | B | C | A | B | C | A | B | C | A | B | C | A | B | C | ||
| BPNNGA | learning rate | 0.82 | 0.34 | 0.47 | 0.48 | 0.90 | 0.83 | 0.59 | 0.54 | 0.62 | 0.69 | 0.53 | 0.17 | 0.46 | 0.81 | 0.59 |
| momentum | 0.56 | 0.89 | 0.74 | 0.22 | 0.63 | 0.79 | 0.47 | 0.85 | 0.78 | 0.89 | 0.89 | 0.63 | 0.64 | 0.50 | 0.53 | |
| LSSVRGA | gamma | 430.52 | 340.01 | 379.89 | 139.26 | 400.66 | 462.75 | 439.74 | 450.04 | 486.97 | 254.08 | 498.83 | 327.74 | 360.79 | 252.90 | 475.74 |
| sigma | 1.23 | 1.61 | 2.11 | 1.07 | 1.17 | 2.31 | 1.27 | 1.53 | 1.52 | 1.90 | 1.23 | 2.21 | 1.01 | 3.36 | 1.01 | |
| RFGA | ntree * | 225 | 336 | 454 | 113 | 418 | 170 | 178 | 102 | 217 | 156 | 188 | 213 | 125 | 236 | 361 |
| mtry * | 9 | 11 | 20 | 10 | 9 | 20 | 10 | 10 | 10 | 10 | 11 | 18 | 10 | 10 | 14 | |
| nodesize * | 3 | 7 | 4 | 3 | 5 | 5 | 3 | 3 | 3 | 3 | 3 | 3 | 3 | 3 | 3 | |
| samplesize * | 6 | 11 | 19 | 2 | 9 | 19 | 3 | 12 | 18 | 8 | 7 | 19 | 7 | 11 | 11 | |
| maxnodes * | 88 | 56 | 90 | 94 | 83 | 60 | 87 | 75 | 98 | 91 | 81 | 81 | 97 | 61 | 93 | |
| XGBoostGA | colsample_bytree * | 0.97 | 0.96 | 0.87 | 0.95 | 0.81 | 0.77 | 0.96 | 0.92 | 0.96 | 0.98 | 0.94 | 0.81 | 0.93 | 0.77 | 0.75 |
| subsample * | 0.87 | 0.93 | 0.82 | 0.89 | 0.93 | 0.87 | 0.97 | 0.91 | 0.82 | 0.89 | 0.97 | 0.97 | 0.89 | 0.98 | 0.90 | |
| max_depth * | 10 | 8 | 6 | 10 | 10 | 9 | 10 | 10 | 7 | 8 | 9 | 10 | 9 | 8 | 6 | |
| eta * | 0.09 | 0.09 | 0.09 | 0.10 | 0.09 | 0.08 | 0.09 | 0.09 | 0.10 | 0.10 | 0.08 | 0.09 | 0.09 | 0.10 | 0.10 | |
| gamma | 0.17 | 0.02 | 0.00 | 0.25 | 0.27 | 0.02 | 0.20 | 0.11 | 0.14 | 0.97 | 0.05 | 0.37 | 0.25 | 0.07 | 0.18 | |
| min_child_weight * | 3.68 | 5.86 | 3.53 | 3.64 | 3.14 | 3.62 | 3.11 | 3.45 | 3.58 | 3.91 | 3.61 | 3.05 | 3.18 | 3.99 | 3.86 | |
| lambda * | 0.62 | 0.51 | 0.70 | 0.79 | 0.88 | 1.04 | 1.00 | 1.31 | 0.86 | 0.58 | 0.99 | 0.80 | 0.68 | 0.59 | 1.37 | |
| LSTMGA | dropout rate | 0.00 | 0.14 | 0.08 | 0.02 | 0.00 | 0.05 | 0.31 | 0.13 | 0.11 | 0.37 | 0.07 | 0.00 | 0.58 | 0.00 | 0.08 |
| learning rate | 0.00 | 0.01 | 0.01 | 0.01 | 0.08 | 0.05 | 0.00 | 0.00 | 0.00 | 0.00 | 0.09 | 0.00 | 0.00 | 0.09 | 0.06 | |
| batch size | 95 | 31 | 43 | 77 | 64 | 56 | 89 | 11 | 14 | 64 | 57 | 81 | 71 | 67 | 57 | |
| Datasets of Country Stocks | 6501.T | SAN.PA | 2330.TW | THYAO | PETR4 | |||||||||||
|---|---|---|---|---|---|---|---|---|---|---|---|---|---|---|---|---|
| Model | Parameters | Datasets | ||||||||||||||
| A | B | C | A | B | C | A | B | C | A | B | C | A | B | C | ||
| BPNNGA | learning rate | 0.66 | 0.02 | 0.44 | 0.16 | 0.32 | 0.15 | 0.29 | 0.40 | 0.17 | 0.34 | 0.38 | 0.15 | 0.83 | 0.64 | 0.38 |
| momentum | 0.75 | 0.61 | 0.69 | 0.78 | 0.60 | 0.89 | 0.75 | 0.04 | 0.80 | 0.19 | 0.69 | 0.90 | 0.55 | 0.73 | 0.84 | |
| LSSVRGA | gamma | 488.82 | 491.46 | 388.61 | 375.15 | 344.13 | 490.07 | 315.27 | 460.89 | 467.67 | 469.70 | 386.07 | 465.42 | 243.43 | 362.72 | 477.66 |
| sigma | 1.25 | 1.54 | 2.11 | 1.68 | 1.28 | 3.10 | 1.08 | 1.50 | 3.82 | 1.12 | 1.06 | 2.78 | 1.16 | 1.05 | 1.77 | |
| RFGA | ntree * | 102 | 115 | 266 | 315 | 131 | 303 | 185 | 241 | 171 | 154 | 376 | 392 | 396 | 258 | 133 |
| mtry * | 8 | 8 | 16 | 7 | 12 | 21 | 8 | 10 | 17 | 10 | 11 | 13 | 10 | 11 | 19 | |
| nodesize * | 3 | 5 | 3 | 3 | 3 | 3 | 4 | 3 | 10 | 3 | 3 | 4 | 3 | 4 | 4 | |
| samplesize * | 6 | 9 | 2 | 6 | 4 | 20 | 8 | 5 | 12 | 8 | 5 | 10 | 10 | 2 | 14 | |
| maxnodes * | 99 | 63 | 75 | 95 | 51 | 61 | 90 | 57 | 51 | 92 | 89 | 98 | 97 | 87 | 82 | |
| XGBoostGA | colsample_bytree * | 0.99 | 0.96 | 0.83 | 0.98 | 0.88 | 0.92 | 0.90 | 0.75 | 0.82 | 0.96 | 0.93 | 0.71 | 0.93 | 0.95 | 0.98 |
| subsample * | 0.97 | 0.74 | 0.95 | 0.84 | 0.96 | 0.79 | 0.97 | 0.72 | 0.90 | 0.89 | 0.88 | 0.87 | 0.82 | 0.79 | 0.75 | |
| max_depth * | 10 | 9 | 9 | 8 | 10 | 6 | 7 | 10 | 8 | 10 | 8 | 10 | 10 | 9 | 9 | |
| eta * | 0.10 | 0.09 | 0.09 | 0.10 | 0.07 | 0.10 | 0.10 | 0.07 | 0.10 | 0.10 | 0.10 | 0.10 | 0.09 | 0.08 | 0.09 | |
| gamma | 0.14 | 0.27 | 0.02 | 0.37 | 0.00 | 0.03 | 0.36 | 0.00 | 0.07 | 0.00 | 0.00 | 0.01 | 0.13 | 0.00 | 0.01 | |
| min_child_weight * | 3.94 | 3.26 | 3.73 | 3.82 | 3.66 | 4.76 | 3.91 | 3.85 | 3.10 | 3.40 | 4.76 | 4.61 | 3.54 | 3.54 | 3.44 | |
| lambda * | 0.52 | 0.58 | 0.67 | 0.67 | 0.93 | 0.98 | 0.68 | 0.61 | 0.52 | 1.35 | 0.70 | 0.70 | 0.51 | 0.54 | 0.59 | |
| LSTMGA | dropout rate | 0.00 | 0.05 | 0.11 | 0.79 | 0.01 | 0.00 | 0.53 | 0.00 | 0.00 | 0.00 | 0.24 | 0.26 | 0.00 | 0.12 | 0.00 |
| learning rate | 0.01 | 0.05 | 0.01 | 0.00 | 0.01 | 0.02 | 0.01 | 0.01 | 0.00 | 0.01 | 0.01 | 0.00 | 0.01 | 0.09 | 0.07 | |
| batch size | 81 | 75 | 77 | 48 | 101 | 80 | 73 | 82 | 81 | 38 | 91 | 23 | 76 | 55 | 12 | |
| Result | Dataset A | Dataset B | Dataset C | ||||||||||||
|---|---|---|---|---|---|---|---|---|---|---|---|---|---|---|---|
| Model | BPNN | LSSVR | RF | XGBoost | LSTM | BPNN | LSSVR | RF | XGBoost | LSTM | BPNN | LSSVR | RF | XGBoost | LSTM |
| With GA | With GA | With GA | |||||||||||||
| MAPE | |||||||||||||||
| N225 | 8.75% | 8.65% | 8.79% | 8.58% | 8.45% | 3.04% | 8.76% | 4.35% | 4.62% | 3.45% | 3.13% | 9.13% | 4.29% | 4.56% | 0.90% |
| FCHI | 8.51% | 7.64% | 7.89% | 7.32% | 6.16% | 2.39% | 7.97% | 4.31% | 4.15% | 3.08% | 2.15% | 7.82% | 3.95% | 4.11% | 1.37% |
| TWII | 9.48% | 9.86% | 8.87% | 8.80% | 8.34% | 3.23% | 8.96% | 3.69% | 3.53% | 2.84% | 3.14% | 9.42% | 3.99% | 3.83% | 2.37% |
| XU100.IS | 7.21% | 7.30% | 7.22% | 6.99% | 7.85% | 3.01% | 6.59% | 3.57% | 3.70% | 2.82% | 2.91% | 6.58% | 3.59% | 3.69% | 2.59% |
| BVSP | 10.01% | 9.99% | 10.15% | 10.17% | 10.01% | 4.10% | 8.49% | 4.97% | 5.11% | 6.42% | 2.88% | 9.90% | 4.96% | 5.21% | 2.26% |
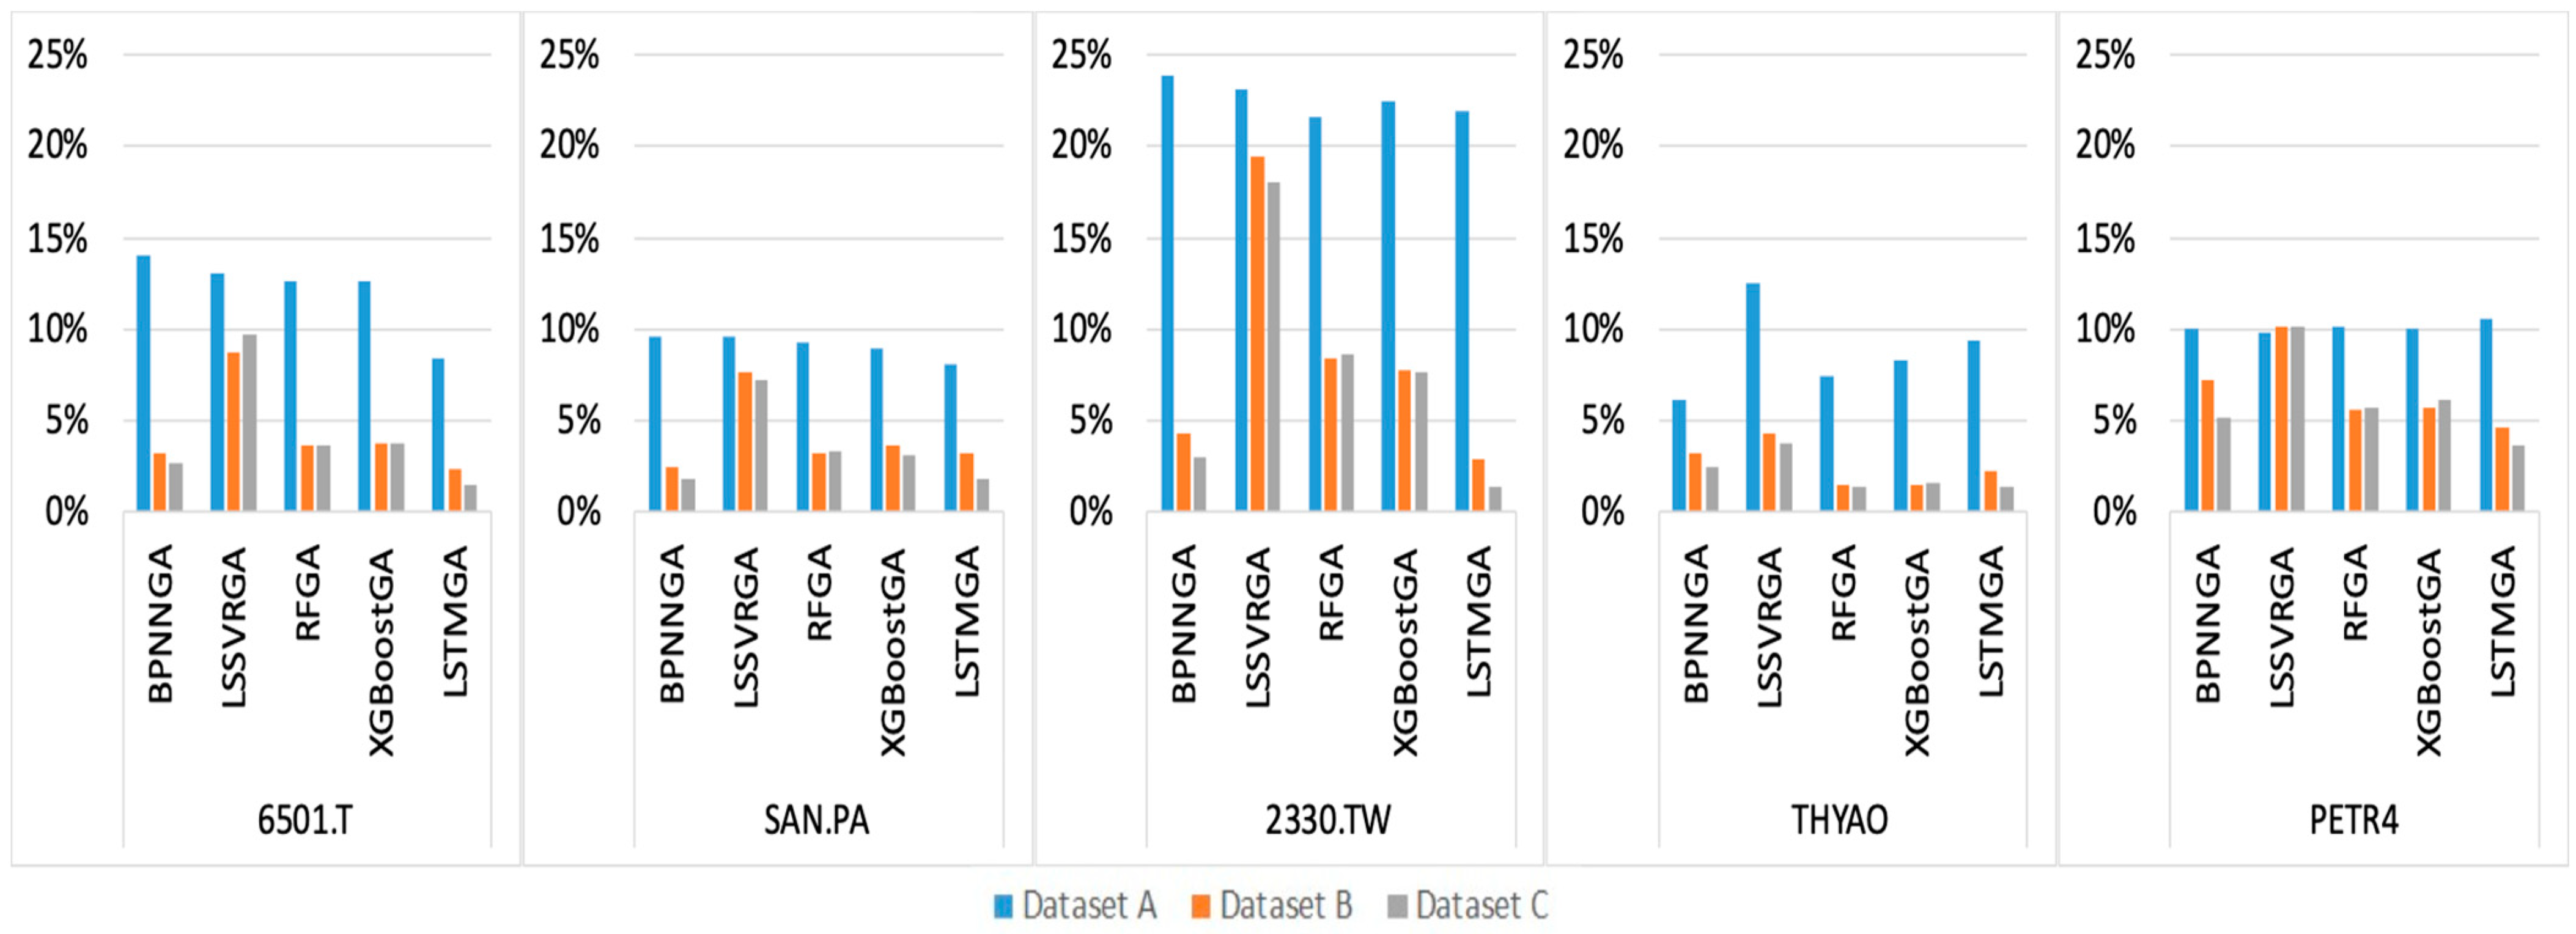
| 6501.T | 14.01% | 13.01% | 12.62% | 12.66% | 8.45% | 3.24% | 8.72% | 3.63% | 3.75% | 2.38% | 2.63% | 9.70% | 3.69% | 3.78% | 1.52% |
| SAN.PA | 9.55% | 9.60% | 9.28% | 8.98% | 8.05% | 2.47% | 7.61% | 3.22% | 3.67% | 3.21% | 1.82% | 7.23% | 3.30% | 3.14% | 1.77% |
| 2330.TW | 23.85% | 23.08% | 21.59% | 22.48% | 21.90% | 4.28% | 19.47% | 8.42% | 7.77% | 2.92% | 3.00% | 18.07% | 8.62% | 7.66% | 1.40% |
| THYAO | 6.11% | 12.52% | 7.48% | 8.27% | 9.41% | 3.24% | 4.26% | 1.44% | 1.49% | 2.27% | 2.50% | 3.80% | 1.36% | 1.61% | 1.34% |
| PETR4 | 10.05% | 9.80% | 10.19% | 10.08% | 10.59% | 7.23% | 10.14% | 5.64% | 5.67% | 4.60% | 5.16% | 10.17% | 5.65% | 6.16% | 3.67% |
| AVG | 10.75% | 11.15% | 10.41% | 10.43% | 9.92% | 3.62% | 9.10% | 4.32% | 4.34% | 3.40% | 2.93% | 9.18% | 4.34% | 4.37% | 1.92% |
| RMSE | |||||||||||||||
| N225 | 2080.83 | 2218.85 | 2109.20 | 2090.46 | 2029.31 | 762.59 | 2112.66 | 1069.20 | 1138.02 | 827.54 | 777.42 | 2172.70 | 1055.81 | 1117.88 | 257.77 |
| FCHI | 513.78 | 514.42 | 498.57 | 498.82 | 386.41 | 155.94 | 498.54 | 276.65 | 268.09 | 201.42 | 146.00 | 489.88 | 256.68 | 263.94 | 93.59 |
| TWII | 1151.80 | 1256.76 | 1102.66 | 1120.83 | 1009.56 | 420.71 | 1138.81 | 495.34 | 477.41 | 355.72 | 436.83 | 1145.30 | 525.35 | 509.01 | 306.86 |
| XU100.IS | 9278.79 | 9993.83 | 9339.83 | 9335.92 | 9727.60 | 3977.33 | 8816.53 | 4967.54 | 5089.79 | 3927.51 | 3843.38 | 8959.34 | 4986.33 | 5049.84 | 3636.73 |
| BVSP | 11,476.13 | 12,223.49 | 11,792.59 | 11,890.42 | 11,631.26 | 5518.08 | 10,345.52 | 6177.33 | 6366.20 | 7545.21 | 4296.98 | 11,449.87 | 6183.92 | 6464.43 | 3368.77 |
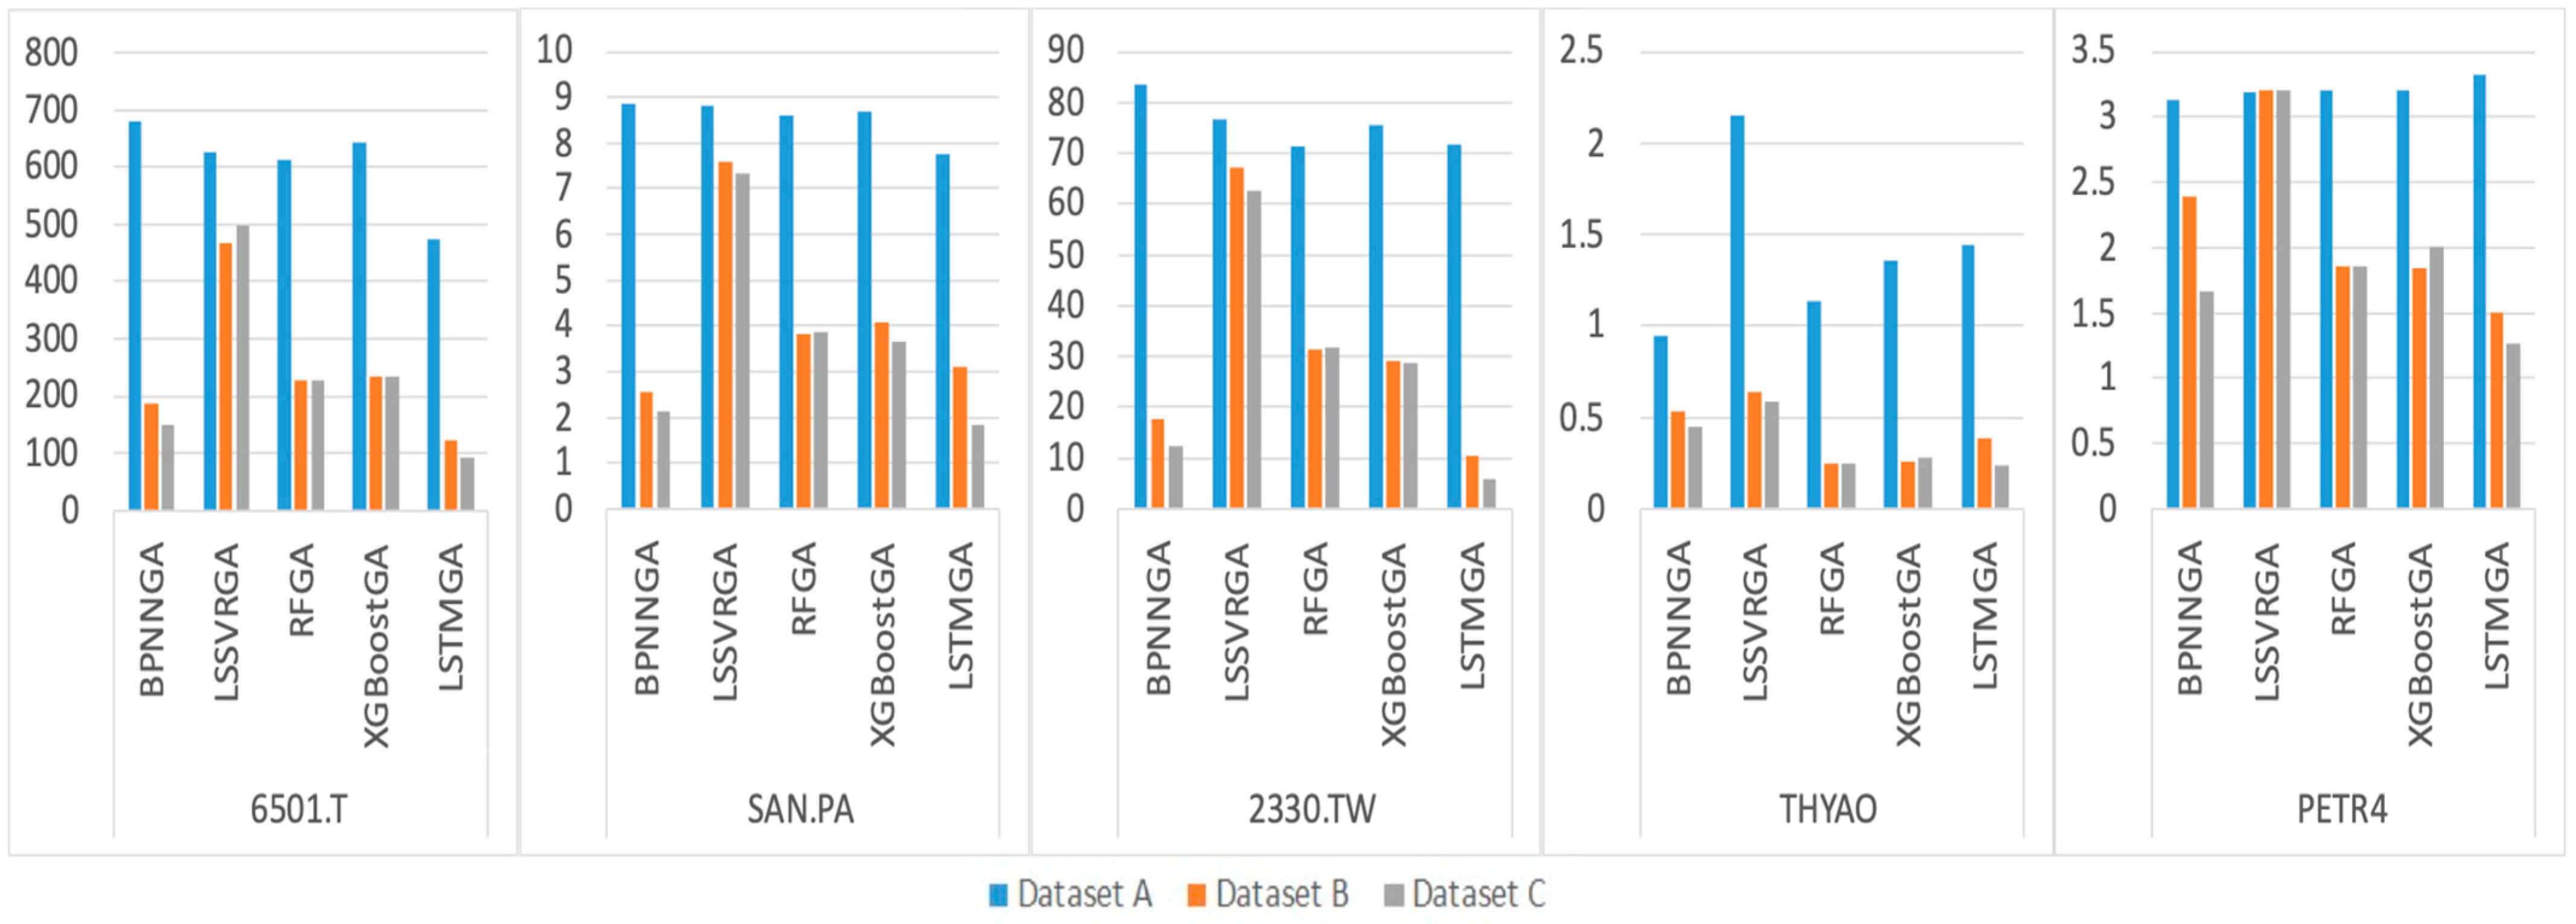
| 6501.T | 679.32 | 625.10 | 611.66 | 642.74 | 474.37 | 187.02 | 468.72 | 225.58 | 232.39 | 123.53 | 147.92 | 499.02 | 227.59 | 233.55 | 92.86 |
| SAN.PA | 8.84 | 8.81 | 8.60 | 8.71 | 7.76 | 2.56 | 7.57 | 3.81 | 4.06 | 3.09 | 2.13 | 7.35 | 3.85 | 3.67 | 1.84 |
| 2330.TW | 83.50 | 76.86 | 71.46 | 75.66 | 71.59 | 17.79 | 67.27 | 31.27 | 28.98 | 10.57 | 12.22 | 62.46 | 31.72 | 28.81 | 5.84 |
| THYAO | 0.94 | 2.15 | 1.13 | 1.36 | 1.44 | 0.53 | 0.64 | 0.25 | 0.26 | 0.38 | 0.44 | 0.59 | 0.24 | 0.28 | 0.24 |
| PETR4 | 3.13 | 3.18 | 3.20 | 3.21 | 3.32 | 2.39 | 3.21 | 1.85 | 1.84 | 1.50 | 1.67 | 3.21 | 1.85 | 2.00 | 1.27 |
| AVG | 2527.71 | 2692.34 | 2553.89 | 2566.81 | 2534.26 | 1104.49 | 2345.95 | 1324.88 | 1360.70 | 1299.65 | 966.50 | 2478.97 | 1327.33 | 1367.34 | 776.58 |
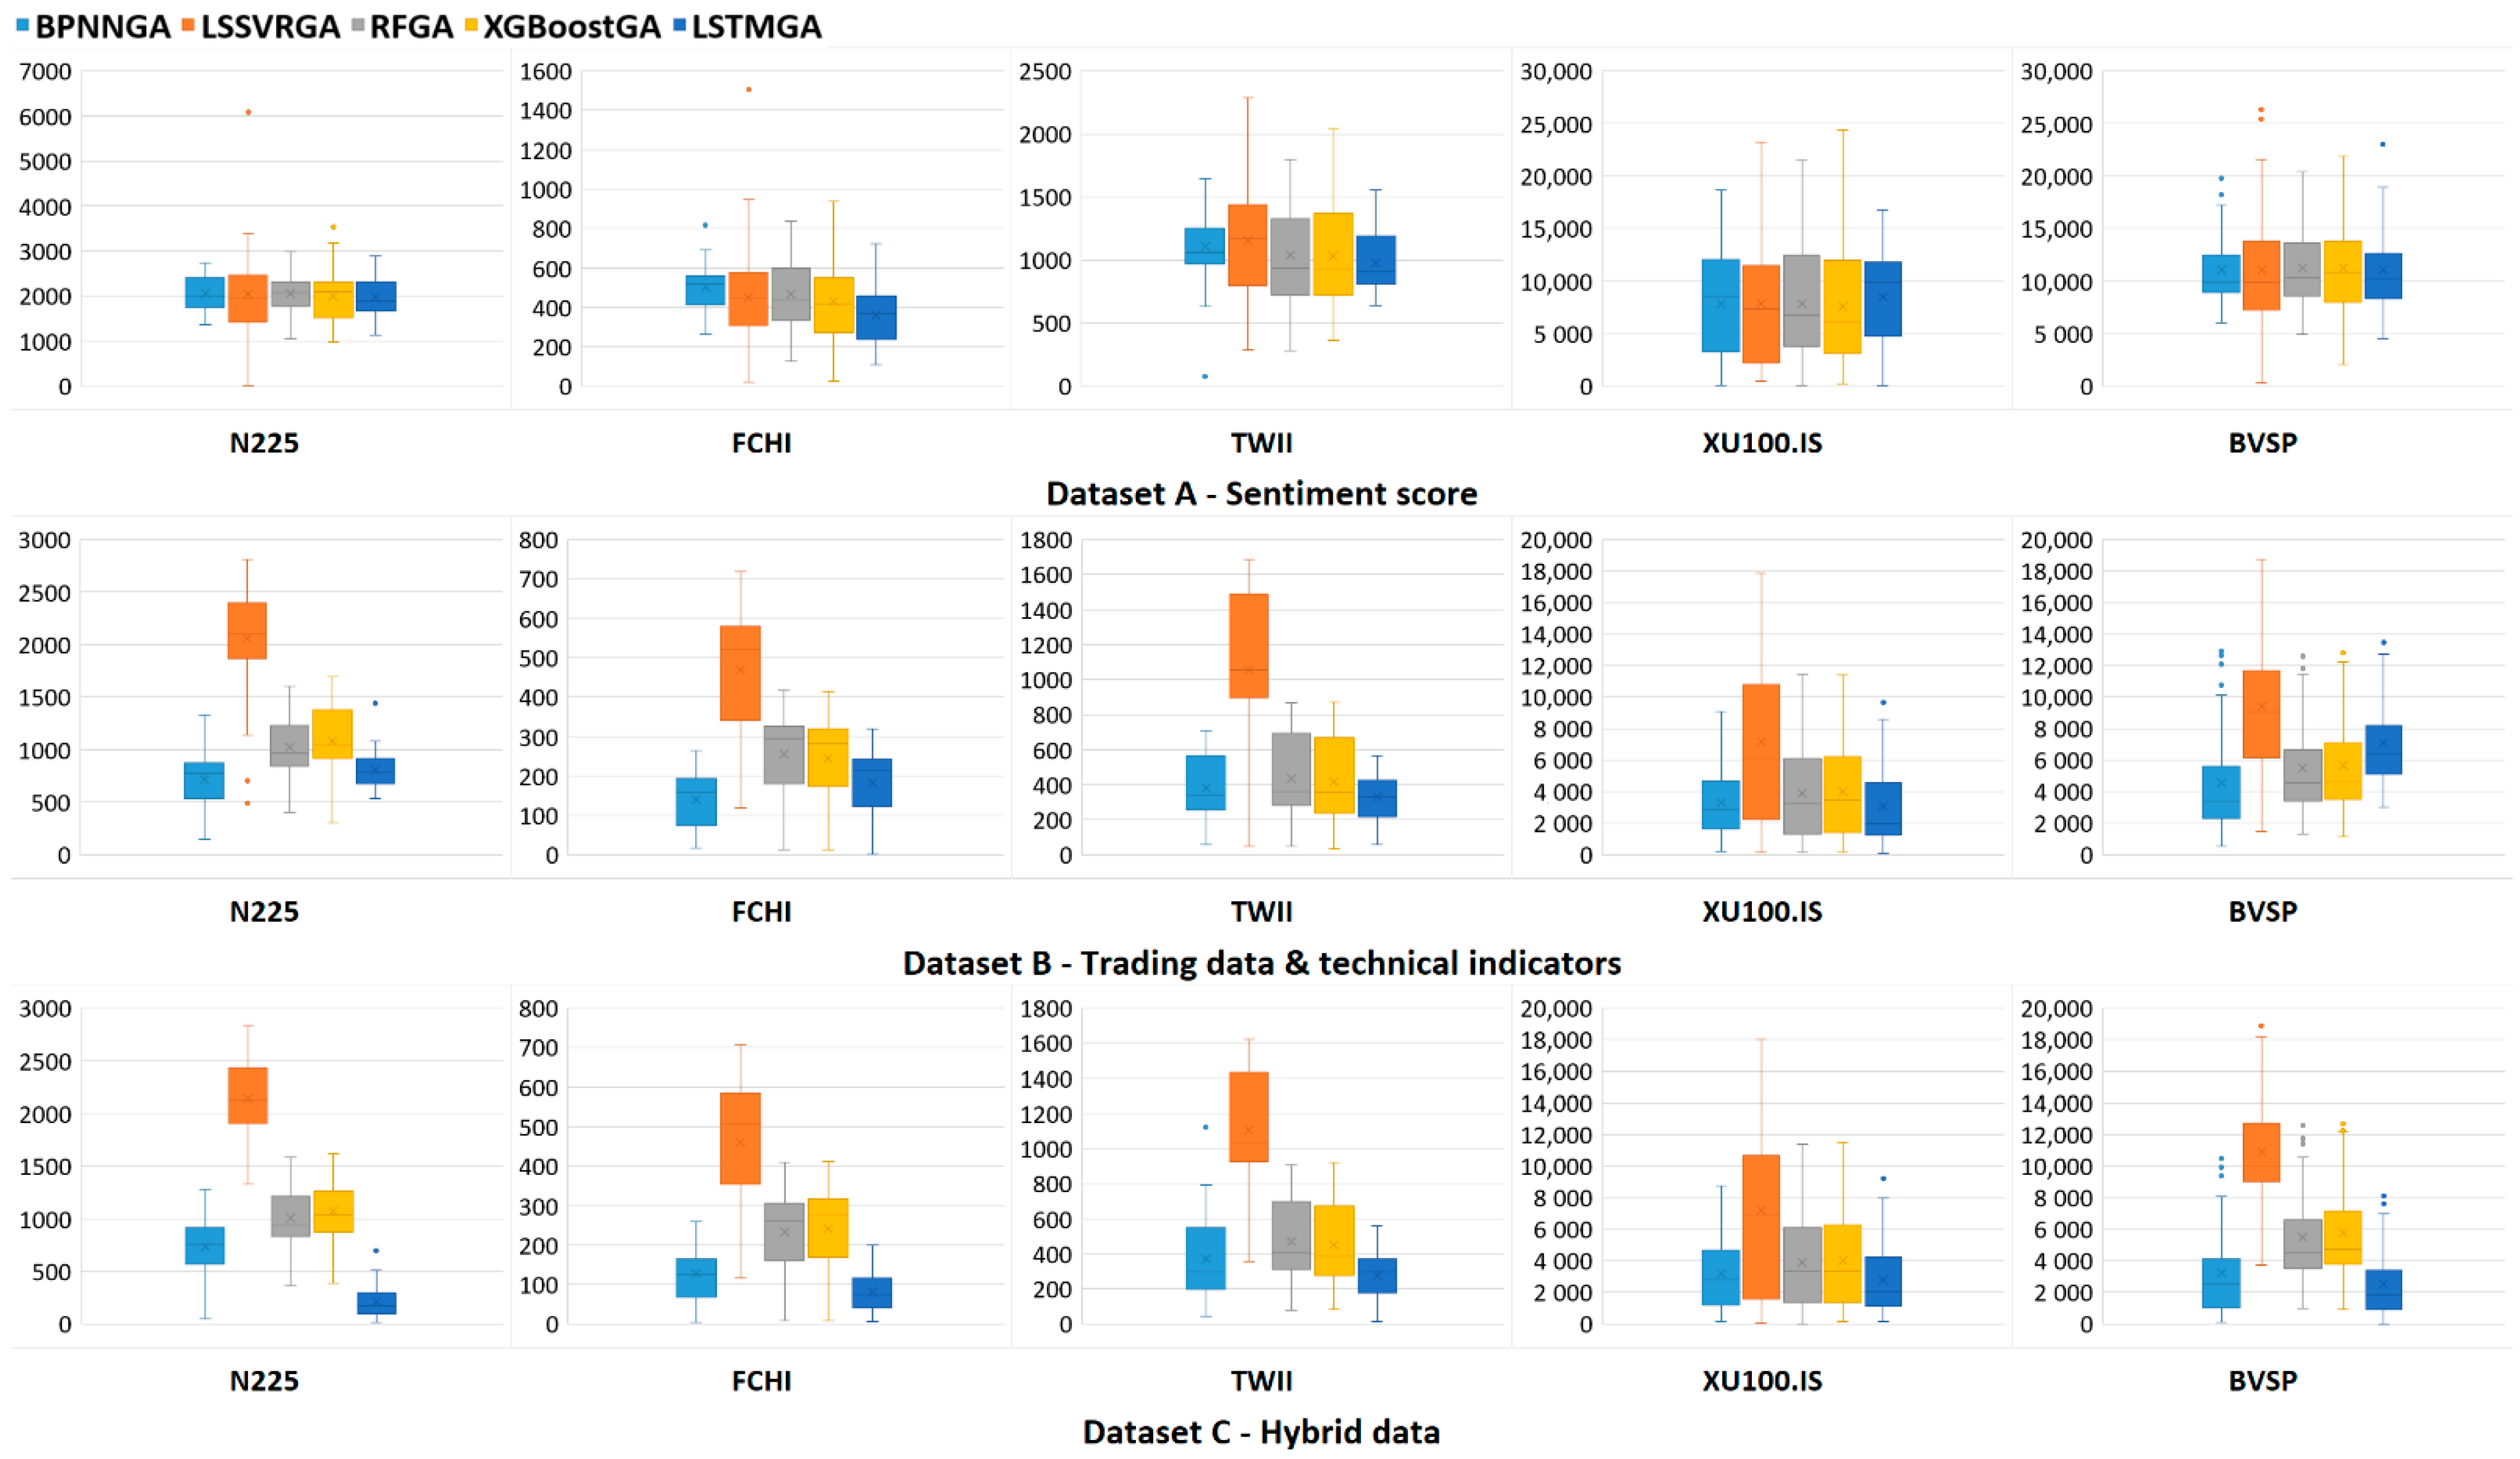
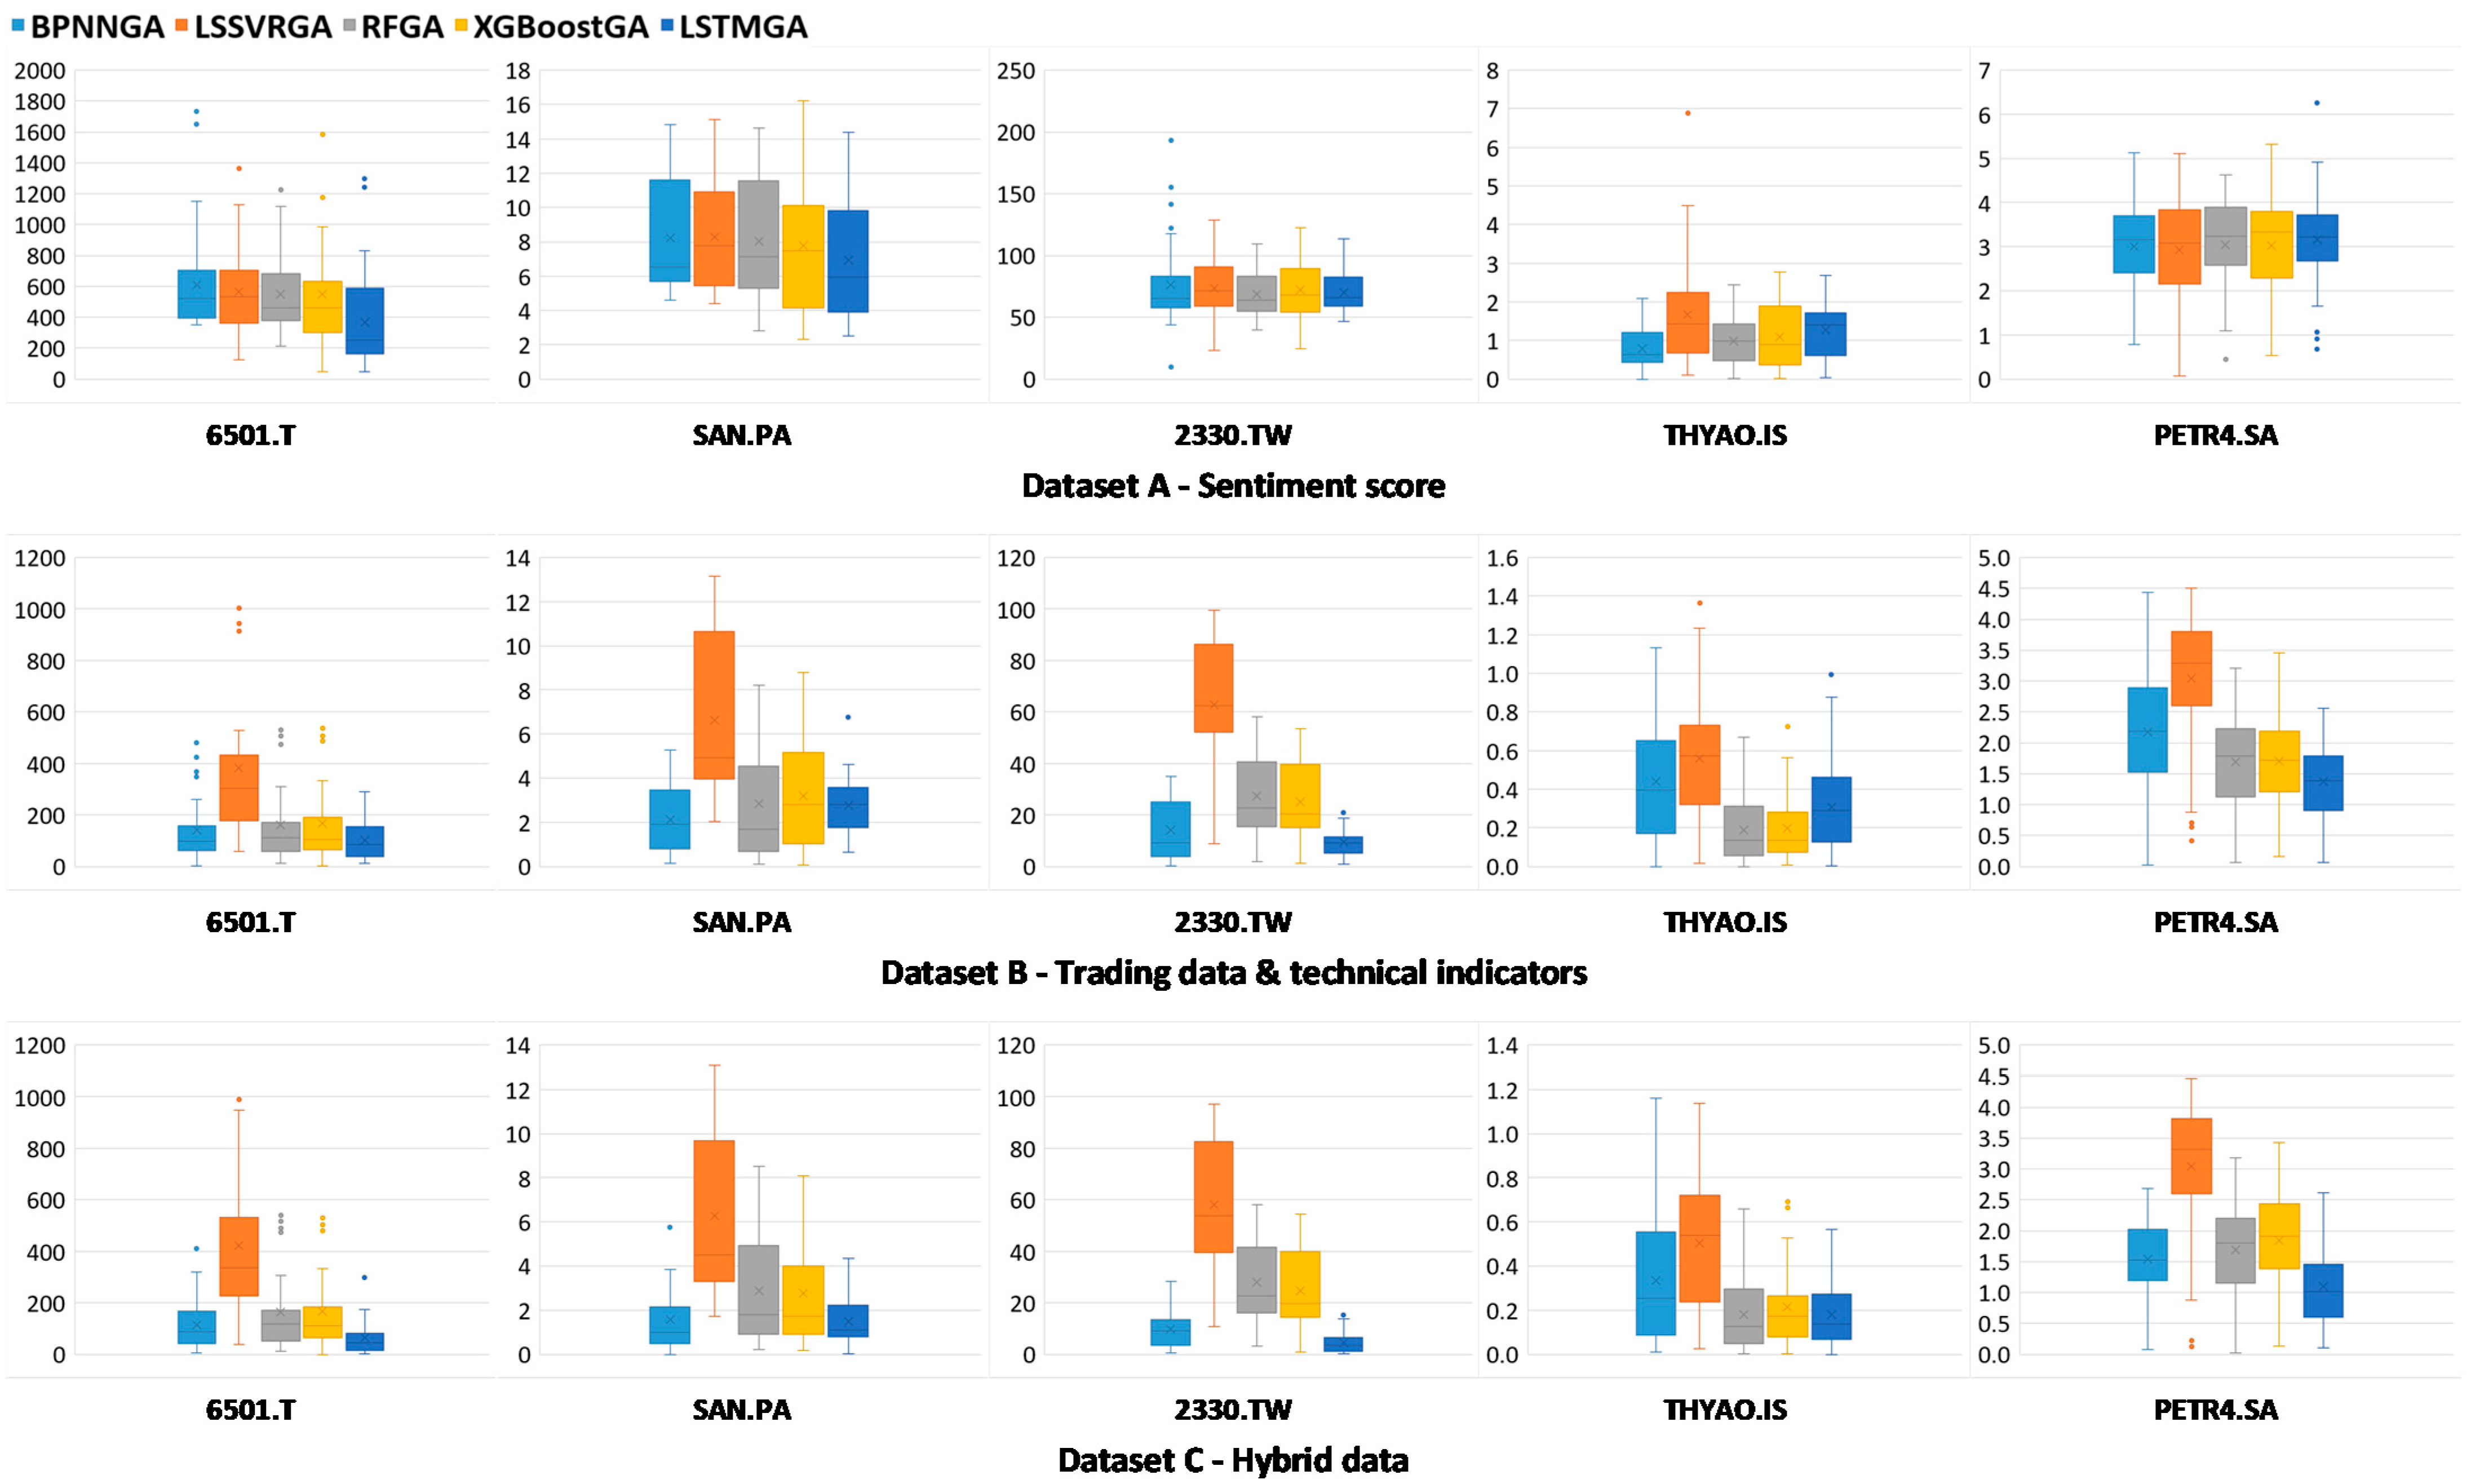
| Pairwise Comparison | Negative Numbers | Positive Numbers | Z Value | Sig. = 0.025 | Negative Numbers | Positive Numbers | Z Value | Sig. = 0.025 |
|---|---|---|---|---|---|---|---|---|
| Dataset C vs. Dataset A | Dataset C vs. Dataset B | |||||||
| N225 | 47 | 0 | −5.968 | Yes | 47 | 0 | −5.968 | Yes |
| FCHI | 50 | 0 | −6.154 | Yes | 44 | 6 | −5.565 | Yes |
| TWII | 36 | 0 | −5.232 | Yes | 31 | 5 | −4.540 | Yes |
| XU100.IS | 42 | 7 | −5.695 | Yes | 36 | 13 | −3.019 | Yes |
| BVSP | 49 | 0 | −6.093 | Yes | 49 | 0 | −6.093 | Yes |
| 6501.T | 39 | 4 | −5.530 | Yes | 30 | 13 | −2.826 | Yes |
| SAN.PA | 23 | 0 | −4.197 | Yes | 21 | 2 | −3.711 | Yes |
| 2330.TW | 36 | 0 | −5.232 | Yes | 28 | 8 | −3.692 | Yes |
| THYAO.IS | 47 | 2 | −5.993 | Yes | 40 | 9 | −5.078 | Yes |
| PETR4.SA | 48 | 1 | −6.083 | Yes | 37 | 12 | −3.606 | Yes |
Publisher’s Note: MDPI stays neutral with regard to jurisdictional claims in published maps and institutional affiliations. |
© 2022 by the authors. Licensee MDPI, Basel, Switzerland. This article is an open access article distributed under the terms and conditions of the Creative Commons Attribution (CC BY) license (https://creativecommons.org/licenses/by/4.0/).
Share and Cite
Lin, Y.-L.; Lai, C.-J.; Pai, P.-F. Using Deep Learning Techniques in Forecasting Stock Markets by Hybrid Data with Multilingual Sentiment Analysis. Electronics 2022, 11, 3513. https://doi.org/10.3390/electronics11213513
Lin Y-L, Lai C-J, Pai P-F. Using Deep Learning Techniques in Forecasting Stock Markets by Hybrid Data with Multilingual Sentiment Analysis. Electronics. 2022; 11(21):3513. https://doi.org/10.3390/electronics11213513
Chicago/Turabian StyleLin, Ying-Lei, Chi-Ju Lai, and Ping-Feng Pai. 2022. "Using Deep Learning Techniques in Forecasting Stock Markets by Hybrid Data with Multilingual Sentiment Analysis" Electronics 11, no. 21: 3513. https://doi.org/10.3390/electronics11213513