1. Introduction
In recent years, the prevalence rate of cardiovascular diseases in China is increasing, and the prevalence rate of arrhythmia among elderly residents is as high as 2.4% [
1]. Arrhythmia refers to the abnormality caused by the impulse of the heart, which sometimes takes only a few minutes to kill the patient, so it has a great impact on the health and even the life of the patient. For example, a 55-year-old doctor died of arrhythmia on the front line of epidemic prevention on 6 January 2022. Therefore, how to comprehensively analyze patients’ electrocardiogram (ECG) and make an accurate judgment in a short time is a great challenge to heart disease experts. At present, people have applied the computer-aided diagnosis (CAD) system in this field [
2], trying to address the issue of ECG automatic detection and auxiliary diagnosis. CAD can classify ECG signals automatically, i.e., distinguish life-threatening events from non-threatening events by accurately evaluating ECG.
With the extensive research of deep learning (DL), new light has been shone on time-series analysis, which can improve CAD performance. In [
3], CNN multi-scale fusion method is proposed to screen the symptoms of atrial fibrillation. Hannun et al. [
4] developed a 34-layer CNN, which reached the level of cardiologists in identifying arrhythmia. In addition, long short-term memory (LSTM) [
5], gated recurrent units (GRU) [
6], gated linear units (GLU) [
7] and temporal convolution networks (TCN) [
8] perform well in temporal modeling.
The arrhythmia classification models constructed by the above methods have achieved better performance indeed, however, most of these models only capture the temporal patterns in the time domain, and ignore the predefined topological structure of the relationship between sequences, which are unfriendly to multivariate time-series without predefined topology.
At present, mapping ECG and bedside ECG used in clinical medicine both include multi-leads [
9], which are typical multivariate time-series. Furthermore, the ECG signal is the key information for arrhythmia classification in our research, so it will be a tremendous assist to improve the classification effect if the above issues can be solved effectively. In this paper, our goal is to better model multivariate time-series data entirely in the spectral domain by combining graph Fourier transform (GFT) [
10] and discrete Fourier transform (DFT) [
11], and can learn graph structure through input signal automatically. The realization of these two goals will greatly improve the classification performance of CAD. To address the above issues, an improved graph neural network (GNN) method is proposed to classify arrhythmia in this paper. On the one hand, GNN can represent information in its vicinity at any depth and use them according to appropriate methods, while standard neural networks cannot solve the disorder problem of graph input, e.g., CNN, RNN and so on. On the other hand, the representation of features is clearer in the spectral domain.
The main contributions of this paper are summarized as follows,
A multi-domain collaborative analysis and decision approach is proposed to improve the classification performance for the problem of arrhythmia classification and diagnosis in this paper, which has achieved excellent performance indexes in the BIDMC congestive heart failure (BIDMC-CHF) database;
The approach combines the benefits of GFT, DFT and deep neural networks, which can learn the potential correlation between multiple time series in ECG automatically based on the data drive.
The rest of this paper is arranged as follows.
Section 2 describes the prior related work.
Section 3 introduces the proposed approach amply. In
Section 4, the performance of the method proposed in this paper is compared with other state-of-the-art algorithms.
Section 5 concludes the paper.
2. Related Work
For more than ten years, lots of classification algorithms for arrhythmia are proposed by scholars. These algorithms can be divided into two types, i.e., traditional machine learning (ML) and DL.
For the traditional ML classification algorithms, Abdelazez et al. [
12] designed an atrial fibrillation (AF) detector based on random forest, and used wavelet transform, statistical methods, discrete cosine transform and empirical mode decomposition to extract features. Sadhukhan et al. [
13] consider that the phase distribution pattern of Fourier harmonics can reflect the change of ECG waveform, and propose to identify myocardial infarction by utilizing the harmonic phase distribution pattern of ECG data. In [
14], a new heartbeat recognition method based on a principal component analysis network (PCANet) and linear support vector machine (SVM) is proposed, which reduces the noise disturbance of heartbeat effectively. What is more, such as hyper-frame classifier [
15], self-organizing map [
16], conditional random field [
17] and integration method [
18], all the above methods are necessary to establish accurate system models, and most of them are based on artificial feature extraction, which is cumbersome. For the DL classification algorithms, in [
19], multiscale Laplacian graph kernel features (MLGK) are proposed, which enriches the characteristics of the extracted ECG signals. In [
20], the encoder part of the transform model is extracted, and the special time features are combined with the features learned by the transformer to classify heartbeat. Zhang et al. [
21] combine the spatio-temporal attention modules with CNN and RNN, which obtain the spatial and temporal features of the signal graph. In [
22], the ECG signals of five arrhythmia types are transferred from time-domain to time-frequency spectrograms and then used as the input of 2D-CNN to achieve the purpose of identifying and classifying arrhythmia.
All the above works are devoted to improving the classification accuracy of arrhythmia. However, as we mentioned earlier, it is vital to model the correlation among multiple time-series for the ECG signals prediction. At present, the most advanced models all rely on GNN, so it is necessary to apply GNN to ECG signal analysis. This is the main motivation for our work.
3. GNN for Classification of ECG Arrhythmia
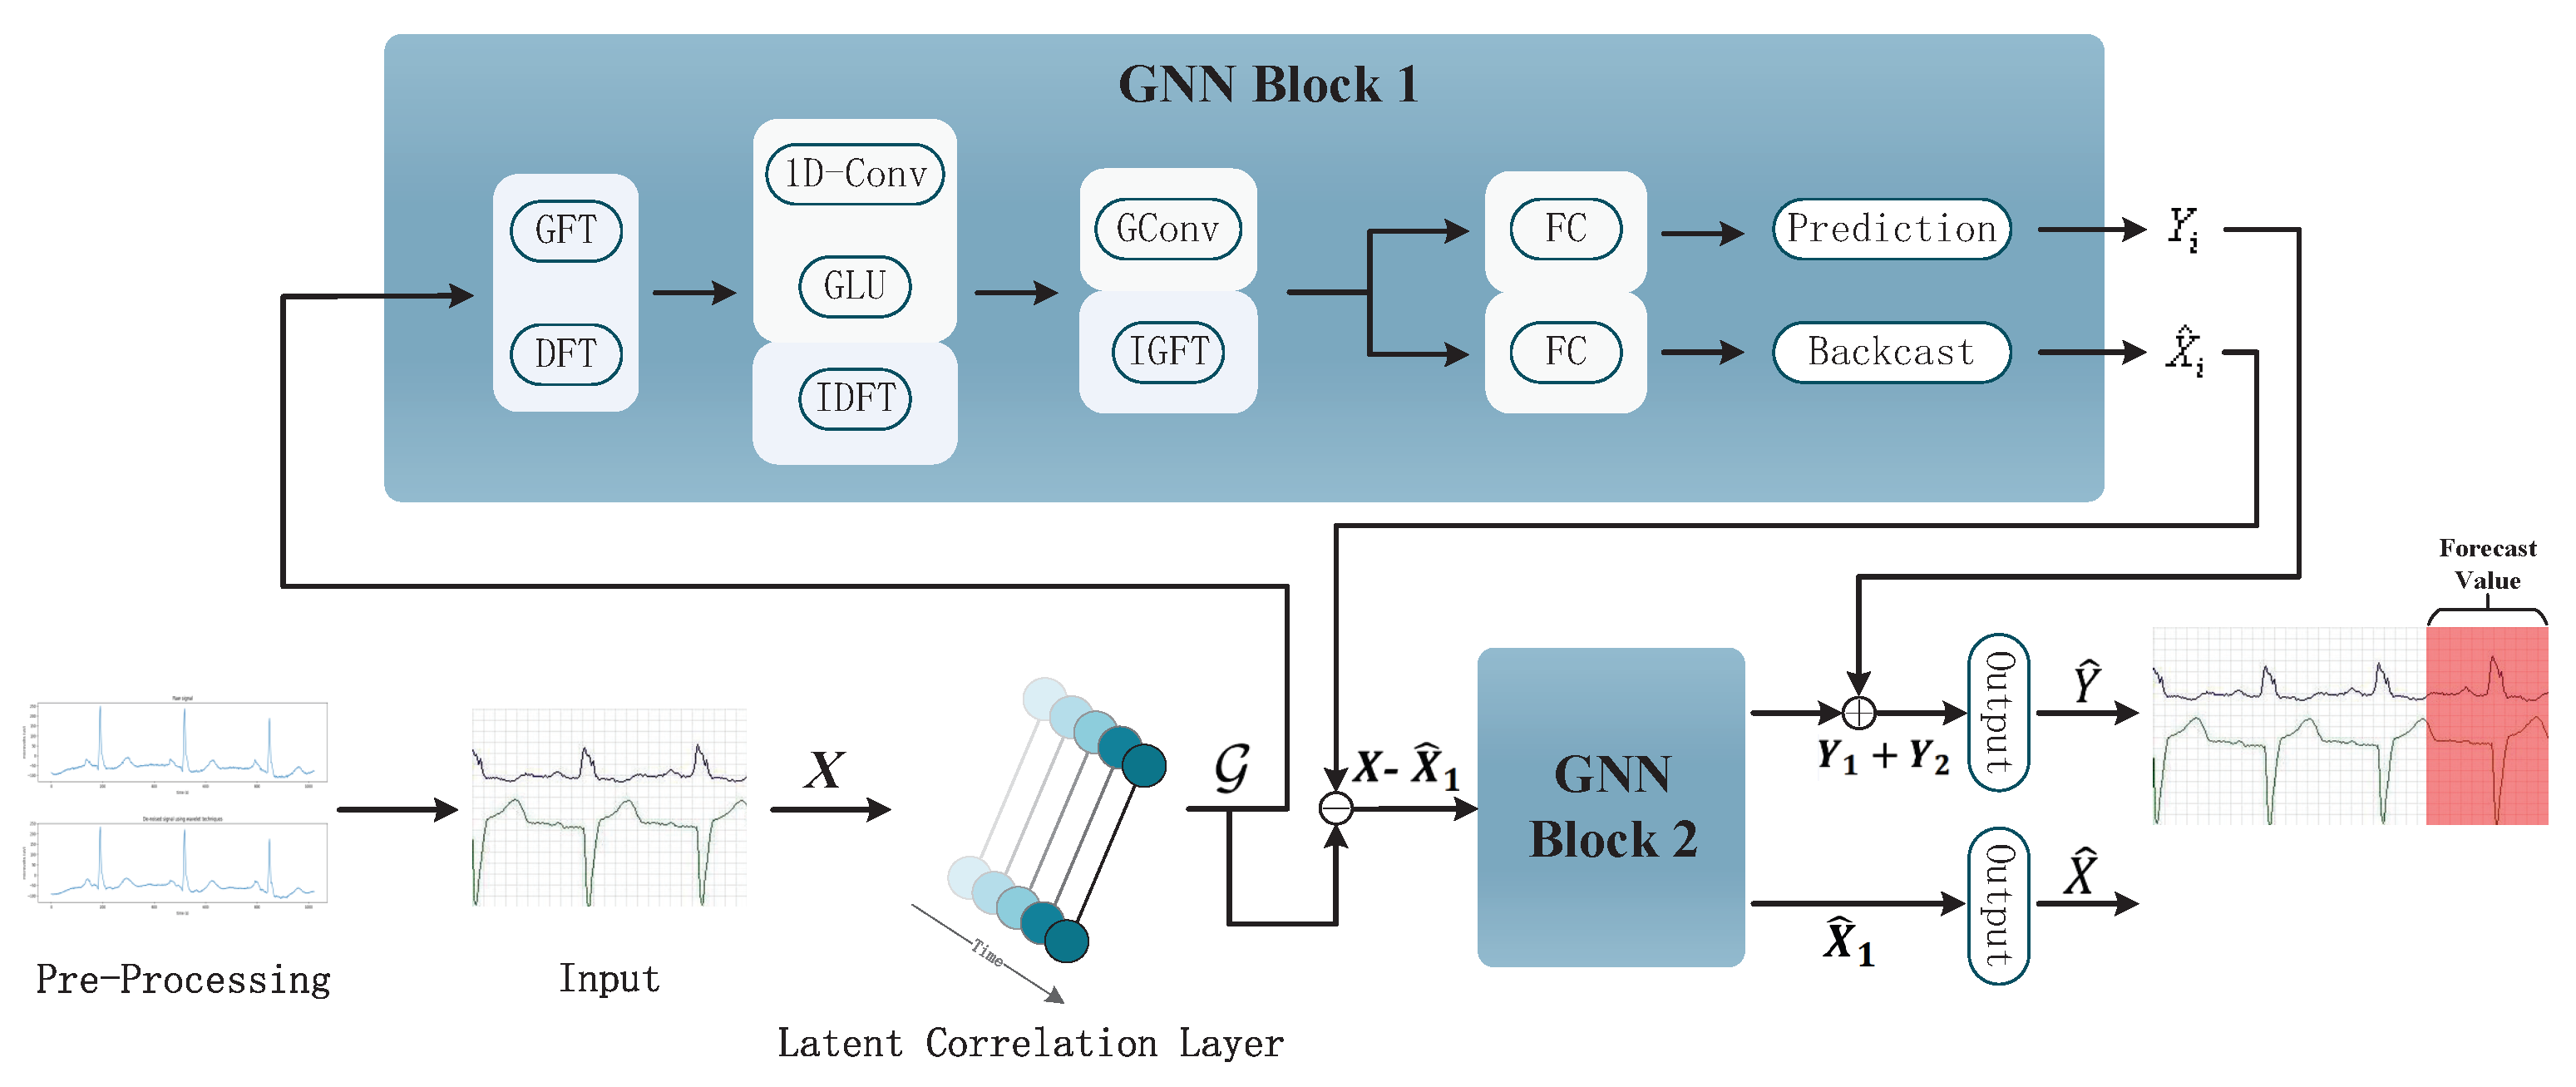
In this section, we introduce the application particulars of GNN in arrhythmia classification detailedly. The framework of the proposed method is shown in
Figure 1, its workflow is roughly as follows:
The model obtains the input of ECG signal after wavelet transform through the input layer;
The potential correlation between the preprocessed signals is automatically learned by using the self-attention mechanism in the latent correlation layer;
An automatically learned graph structure is input into the two-layer GNN blocks, and the sequence features are learned by the conversion from the time-space domain to the frequency spectrum domain;
The output layer classifies the data.
The specific algorithm and principle will be embodied in the following.
3.1. Pre-Processing
As an effective means of heart disease diagnosis, the ECG signal is easily interfered with by various noises during its acquisition, e.g., baseline, power frequency interference and electromyographic (EMG) interference. These will reduce the accuracy of ECG waveform feature extraction, and then lead to the wrong classification of subsequent arrhythmia. Therefore, it is essential to choose an appropriate filter to eliminate interference signals in ECG samples. The traditional filtering method will lead to the distortion of the ECG signal due to many key features in the waveform of the ECG signal. Hence, the well-developed wavelet transform method is used to eliminate the interference noise of the ECG signal and keep the original features of the ECG waveform in this paper.
3.1.1. Wavelet Transform Algorithm
Wavelet transform can reflect the local characteristics of signals in the time-frequency domain due to its multi-resolution analysis [
23]. Furthermore, it tries to decompose the signal into a series of superpositions of wavelet functions. The function is obtained by translation and scale transformation of the mother wavelet. After displacement
, which is made by a function called basic wavelet, the inner product with the signal
to be analyzed is calculated at different scales
, i.e.,
where
a > 0 is a positive scale factor,
is displacement which value can be positive or negative. As
a and
are both continuous variables, Equation (
1) is called continuous wavelet transform (CWT).
CWT is a scale-based continuous transform. The result can be expressed as a function of translation factor
a and expansion factor
b, i.e.,
After wavelet transform, the moisture content of ECG signal after processing will be the lowest, and the noise signal tends to be whitened, so it is easier to distinguish the noise from the original sample.
3.1.2. ECG Signal Denoising
In this paper, the Daubechies wavelet system is used to denoise ECG signals, which is commonly called dbn. The n in dbn represents the order of wavelets, and the support area of wavelet function and scale function is , and the vanishing moment of is M. The characteristic of this wavelet is that with the increase of order, the order of vanishing moment will be higher and the smoothness will be better. However, with the weakening of tight support in the time domain, the real-time performance will become worse and the amount of computation will increase greatly. Therefore, it is very important to choose the appropriate order. When wavelet transform is applied to multivariate time series data, it is also vital to select the appropriate wavelet basis when processing different time series signals, because the different wavelet basis functions and the different mathematical properties of each wavelet basis.
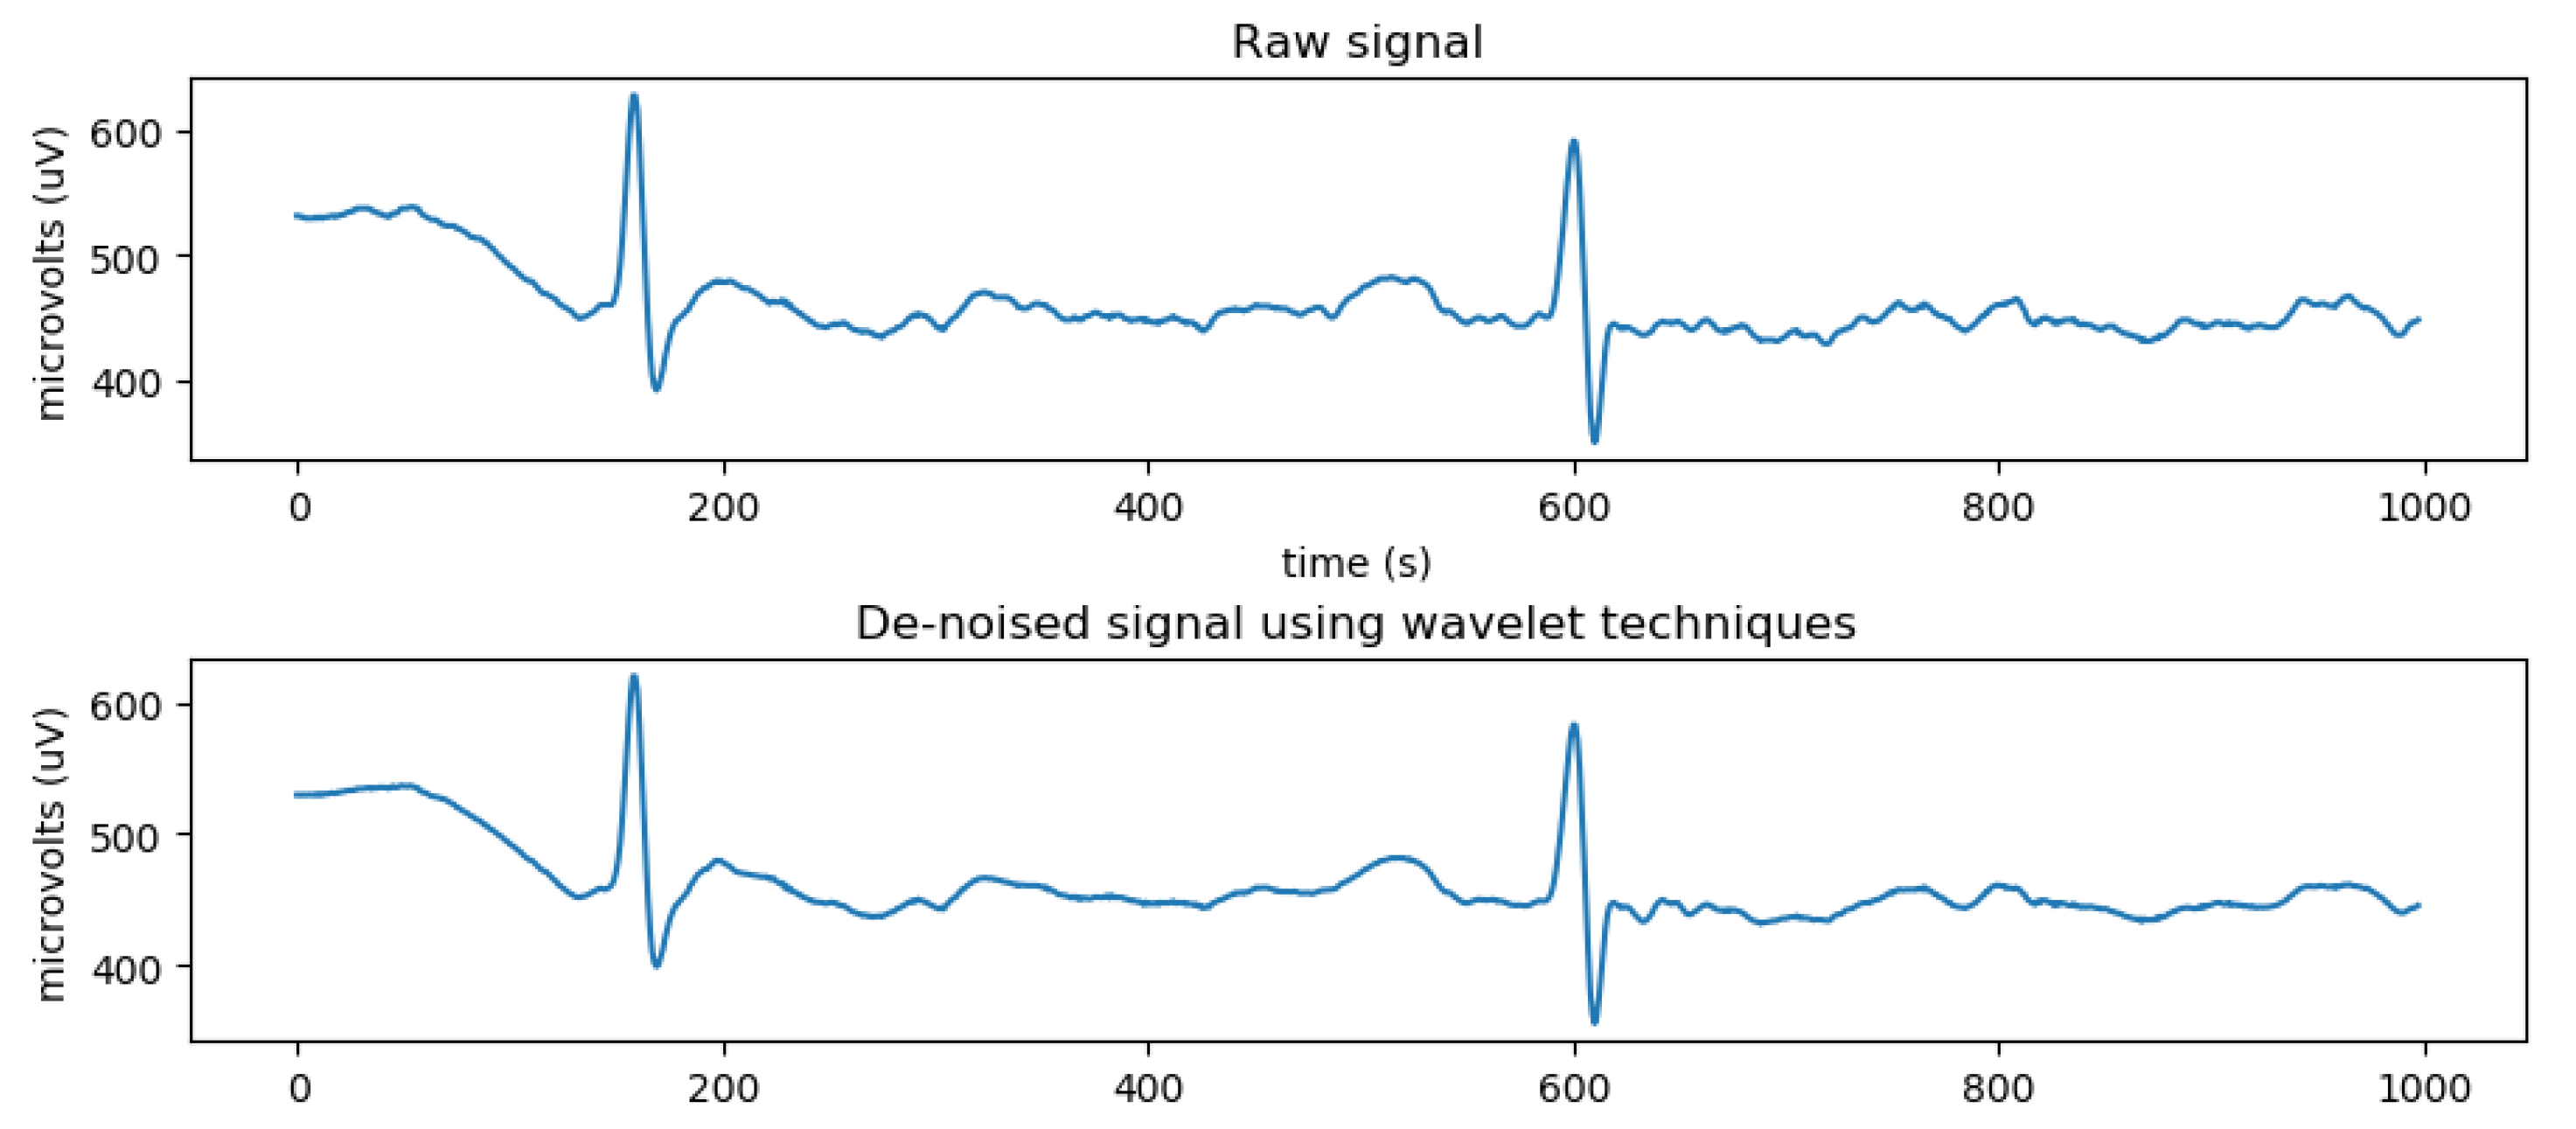
According to [
24], by comparing different filter bases, it is found that the wavelet filter with lower offset variance and reasonable blanking time is the best choice for denoising, and
db8 filter is the most suitable for denoising ECG signals. The selected basis function is not only optimal in root mean square error, but also retains the peak value of the ECG signal, which contains physiological signals of diagnostic value. Therefore, the ECG signal is denoised by the 9th-order
db8 mother wavelet in this paper, and then the next data analysis is carried out. ECG signals with noise and denoised by wavelet transform are shown in
Figure 2.
3.1.3. ECG Signal Data Normalization
As the ECG raw data are collected by various sensors, and the measurement range and values of each lead are quite different, it is necessary to adopt data standardization, i.e., the data of all leads are scaled in proportion, so that the values of all leads fall in the same specific area. This can speed up the convergence of the depth model, to reach the optimal value. For each lead, the normalization process formula is as follows,
where
represents the minimum value of the lead amplitude in the ECG signal and
is the maximum value.
stands for the input of the next process, where
N is the number of time-series (nodes), and
T is the number of timestamps. The processed ECG signal has the characteristics of amplitude greater than 0 and less than 1.
3.2. Latent Correlation Layer
When modeling multi-lead ECG signals based on GNN, it is vital to establish a graph structure. It can be constructed based on prior knowledge, but more generally, we do not have a pre-set graph structure. Thus, we use the self-attention mechanism [
25], which is based on data-driven, to learn the relationship matrix between signals automatically. The specific operations are as follows.
Firstly, the Gated Recurrent Unit (GRU) layer receives the input
, which calculates the hidden state corresponding to each timestamp
t sequentially. Then, we use all state output shapes of GRU as the representation of the whole time-series, and the weight matrix
W is calculated through the self-attention mechanism as follows,
where
Q and
K express query and key, respectively,
and
are linear projections with learnable parameters in the attention mechanism, and the hidden dimension size of
Q and
K is
d. Then, the graph
can be constructed, which is the input to the GNN layer.
3.3. GNN Layer
The GNN layer is composed of multiple overlapping GNN blocks with skip connections. We stack two GNN blocks in this paper, which have the same structure basically. The first one is introduced detailed here.
According to
Section 3.2, we get the graph structure
required for GFT. After GFT, the graph
transforms from spatial domain to spectral domain, and all sequences become independent at that moment. However, its output is still a multivariable time series, and GFT does not explicitly learn the time relationship in the series. Thus, we continue to perform DFT on the output, which transfers independent univariate time-series from the time domain to the frequency domain and captures the repeated patterns in periodic data or the auto-correlation characteristics between different timestamps. Then, the feature representation of the frequency domain is obtained through 1D-convolution and GLU before this signal transforms back to the time domain by inverse DFT (IDFT). The specific operation is as follows,
where
is the convolution kernel, and in our experiments, its size is set as 3, ⊙ is the Hadamard product, and the quantity of information in the current input, that is related to the sequential pattern, is decided by nonlinear sigmoid gate
. The final result can be obtained by calculating
. After the above steps, we have captured the characteristic pattern of the sequence in the frequency domain, and the univariate sequence is changed back to multivariate time series. Finally, graph convolution [
25] is applied to the spectral matrix representation to filter, and then, inverse GFT (IGFT) is performed. Using the full-connection layer, we get two output branches. The one is used to predict the future values, i.e., the prediction branch. Furthermore, another one is used to readjust the historical values to improve the prediction accuracy, i.e., the backcasting branch.
The above is the operation mechanism of GNN block 1. Furthermore, block 2 tries to input the residual error between the detected values obtained by block 1 and the historical real value to get a more accurate predicted value. It is worth noting that block 2 no longer outputs the recast branch, so the final output is the predicted value of the ECG sequence that we need.
4. Results and Discussion
The hardware environment of this paper is AMD Ryzen 7.5800 H processor, and the software environment is developed based on Python3.7 Pytorch open source framework. The open dataset, i.e., BIDMC Congestive Heart Failure (BIDMC-CHF) database is used in this study, which includes long-term electrocardiograms of 15 patients (11 males aged 22 to 71 and 4 females aged 54 to 63). The individual recordings are each about 20 hours in duration and contain two ECG signals. Each sample at a rate of 250 samples per second with 12-bit resolution over a range of ±10 millivolts [
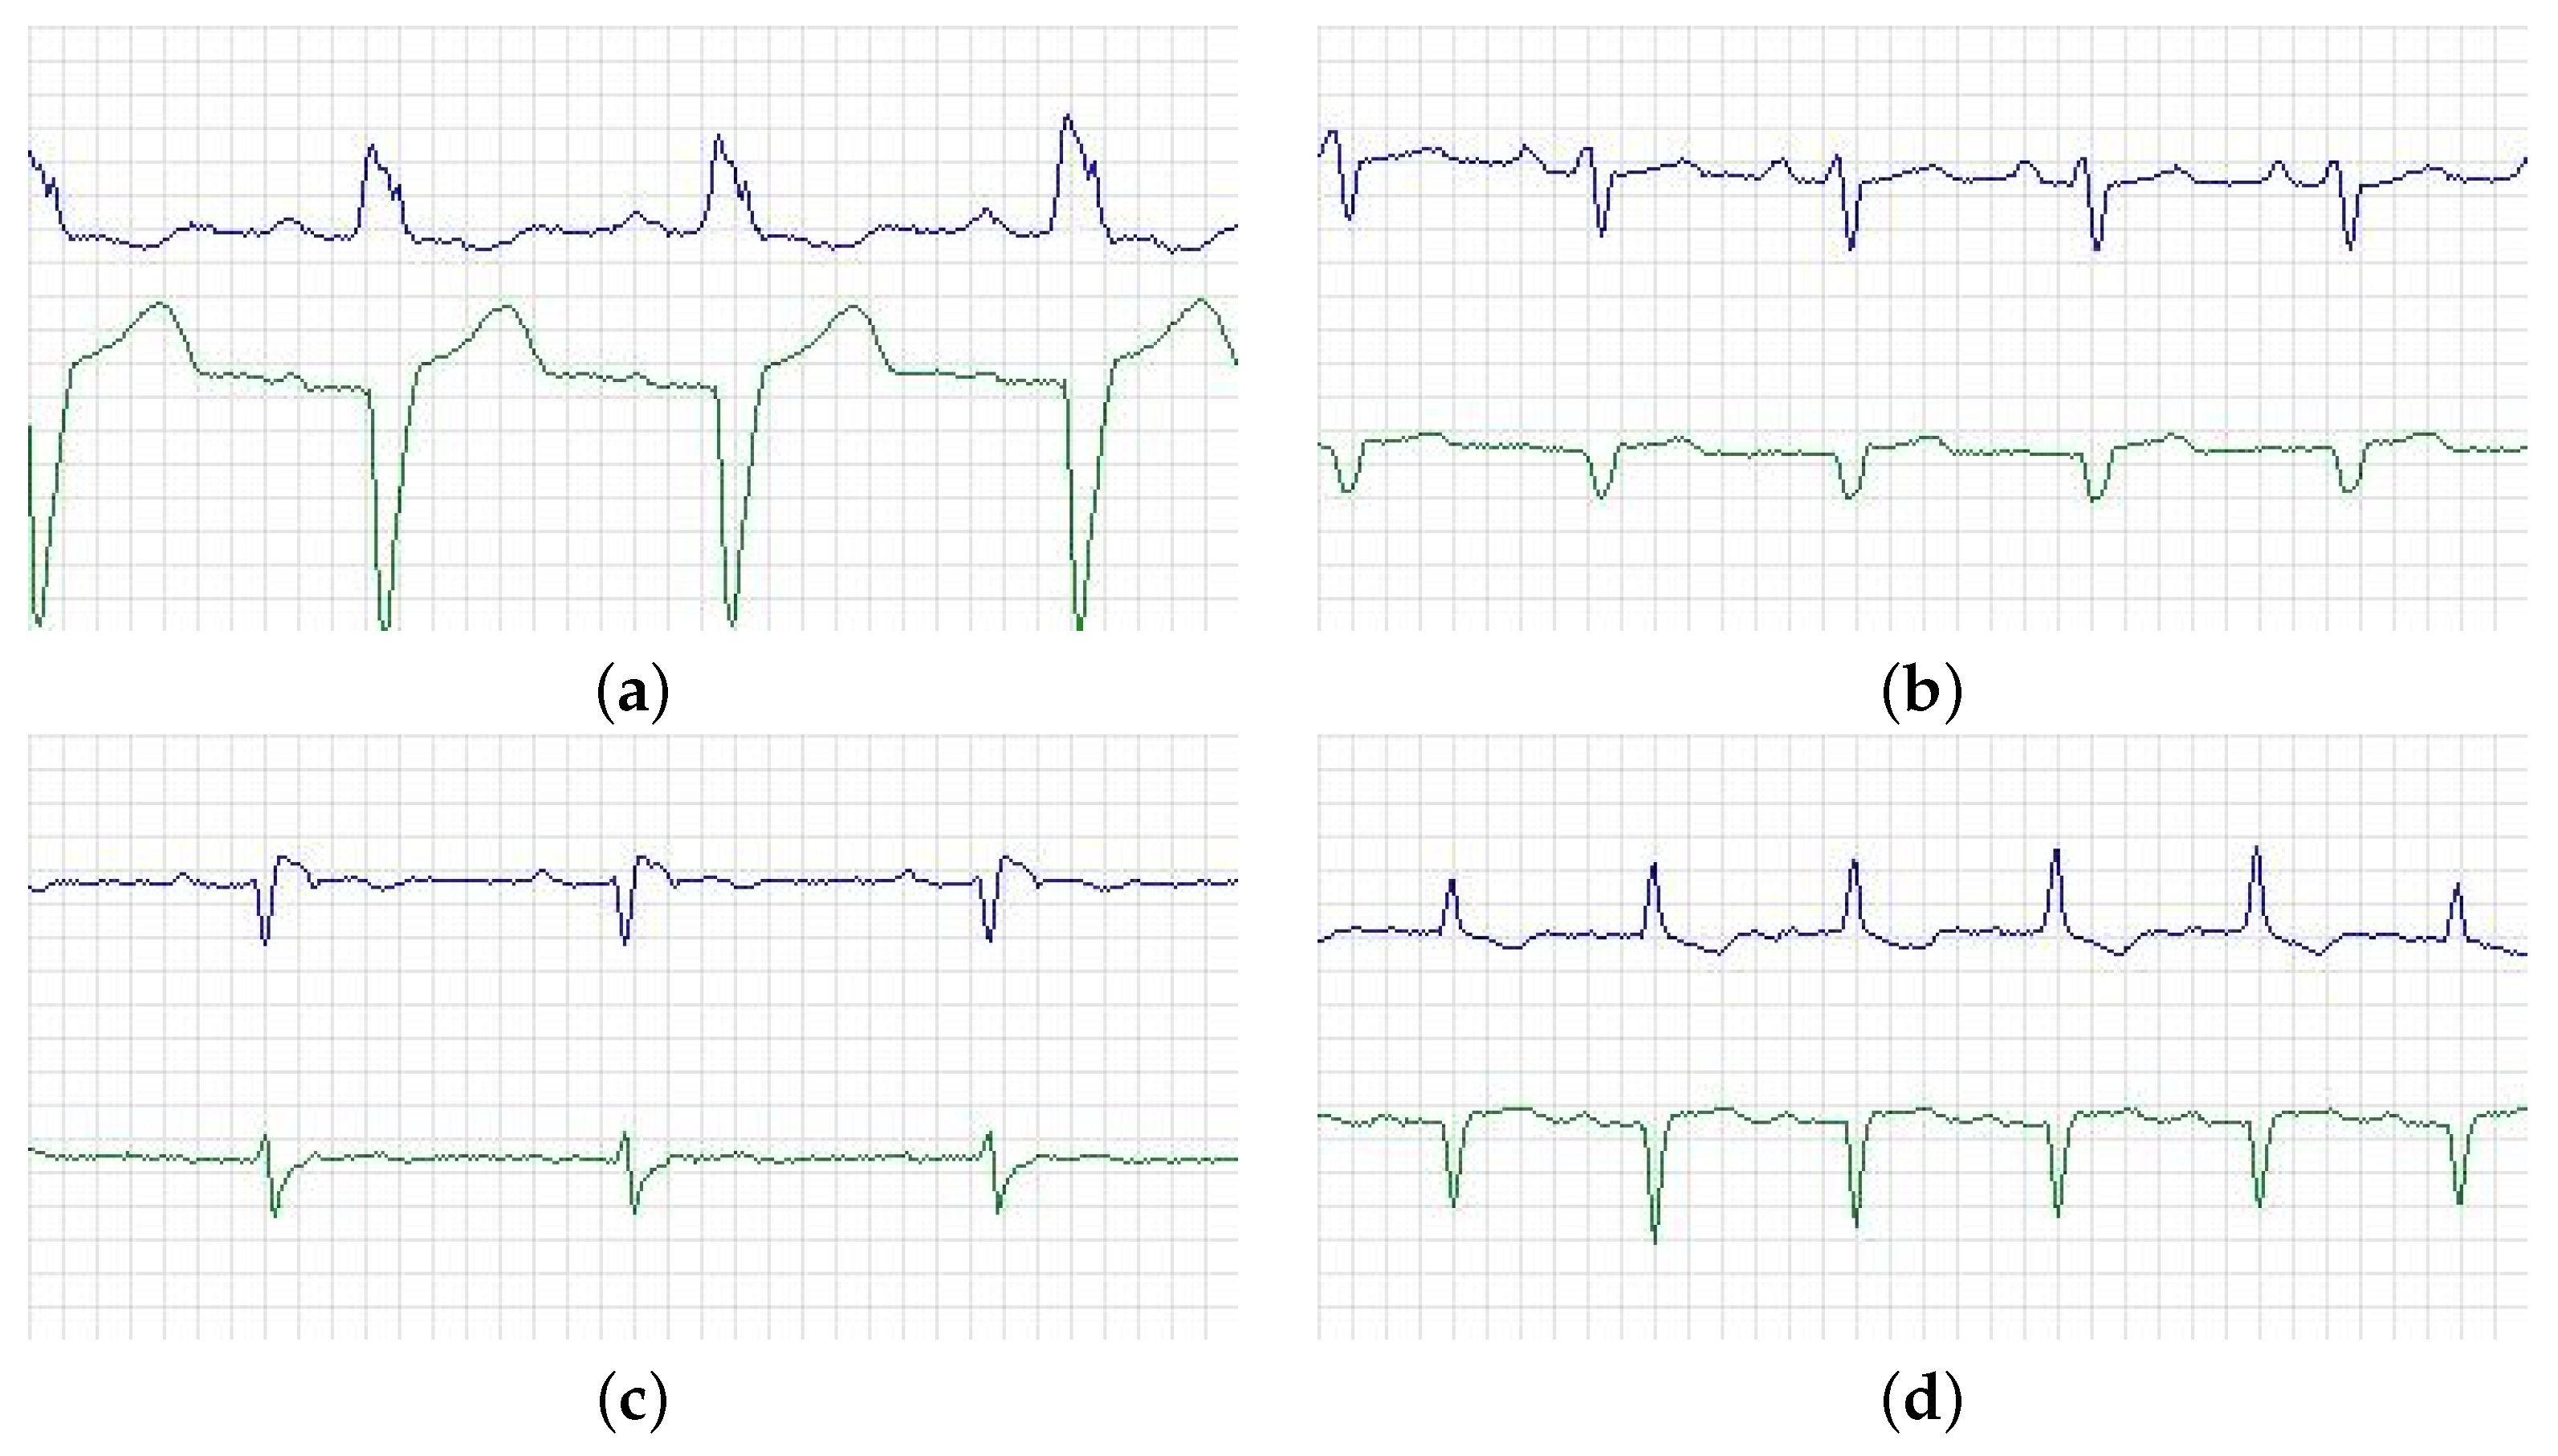
26]. In addition, each ECG recording contains around 17 million sample intervals. The part of ECG is shown in
Figure 3, where the blue one stands for lead V1 and the green one for V2. Specifically, (a) is from a 71-year-old male and belonged to the left bundle branch block beat (class N in AAMI standard). (b) is from a 61-year-old female, and the ECG showed that one P wave was followed by two QRS waves, which belonged to class S in the AAMI standard. (c) is from a 51-year-old male, this patient had sinus bradycardia at the time of recording, which also belonged to class S. Furthermore, (d) is from a 22-year-old male and belonged to P-mitrale (class S in AAMI standard). The NYHA class of all the patients is III–IV.
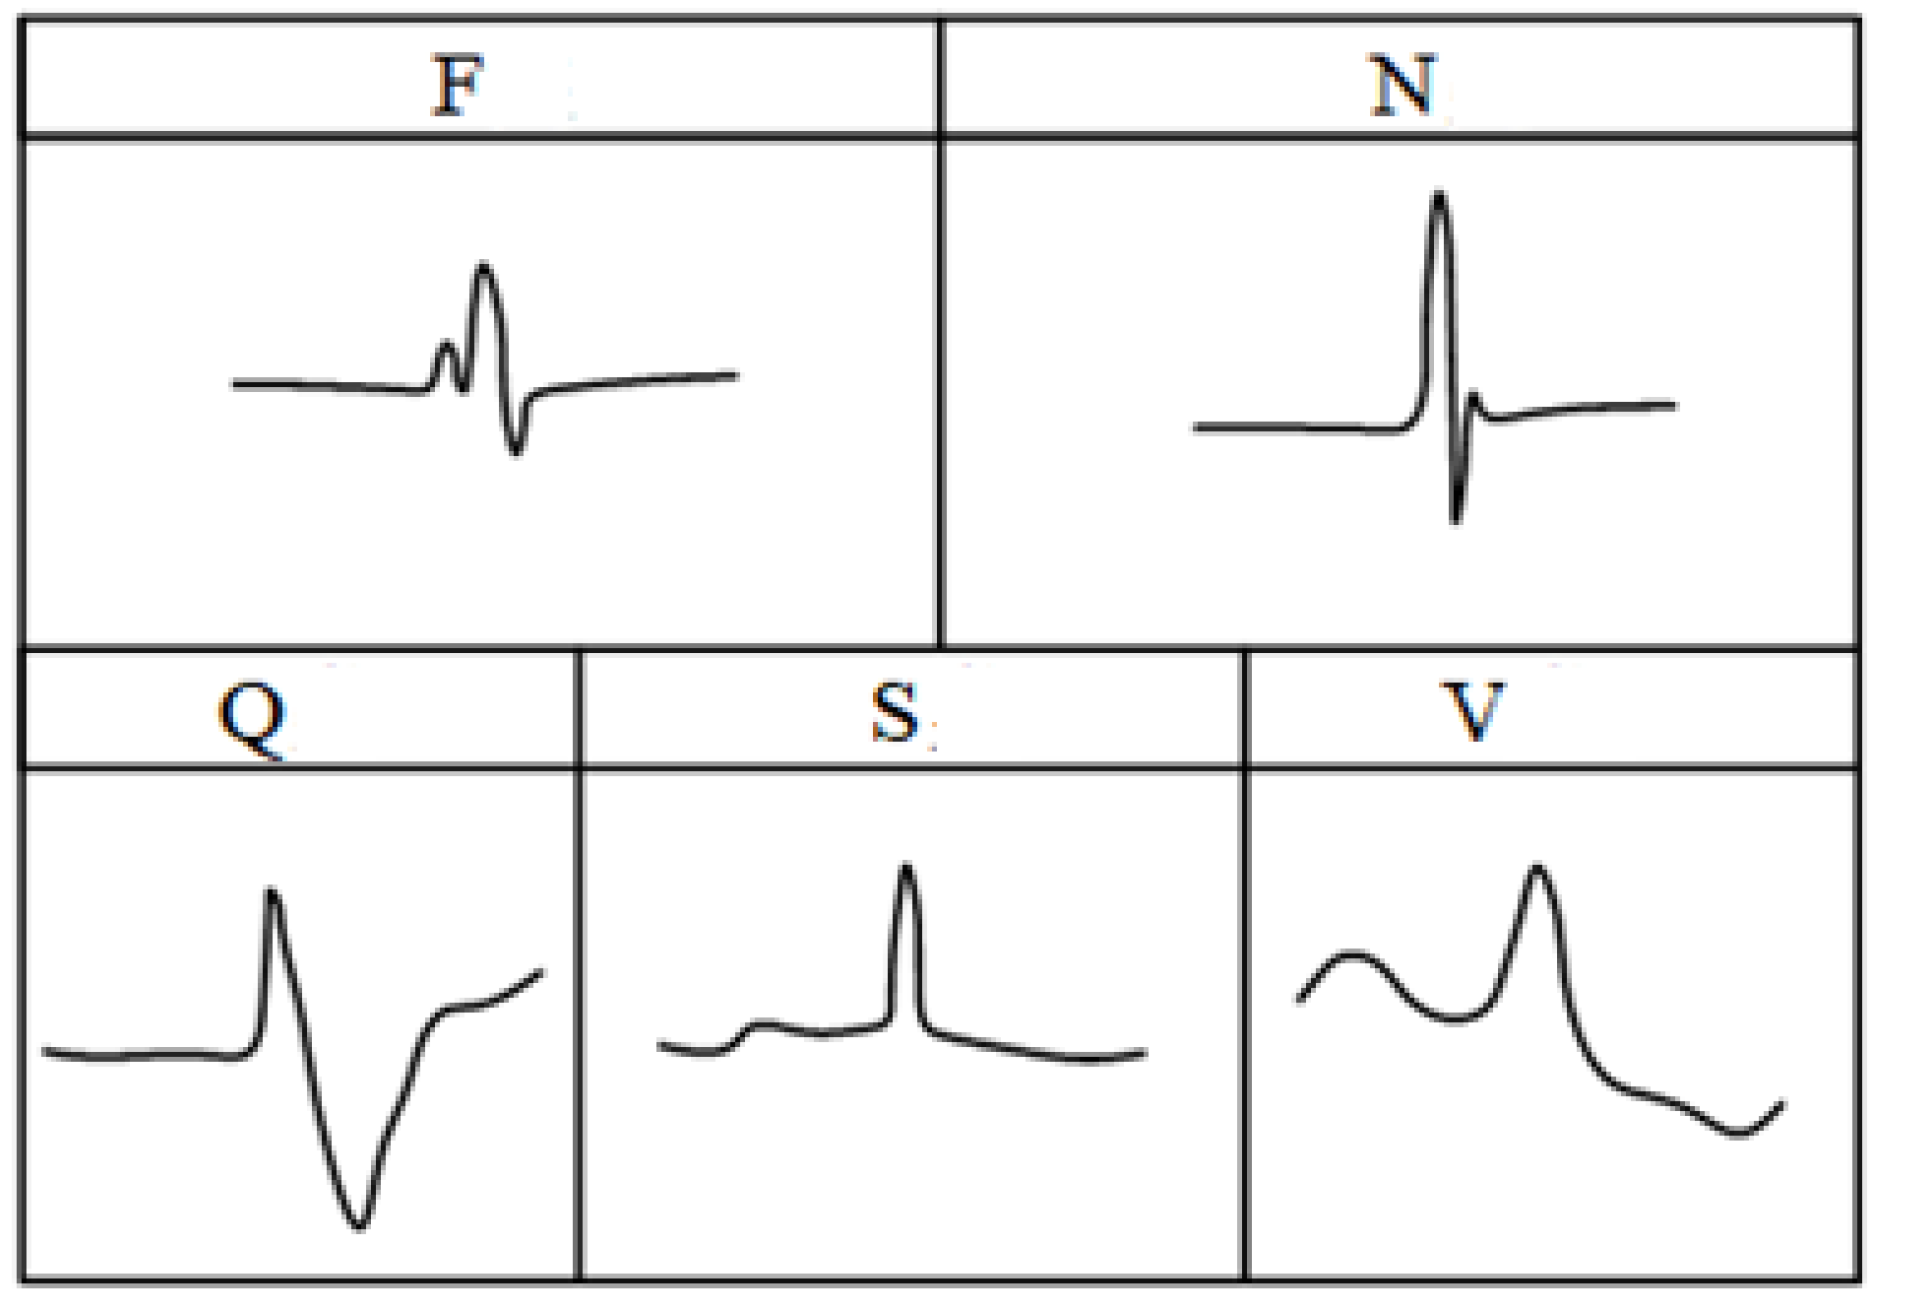
For the classification and diagnosis of arrhythmia, one of the main difficulties is that each people has a unique heartbeat waveform, which is different from others, and the ECG of different arrhythmia diseases varies greatly, so it is vital to classify the heartbeat between different individuals. For this purpose, the association for the advancement of medical instrumentation (AAMI) proposed a standard to evaluate the performance of algorithms. The heartbeat category was divided into five types, i.e., non-ectopic (N), supraventricular ectopic (S), ventricular ectopic (V), fusion (F) and unclassified heartbeat (Q). The details of heartbeat classification were shown in
Table 1. In addition, the five types of ECG waveform characteristics of a heartbeat can be roughly represented in
Figure 4.
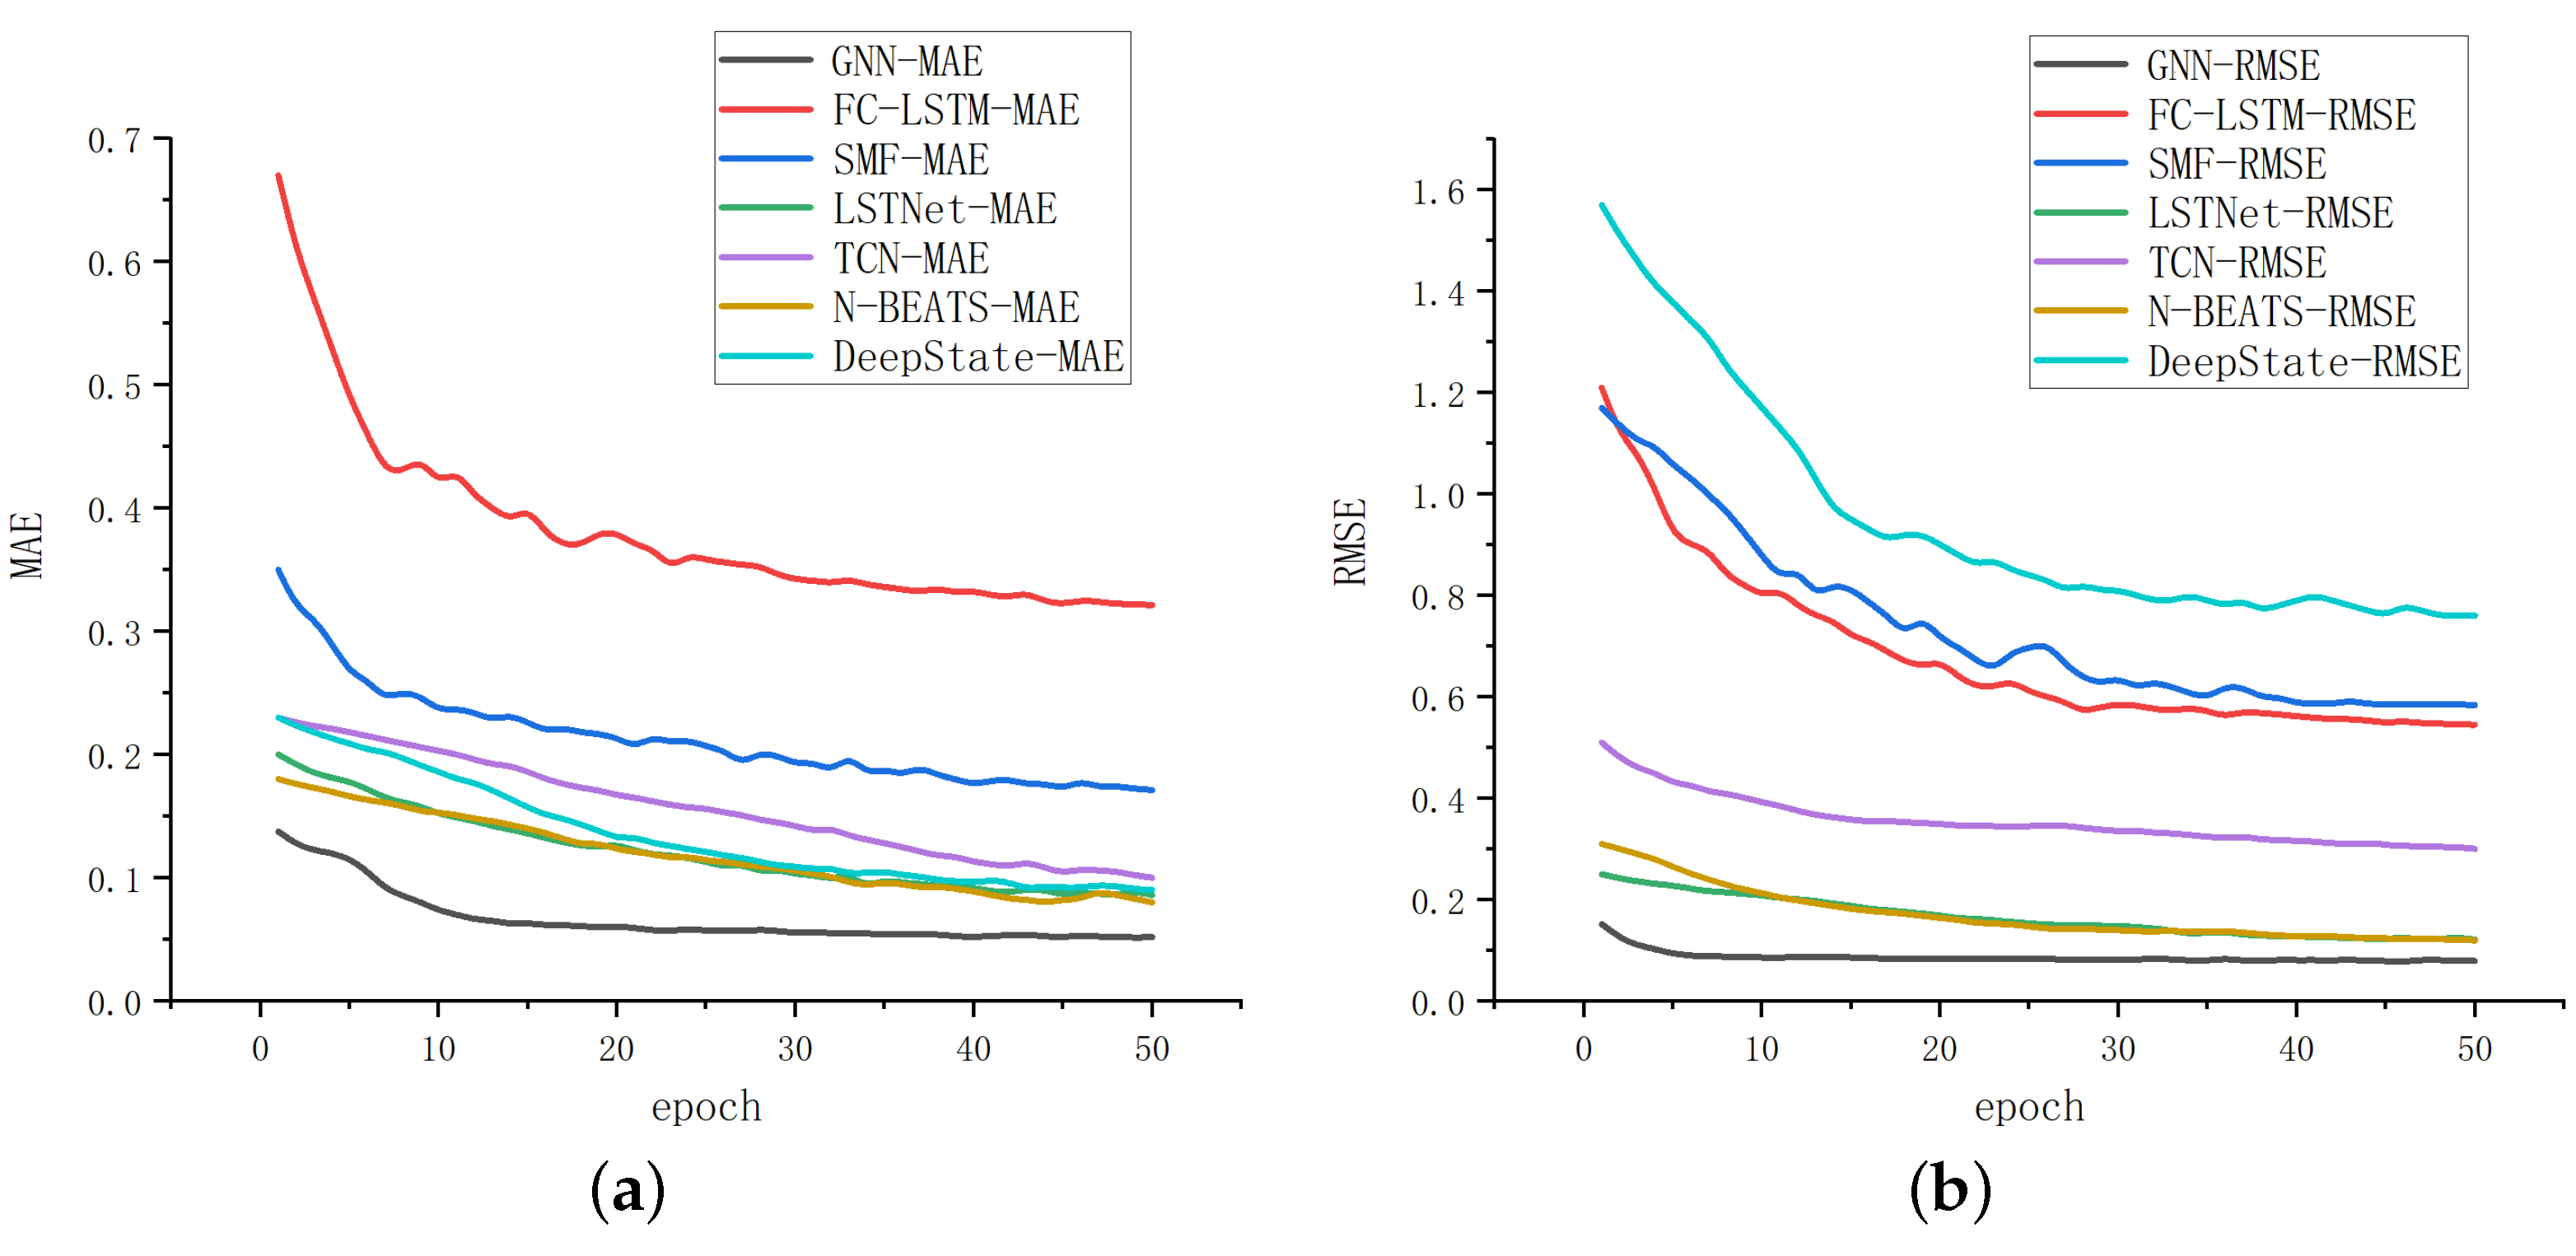
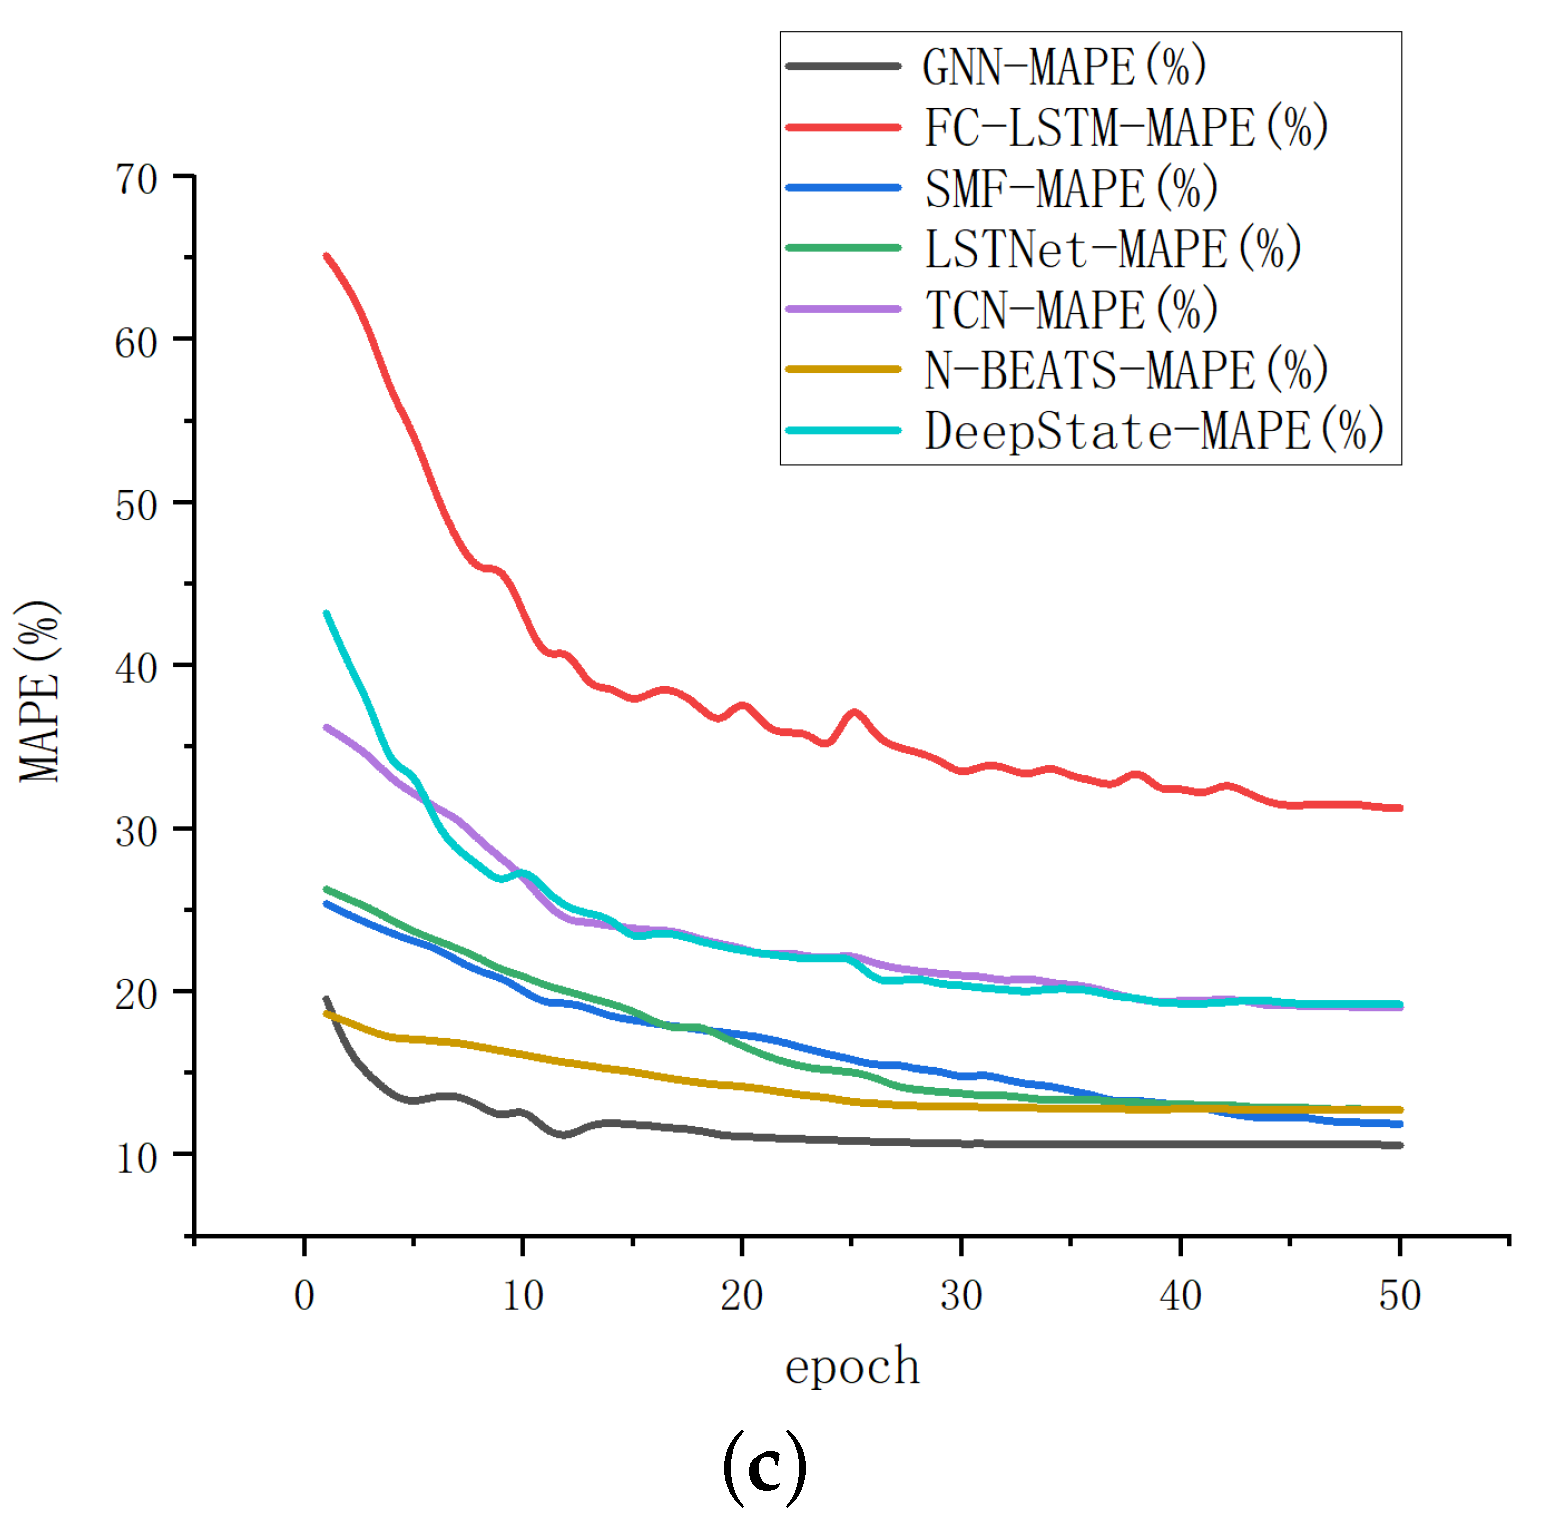
In this study, the training set, verification set and test set are set up in a ratio of 7:2:1 after unified data transformation to ensure the consistency of the experiment. Among them, the training set is used to train the model. In order to reduce the generalization error, we need the training set to make our model closer to the real data. The test set is used to test the accuracy of the model. We apply the test set to the model which is trained by the training set to get the evaluation of the model performance. The verification set is to check whether the effect of model training is going in a bad direction. The function of the verification set is mainly reflected in the training process. We can adjust the hyperparameters according to the verification set to make the model have the strongest generalization ability. The model is trained through 50 global iterations, and the validation set is used for performance verification after each iteration. We optimize the hyperparameters of validation data by the grid search method. Specifically, several candidate parameters can be combined in pairs. If all combinations are listed, it will be a grid of high-dimensional space, and then all nodes in the grid will be traversed to select the optimal solution. In this paper, the channel size of each graph convolution layer is 64, which is chosen from a search space of (16, 32, 64, 128). Furthermore, the kernel size of 1D convolution is 3, which is selected from a search space of (3, 6, 9, 12). After that, we use the RMSprop optimizer and set the training cycle as 50. The initial learning rate is 0.001, and the rate changes to 0.7 after every 5 epochs. It is worth noting that the assessment indicators adopted are different from conventional ECG classification diagnosis due to the time series prediction with multi-channel input studied in this paper. The time-series prediction evaluation indexes involved in this paper will be introduced briefly below, where is the predicted value and is the true value.
Mean Absolute Error (MAE), which is equal to 0 when the predicted value is consistent with the real value completely. Furthermore, the greater the error is, the greater the value will be;
Root Mean Square Error (RMSE), which refers to the fitting degree between the measured value and the true value curve. Furthermore, the smaller the value is, the higher the measurement accuracy will be;
Mean Absolute Percentage Error (MAPE), which is often used as a statistical indicator to measure the accuracy of prediction, such as the prediction of time series.
To prove the superiority of GNN, we choose FC-LSTM, SFM, GraphWaveNet, N-BEATS, LSTNet, DeepState, TCN and DeepGLO, which are advanced models at present, to compare with GNN. The results are shown in
Table 2.
We compared the iteration rate and results of the above methods by setting the iteration time as 50, and the results are displayed in
Figure 5. According to
Table 2 and
Figure 5, it can be seen that the method proposed in this paper has significant advantages in both convergence results and rates. The final fitting result of GNN is better than other methods, and it is more accurate for multi-channel time-series prediction.
In the following, we apply the model obtained after training the BIDMC-CHF database to a new database for testing and verification. The MIT-BIH arrhythmia database is used as the test set, which contains 48 half-hour excerpts of two-channel ambulatory ECG recordings, obtained from 47 subjects studied by the BIH Arrhythmia Laboratory between 1975 and 1979. Twenty-three recordings were chosen at random from a set of 4000 24-h ambulatory ECG recordings collected from a mixed population of inpatients (about 60%) and outpatients (about 40%) at Boston’s Beth Israel Hospital; the remaining 25 recordings were selected from the same set to include less common but clinically significant arrhythmias that would not be well-represented in a small random sample [
27]. After eliminating some ineffective methods, e.g., FC-LSTM, the results of testing on the MIT-BIH arrhythmia database are shown in
Table 3. Through comparison, it can be seen that our proposed method also performs well on new databases.
In order to reflect the clinical significance of this method,
,
and
were used in
Table 4. The new evaluation is still conducted on the MIT-BIH arrhythmia database. Furthermore, in order to make the results of the new evaluation index concise and clear, we selected three models with the best results to compare with our proposed method. The above three indicators are defined as follows,
where
is the number of true positive samples and
is the number of false negative samples.
where
is the number of true negative samples and
is the number of false positive samples. The
is then calculated by,


