1. Introduction
In recent years, artificial intelligence (AI) has been increasingly applied in the fields of health and medicine. AI has great potential to help improve healthcare throughout the world. Some highlighted applications, according to a survey published in [
1], could be the detection of hidden patterns in large volumes of healthcare data, analysis to aid clinical practice, and support healthcare professionals by providing up-to-date and trustworthy scientific information that can help reduce diagnosis errors and improve patient care. Furthermore, AI could be useful in developing countries and rural areas, where healthcare assistance may be limited or unavailable.
In the area of obstetrics and gynecology, the use of AI has shown increasing interest in the scientific community. In [
2], authors reviewed the current state of research on methodologies, techniques, algorithms, and frameworks used in AI applied to pregnancy health and well-being. This study shows that AI can be applied to many pregnancy-related conditions or complications such as gestational diabetes, hypertension disorders, pre-eclampsia, preterm birth, mental health, and, in general, maternal and fetal well-being. In particular, machine learning (ML) has a wide range of applications in this field, including monitoring maternal and fetal health status, detecting risk factors during pregnancy, early detection of changes in a pathology, and prediction of preterm. ML can be a powerful tool that could be used to support women during pregnancy and to improve maternal and fetal health status and well-being [
2]. In particular, in the prevention of maternal risk during pregnancy, a growing number of studies show that ML can help as a prediction and detection tool. There are multiple topics of interest, such as real-time monitoring systems to detect changes in mother and fetus health status [
3], prediction of gestational diabetes [
4], prediction of postpartum hemorrhage [
5], prediction of preterm [
6], prediction of hypertension disorders such as HELLP syndrome (Hemolytic anemia, Elevated Liver enzyme, Low Platelet count) [
7], and detection of abnormal image pattern on fetal ultrasound, such as congenital central nervous system (CNS) malformations [
8].
In this work, we developed an ML model to detect placental dysfunction disorders. In particular, the model can predict if a pregnant woman suffers from pre-eclampsia (PE), intrauterine growth restriction (IGR), both, or none of the conditions.
PE and IGR are conditions related to placental insufficiency. On the one hand, pre-eclampsia is a specific pregnancy disorder that affects 3–5% of pregnancies worldwide [
9]. It is a hypertension disorder that presents after 20 weeks of gestation. PE can be classified into early PE (before 34 weeks of gestation) and late-onset PE (after 34 weeks of gestation) [
10]. Early-onset PE is commonly associated with other maternal organ dysfunctions, such as renal insufficiency, liver involvement, neurological or hematological complications, uteroplacental dysfunction, or fetal growth restriction. In contrast, late-onset PE is generally associated with mild disease, with a low impact on maternal and/or fetal outcomes [
11]. On the other hand, the American College of Obstetricians and Gynecologists defines intrauterine growth restriction as “a fetus that fails to reach his/her potential growth” [
12]. Infants with IURG have many acute neonatal problems that include perinatal asphyxia, hypothermia, hypoglycemia and polycythemia, and other long-term complications such as behavioral problems, cerebral palsy, growth failure, and lower levels of intelligence, among others [
13]. Both PE and IGR are considered important causes of maternal, neonatal, and fetal morbidity and mortality [
14]. Being able to predict these conditions early in pregnancy would be crucial to improving newborn and maternal outcomes. Therefore, the development of a ML model to predict these diseases could be a very valuable tool to support clinicians in making decisions.
Pre-eclampsia and intrauterine growth restriction are characterized by abnormal placental formation that results in inadequate uteroplacental blood flow [
15]. Uterine Artery Doppler ultrasound is a non-invasive diagnostic method that uses high-frequency sound to assess the uteroplacental circulation. The use of Doppler of the uterine artery has not been accepted in routine practice, but in combination with the angiogenic markers sFlt-1 (soluble fms-like tyrosine kinase-1) and PlGF (placental growth factor), it could become a very powerful tool for the prediction and early diagnosis of pre-eclampsia and intrauterine growth restriction [
11].
In the scientific literature, previous work on this topic uses this dataset to predict PE and IGR [
16]. The main shortfall of their model is that it only solves a classification task between a control group and a group with placental dysfunction-related disorder (PDD), pre-eclampsia or IUGR. Therefore, the authors do not differentiate whether a pregnant woman has only pre-eclampsia, IURG, or both conditions. This paper proposes a new approach: a multi-label classification. The principal characteristic of our model is that it can predict whether a pregnant woman suffers from PE, IURG, both disorders, or none of them.
2. Materials and Methods
2.1. Model Design
We have developed a machine learning model to predict pregnancy outcomes. To report its results, we have followed the guidelines specified in the Guidelines for Developing and Reporting Machine Learning Predictive Models in Biomedical Research: A Multidisciplinary View [
17]. Python was the programming language chosen to develop the machine learning model. Scikit-learn was used to implement the ML algorithm. Scikit-learn [
18] is a machine learning library written in Python. It provides a wide range of state-of-the-art machine learning algorithms for supervised (including the multi-output classification and regression algorithm) and unsupervised problems.
We used a public dataset from a prospective cohort study on the use of Doppler measures of the uterine arteries and the sFlt-1/PlGF ratio in hypertensive disorders during pregnancy [
19]. The model was designed to make a prognosis of pregnancy outcomes. In particular, the model had to solve a multi-label classification task. The under-prediction of the model can increase maternal and neonatal mortality and morbidity, while the over-prediction can increase health care costs. We aim to avoid both scenarios, but prioritizing the prediction of pregnant women with a placental dysfunction disorder. The metrics used to evaluate the performance of the model were precision, recall, F1 score, AUR-ROC, Hamming loss, and confusion matrix. In addition, a Dummy Classifier was used as a baseline model. We defined a classifier that made predictions based on the most frequent label of the dataset. All code developed for the model is available in the
Appendix A.
2.2. Dataset
The dataset used is publicly available in Mendeley Data [
19]. These data belong to a study conducted by the University Medical Center Ljubljana, from September 2012 to January 2015 [
20]. The study was approved by the Republic of Slovenia National Medical Ethics Committee (No. 104/04/12). Data were collected from 95 patients with a singleton pregnancy between 24 and 38 weeks of gestation. The study sample included 22 women with PE, 32 women with PE and IGR, 12 women with IGR, and 29 women with low-risk pregnancy as a control group (without any signs of hypertensive disorders during pregnancy, pre-pregnancy hypertension, pre-pregnancy diabetes, or gestational diabetes). The features provided in the dataset included maternal characteristics, neonatal characteristics, Doppler measures of the uterine arteries (for the right and left uterine artery), sFlt-1 value, PlGF and the ratio of sFlt-1/PlGF. Mean values were also included for each measure of the uterine artery. All features are listed and described in
Table 1.
Initially, gestational age at delivery and weight were discarded. These features are collected at the end of pregnancy. Therefore, they cannot be used to detect risks during pregnancy.
2.3. Exploratory Analysis
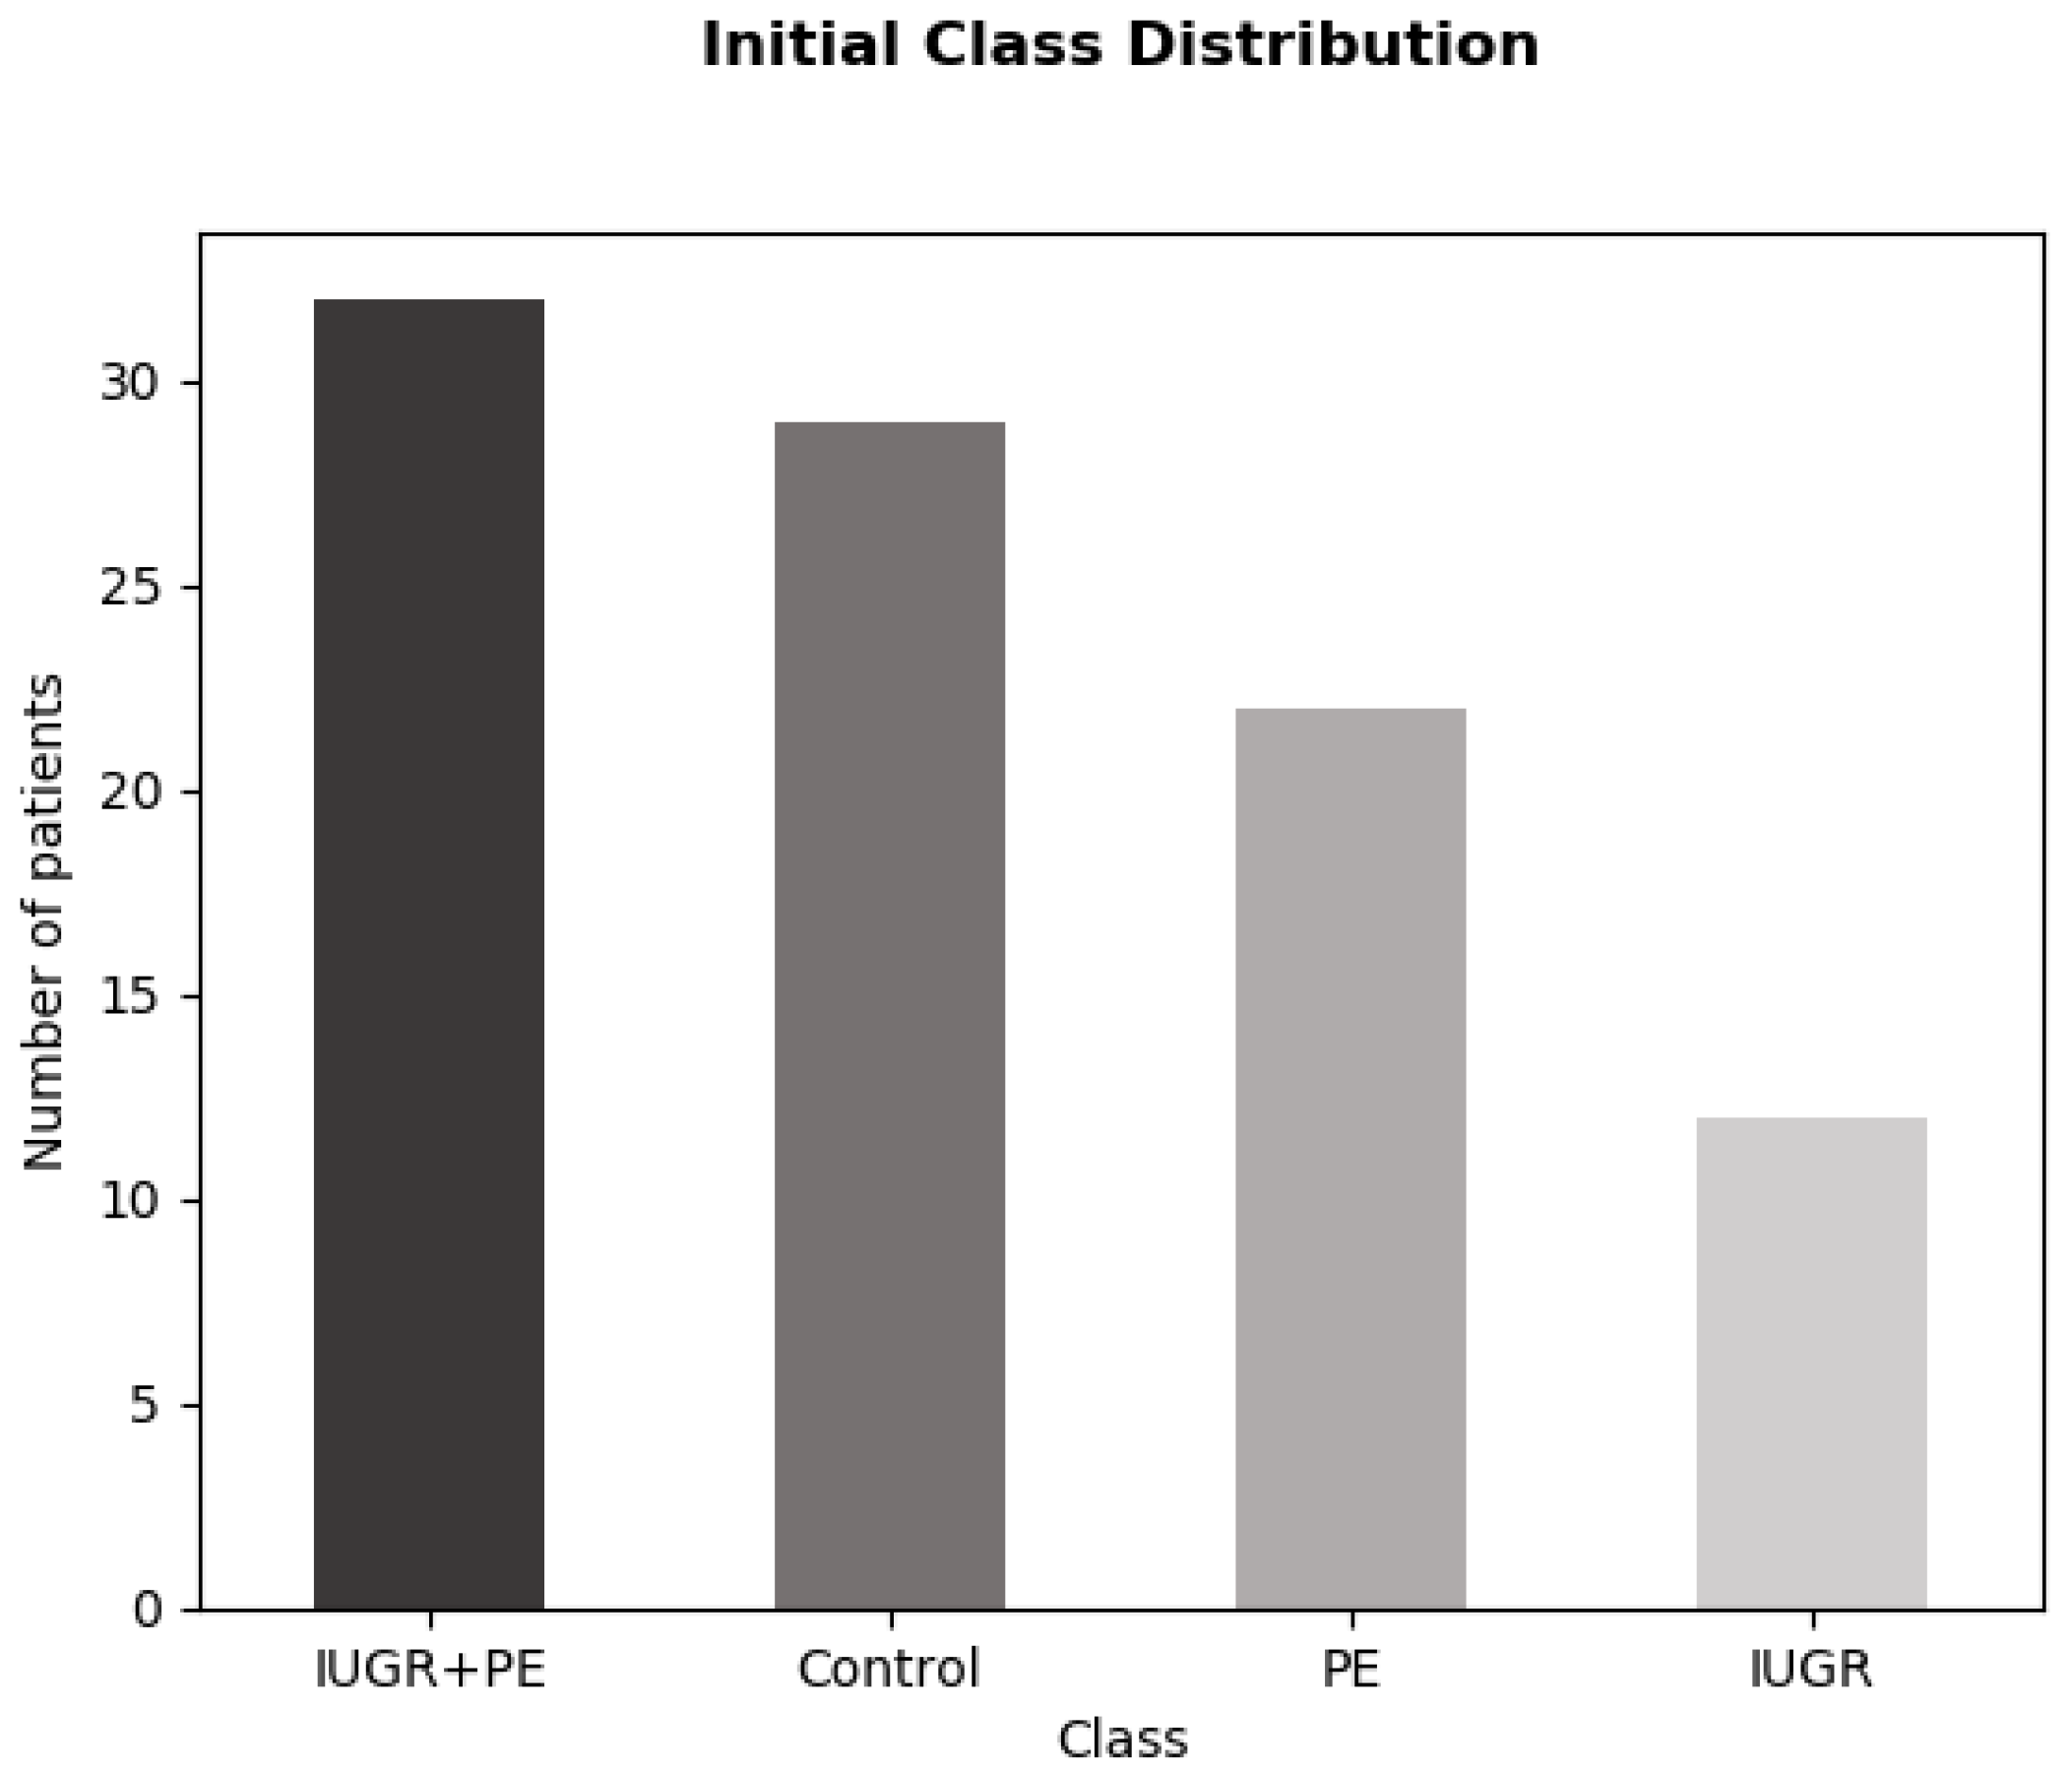
The dataset contains 95 instances and 21 features. As mentioned above, we initially dismissed gestational age at delivery and weight. We also removed the ID column. Seven null values were found in the dataset: three values in the BMI column, two values in mean PSV, one value in pre-pregnancy weight, and one value in height. These values could be inferred in the preprocessing stage. The target variable was multiclass. There were four different categories: IUGR_PE, Control, PE, and IUGR. The distribution of these features was imbalanced, as can be observed in
Figure 1.
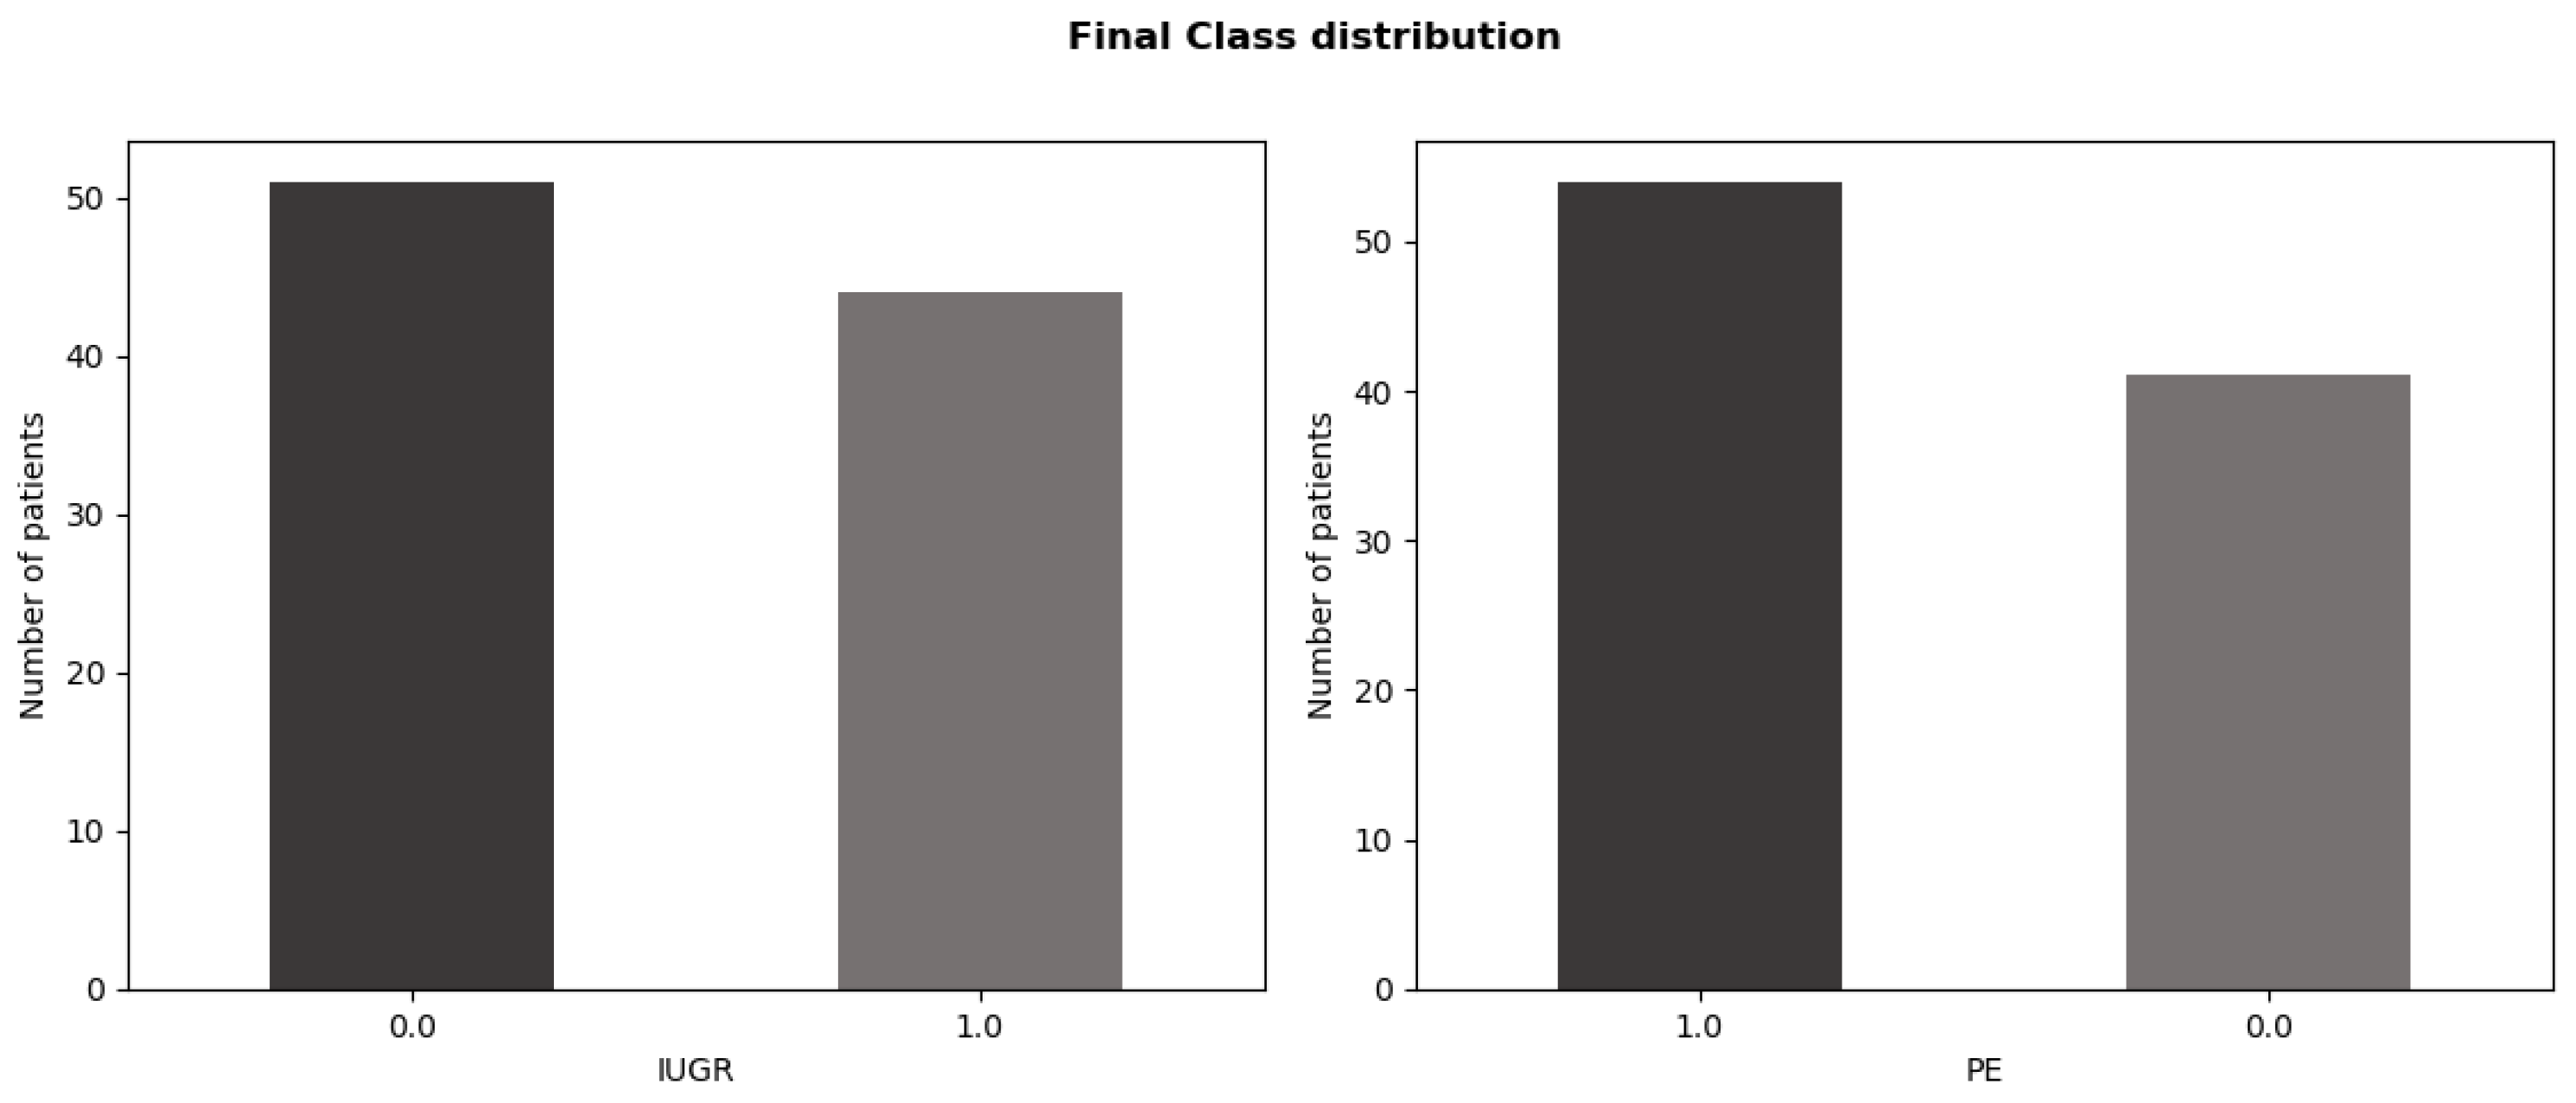
During the exploratory data analysis, it was detected that the problem could be treated as a multi-label instead of a multi-class classification. The IUGR + PE and Control classes truly depended on the presence or absence of PE or IUGR. Thus, we define two binary tags as output: PE and IUGR. The encoding of each category is described in
Table 2.
The new distribution of the target variable was more balanced, as shown in
Figure 2.
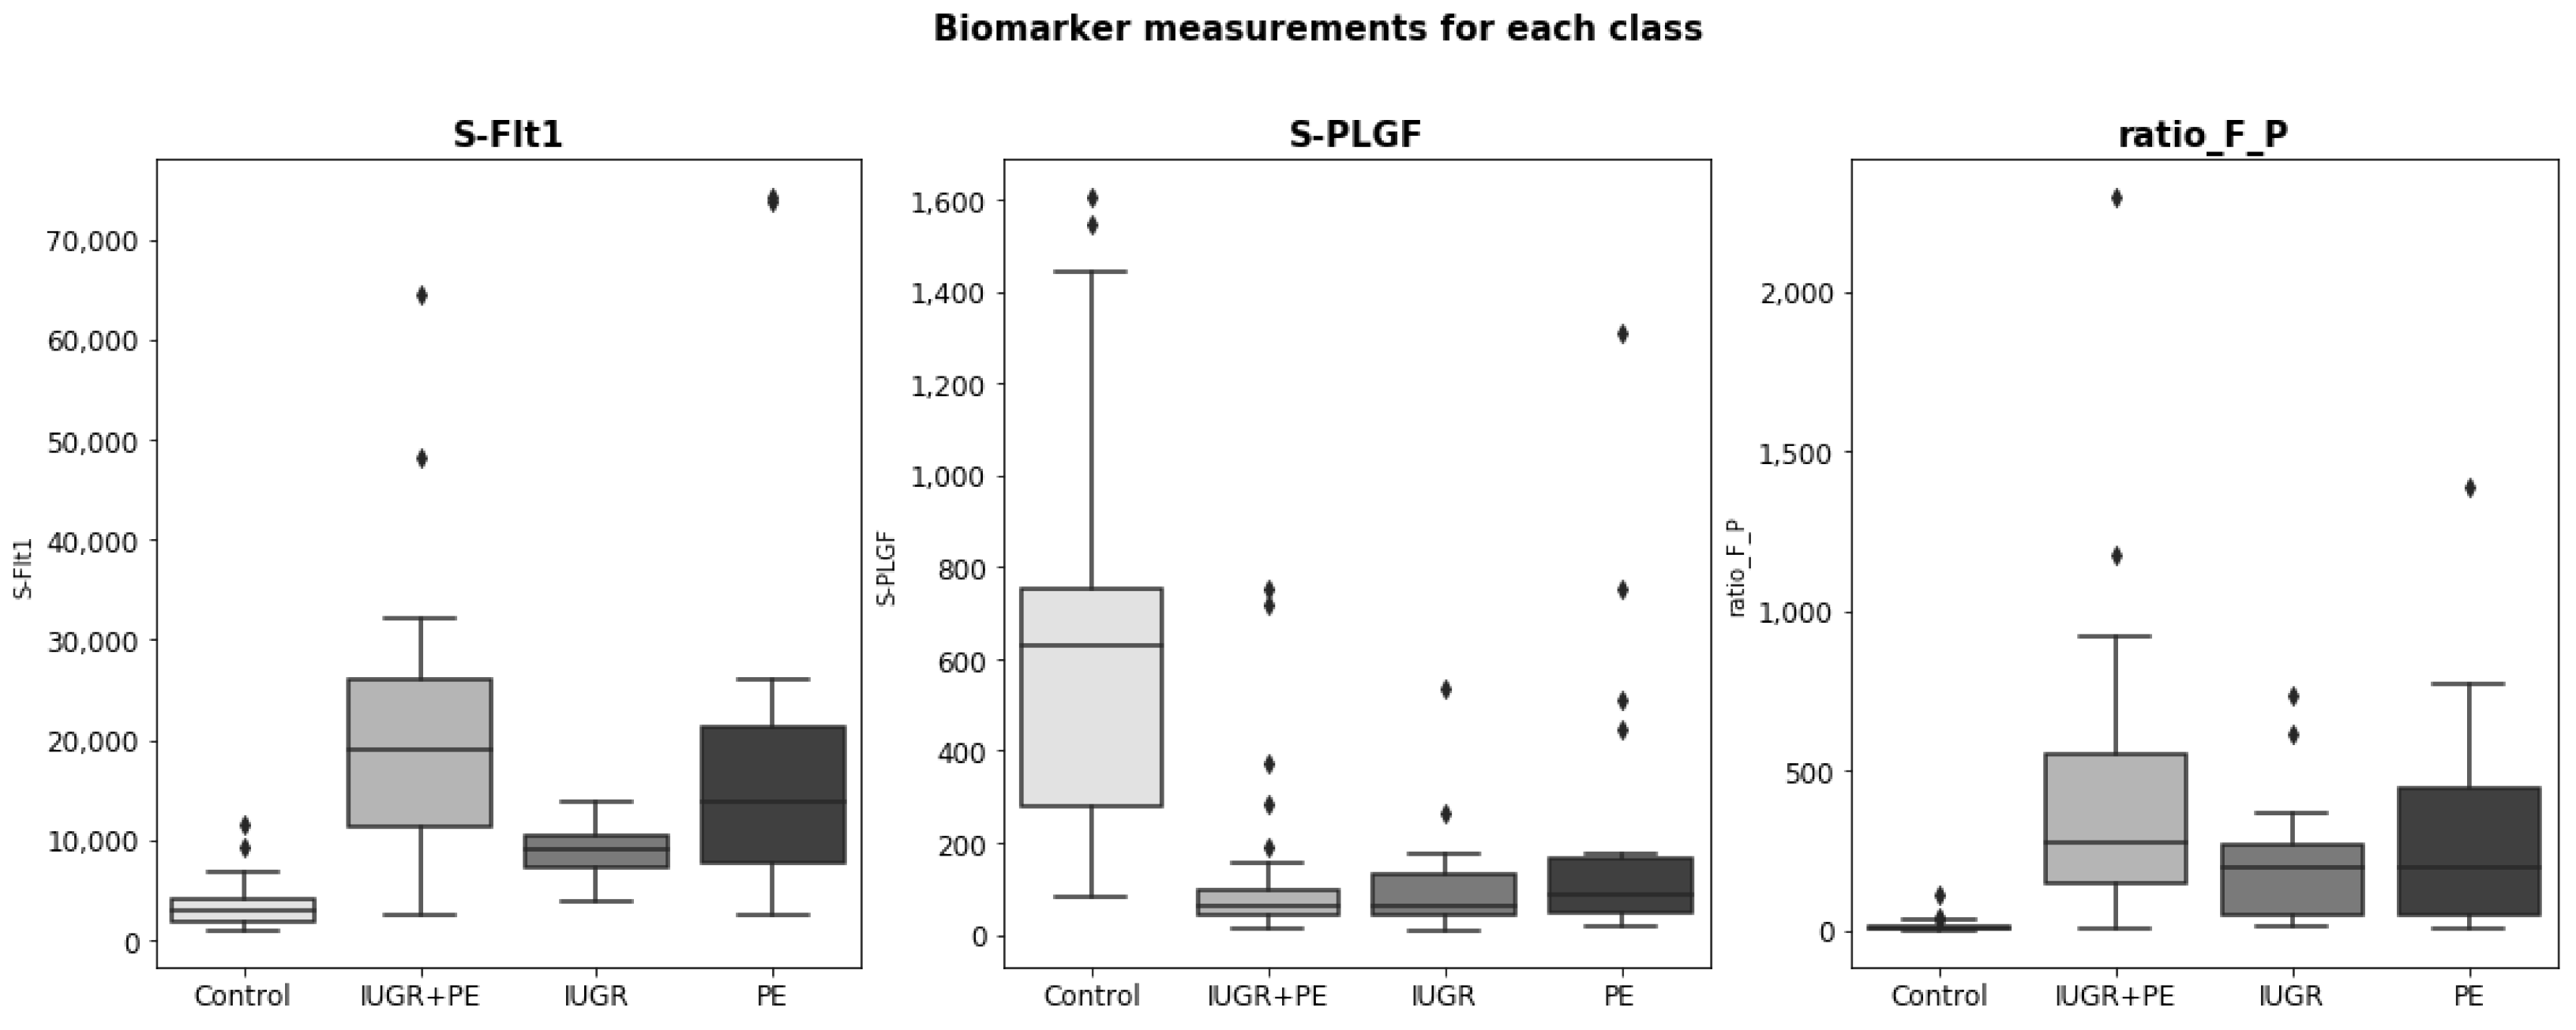
All characteristics were numerical, except parity and bilateral notch, which were considered categorical variables. The numerical variables had different magnitudes (for example, the PlGF value is three orders of magnitude higher than the height value). In addition, many features had a skewed distribution. Doppler ultrasound measurements and the biomarkers sFlt-1 and PlGF are relevant in the early detection of PE and IRG. We studied the distribution of these variables for each class to prove their relevance.
For all biomarker distributions, there were significant differences between the control group and the groups with any placental disorder (see
Figure 3). Specifically, the sFlt-1 distribution of the control group is lower than the rest, while the PlGF value is much higher. Among the placental disorder groups, notable differences in the sFlt-1 value were also detected (in the case of PlGF, all shared a similar distribution).
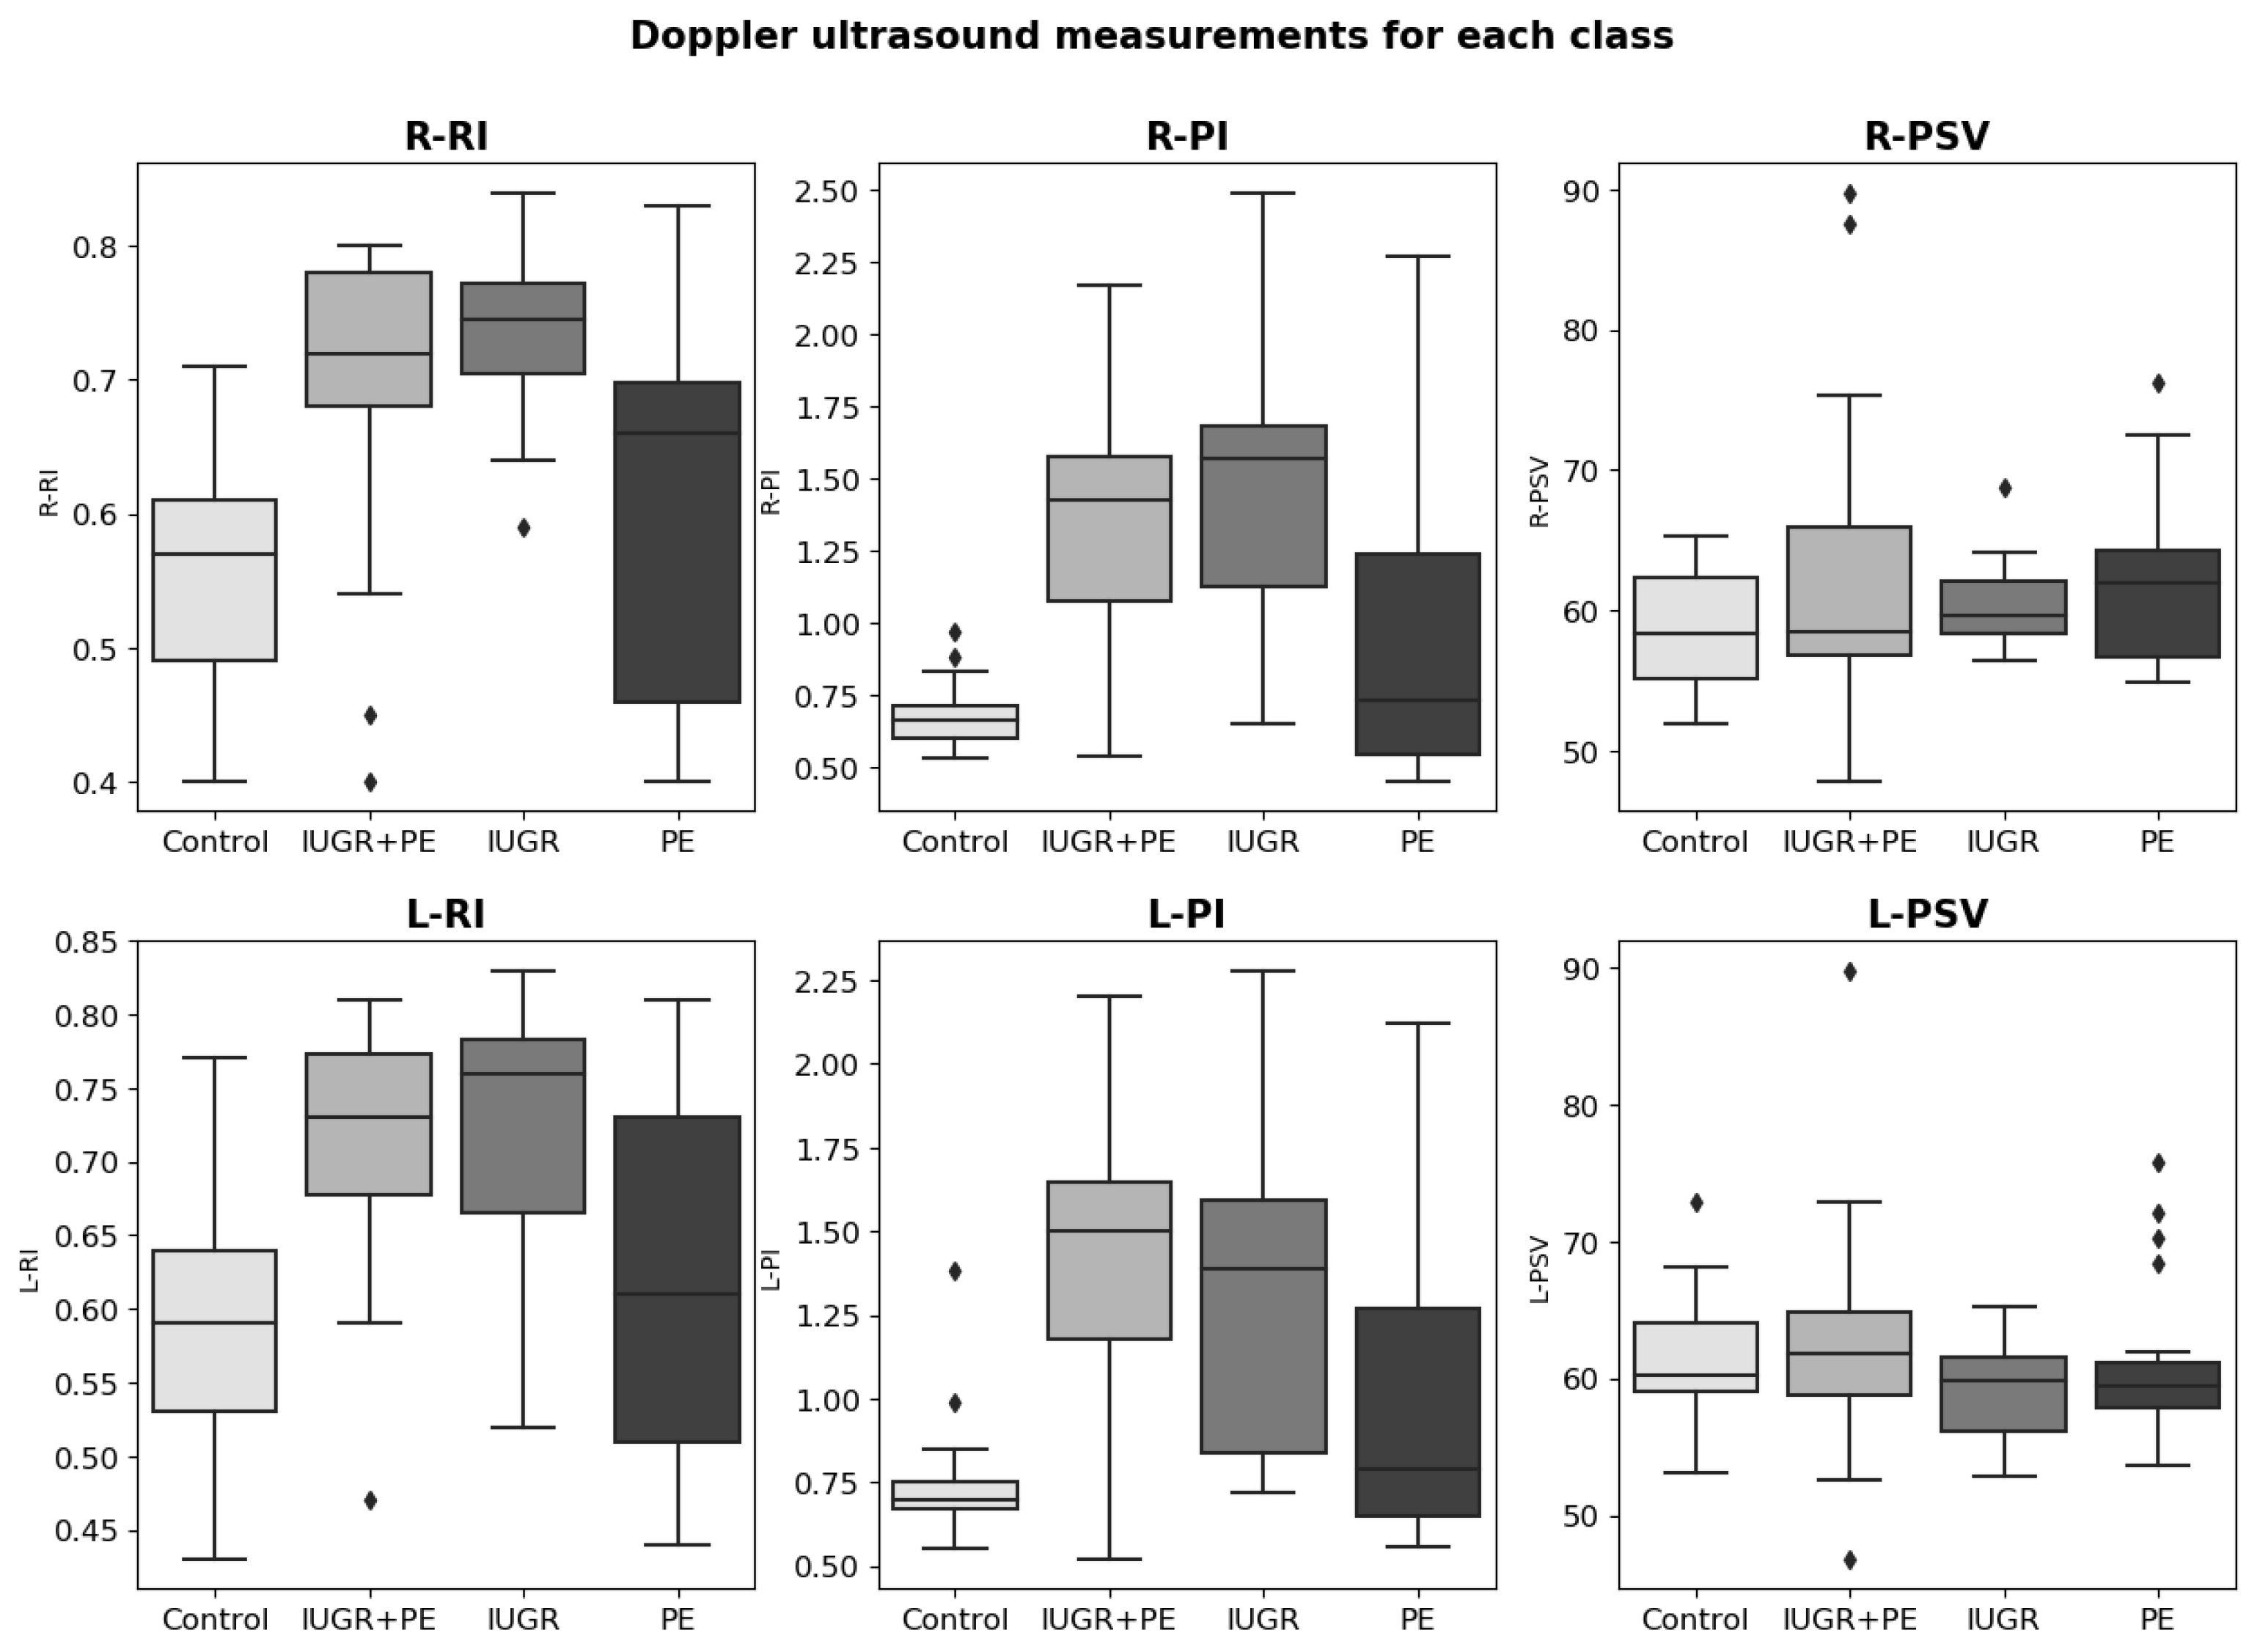
In Doppler ultrasound measurements (see
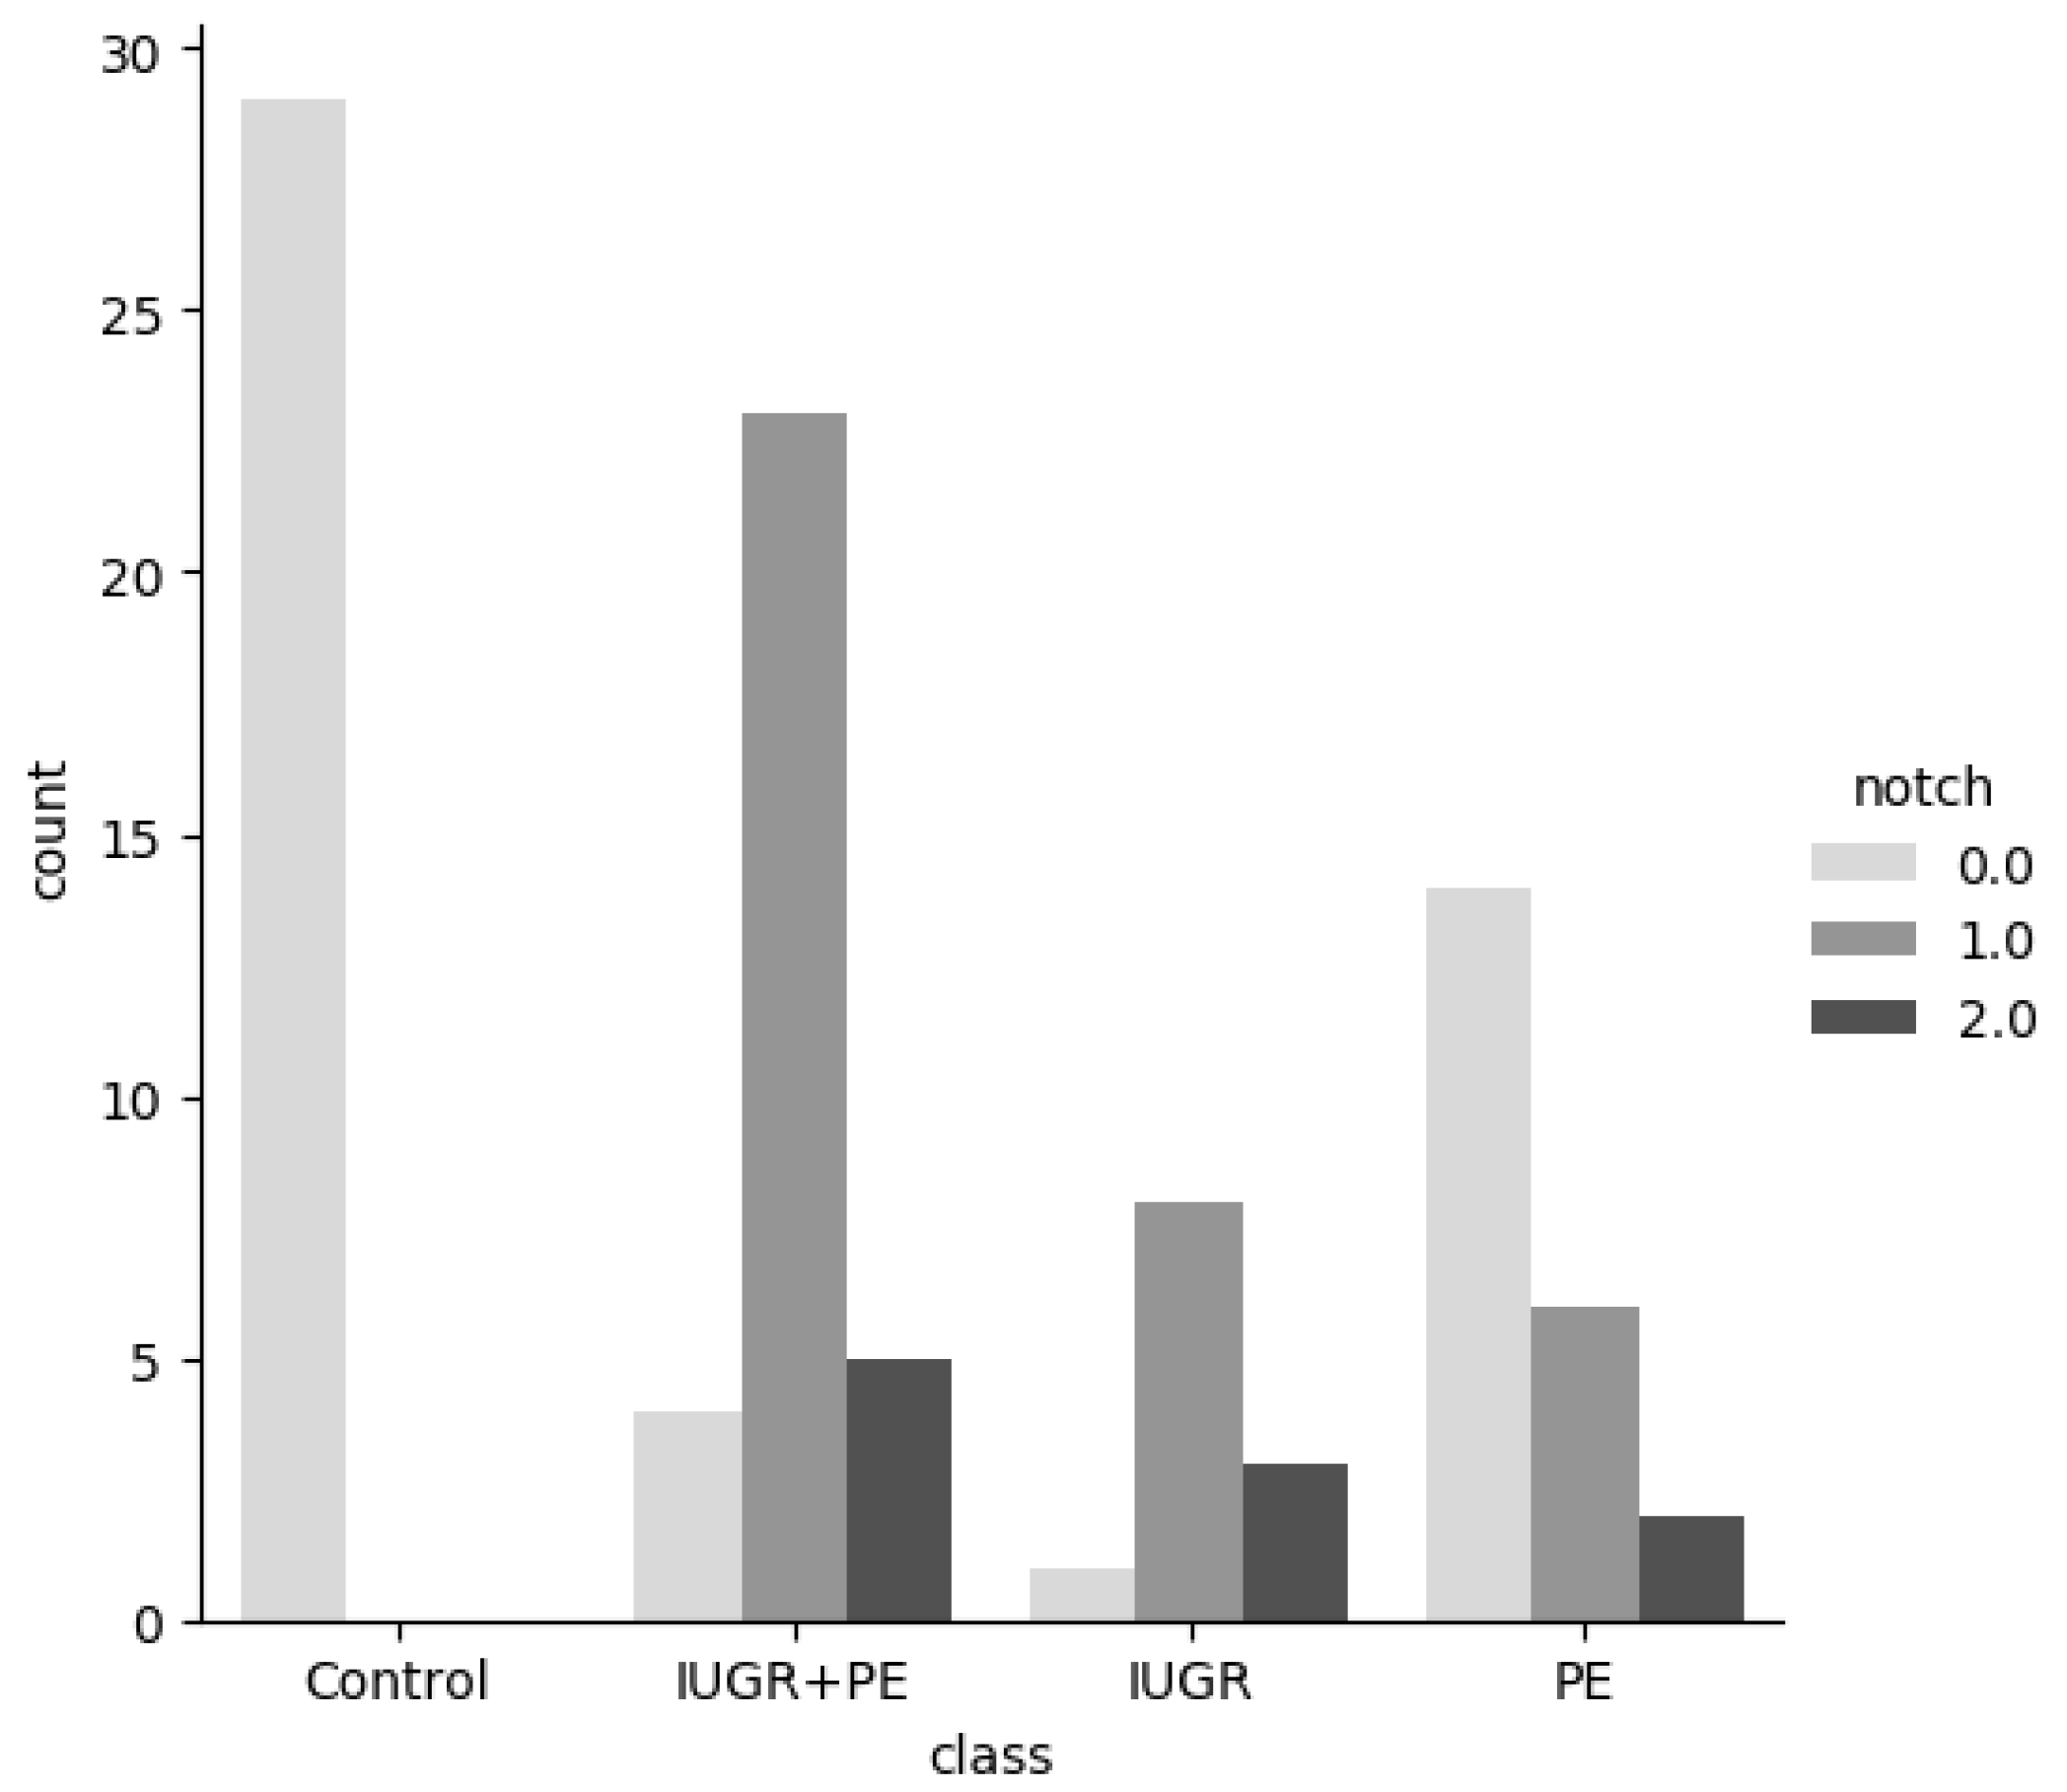
Figure 4), we also observed important differences between categories in the Pulsatility Index value and the Resistance Index value. For the PSV value, the differences were less significant. Regarding the notch feature, it was observed that no notch was found in the arteries in the control group (see
Figure 5). Furthermore, we could see that unilateral notch is present in a higher proportion in pregnant women with IGR.
Finally, we study the correlation between the variables. Several highly correlated variables were detected. The features meanPI, meanRI, meanPSV, and BMI contained information about other columns (for example, meanRI contains the mean value of the resistance index of the left and right). Therefore, they were very closely related to other columns.
2.4. Data Preprocessing
Several transformations were applied to the raw data. First, all high-correlated features were dropped (meanRI, meanPI, meanPSV, and BMI). If two predictors are highly correlated, this implies that they are measuring the same underlying information. Removing one should not compromise the performance of the model and might lead to a more interpretable model. Even some models can improve their performance by removing these variables [
21]. After removing said variables, only two null values remained, one in height and the other in weight column. We calculate the relative standard deviation (RSD) to see whether the average could be a representative value of the features. RSD is obtained by dividing the standard deviation by the average and dividing by 100 (it is expressed as a percent). The RSDs were 3.78% and 21.26% for height and weight, respectively. Thus, we concluded that the data were clustered around the mean and that we could use it to impute the missing values. Concerning the numerical features, two transformations were applied: logarithmic transformation and standardization. The logarithmic transformation was applied to features with a skewed distribution. Replacing the data with the log can help remove the skew [
21]. Standardization was applied to all numerical variables to homogenize their magnitudes. Categorical features were encoded. We used the one-hot encoding technique, which consists of creating as many columns as different values are contained in the column and attributing the value 1 to the category to which the data correspond, and 0 to the rest of them. Finally, the target variable was also encoded. We defined a function to transform the target variable into two binary features: PE and IURG. Data were divided into test (20%) and training (80%) sets. The training set was used to train the models and the test set was used for validation.
2.5. Model Training
Learning from multi-label data can be achieved through different approaches, such as data transformation, adaptation of traditional classification methods, and use of ensembles of classifiers [
22]. In this work, we focus on the data transformation and method adaptation approach.
The data transformation method is based on transformation techniques that transform the original multilabel data into one or more binary or multiclass datasets. On the other hand, the adaptation method consists of adapting existing classification algorithms, so that they can process multi-label data and produce several outputs instead of one [
22]. Some models that can be adapted to multilabel classification are Decision Tree Classifier, Extra Tree Classifier, Random Forest Classifier, and K-Nearest Neighbors Classifier.
Decision tree is a non-parametric supervised learning algorithm which can be used to solve classification task. It has a tree structure consisting of a root node, branches, internal nodes, and leaf nodes. It employs a divide-and-conquer strategy, which is a recursive partitioning of the problem into two or more subproblems until it becomes simple enough to be solved directly. Thus, the decision tree classifier splits the data in a top-down, recursive manner until all, or the majority of records have been classified under the specific class labels. As parameters, we have selected the Gini impurity (the probability of misclassifying an observation) to measure the quality of a split, the best split at each node as a split criterion, two minimum number of samples to split an internal node, and at least one sample to be at a leaf node.
The Extra Tree Classifier is a variation of a Decision Tree Classifier. It consists of an extremely randomized tree classifier. It strongly randomizes both the attribute and the cut-point choice while splitting a tree node. As parameters, we have selected the Gini impurity (the probability of misclassifying an observation) to measure the quality of a split, the random split at each node as a split criterion, two minimum numbers of samples to split an internal node, and at least one sample to be at a leaf node.
Random Forest Classifier is also a tree-based method that consists of a large number of individual decision trees that operate as an ensemble. It is an extension of the bagging method as it utilizes both bagging and feature randomness to create an uncorrelated forest of decision trees. In the bagging method, a random sample of data is selected from a training set for replacement. Then, several data samples are generated and they are used to train the models independently. The feature randomness (also known as the random subspace method) generated a random subset of features, which ensures the low correlation between the different decision trees generated. This is an important difference between decision trees and random forests: while decision trees consider all the possible feature splits, random forests only select a subset of those features. In the classification task, the output of the random forest model is the most voted class among all decision trees. As hyperparameters, we chose two as node size, and the number of trees in the forest was set to one hundred. To set the number of features to use, we used the square root of the total of features.
Finally, the K-Nearest Neighbors (KNN) Classifier is an instance-based learning algorithm. It is a lazy learning algorithm, as it delays the induction or generalization process until classification is performed. KNN algorithm assumes that instances within a dataset will generally exist in close proximity to other instances that have similar properties. KNN works by finding the distances between an unclassifier instance and all the instances in the data, selecting the specified number of examples (K) closest to it, and then determining its label by identifying the most frequent label of its neighbors. To calculate the distance between the instances, we used the Euclidean distance. Moreover, the K value chosen was five.
Regarding data transformation, we applied two of the methods proposed in the literature: Binary Relevance and Label Powerset. Binary relevance is a straightforward approach to handling a multilabel classification task. It decomposes the learning of each label into a set of binary classification tasks, one per label, where each model is independently learned, using only the information from that label and ignoring the information from the others [
23]. The main drawback of this technique is that it does not consider any label dependency. However, this technique also has advantages, such as that any binary learning algorithm can be used as an estimator, and it has linear complexity for the number of labels [
23]. In our case, we used Gaussian Naïve Bayes, Random Forest Classifier, Support Vector Machine, K Neighbors Classifier, and Decision Tree Classifier as estimators.
The label powerset method proposes using each different combination of labels as an identifier of a new class. The resulting dataset has only one class. Thus, it can be treated as a multiclass classification [
24]. We used as an estimator the Random Forest Classifier, Support Vector Machine, K Neighbors Classifier, and Decision Tree Classifier. We tested this method to evaluate the performance of models considering a multiclass problem (the original type of problem). A training set was used to train all these models.
2.6. Model Validation
After training the models, we use the test set to evaluate their performance. Model selection was evaluated by the AUC ROC (area under the curve ROC), accuracy (fraction of instances that the model classified correctly), precision (proportion of positive identifications that were actually positive), recall (proportion of the positive class that was correctly classified), F1 score (harmonic mean of precision and recall), and Hamming loss (proportion of misclassifications). Label-based measures decompose the evaluation of each label. There are two options available: averaging the measure label-wise (macro-average) or concatenating all label predictions and computing a single value over all of them (micro-average). Macro-average will compute the metric independently for each label, so it gives equal weight to all labels. On the contrary, micro-average metrics aggregate the contributions of all labels to compute the average metric [
23]. We use the macro-average version of recall, precision, and F1 score.
4. Discussion
We developed an ML model to predict pre-eclampsia and uterine growth restriction using data from pregnant women at 24–37 weeks of gestation. These data included maternal and fetal characteristics, as well as Doppler measures of the ureteral artery, sFlt-1, and PlGF values.
Recently, the term placental dysfunction-related disorder (PDD) has been implemented to include two entities with a common etiopathogenic origin: pre-eclampsia and IUGR. Although IUGR is one of the leading causes of fetal morbidity and mortality, pre-eclampsia is associated with hypertension and multiorgan dysfunction, being one of the leading causes of death in pregnant women worldwide [
25,
26]. Its importance lies not only in its severity but also in its high prevalence, which can affect up to 5% pregnant women [
27]. Every year, 500,000 babies and 76,000 women die in the world from these disorders.
Prediction of these entities can change the course of the disease, as these strategies will allow follow-up to anticipate and recognize the onset of the clinical syndrome and prevent or mitigate the development of PDD. Thus, in the scientific literature, models have generally been developed aimed at predicting PDD in the first trimester of pregnancy with maternal risk factors and biomarkers as a one-step procedure [
28]. Several studies have shown that low-dose aspirin initiated at <16 weeks’ gestation can be effective in reducing the prevalence of early-onset PE 8 with delivery at <34 + 0 week’s gestation) [
29,
30,
31], and also fetal growth restriction [
30].
Although some research has reported optimal results only when treatment begins before 16 weeks, The American College of Obstetricians and Gynecologists and the Society of Maternal-Fetal Medicine support that low-dose aspirin should be started between 12 weeks and 28 weeks of gestation and continued daily until delivery [
29].
Therefore, pregnant women who have not been deemed at high risk for PDD during the first trimester screening could benefit from this model: PDD could be predicted during second-trimester screening and prescript aspirin or start monitoring the evolution of the condition. Prediction of placental disease at 20 weeks opens a window of opportunity for those pregnant women who have not been able to receive adequate counseling and treatment in the first trimester.
This second-trimester prediction is particularly important in low- and/or middle-income countries (LMIC), due to a number of barriers that limit first trimester care, delayed first antenatal visit, or even contact with a healthcare worker. Furthermore, maternal mortality from pre-eclampsia is highest in LMIC, and pregnant women are at a higher risk of developing PDD [
15]. About 99% of serious morbidity occurs in LMIC, which makes prediction and prevention especially important in these countries.
Many barriers and factors can contribute to the low adoption of an early antenatal care visit in LMIC. Lack of knowledge, socioeconomic status, availability, accessibility, acceptability, family support, and previous experiences with the health system affect the timing of the first visit [
32]. In 2013, the estimated coverage of early antenatal care visits was 24% in low-income countries compared to 81.9% in high-income countries [
32]. In this context, many pregnant women do not have the opportunity to access early pre-eclamptic screening during the first trimester of pregnancy. Therefore, they could benefit from a model trained with data from the second trimester of gestation.
Our model has limitations that are derived mainly from the limited number of samples in the dataset used. Using a small dataset to train and test a prediction model might lead to an overestimation of performance. Although the amount of health data that can be collected is rapidly increasing, the availability of large publicly available datasets is still limited to researchers. Sharing health data presents multiple challenges, including integration, ethics, privacy, and regulations, among others.
External validation is needed to confirm the predictive performance of the model. Additionally, more studies are required to determine whether the integration of other predictive clinical characteristics into the model could improve its performance and generalization. More efforts must be made to incorporate this application into clinical practice. There are a variety of technical challenges. In addition to the challenge of lack of data, there is currently a lack of interoperability standards in terms of data structures in the databases of each hospital and practice. Another challenge is building trust towards AI solutions for all stakeholders: patients, medical practitioners, and managers. To achieve a mutual benefit relationship, maintaining a human-centered design is key.
5. Conclusions
In this article, we have developed a machine learning model to predict risk during pregnancy, in particular pre-eclampsia and intrauterine growth restriction. Both are disorders of placental dysfunction that are an important cause of maternal, neonatal, and fetal morbidity and mortality. Their detection could help improve newborn and maternal outcomes.
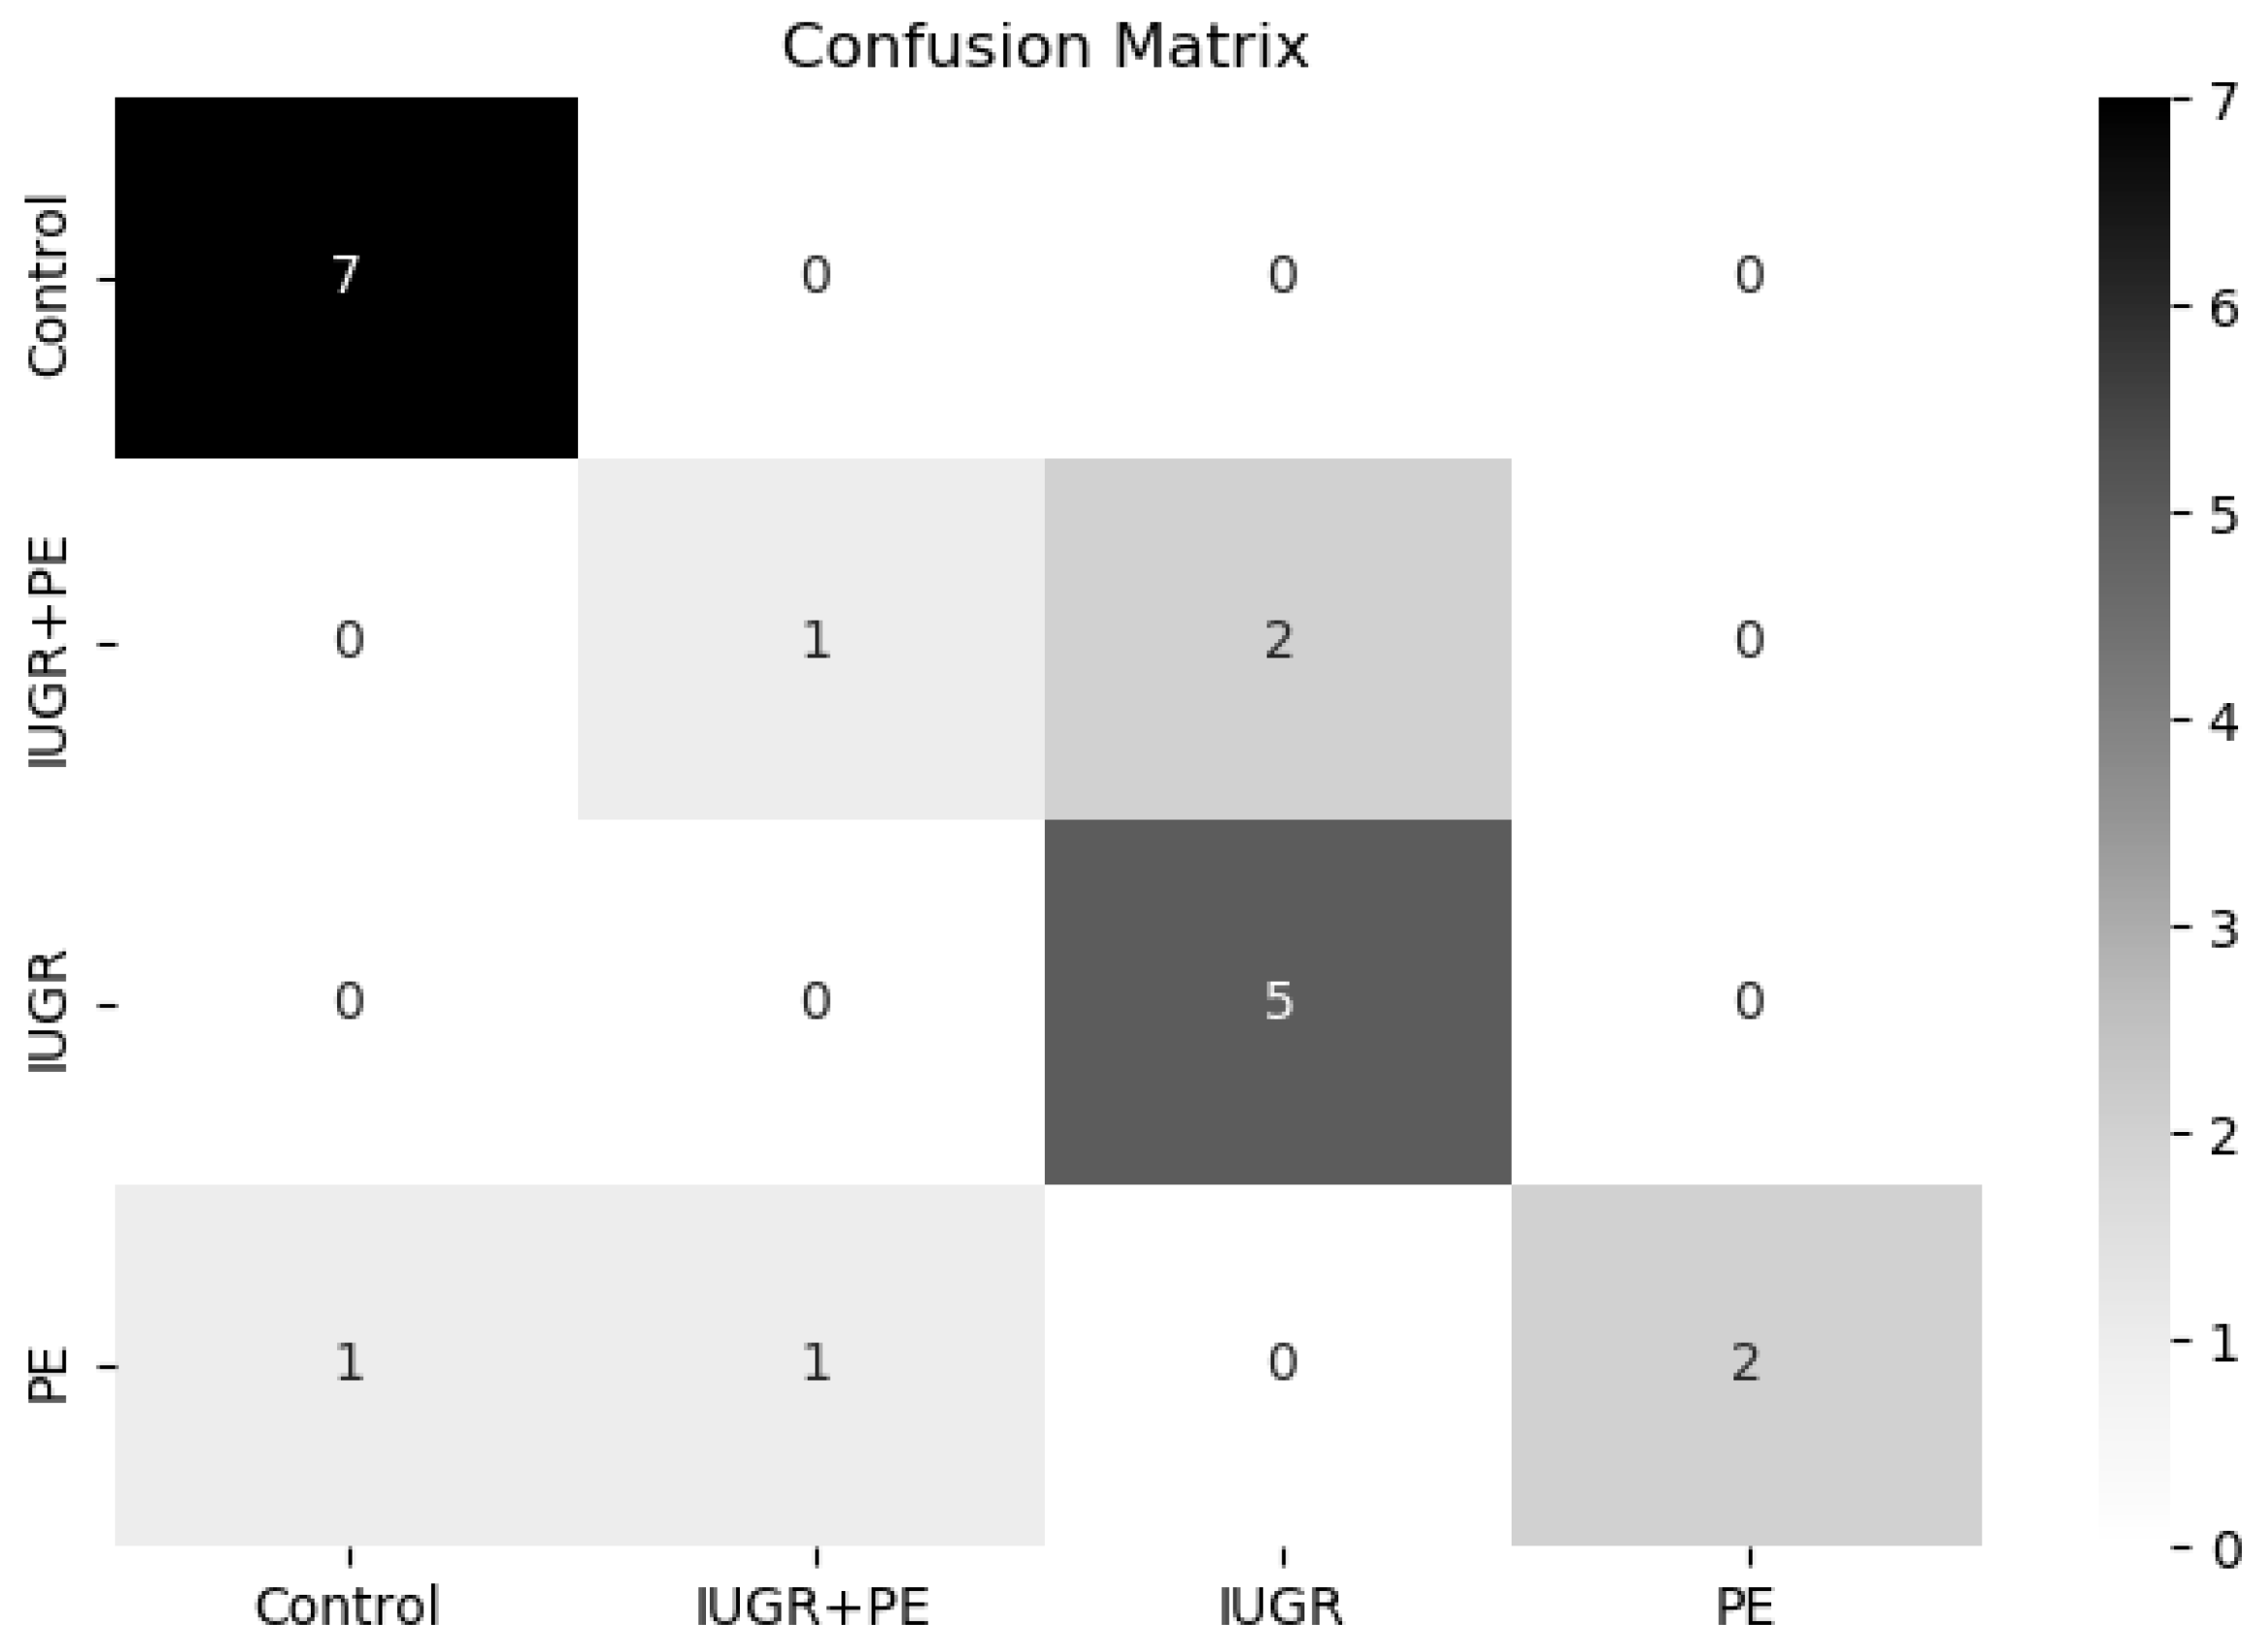
The extra tree classifier has achieved the best metric of all the models evaluated in terms of AUC ROC (0.87). It has a robust performance in classifying different placental disorders versus a control group. However, the model sometimes fails to detect pregnant women with both disorders. However, we demonstrate that a simple classification model performs quite well, and we consider that it could be used as a baseline classifier model to continue improving the prediction of pre-eclampsia and intrauterine growth restriction.
Moving forward with research, we strongly encourage researchers to contribute to open health data, sharing, when possible, anonymised health data. Furthermore, if a programming code has been used to reach the results in the paper, we encourage researchers to share it, in order to improve research reproducibility. We also encourage researchers to develop and implement new interpretable machine learning methods for health research, as a means to contribute to fair and ethical decision-making, which can lead to building trust in AI.
In conclusion, this article shows how machine learning could be used to improve maternal and fetal health and well-being, as well as to support women during such a complex vital period.


 ,
, 


