
A Sustainable Deep Learning-Based Framework for Automated Segmentation of COVID-19 Infected Regions: Using U-Net with an Attention Mechanism and Boundary Loss Function


Abstract
:1. Introduction
- To introduce a framework for automated segmentation of infected regions of the COVID-19 virus in lung/chest CT scans using a deep learning architecture;
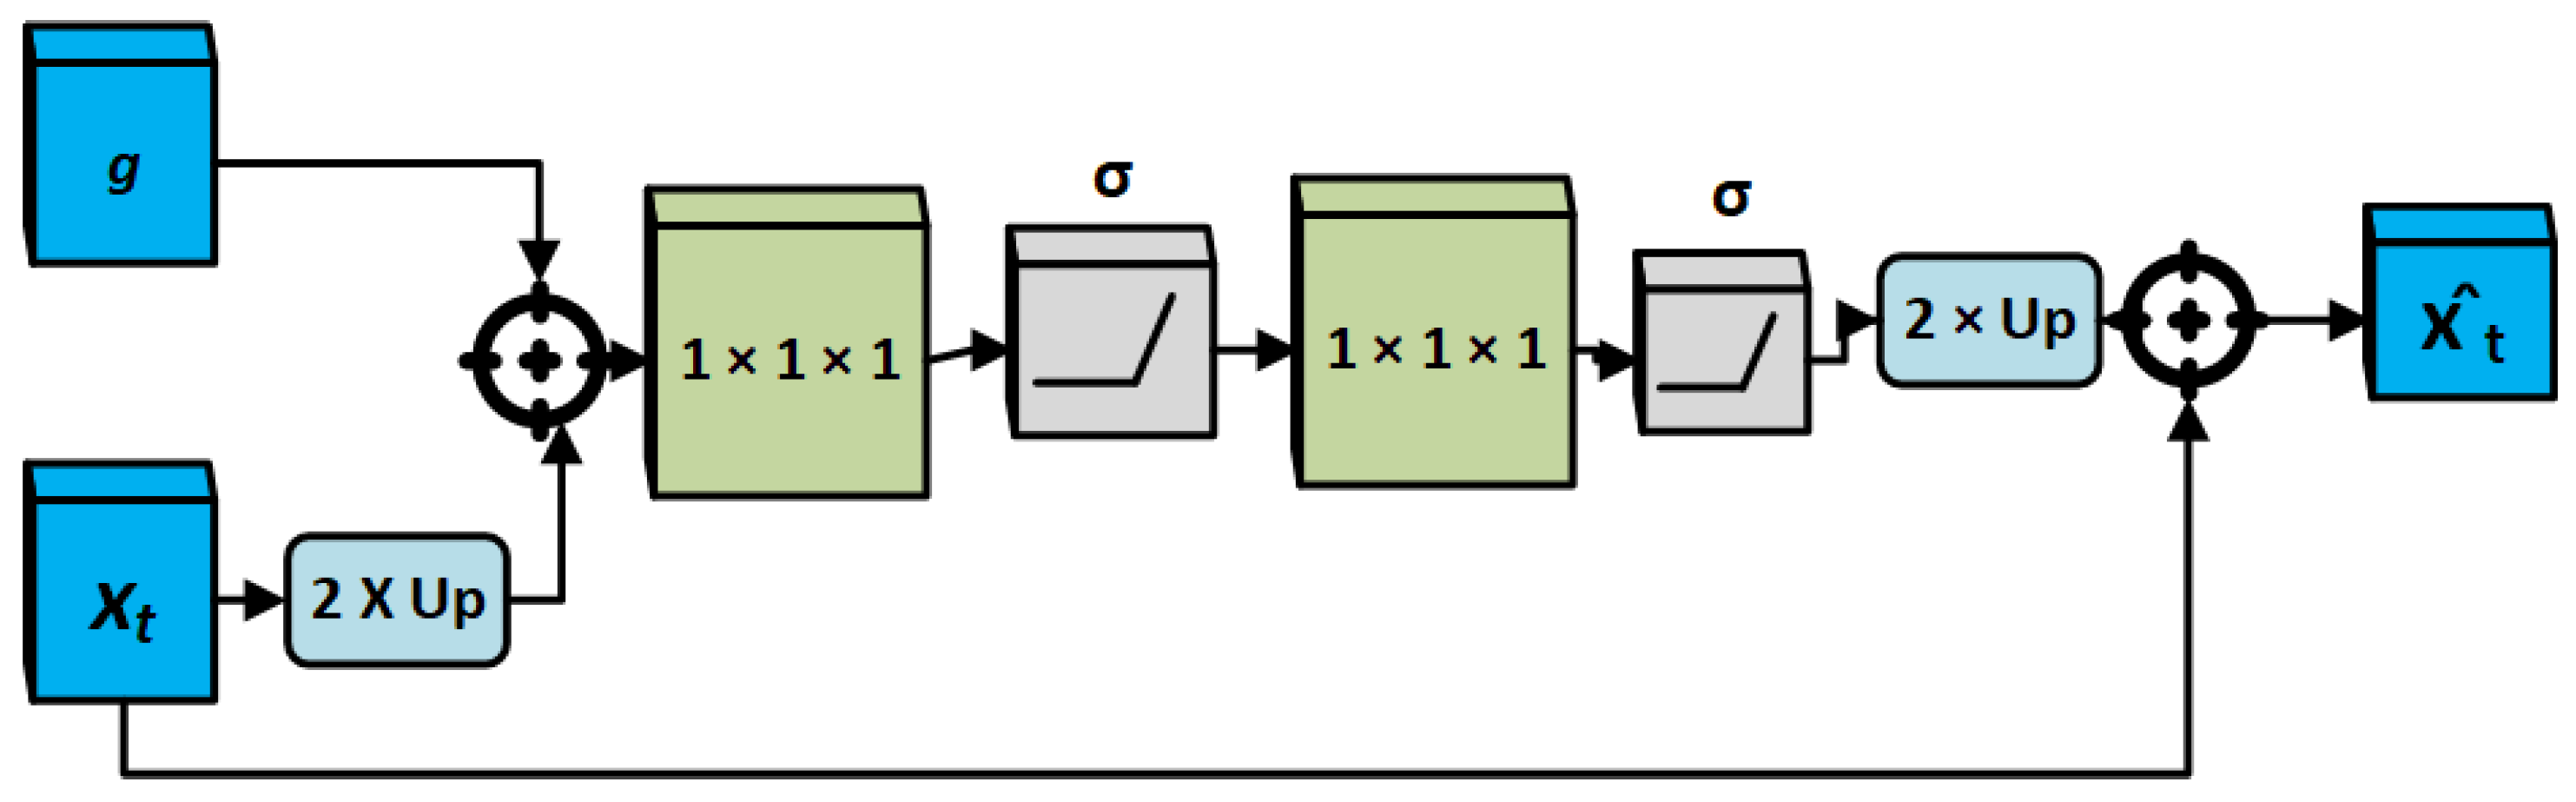
- To utilize the soft attention mechanism in order to enhance the framework’s capability, to extract more silent features, and to identify and segment virus-infected regions in CT scans;
- To address the issues of unbalanced data, attention U-Net architecture is combined with boundary loss function for small regions/lesion segmentation;
- To validate the effectiveness of the framework with other segmentation techniques in terms of segmentation accuracy.
2. Related Work
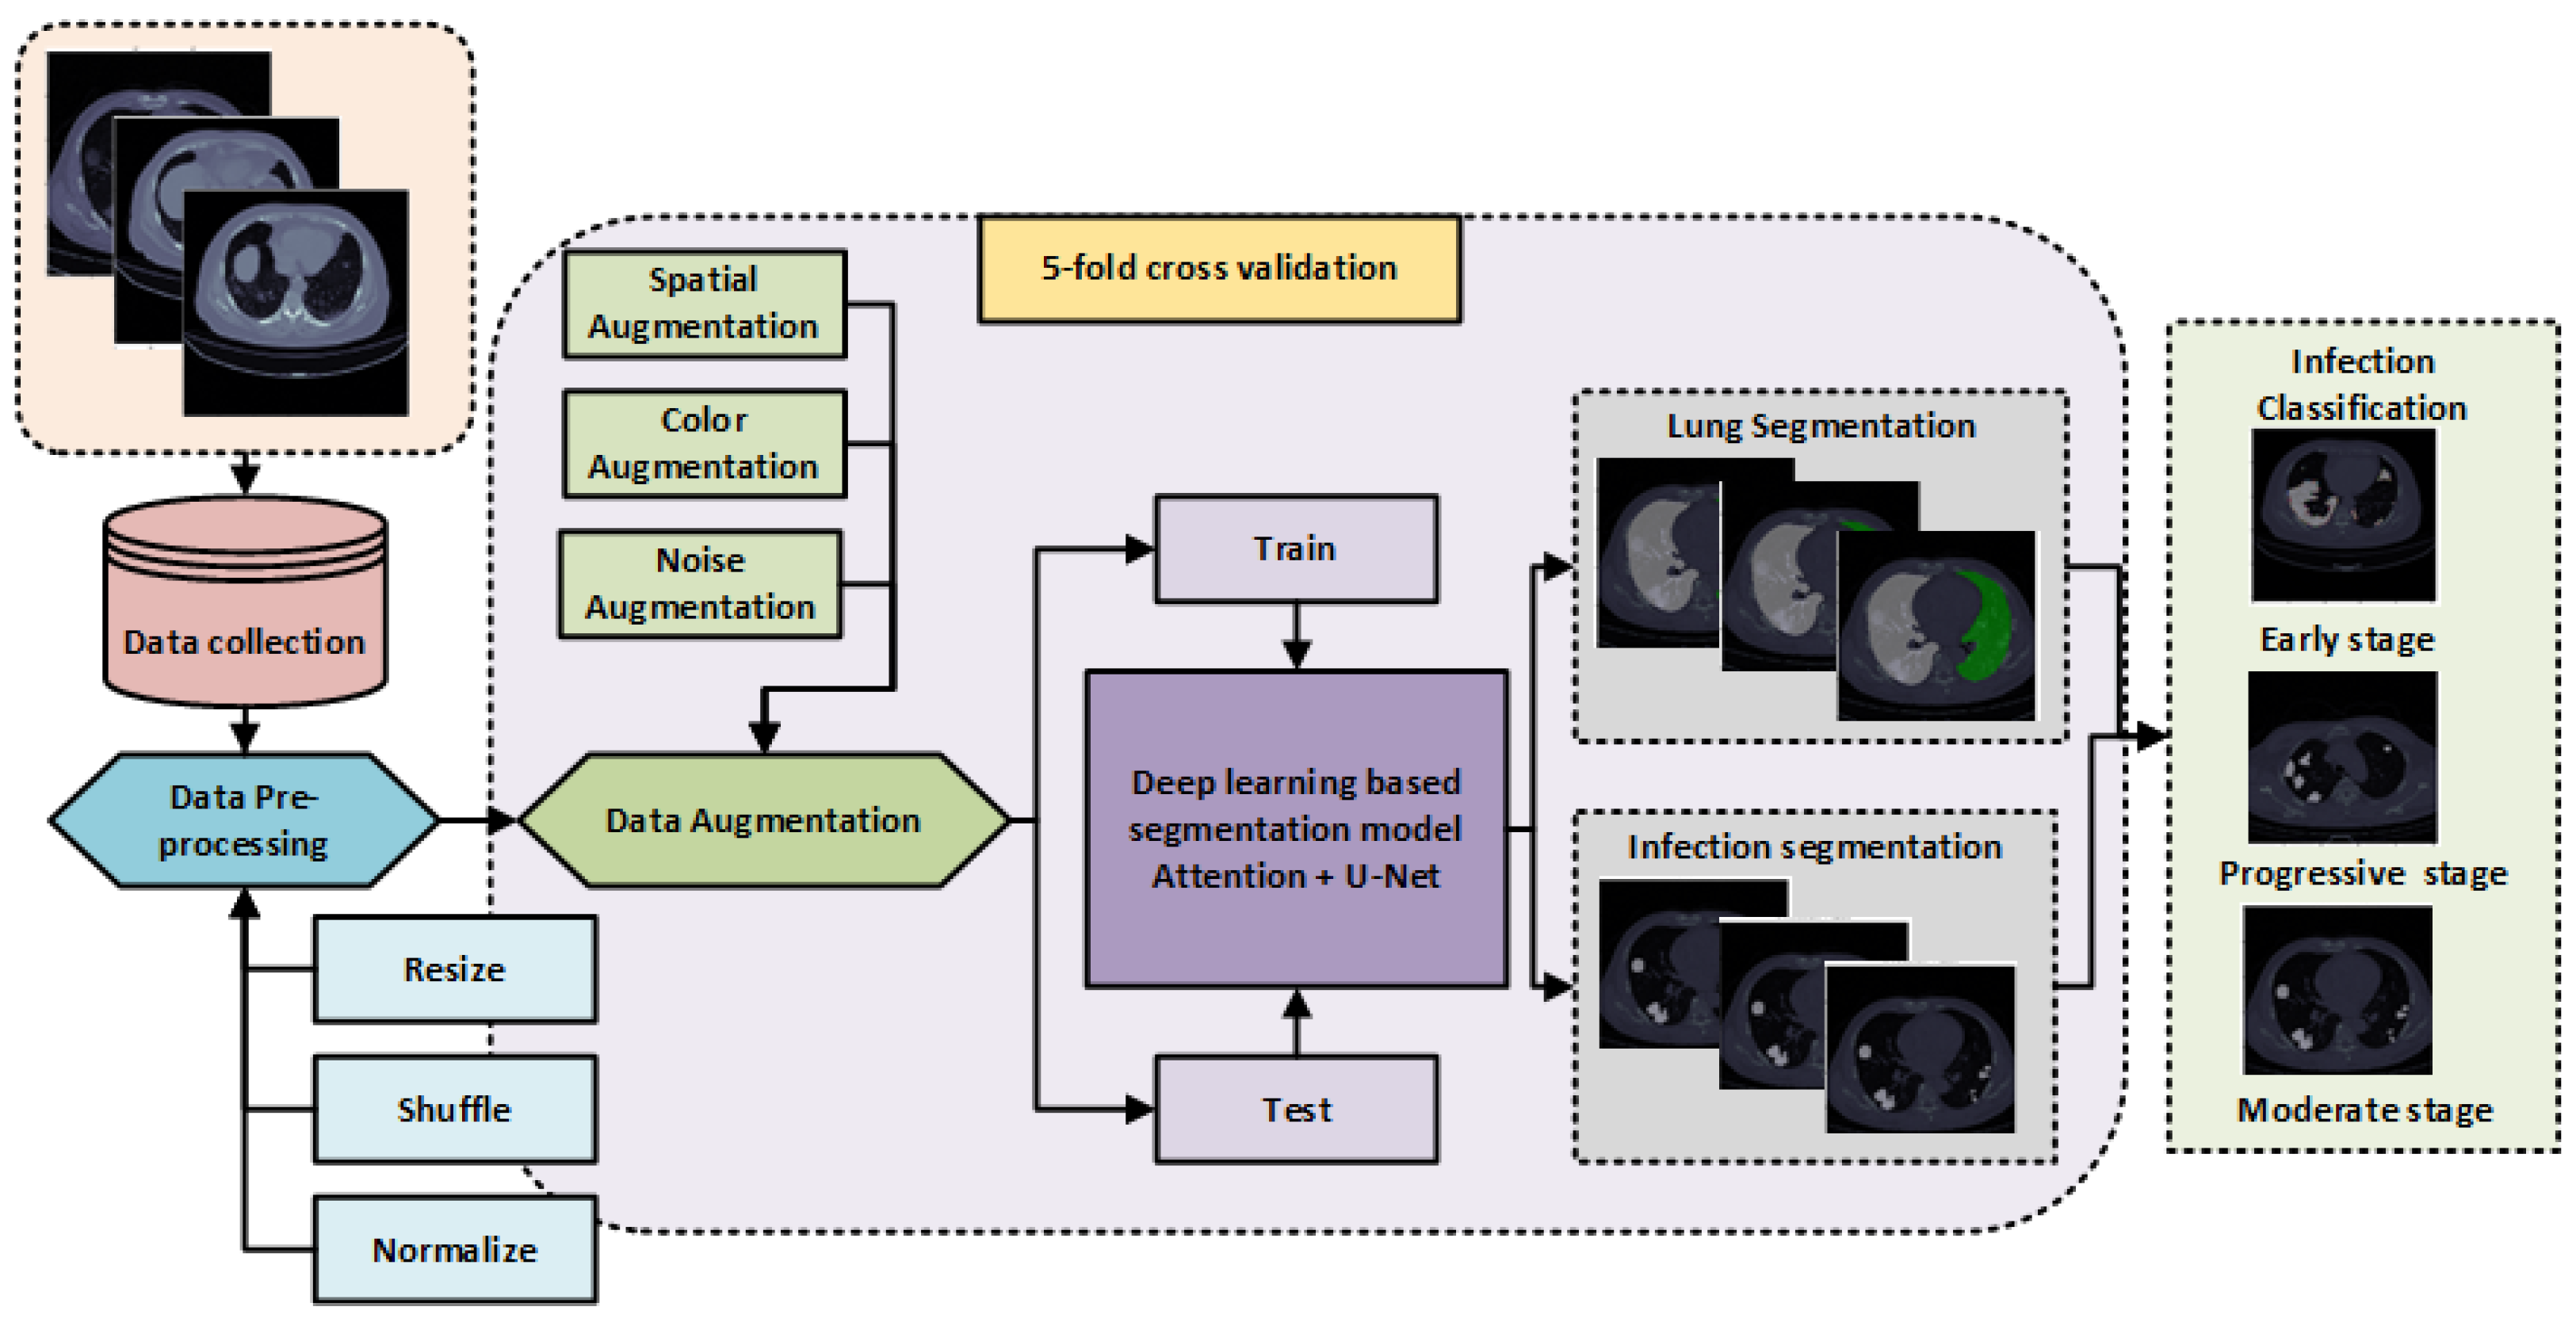
3. Methodology
3.1. Pre-Processing and Data Augmentation
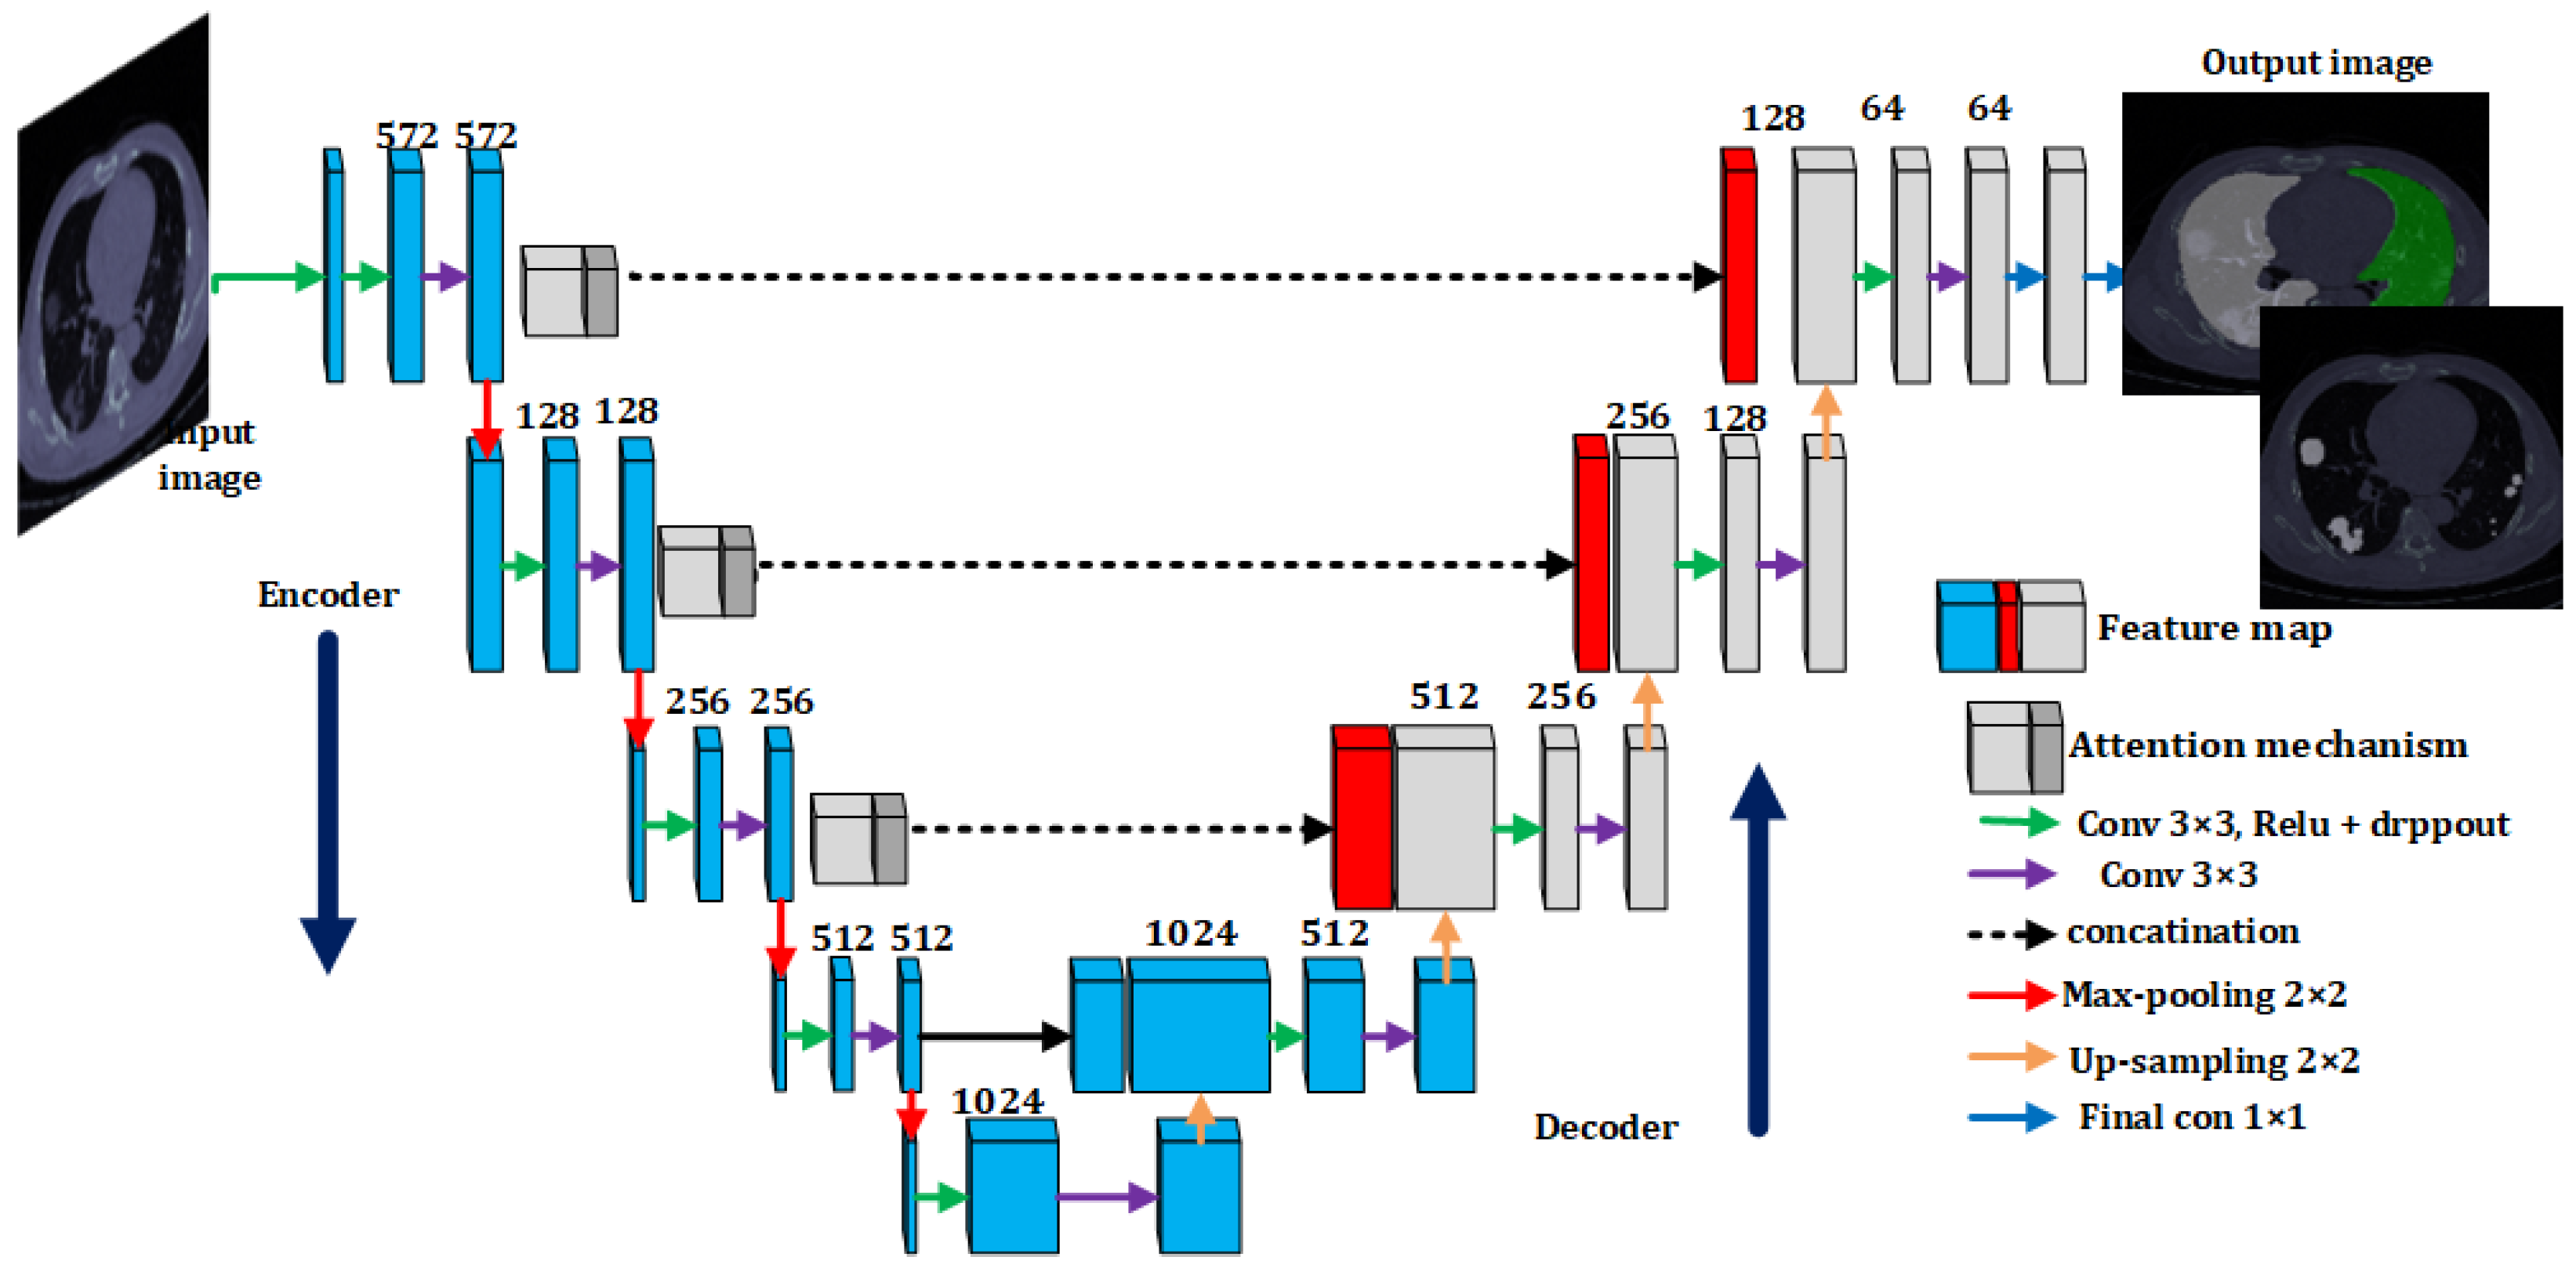
3.2. Lungs and Infection Segmentation Using U-Net with Attention Mechanism
3.3. Classification of Infection Severity
4. Experimental Results
4.1. COVID-19 CT Scan Data Set
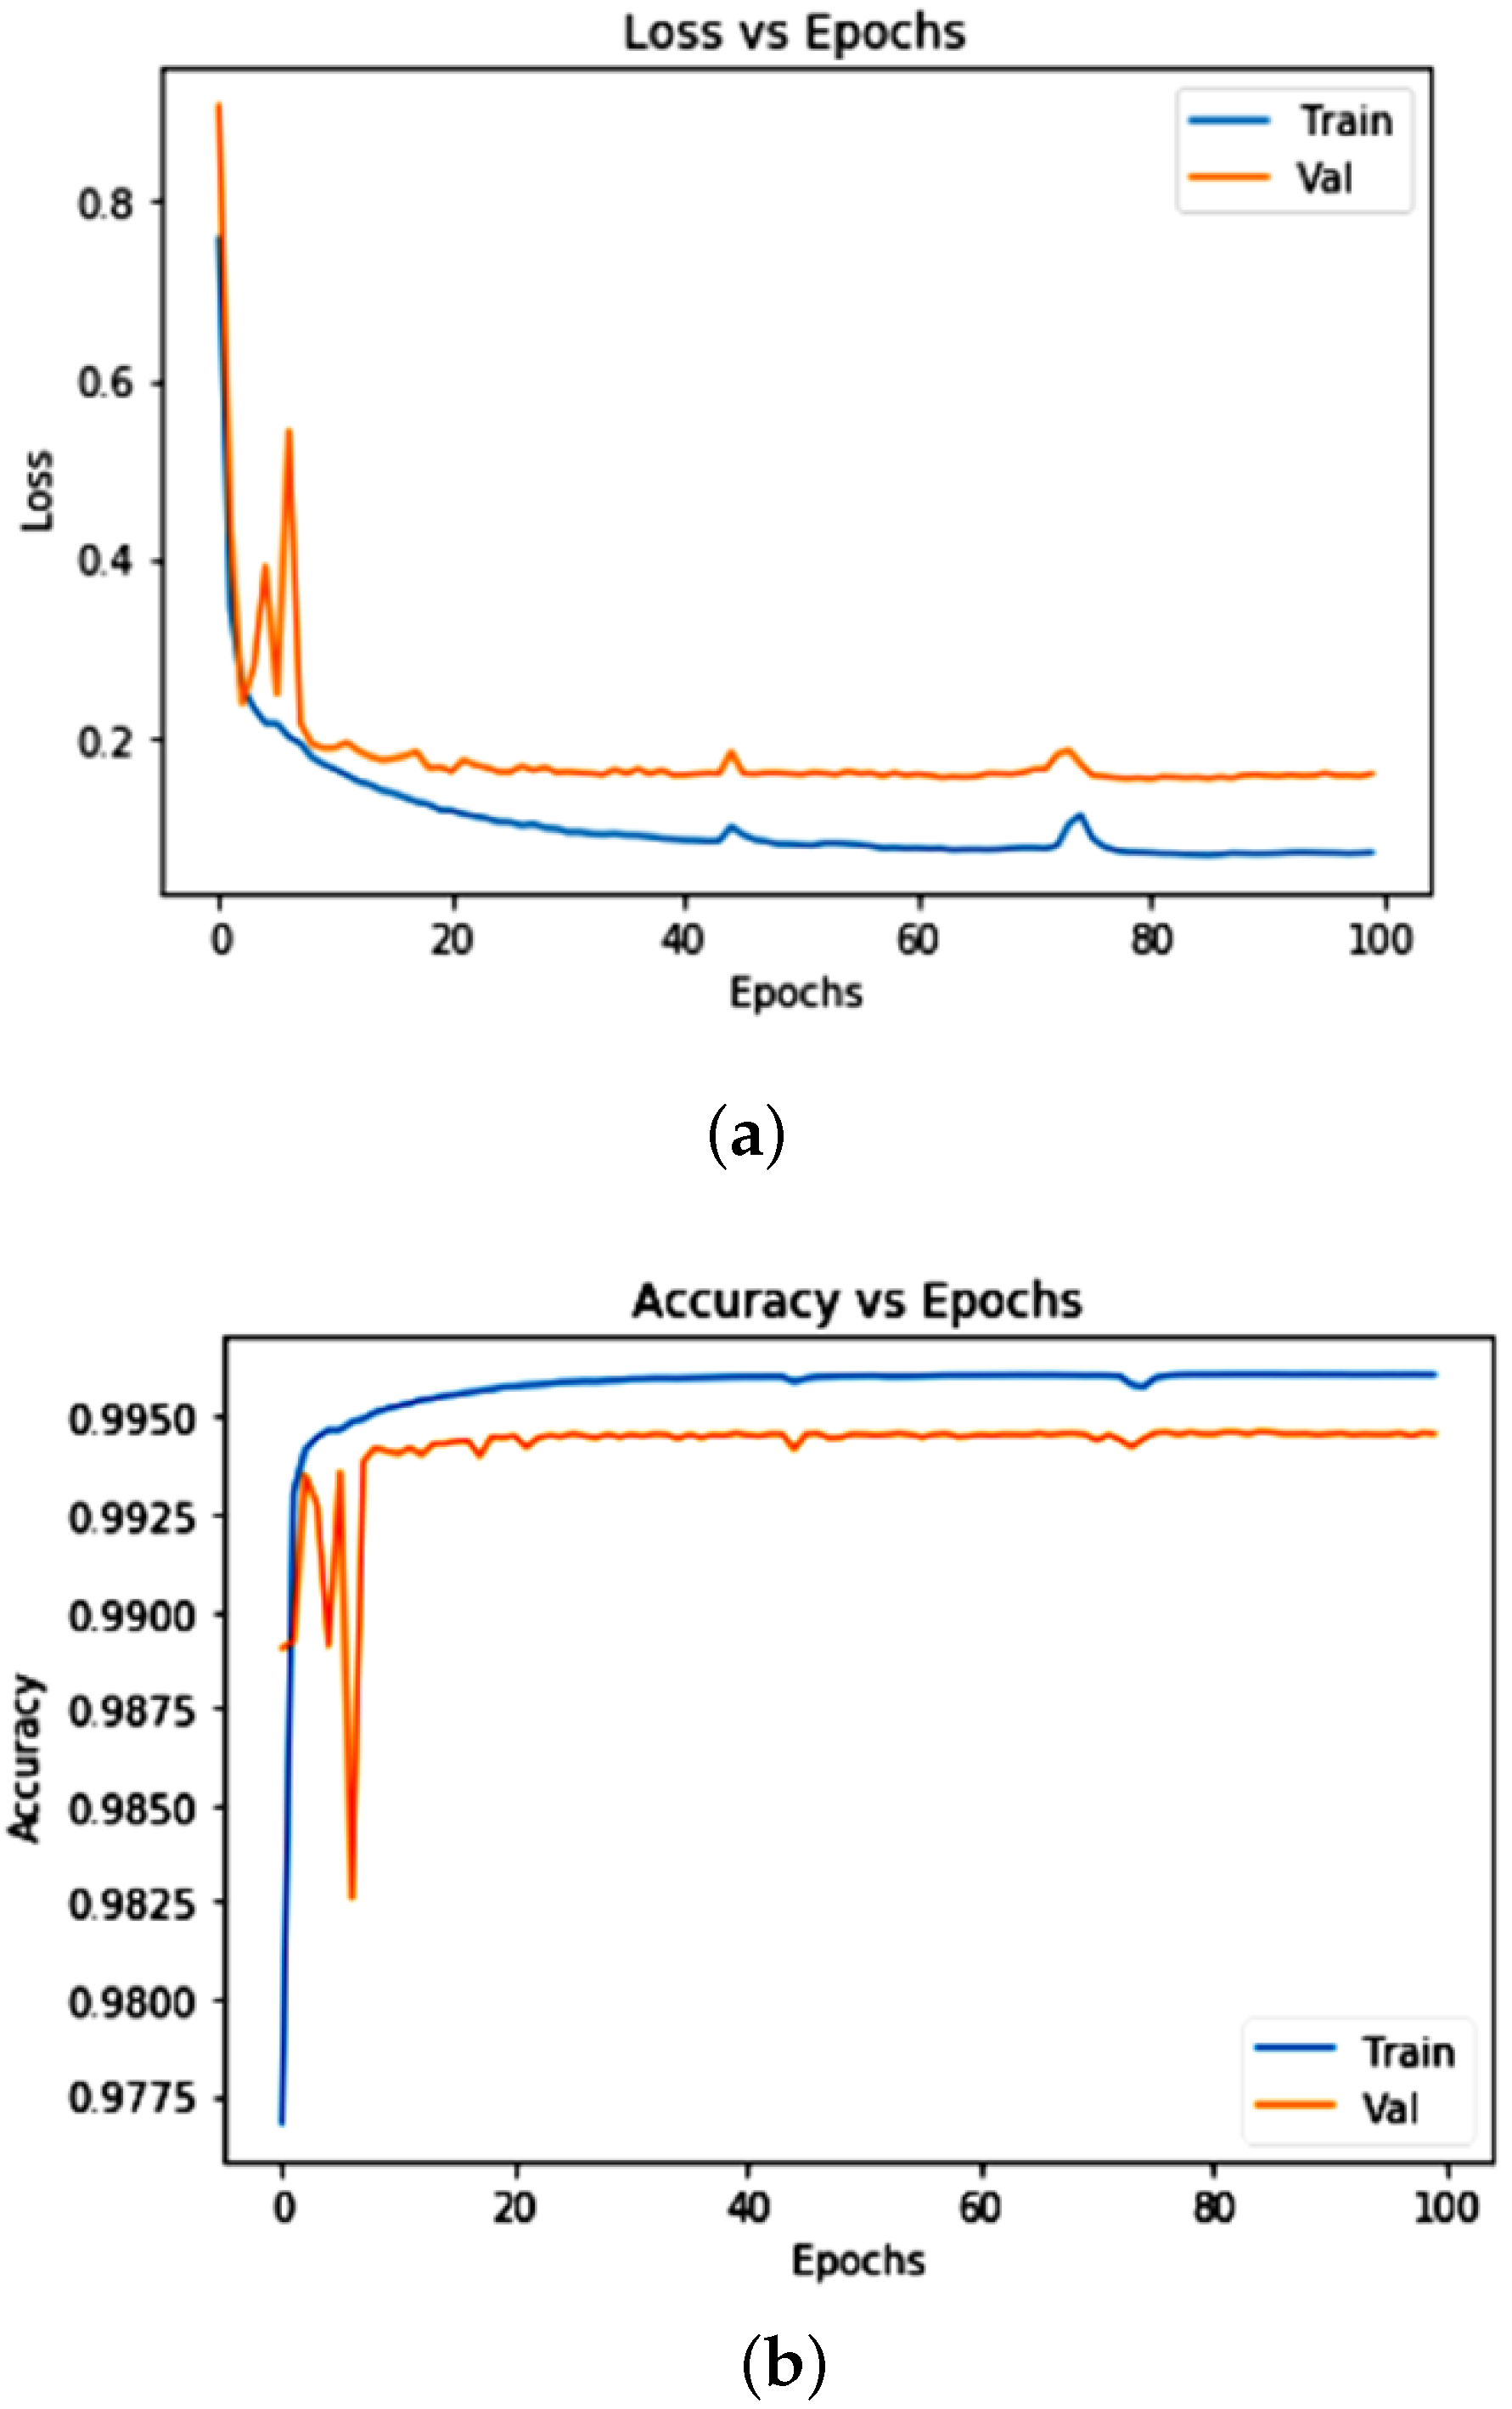
4.2. Training and Validation
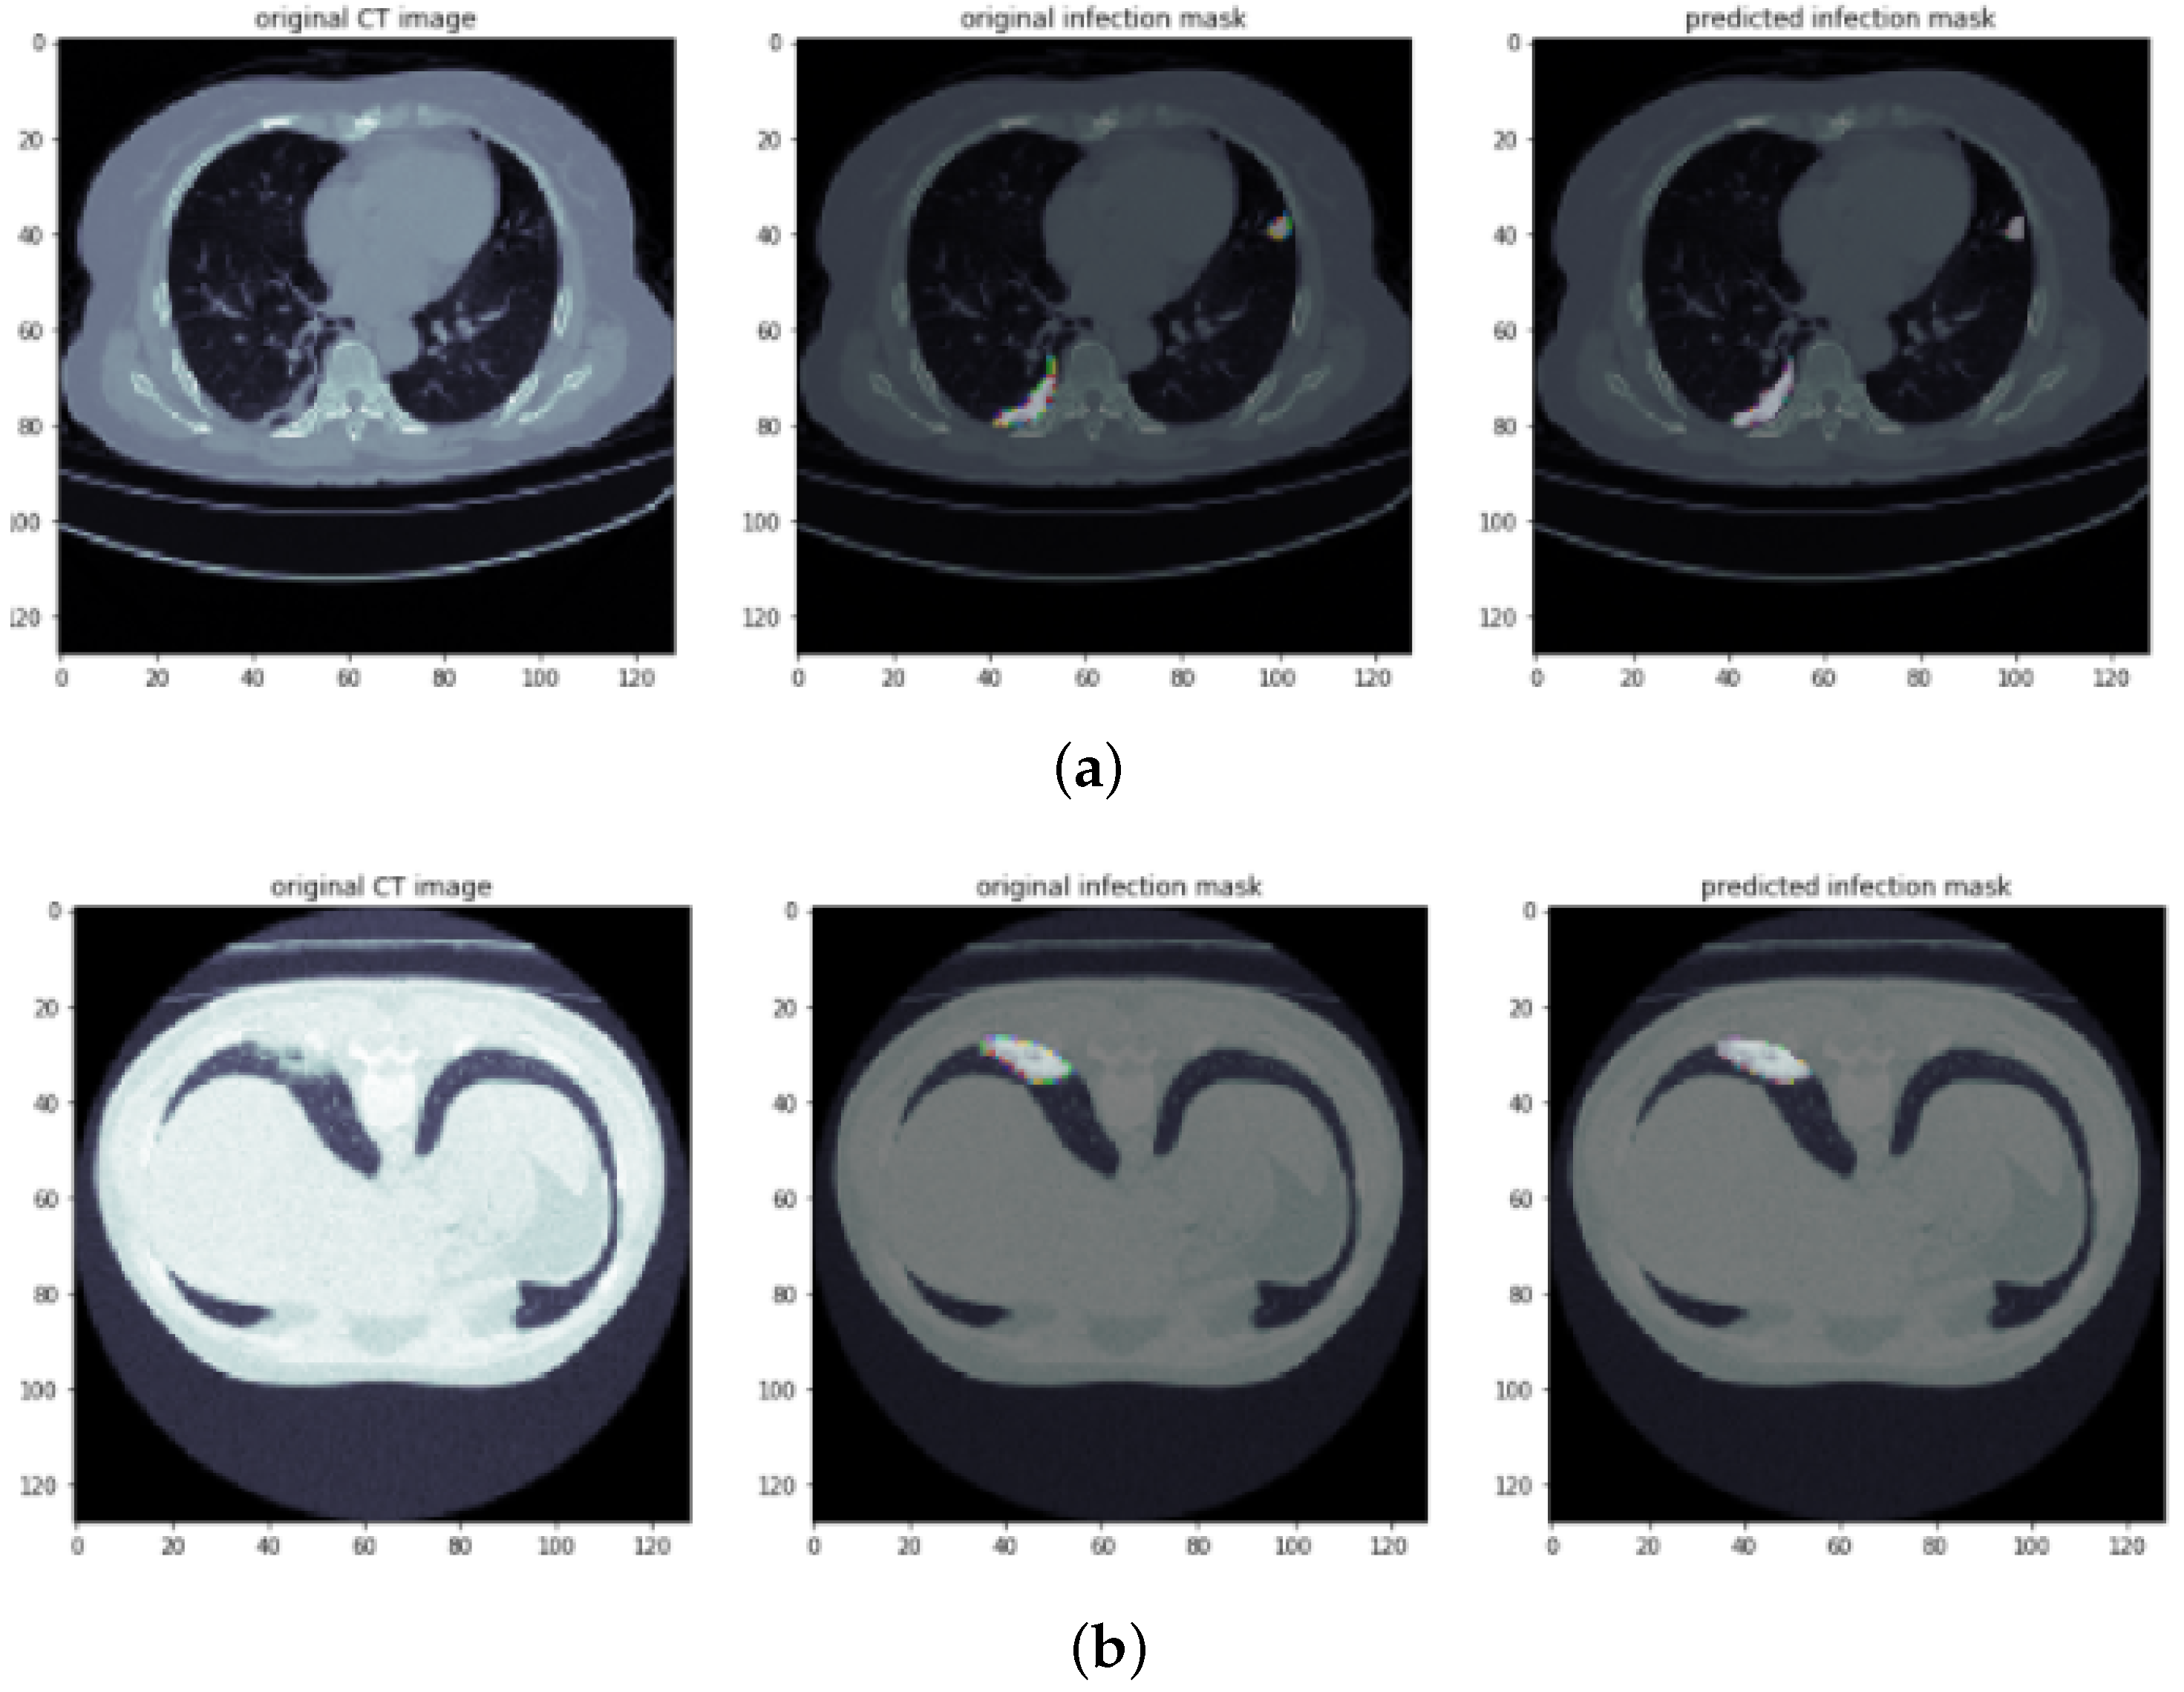
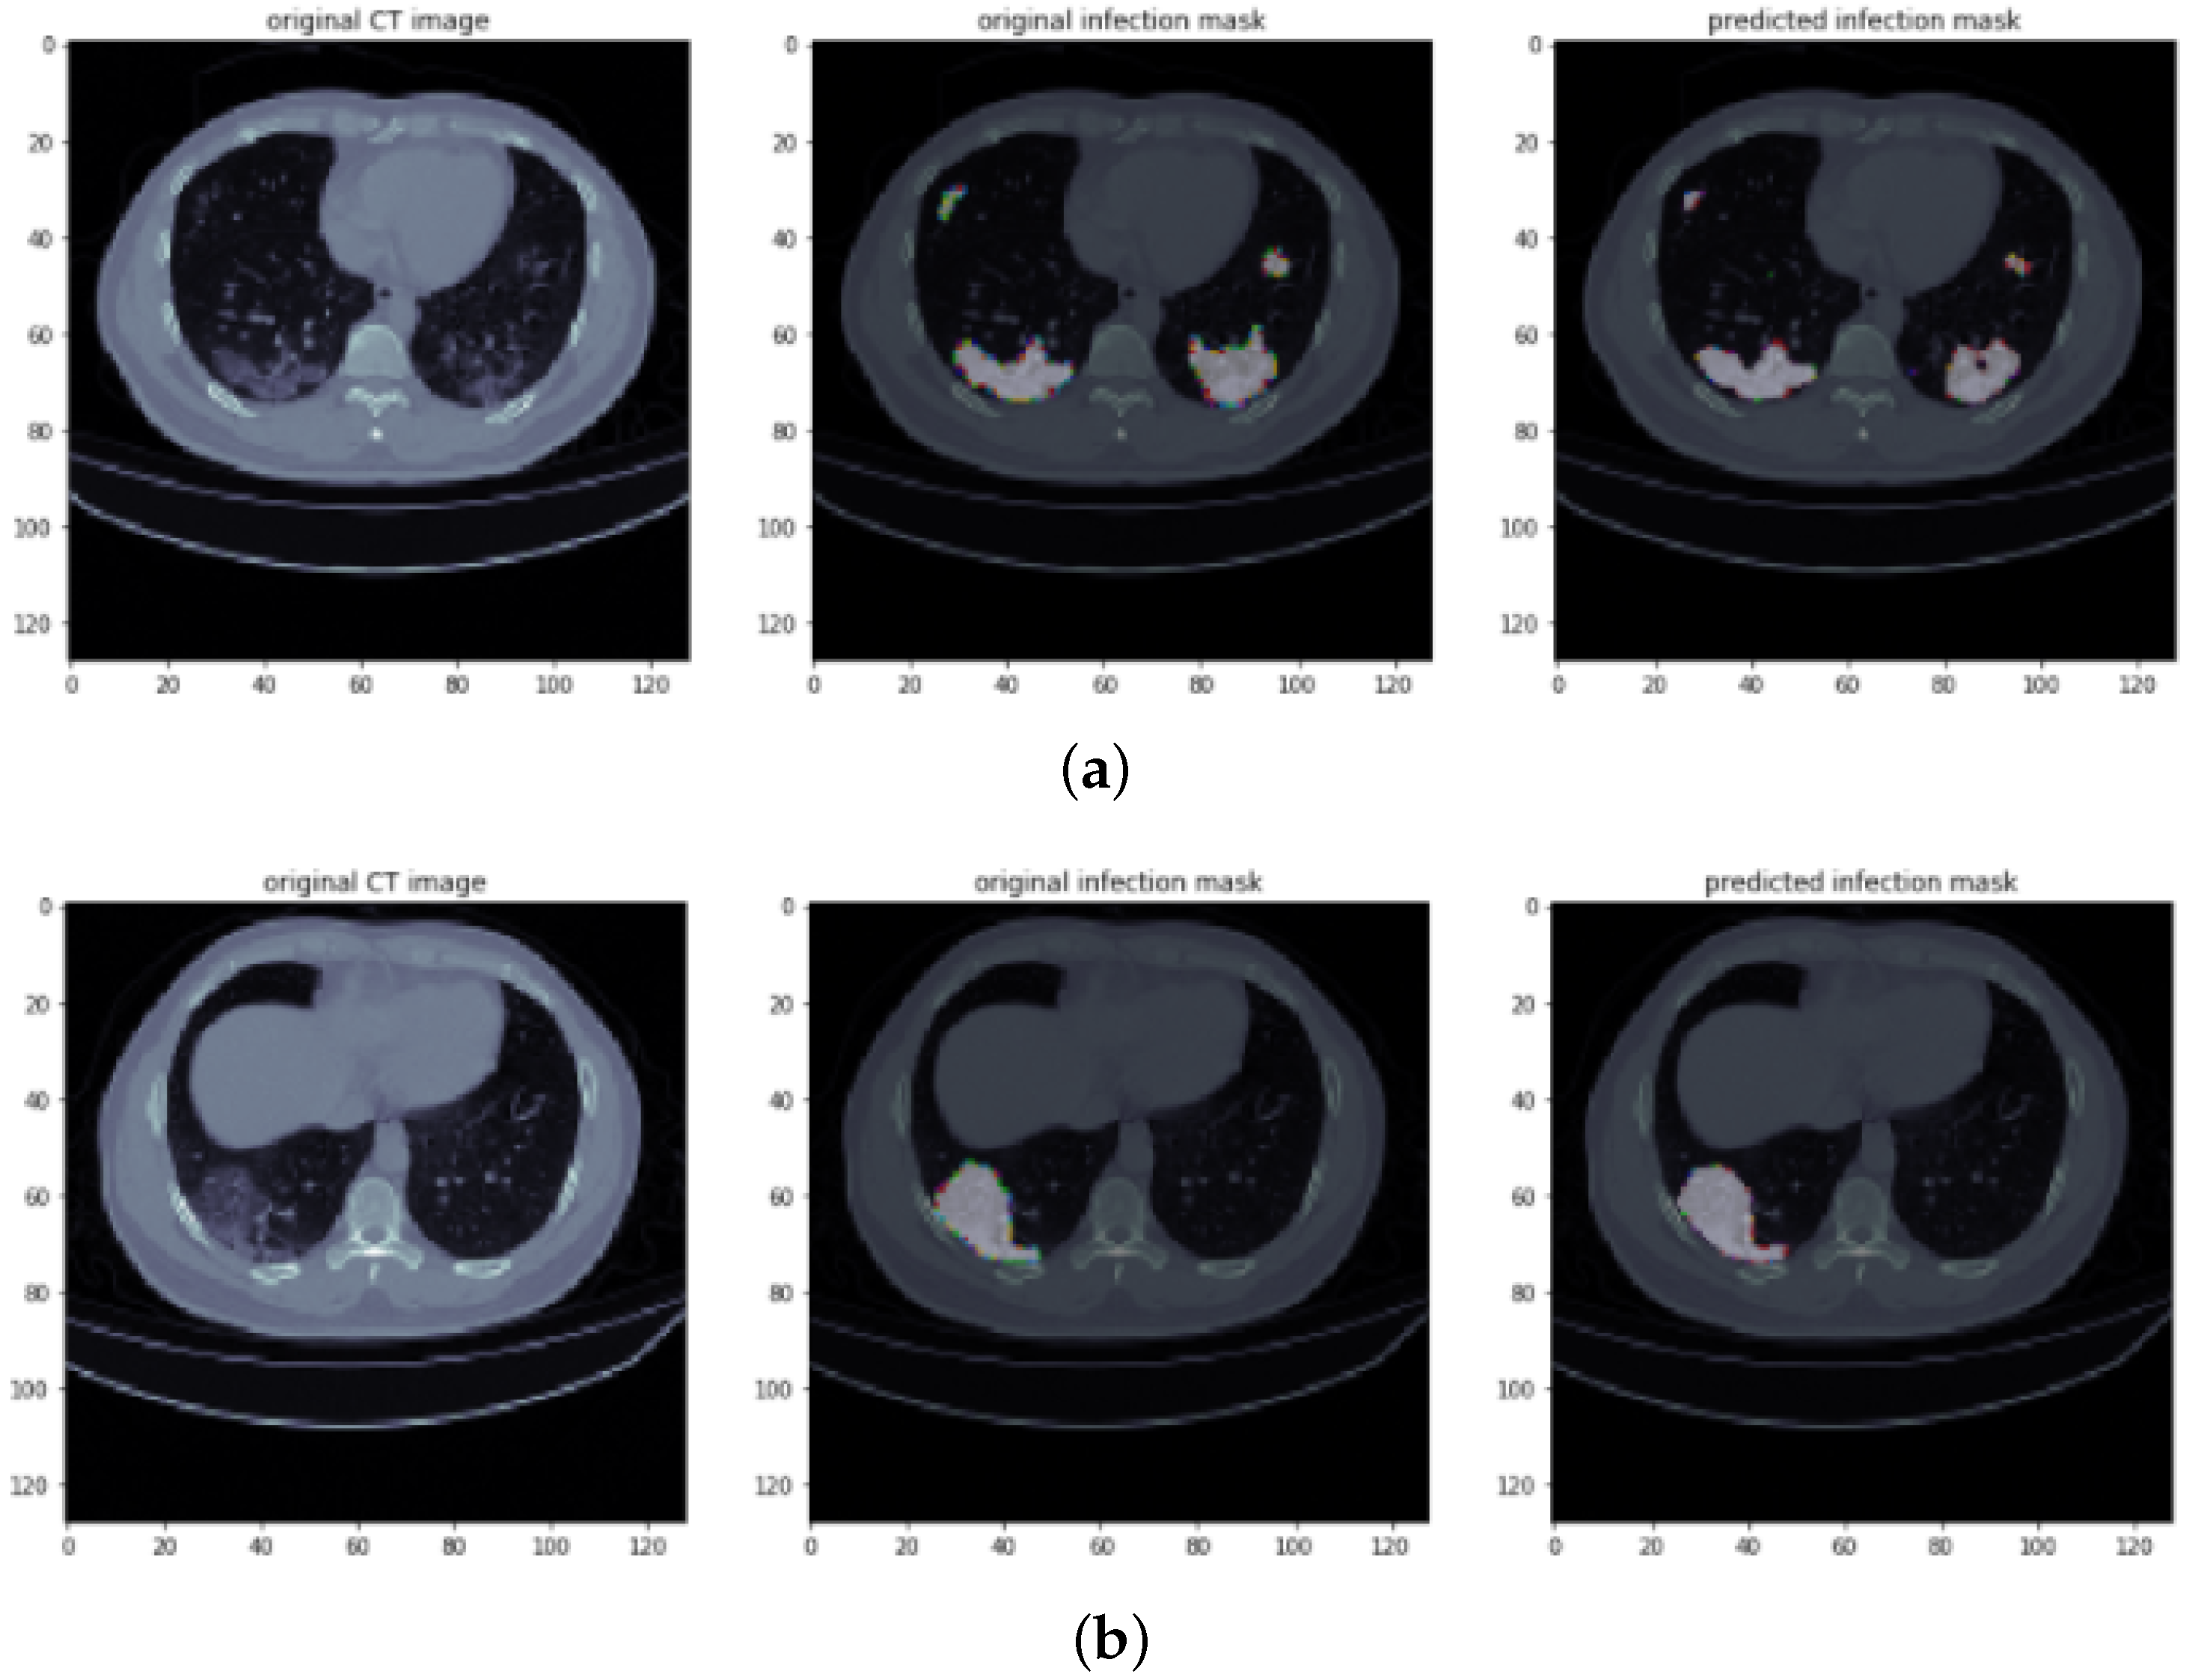
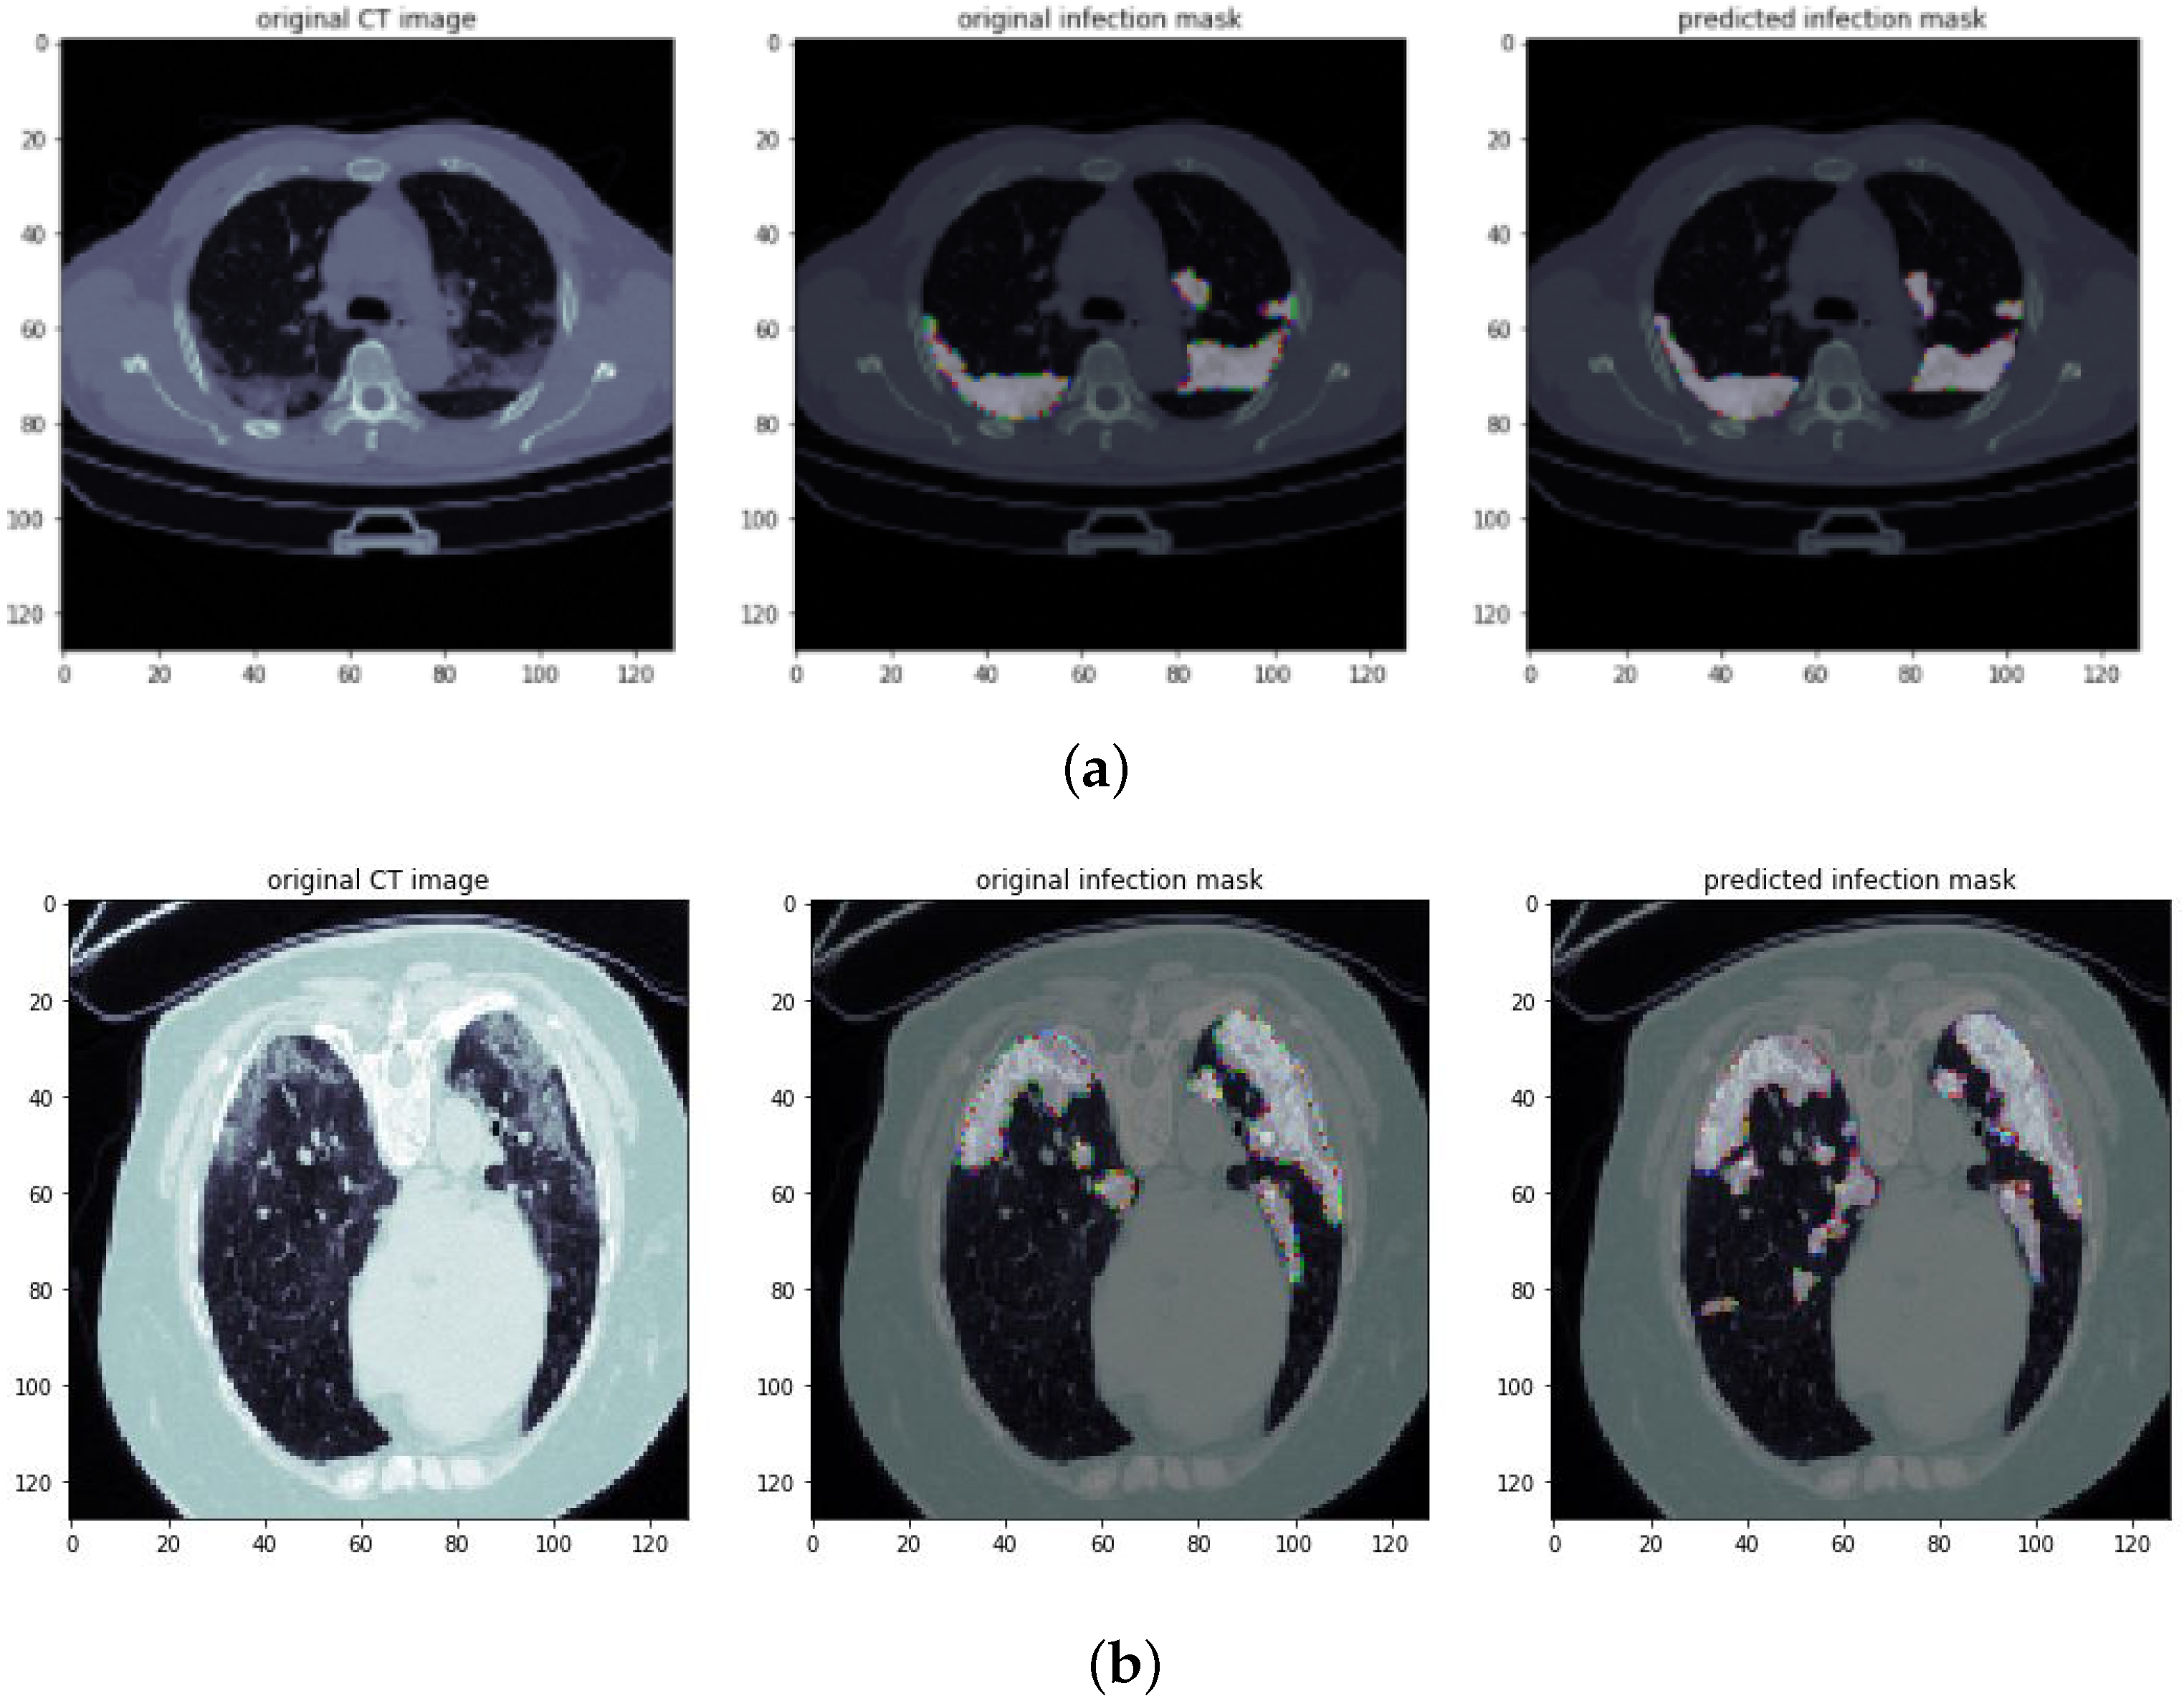
4.3. Visualization Results of Infected Region Segmentation
4.4. Evaluation and Comparison Results
5. Conclusions and Future Directions
Author Contributions
Funding
Conflicts of Interest
References
- Zhu, N.; Zhang, D.; Wang, W.; Li, X.; Yang, B.; Song, J.; Zhao, X.; Huang, B.; Shi, W.; Lu, R.; et al. A novel coronavirus from patients with pneumonia in China, 2019. N. Engl. J. Med. 2020, 382, 727–733. [Google Scholar] [CrossRef] [PubMed]
- Ahmed, I.; Ahmad, M.; Rodrigues, J.J.; Jeon, G.; Din, S. A deep learning-based social distance monitoring framework for COVID-19. Sustain. Cities Soc. 2021, 65, 102571. [Google Scholar] [CrossRef] [PubMed]
- Ahmed, I.; Ahmad, M.; Jeon, G. Social distance monitoring framework using deep learning architecture to control infection transmission of COVID-19 pandemic. Sustain. Cities Soc. 2021, 69, 102777. [Google Scholar] [CrossRef] [PubMed]
- Li, Y.; Xia, L. Coronavirus disease 2019 (COVID-19): Role of chest CT in diagnosis and management. Am. J. Roentgenol. 2020, 214, 1280–1286. [Google Scholar] [CrossRef]
- Salehi, S.; Abedi, A.; Balakrishnan, S.; Gholamrezanezhad, A. Coronavirus disease 2019 (COVID-19): A systematic review of imaging findings in 919 patients. Am. J. Roentgenol. 2020, 215, 87–93. [Google Scholar] [CrossRef]
- Wang, D.; Hu, B.; Hu, C.; Zhu, F.; Liu, X.; Zhang, J.; Wang, B.; Xiang, H.; Cheng, Z.; Xiong, Y.; et al. Clinical characteristics of 138 hospitalized patients with 2019 novel coronavirus–infected pneumonia in Wuhan, China. JAMA 2020, 323, 1061–1069. [Google Scholar] [CrossRef]
- Ng, M.Y.; Lee, E.Y.; Yang, J.; Yang, F.; Li, X.; Wang, H.; Lui, M.M.S.; Lo, C.S.Y.; Leung, B.; Khong, P.L.; et al. Imaging profile of the COVID-19 infection: Radiologic findings and literature review. Radiol. Cardiothorac. Imaging 2020, 2, e200034. [Google Scholar] [CrossRef] [Green Version]
- Ahmed, I.; Ahmad, M.; Khan, F.A.; Asif, M. Comparison of Deep-Learning-Based Segmentation Models: Using Top View Person Images. IEEE Access 2020, 8, 136361–136373. [Google Scholar] [CrossRef]
- Bizopoulos, P.; Vretos, N.; Daras, P. Comprehensive Comparison of Deep Learning Models for Lung and COVID-19 Lesion Segmentation in CT scans. arXiv 2020, arXiv:2009.06412. [Google Scholar]
- Ahmed, I.; Jeon, G.; Chehri, A.; Hassan, M.M. Adapting Gaussian YOLOv3 with transfer learning for overhead view human detection in smart cities and societies. Sustain. Cities Soc. 2021, 70, 102908. [Google Scholar] [CrossRef]
- Ahmed, I.; Jeon, G.; Piccialli, F. A Deep Learning-based Smart Healthcare System for Patient’s Discomfort Detection at the Edge of Internet of Things. IEEE Internet Things J. 2021, 8, 10318–10326. [Google Scholar] [CrossRef]
- Skourt, B.A.; El Hassani, A.; Majda, A. Lung CT image segmentation using deep neural networks. Procedia Comput. Sci. 2018, 127, 109–113. [Google Scholar] [CrossRef]
- Yan, Q.; Wang, B.; Gong, D.; Luo, C.; Zhao, W.; Shen, J.; Shi, Q.; Jin, S.; Zhang, L.; You, Z. COVID-19 chest CT image segmentation—A deep convolutional neural network solution. arXiv 2020, arXiv:2004.10987. [Google Scholar]
- Harrison, A.P.; Xu, Z.; George, K.; Lu, L.; Summers, R.M.; Mollura, D.J. Progressive and multi-path holistically nested neural networks for pathological lung segmentation from CT images. In Proceedings of the International Conference on Medical Image Computing and Computer-Assisted Intervention, Quebec City, QC, Canada, 11–13 September 2017; Springer: Berlin/Heidelberg, Germany, 2017; pp. 621–629. [Google Scholar]
- Shan, F.; Gao, Y.; Wang, J.; Shi, W.; Shi, N.; Han, M.; Xue, Z.; Shen, D.; Shi, Y. Lung infection quantification of COVID-19 in CT images with deep learning. arXiv 2020, arXiv:2003.04655. [Google Scholar]
- Long, J.; Shelhamer, E.; Darrell, T. Fully convolutional networks for semantic segmentation. In Proceedings of the IEEE Conference on Computer Vision and Pattern Recognition, Boston, MA, USA, 7–12 June 2015; pp. 3431–3440. [Google Scholar]
- Ronneberger, O.; Fischer, P.; Brox, T. U-net: Convolutional networks for biomedical image segmentation. In Proceedings of the International Conference on Medical Image Computing and Computer-Assisted Intervention, Munich, Germany, 5–9 October 2015; Springer: Berlin/Heidelberg, Germany, 2015; pp. 234–241. [Google Scholar]
- Zhou, T.; Dong, Y.; Lu, H.; Zheng, X.; Qiu, S.; Hou, S. APU-Net: An Attention Mechanism Parallel U-Net for Lung Tumor Segmentation. BioMed Res. Int. 2022, 2022, 5303651. [Google Scholar] [CrossRef]
- Ahmad, M.; Ahmed, I.; Khan, F.A.; Qayum, F.; Aljuaid, H. Convolutional neural network—Based person tracking using overhead views. Int. J. Distrib. Sens. Netw. 2020, 16, 1550147720934738. [Google Scholar] [CrossRef]
- Shi, F.; Wang, J.; Shi, J.; Wu, Z.; Wang, Q.; Tang, Z.; He, K.; Shi, Y.; Shen, D. Review of artificial intelligence techniques in imaging data acquisition, segmentation and diagnosis for COVID-19. IEEE Rev. Biomed. Eng. 2020, 14, 4–15. [Google Scholar] [CrossRef] [Green Version]
- Wynants, L.; Van Calster, B.; Bonten, M.M.; Collins, G.S.; Debray, T.P.; De Vos, M.; Haller, M.C.; Heinze, G.; Moons, K.G.; Riley, R.D.; et al. Prediction models for diagnosis and prognosis of COVID-19 infection: Systematic review and critical appraisal. BMJ 2020, 369, m1328. [Google Scholar] [CrossRef] [Green Version]
- Ahmad, M.; Ahmed, I.; Jeon, G. An IoT-enabled real-time overhead view person detection system based on Cascade-RCNN and transfer learning. J. Real-Time Image Process. 2021, 18, 1129–1139. [Google Scholar] [CrossRef]
- Shah, F.M.; Joy, S.K.S.; Ahmed, F.; Humaira, M.; Ami, A.S.; Paul, S.; Jim, A.R.K.; Hossain, T.; Ahmed, S. A Comprehensive Survey of COVID-19 Detection Using Medical Images. SN Comput. Sci. 2020, 2, 434. [Google Scholar] [CrossRef]
- Wu, J.; Zhou, S.; Zuo, S.; Chen, Y.; Sun, W.; Luo, J.; Duan, J.; Wang, H.; Wang, D. U-Net combined with multi-scale attention mechanism for liver segmentation in CT images. BMC Med. Inform. Decis. Mak. 2021, 21, 283. [Google Scholar] [CrossRef] [PubMed]
- Ahmed, I.; Din, S.; Jeon, G.; Piccialli, F. Exploring deep learning models for overhead view multiple object detection. IEEE Internet Things J. 2019, 7, 5737–5744. [Google Scholar] [CrossRef]
- Wang, S.; Kang, B.; Ma, J.; Zeng, X.; Xiao, M.; Guo, J.; Cai, M.; Yang, J.; Li, Y.; Meng, X.; et al. A deep learning algorithm using CT images to screen for Corona Virus Disease (COVID-19). Eur. Radiol. 2021, 31, 6096–6104. [Google Scholar] [CrossRef] [PubMed]
- Hassanien, A.E.; Mahdy, L.N.; Ezzat, K.A.; Elmousalami, H.H.; Ella, H.A. Automatic X-ray COVID-19 lung image classification system based on multi-level thresholding and support vector machine. medRxiv 2020. [Google Scholar] [CrossRef]
- Kadry, S.; Rajinikanth, V.; Rho, S.; Raja, N.S.M.; Rao, V.S.; Thanaraj, K.P. Development of a Machine-Learning System to Classify Lung CT Scan Images into Normal/COVID-19 Class. arXiv 2020, arXiv:2004.13122. [Google Scholar]
- Hemdan, E.E.D.; Shouman, M.A.; Karar, M.E. Covidx-net: A framework of deep learning classifiers to diagnose COVID-19 in X-ray images. arXiv 2020, arXiv:2003.11055. [Google Scholar]
- Wang, L.; Wong, A. COVID-Net: A Tailored Deep Convolutional Neural Network Design for Detection of COVID-19 Cases from Chest X-ray Images. arXiv 2020, arXiv:2003.09871. [Google Scholar] [CrossRef]
- Pathak, Y.; Shukla, P.K.; Tiwari, A.; Stalin, S.; Singh, S. Deep transfer learning based classification model for COVID-19 disease. IRBM 2020, 43, 87–92. [Google Scholar] [CrossRef]
- Farooq, M.; Hafeez, A. COVID-resnet: A deep learning framework for screening of COVID-19 from radiographs. arXiv 2020, arXiv:2003.14395. [Google Scholar]
- Singh, D.; Kumar, V.; Kaur, M. Classification of COVID-19 patients from chest CT images using multi-objective differential evolution–based convolutional neural networks. Eur. J. Clin. Microbiol. Infect. Dis. 2020, 39, 1379–1389. [Google Scholar] [CrossRef]
- Hossain, M.S.; Muhammad, G.; Guizani, N. Explainable AI and mass surveillance system-based healthcare framework to combat COVID-I9 like pandemics. IEEE Netw. 2020, 34, 126–132. [Google Scholar] [CrossRef]
- Muhammad, G.; Hossain, M.S. COVID-19 and non-COVID-19 classification using multi-layers fusion from lung ultrasound images. Inf. Fusion 2021, 72, 80–88. [Google Scholar] [CrossRef] [PubMed]
- Shorfuzzaman, M.; Hossain, M.S. MetaCOVID: A Siamese neural network framework with contrastive loss for n-shot diagnosis of COVID-19 patients. Pattern Recognit. 2021, 113, 107700. [Google Scholar] [CrossRef] [PubMed]
- Apostolopoulos, I.D.; Mpesiana, T.A. COVID-19: Automatic detection from X-ray images utilizing transfer learning with convolutional neural networks. Phys. Eng. Sci. Med. 2020, 43, 635–640. [Google Scholar] [CrossRef] [Green Version]
- Pereira, R.M.; Bertolini, D.; Teixeira, L.O.; Silla, C.N., Jr.; Costa, Y.M. COVID-19 identification in chest X-ray images on flat and hierarchical classification scenarios. Comput. Methods Programs Biomed. 2020, 194, 105532. [Google Scholar] [CrossRef] [PubMed]
- Ahmed, I.; Ahmad, A.; Jeon, G. An IoT based deep learning framework for early assessment of COVID-19. IEEE Internet Things J. 2020, 8, 15855–15862. [Google Scholar] [CrossRef]
- Saeedi, A.; Saeedi, M.; Maghsoudi, A. A novel and reliable deep learning web-based tool to detect COVID-19 infection from chest ct-scan. arXiv 2020, arXiv:2006.14419. [Google Scholar]
- Mobiny, A.; Cicalese, P.A.; Zare, S.; Yuan, P.; Abavisani, M.; Wu, C.C.; Ahuja, J.; de Groot, P.M.; Van Nguyen, H. Radiologist-level COVID-19 detection using ct scans with detail-oriented capsule networks. arXiv 2020, arXiv:2004.07407. [Google Scholar]
- He, K.; Zhang, X.; Ren, S.; Sun, J. Deep residual learning for image recognition. In Proceedings of the IEEE Conference on Computer Vision and Pattern Recognition, Las Vegas, NV, USA, 27–30 June 2016; pp. 770–778. [Google Scholar]
- Song, Y.; Zheng, S.; Li, L.; Zhang, X.; Zhang, X.; Huang, Z.; Chen, J.; Wang, R.; Zhao, H.; Zha, Y.; et al. Deep learning enables accurate diagnosis of novel coronavirus (COVID-19) with CT images. IEEE/ACM Trans. Comput. Biol. Bioinform. 2021, 18, 2775–2780. [Google Scholar] [CrossRef]
- Zheng, C.; Deng, X.; Fu, Q.; Zhou, Q.; Feng, J.; Ma, H.; Liu, W.; Wang, X. Deep learning-based detection for COVID-19 from chest CT using weak label. medRxiv 2020. [Google Scholar] [CrossRef] [Green Version]
- Gozes, O.; Frid-Adar, M.; Greenspan, H.; Browning, P.D.; Zhang, H.; Ji, W.; Bernheim, A.; Siegel, E. Rapid ai development cycle for the coronavirus (COVID-19) pandemic: Initial results for automated detection & patient monitoring using deep learning ct image analysis. arXiv 2020, arXiv:2003.05037. [Google Scholar]
- Jin, D.; Xu, Z.; Tang, Y.; Harrison, A.P.; Mollura, D.J. CT-realistic lung nodule simulation from 3D conditional generative adversarial networks for robust lung segmentation. In Proceedings of the International Conference on Medical Image Computing and Computer-Assisted Intervention, Granada, Spain, 16–20 September 2018; Springer: Berlin/Heidelberg, Germany, 2018; pp. 732–740. [Google Scholar]
- Jiang, J.; Hu, Y.C.; Liu, C.J.; Halpenny, D.; Hellmann, M.D.; Deasy, J.O.; Mageras, G.; Veeraraghavan, H. Multiple resolution residually connected feature streams for automatic lung tumor segmentation from CT images. IEEE Trans. Med. Imaging 2018, 38, 134–144. [Google Scholar] [CrossRef]
- Wu, Y.H.; Gao, S.H.; Mei, J.; Xu, J.; Fan, D.P.; Zhang, R.G.; Cheng, M.M. Jcs: An explainable COVID-19 diagnosis system by joint classification and segmentation. IEEE Trans. Image Process. 2021, 30, 3113–3126. [Google Scholar] [CrossRef] [PubMed]
- Diniz, J.O.; Quintanilha, D.B.; Neto, A.C.S.; da Silva, G.L.; Ferreira, J.L.; Netto, S.M.; Araújo, J.D.; Da Cruz, L.B.; Silva, T.F.; Martins, C.M.d.S.; et al. Segmentation and quantification of COVID-19 infections in CT using pulmonary vessels extraction and deep learning. Multimed. Tools Appl. 2021, 80, 29367–29399. [Google Scholar] [CrossRef] [PubMed]
- Qiu, Y.; Liu, Y.; Li, S.; Xu, J. Miniseg: An extremely minimum network for efficient COVID-19 segmentation. arXiv 2020, arXiv:2004.09750. [Google Scholar]
- Müller, D.; Rey, I.S.; Kramer, F. Automated chest ct image segmentation of COVID-19 lung infection based on 3d u-net. arXiv 2020, arXiv:2007.04774. [Google Scholar]
- Narin, A.; Kaya, C.; Pamuk, Z. Automatic detection of coronavirus disease (COVID-19) using X-ray images and deep convolutional neural networks. Pattern Anal. Appl. 2021, 24, 1207–1220. [Google Scholar] [CrossRef]
- Fan, D.P.; Zhou, T.; Ji, G.P.; Zhou, Y.; Chen, G.; Fu, H.; Shen, J.; Shao, L. Inf-net: Automatic COVID-19 lung infection segmentation from ct images. IEEE Trans. Med. Imaging 2020, 39, 2626–2637. [Google Scholar] [CrossRef]
- Ahmed, I.; Jeon, G.; Chehri, A. An IoT-enabled smart health care system for screening of COVID-19 with multi layers features fusion and selection. Computing 2022, 1–18. [Google Scholar] [CrossRef]
- Zhou, T.; Canu, S.; Ruan, S. Automatic COVID-19 CT segmentation using U-Net integrated spatial and channel attention mechanism. Int. J. Imaging Syst. Technol. 2021, 31, 16–27. [Google Scholar] [CrossRef]
- Yang, J.; Qiu, K. An improved segmentation algorithm of CT image baseMDPIU-Net network and attention mechanism. Multimed. Tools Appl. 2021, 1–24. [Google Scholar] [CrossRef]
- Oktay, O.; Schlemper, J.; Folgoc, L.L.; Lee, M.; Heinrich, M.; Misawa, K.; Mori, K.; McDonagh, S.; Hammerla, N.Y.; Kainz, B.; et al. Attention u-net: Learning where to look for the pancreas. arXiv 2018, arXiv:1804.03999. [Google Scholar]
- Kervadec, H.; Bouchtiba, J.; Desrosiers, C.; Granger, E.; Dolz, J.; Ayed, I.B. Boundary loss for highly unbalanced segmentation. In Proceedings of the International Conference on Medical Imaging with Deep Learning, PMLR, London, UK, 8–10 July 2019; pp. 285–296. [Google Scholar]
- Virtanen, P.; Gommers, R.; Oliphant, T.E.; Haberland, M.; Reddy, T.; Cournapeau, D.; Burovski, E.; Peterson, P.; Weckesser, W.; Bright, J.; et al. SciPy 1.0: Fundamental algorithms for scientific computing in Python. Nat. Methods 2020, 17, 261–272. [Google Scholar] [CrossRef] [Green Version]
- Schlemper, J.; Oktay, O.; Schaap, M.; Heinrich, M.; Kainz, B.; Glocker, B.; Rueckert, D. Attention gated networks: Learning to leverage salient regions in medical images. Med Image Anal. 2019, 53, 197–207. [Google Scholar] [CrossRef] [PubMed]
- Zhou, Z.; Rahman Siddiquee, M.M.; Tajbakhsh, N.; Liang, J. Unet++: A nested u-net architecture for medical image segmentation. In Deep Learning in Medical Image Analysis and Multimodal Learning for Clinical Decision Support; Springer: Berlin/Heidelberg, Germany, 2018; pp. 3–11. [Google Scholar]
- Yin, S.; Deng, H.; Xu, Z.; Zhu, Q.; Cheng, J. SD-UNet: A Novel Segmentation Framework for CT Images of Lung Infections. Electronics 2022, 11, 130. [Google Scholar] [CrossRef]


| S.No | Images | COVID-19 | Non-COVID-19 | Total |
|---|---|---|---|---|
| 1 | Training Slices | 800 | 1000 | 1800 |
| 2 | Testing Slices | 200 | 1200 | 1400 |
| 3 | Total | 1000 | 2200 | 3200 |
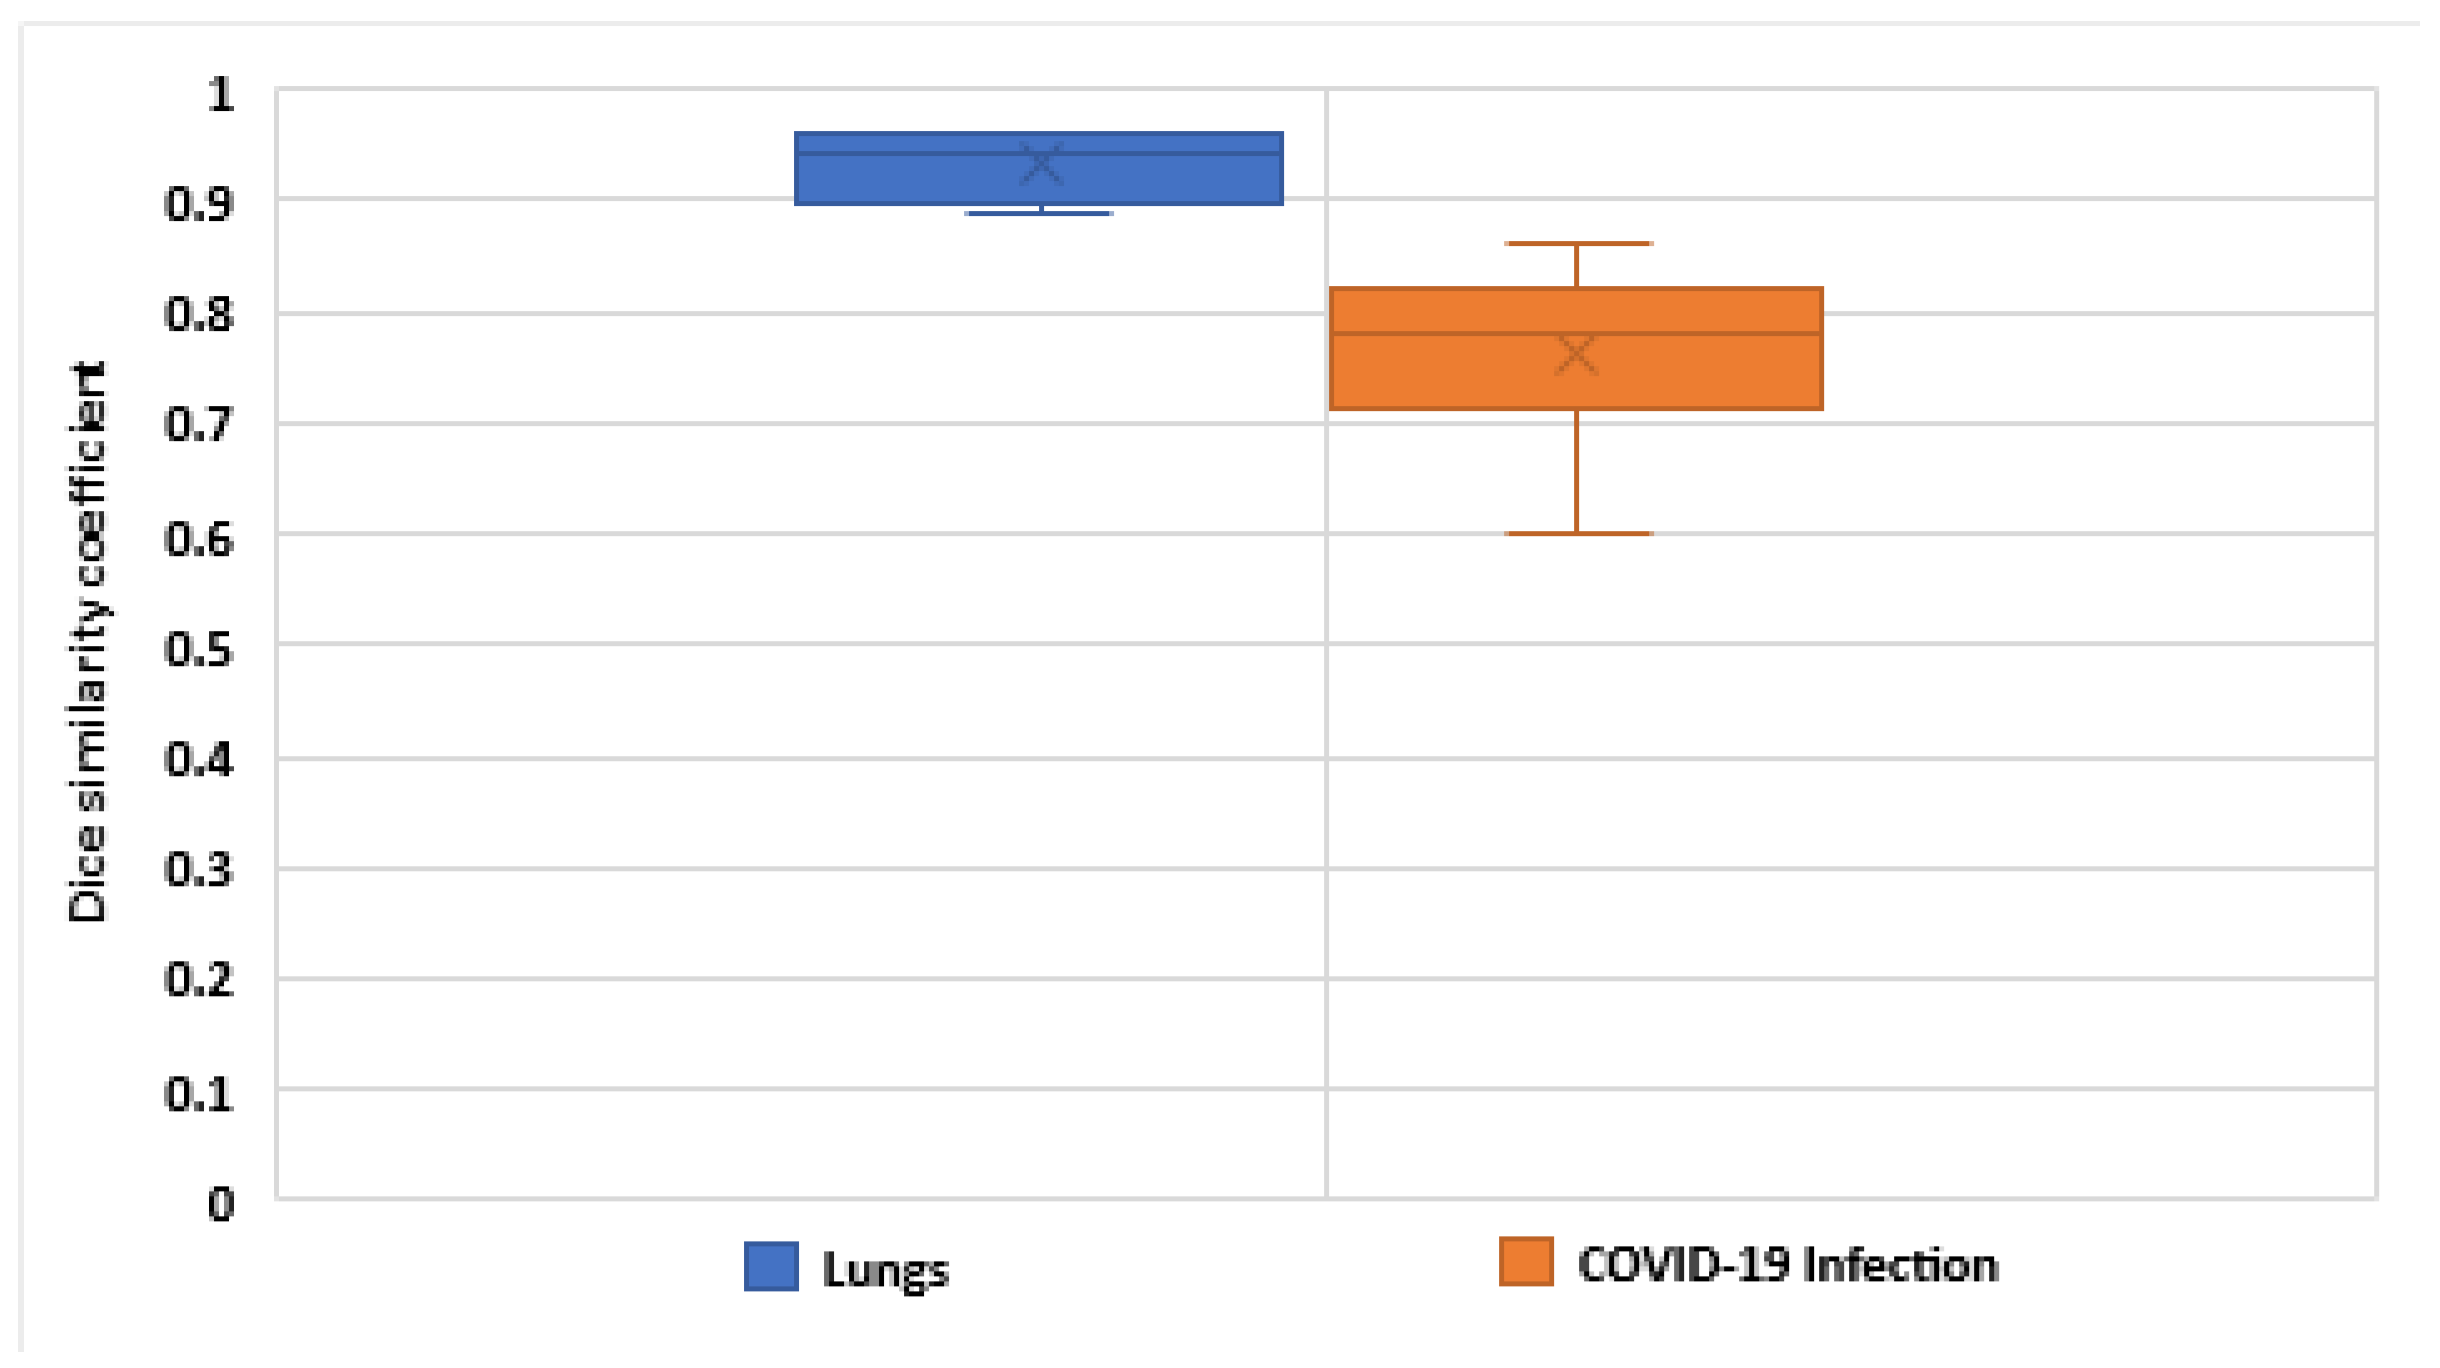
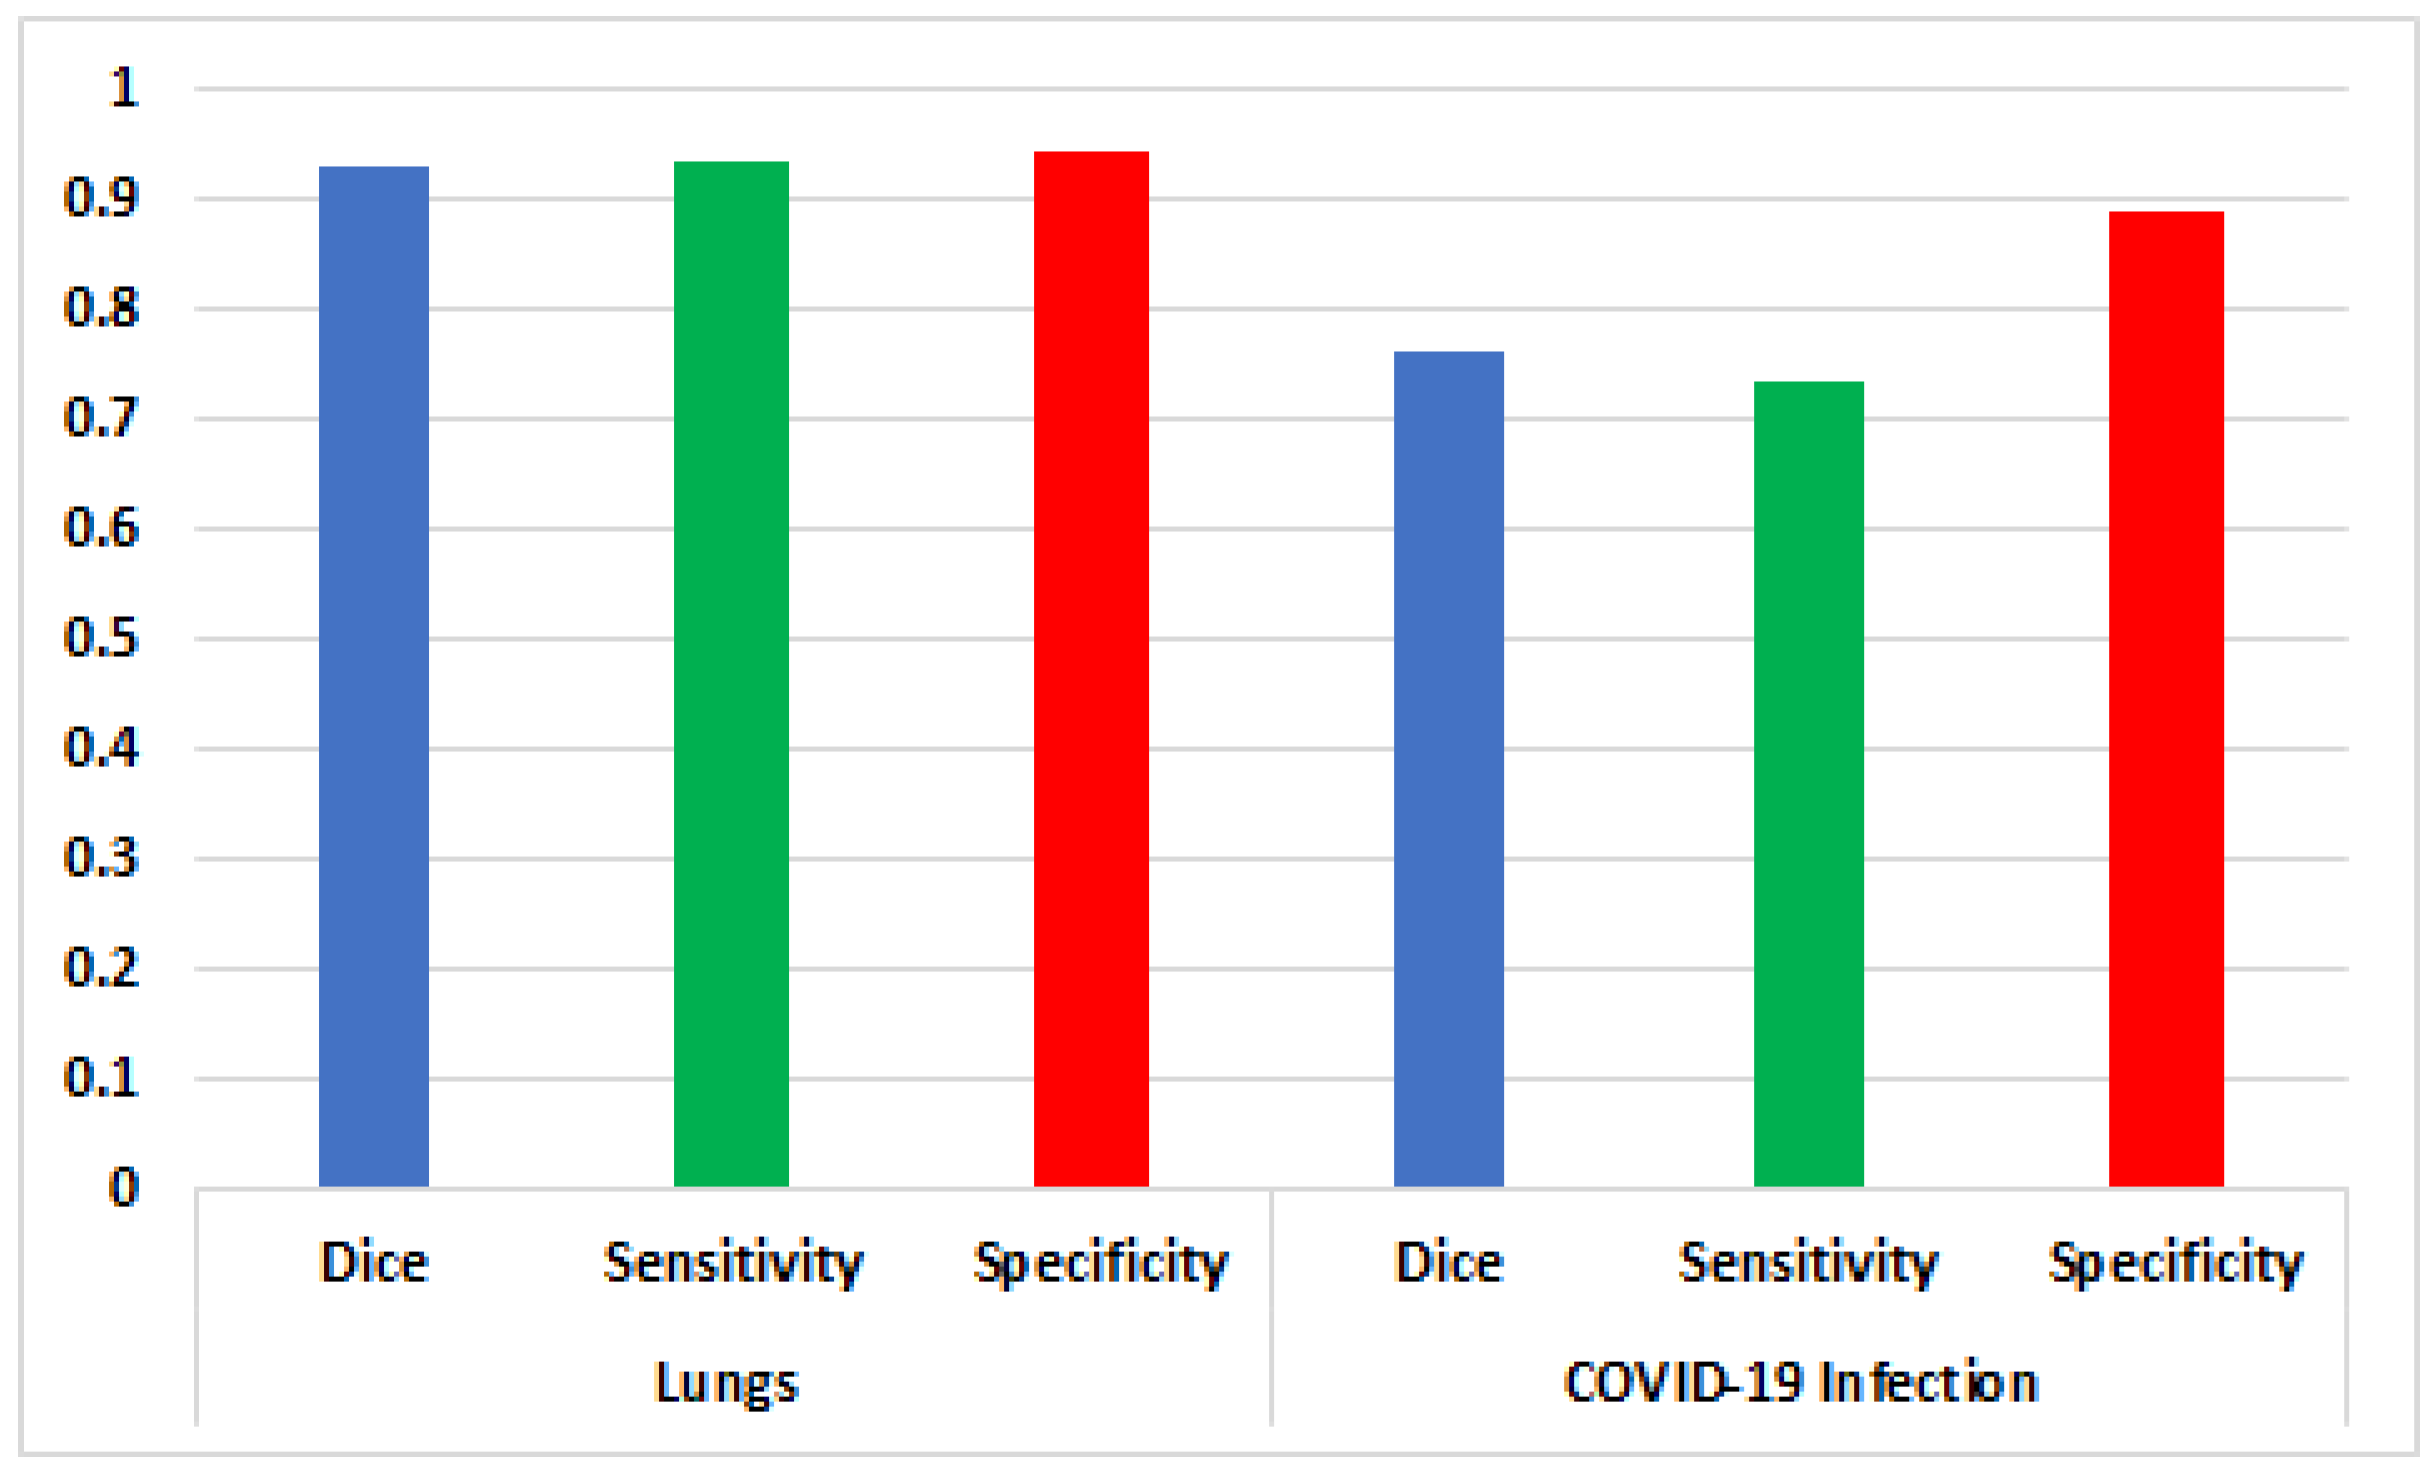
| Fold | Lungs | COVID-19 Infection | ||||
|---|---|---|---|---|---|---|
| Dice Similarity | Sensitivity | Specificity | Dice | Sensitivity | Specificity | |
| 1 | 0.89 | 0.9 | 0.95 | 0.6 | 0.57 | 0.92 |
| 2 | 0.9 | 0.96 | 0.96 | 0.8 | 0.87 | 0.93 |
| 3 | 0.96 | 0.94 | 0.95 | 0.81 | 0.89 | 0.89 |
| 4 | 0.95 | 0.95 | 0.95 | 0.75 | 0.55 | 0.8 |
| 5 | 0.96 | 0.93 | 0.92 | 0.86 | 0.8 | 0.9 |
| Average | 0.932 | 0.936 | 0.946 | 0.764 | 0.736 | 0.888 |
Publisher’s Note: MDPI stays neutral with regard to jurisdictional claims in published maps and institutional affiliations. |
© 2022 by the authors. Licensee MDPI, Basel, Switzerland. This article is an open access article distributed under the terms and conditions of the Creative Commons Attribution (CC BY) license (https://creativecommons.org/licenses/by/4.0/).
Share and Cite
Ahmed, I.; Chehri, A.; Jeon, G. A Sustainable Deep Learning-Based Framework for Automated Segmentation of COVID-19 Infected Regions: Using U-Net with an Attention Mechanism and Boundary Loss Function. Electronics 2022, 11, 2296. https://doi.org/10.3390/electronics11152296
Ahmed I, Chehri A, Jeon G. A Sustainable Deep Learning-Based Framework for Automated Segmentation of COVID-19 Infected Regions: Using U-Net with an Attention Mechanism and Boundary Loss Function. Electronics. 2022; 11(15):2296. https://doi.org/10.3390/electronics11152296
Chicago/Turabian StyleAhmed, Imran, Abdellah Chehri, and Gwanggil Jeon. 2022. "A Sustainable Deep Learning-Based Framework for Automated Segmentation of COVID-19 Infected Regions: Using U-Net with an Attention Mechanism and Boundary Loss Function" Electronics 11, no. 15: 2296. https://doi.org/10.3390/electronics11152296