
Emotion Elicitation through Vibrotactile Stimulation as an Alternative for Deaf and Hard of Hearing People: An EEG Study

 , , and
Abstract
:1. Introduction
2. Materials and Methods
2.1. Participants
2.2. Materials
2.2.1. Stimuli
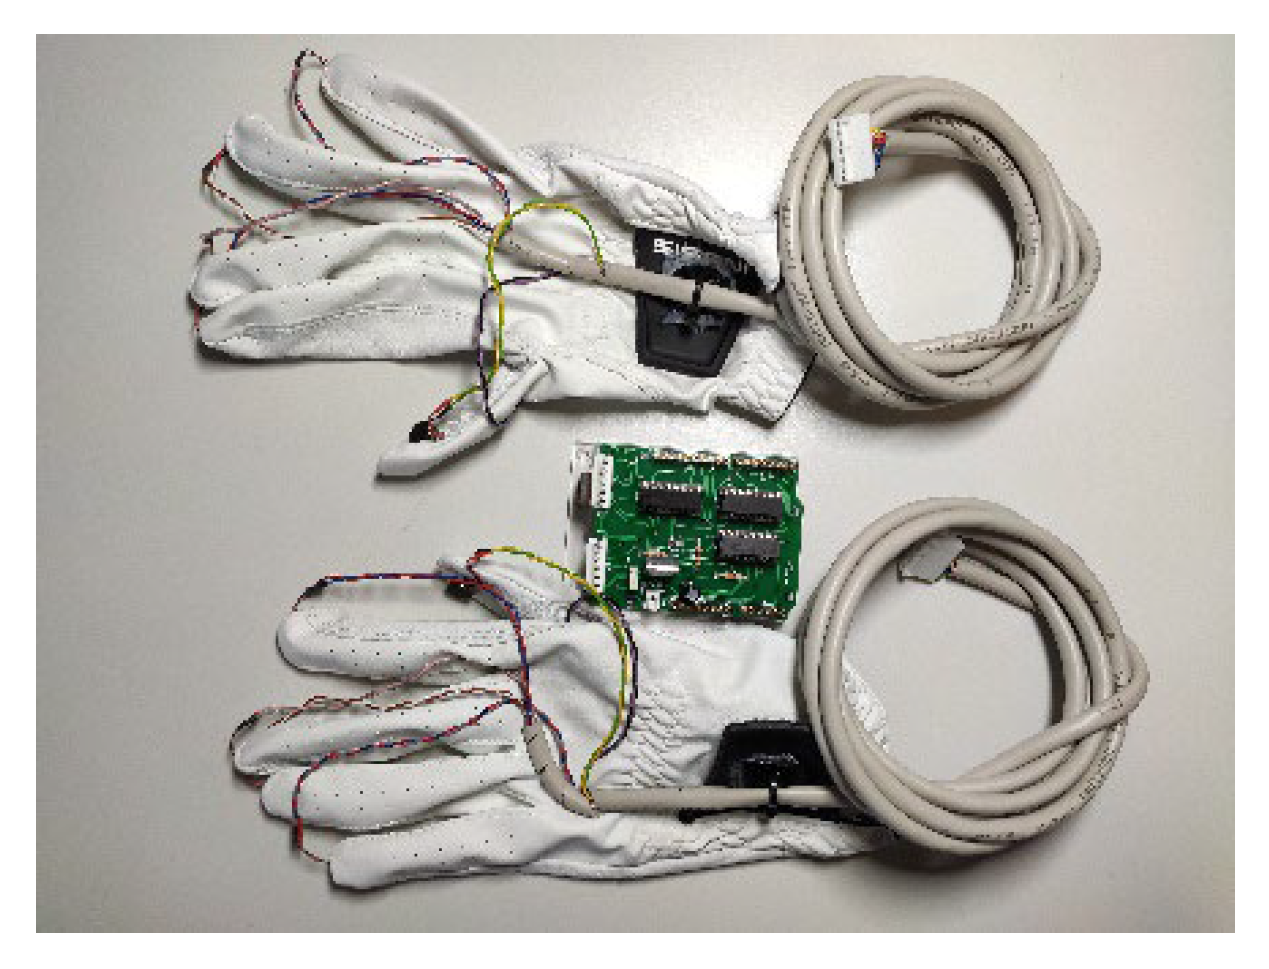
2.2.2. Hardware
2.2.3. Procedure
- Condition 1: This was a reference condition to obtain a baseline emotional experience that will serve as a comparison with the control group. Participants in the control group watched the video. This condition presented neither auditory nor tactile stimulation.
- Condition 2: This was the same as Condition 1 and only for the experimental group. This condition presented only visual stimulation. It did not include auditory stimulation or tactile stimulation.
- Condition 3: This condition was only for the experimental group, and it presented visual stimulation and tactile stimulation while watching the video.
3. Results
4. Discussion
5. Conclusions
Author Contributions
Funding
Institutional Review Board Statement
Informed Consent Statement
Data Availability Statement
Acknowledgments
Conflicts of Interest
References
- UN. UN Convention on the Rights of Persons with Disabilities (CRPD). In Article 30—Participation in Cultural Life, Recreation, Leisure and Sport; UN: New York, NY, USA, 2022. [Google Scholar]
- Huang, R.S.; Chen, C.F.; Sereno, M.I. Spa- tiotemporal integration of looming visual and tactile stimuli near the face. Hum. Brain Mapp. 2018, 39, 1256–2176. [Google Scholar] [CrossRef] [PubMed] [Green Version]
- Akiba, H.T.; Costa, M.F.; Gomes, J.S.; Oda, E.; Simurro, P.B.; Dias, A.M. Neural Correlates of Preference: A Transmodal Validation Study. Front. Hum. Neurosci. 2019, 13, 73. [Google Scholar] [CrossRef] [PubMed] [Green Version]
- Sugiura, A.; Tanaka, K.; Ohta, K.; Kitamura, K.; Morisaki, S.; Takada, H. Effect of controlled consciousness on sense of presence and visually induced motion sickness while viewing stereoscopic movies. In International Conference on Universal Access in Human-Computer Interaction; Springer: Cham, Switzerland, 2018; pp. 122–131. [Google Scholar]
- Chatterjee, A.; Cardilo, E. Brain, Beauty, and Art: Essays Bringing Neuroaesthetics into Focus; Oxford University Press: Oxford, UK, 2021; ISBN 019751362X/9780197513620. [Google Scholar]
- Pehrs, C.; Deserno, L.; Bakels, J.-H.; Schlochtermeier, L.H.; Kappelhoff, H.; Jacobs, A.M.; Fritz, T.H.; Koelsch, S.; Kuchinke, L. How music alters a kiss: Superior temporal gyrus controls fusiform-amygdalar effective connectivity. Soc. Cogn. Affect. Neurosci. 2013, 9, 1770–1778. [Google Scholar] [CrossRef] [PubMed] [Green Version]
- Merchel, S.; Altinsoy, M.E. Psychophysical comparison of the auditory and tactile perception: A survey. J. Multimodal. User Interfaces 2020, 14, 271–283. [Google Scholar] [CrossRef]
- Sugita, Y.; Suzuki, Y. Audiovisual perception: Implicit estimation of sound-arrival time. Nature 2003, 421, 911. [Google Scholar] [CrossRef]
- Bresciani, J.-P.; Ernst, M.O.; Drewing, K.; Bouyer, G.; Maury, V.; Kheddar, A. Feeling what you hear: Auditory signals can modulate tactile tap perception. Exp. Brain Res. 2005, 162, 172–180. [Google Scholar] [CrossRef]
- Okazaki, R.; Hachisu, T.; Sato, M.; Fukushima, S.; Hayward, V.; Kajimoto, H. Judged Consonance of Tactile and Auditory Frequencies. In Proceedings of the 2013 World Haptics Conference (WHC), Daejeon, Korea, 14–17 April 2013; pp. 663–666. [Google Scholar]
- Huang, J.; Gamble, D.; Sarnlertsophon, K.; Wang, X.; Hsiao, S.; Goldreich, D. Feeling Music: Integration of Auditory and Tactile Inputs in Musical Meter Perception. PLoS ONE 2012, 7, e48496. [Google Scholar] [CrossRef] [Green Version]
- Schürmann, M.; Caetano, G.; Jousmäki, V.; Hari, R. Hands help hearing: Facilitatory audiotactile interaction at low sound-intensity levels. J. Acoust. Soc. Am. 2004, 115, 830–832. [Google Scholar] [CrossRef] [Green Version]
- Young, G.W.; Murphy, D.; Weeter, J. Haptics in music: The effects of vibrotactile stimulus in low frequency auditory difference detection tasks. IEEE Trans. Haptics 2016, 10, 135–139. [Google Scholar] [CrossRef]
- Baijal, A.; Kim, J.; Branje, C.; Russo, F.; Fels, D.I. Composing vibrotactile music: A multi-sensory experience with the emoti-chair. In Proceedings of the 2012 IEEE Haptics Symposium (Haptics), Vancouver, BC, Canada, 4–7 March 2012; pp. 509–515. [Google Scholar]
- Tranchant, P.; Shiell, M.M.; Giordano, M.; Nadeau, A.; Peretz, I.; Zatorre, R.J. Feeling the beat: Bouncing synchronization to vibrotactile music in hearing and early deaf people. Front. Neurosci. 2017, 11, 507. [Google Scholar] [CrossRef]
- Yao, L.; Shi, Y.; Chi, H.; Ji, X.; Ying, F. Music-touch shoes: Vibrotactile interface for hearing impaired dancers. In Proceedings of the Fourth International Conference on Tangible, Embedded, and Embodied Interaction, Cambridge, MA, USA, 24–27 January 2010; pp. 275–276. [Google Scholar]
- Branje, C.; Nespoil, G.; Russo, F.; Fels, D.I. The Effect of Vibrotactile Stimulation on the Emotional Response to Horror Films. Comput. Entertain. 2014, 11, 1–13. [Google Scholar] [CrossRef]
- Mazzoni, A.; Bryan-Kinns, N. Mood Glove: A haptic wearable prototype system to enhance mood music in film. Entertain. Comput. 2016, 17, 9–17. [Google Scholar] [CrossRef] [Green Version]
- Katona, J.; Ujbanyi, T.; Sziladi, G.; Kovari, A. Examine the effect of different web-based media on human brain waves. In Proceedings of the 8th IEEE International Conference on Cognitive Infocommunications, Debrecen, Hungary, 11–14 September 2017; pp. 407–412. [Google Scholar] [CrossRef]
- Katona, J.; Kovari, A. The evaluation of bci and pebl-based attention tests. Acta Polytech. Hung. 2018, 15, 225–249. [Google Scholar]
- Katona, J.; Kovari, A.; Heldal, I.; Costescu, C.; Rosan, A.; Demeter, R.; Thill, S.; Stefanut, T. Using eye-tracking to examine query syntax and method syntax comprehension in LINQ. In Proceedings of the 11th IEEE International Conference on Cognitive Infocommunications (CogInfoCom), Mariehamn, Finland, 23–25 September 2020; pp. 437–444. [Google Scholar]
- Katona, J. Measuring Cognition Load Using Eye-Tracking Parameters Based on Algorithm Description Tools. Sensors 2022, 22, 912. [Google Scholar] [CrossRef]
- Katona, J. Clean and dirty code comprehension by eye-tracking based evaluation using GP3 eye tracker. Acta Polytech. Hung. 2021, 18, 79–99. [Google Scholar] [CrossRef]
- Katona, J. Analyse the Readability of LINQ Code using an Eye-Tracking-based Evaluation. Acta Polytech. Hung. 2021, 18, 193–215. [Google Scholar] [CrossRef]
- Negi, A.; Kumar, K. Viability and Applicability of Deep Learning Approach for COVID-19 Preventive Measures Implementation. In Proceedings of the International Conference on Artificial Intelligence and Sustainable Engineering; Springer: Singapore, 2022; pp. 367–379. [Google Scholar]
- Sheikh, D.; Vansh, A.R.; Verma, H.; Chauhan, N.; Kumar, R.; Sharma, R.; Negi, P.C.; Awasthi, L.K. An ECG Heartbeat Classification Strategy using Deep Learning for Automated Cardiocare Application. In Proceedings of the 3rd International Conference on Advances in Computing, Communication Control and Networking (ICAC3N), Greater Noida, India, 17–18 December 2021; pp. 515–520. [Google Scholar]
- Yadav, A.; Verma, H.K.; Awasthi, L.K. Voting Classification Method with PCA and K-Means for Diabetic Prediction. In Innovations in Computer Science and Engineering; Springer: Singapore, 2021; pp. 651–656. [Google Scholar]
- Kumar, K.; Mishra, A.; Dahiya, S.; Kumar, A. A Technique for Human Upper Body Parts Movement Tracking. IETE J. Res. 2022, 1–10. [Google Scholar] [CrossRef]
- Negi, A.; Kumar, K. Classification and detection of citrus diseases using deep learning. In Data Science and Its Applications; Chapman and Hall/CRC: Boca Raton, FL, USA, 2012; pp. 63–85. [Google Scholar]
- Negi, A.; Kumar, K.; Chaudhari, N.S.; Singh, N.; Chauhan, P. Predictive analytics for recognizing human activities using residual network and fine-tuning. In International Conference on Big Data Analytics; Springer: Cham, Switzerland, 2021; pp. 296–310. [Google Scholar]
- Lee, G.; Kwon, M.; Kavuri Sri, S.; Lee, M. Emotion recognition based on 3D fuzzy visual and EEG features in movie clips. Neurocomputing 2014, 144, 560–568. [Google Scholar] [CrossRef]
- Pradhapan, P.; Velazquez, E.R.; Witteveen, J.A.; Tonoyan, Y.; MihajloviÄ, V. The Role of Features Types and Personalized Assessment in Detecting Affective State Using Dry Electrode EEG. Sensors 2020, 20, 6810. [Google Scholar] [CrossRef]
- Jalilifard, A.; Rastegarnia, A.; Pizzolato, E.B.; Islam, M.K. Classification of emotions induced by horror and relaxing movies using single-channel EEG recordings. Int. J. Electr. Comput. Eng. 2020, 10, 3826. [Google Scholar] [CrossRef]
- Bos, D.O. EEG-based emotion recognition. Influ. Vis. Audit. Stimuli 2006, 56, 1–17. [Google Scholar]
- Hassib, M.; Pfeiffer, M.; Rohs, S.S.M.; Alt, F. Emotion Actuator: Embodied Emotional Feedback through Electroencephalography and Electrical Muscle Stimulation. In Proceedings of the 2017 CHI Conference on Human Factors in Computing Systems; Association for Computing Machinery: New York, NY, USA, 2017; pp. 6133–6146. [Google Scholar] [CrossRef]
- BIAP Rec_02-1_en Audiometric Classification of Hearing Impairmen. Available online: https://www.biap.org/es/recommandations/recommendations/tc-02-classification/213-rec-02-1-en-audiometric-classification-of-hearing-impairments/file (accessed on 10 June 2022).
- Kang, D.; Kim, J.; Jang, D.-P.; Cho, Y.S.; Kim, S.-P. Investigation of engagement of viewers in movie trailers using electroencephalography. Brain-Comput. Interfaces 2015, 2, 193–201. [Google Scholar] [CrossRef]
- Pereira, E.T.; Gomes, H.M.; Veloso, L.R.; Mota, M.R.A. Empirical evidence relating EEG signal duration to emotion classification performance. IEEE Trans. Affect. Comput. 2021, 12, 154–164. [Google Scholar] [CrossRef]
- Barrett, L.F.; Mesquita, B.; Ochsner, K.N.; Gross, J.J. The experience of emotion. Annu. Rev. Psychol. 2007, 58, 373–403. [Google Scholar] [CrossRef] [Green Version]
- Zhao, G.; Zhang, Y.; Ge, Y. Frontal EEG Asymmetry and Middle Line Power Difference in Discrete Emotions. Front. Behav. Neurosci. 2018, 12, 225–235. [Google Scholar] [CrossRef] [Green Version]
- Ortony, A.; Turner, T.J. What’s basic about basic emotions? Psychol. Rev. 1990, 97, 315–331. [Google Scholar] [CrossRef]
- Panksepp, J. Affective consciousness in animals: Perspectives on dimensional and primary process emotion approaches. Proc. Biol. Sci. 2010, 277, 2905–2907. [Google Scholar] [CrossRef] [PubMed] [Green Version]
- Barrett, L.F. Was Darwin wrong about emotional expressions? Curr. Dir. Psychol. Sci. 2011, 20, 400–406. [Google Scholar] [CrossRef] [Green Version]
- Ekman, P.; Cordaro, D. What is meant by calling emotions basic. Emot. Rev. 2011, 3, 364–370. [Google Scholar] [CrossRef]
- Schott, G.D. Penfield’s homunculus: A note on cerebral cartography. J. Neurol. Neurosurg. Psychiatry 1993, 56, 329–333. [Google Scholar] [CrossRef] [Green Version]
- Lundborg, G.; Rosen, B. Sensory substitution in prosthetics. Hand Clin. 2001, 17, 481–488. [Google Scholar] [CrossRef]
- Schmidt, P.A.; Maël, E.; Würtz, R.P. A sensor for dynamic tactile information with applications in human–robot interaction and object exploration. Robot. Auton. Syst. 2006, 54, 1005–1014. [Google Scholar] [CrossRef]
- Yoon, M.J.; Yu, K.H. Psychophysical experiment of vibrotactile pattern recognition at fingertip. In Proceedings of the 2006 SICE-ICASE International Joint Conference, Busan, Korea, 18–21 October 2006; pp. 4601–4605. [Google Scholar]
- Velázquez, R. Wearable assistive devices for the blind. In Wearable and Autonomous Biomedical Devices and Systems for Smart Environment; Springer: Berlin/Heidelberg, Germany, 2010; pp. 331–349. [Google Scholar]
- Lang, P.J. The Cognitive Psychophysiology of Emotion: Anxiety and the Anxiety Disorders; Lawrence Erlbaum: Hillsdale, NJ, USA, 1985. [Google Scholar]
- Geethanjali, B.; Adalarasu, K.; Hemapraba, A.; Kumar, S.P.; Rajasekeran, R. Emotion analysis using SAM (Self-Assessment Manikin) scale. Biomed. Res. Tokyo 2017, 28, 18–24. [Google Scholar]
- Dmochowski, J.P.; Bezdek M a Abelson, B.P.; Johnson, J.S.; Schumacher, E.H.; Parra, L.C. Audience preferences are predicted by temporal reliability of neural processing. Nat. Commun. 2014, 5, 1–9. [Google Scholar] [CrossRef] [Green Version]
- Pascual-Marqui, R.D.; Michel, C.M.; Lehmann, D. Low resolution electromagnetic tomography: A new method for localizing electrical activity in the brain. Int. J. Psychophysiol. 1994, 18, 49–65. [Google Scholar] [CrossRef]
- Evans, A.; Collins, D.; Mills, S.; Brown, E.; Kelly, R.; Peters, T. 3D Statistical Neuroanatomical Models from 305 MRI Volumes. In Proceedings of the 1993 IEEE Conference Record Nuclear Science Symposium and Medical Imaging Conference, San Francisco, CA, USA, 31 October 1993; Volume 3, pp. 1813–1817. [Google Scholar]
- Carbonell, F.; Galan, L.; Valdes, P.; Worsley, K.; Biscay, R.J.; Diaz-Comas, L. Random field-union intersection tests for EEG/MEG imaging. NeuroImage 2004, 22, 268–276. [Google Scholar] [CrossRef]
- Lage-Castellanos, A.; Martínez-Montes, E.; Hernández-Cabrera, J.A.; Galán, L. False discovery rate and permutation test: An evaluation in ERP data analysis. Stat. Med. 2010, 29, 63–74. [Google Scholar] [CrossRef]
- Tzourio-Mazoyer, N.; Landeau, B.; Papathanassiou, D.; Crivello, F.; Etard, O.; Delcroix, N.; Mazoyer, B.; Joliot, M. Automated anatomical labeling of activations in SPM using a macroscopic anatomical parcellation of the MNI MRI single-subject brain. NeuroImage 2002, 15, 273–289. [Google Scholar] [CrossRef]
- Pereira, M.G.; de Oliveira, L.; Erthal, F.S.; Joffily, M.; Mocaiber, I.F.; Volchan, E.; Pessoa, L. Emotion affects action: Midcingulate cortex as a pivotal node of interaction between negative emotion and motor signals. Cogn. Affect. Behav. Neurosci. 2010, 10, 94–106. [Google Scholar] [CrossRef]
- Menon, V.; Levitin, D.J. The rewards of music listening: Response and physiological connectivity of the mesolimbic system. NeuroImage 2005, 28, 175–184. [Google Scholar] [CrossRef]
- Kotz, S.A.; Kalberlah, C.; Bahlmann, J.; Friederici, A.D.; Haynes, J.-D. Predicting vocal emotion expressions from the human brain. Hum. Brain Mapp. 2013, 34, 1971–1981. [Google Scholar] [CrossRef]
- Mirz, F.; Gjedde, A.; Sdkilde-Jrgensen, H.; Pedersen, C.B. Functional brain imaging of tinnitus-like perception induced by aversive auditory stimuli. NeuroReport 2000, 11, 633–637. [Google Scholar] [CrossRef] [Green Version]
- Wildgruber, D.; Hertrich, I.; Riecker, A.; Erb, M.; Anders, S.; Grodd, W.; Ackermann, H. Distinct Frontal Regions Subserve Evaluation of Linguistic and Emotional Aspects of Speech Intonation. Cereb. Cortex 2004, 14, 1384–1389. [Google Scholar] [CrossRef] [Green Version]
- Revuelta, P.; Ortiz, T.; Lucía, M.J.; Ruiz, B.; Sánchez-Pena, J.M. Limitations of standard accessible captioning of sounds and music for deaf and hard of hearing people: An EEG study. Front. Integr. Neurosci. 2020, 14, 1. [Google Scholar] [CrossRef] [Green Version]
- Yuvaraj, R.; Murugappan, M.; Ibrahim, N.M.; Sundaraj, K.; Omar, M.I.; Mohamad, K.; Palaniappan, R.; Satiyan, M. Inter-hemispheric EEG coherence analysis in Parkinson’s disease: Assessing brain activity during emotion processing. J. Neural. Transm. 2015, 122, 237–252. [Google Scholar] [CrossRef]
- Machado, L.; Cantilino, A. A systematic review of the neural correlates of positive emotions. Rev. Bras. De Psiquiatr. 2016, 39, 172–179. [Google Scholar] [CrossRef] [Green Version]


| Classification | Loss | Comments |
|---|---|---|
| Normal or subnormal hearing | >20 dB | Mild tone disorder with no social consequences. |
| Mild hearing loss | 21–40 dB | Speech is perceived if the voice is normal; difficulties arise if the voice is low-pitched or distant from the subject. |
| Moderate hearing loss | 41–70 dB | Speech is perceived if the voice is loud; the subject better understands what is being said if he/she can see his/her interlocutor. |
| Severe hearing loss | 71–90 dB | Speech is perceived if the voice is loud and close to the ear; loud noises are also perceived. |
| Very severe hearing loss | 91–119 dB | Speech is not perceived; only loud noises are perceived. |
| Total—cophosis or anacusis | ≥120 dB | Nothing is perceived. |
| AAL | X | Y | Z | Act. [µA/m] |
|---|---|---|---|---|
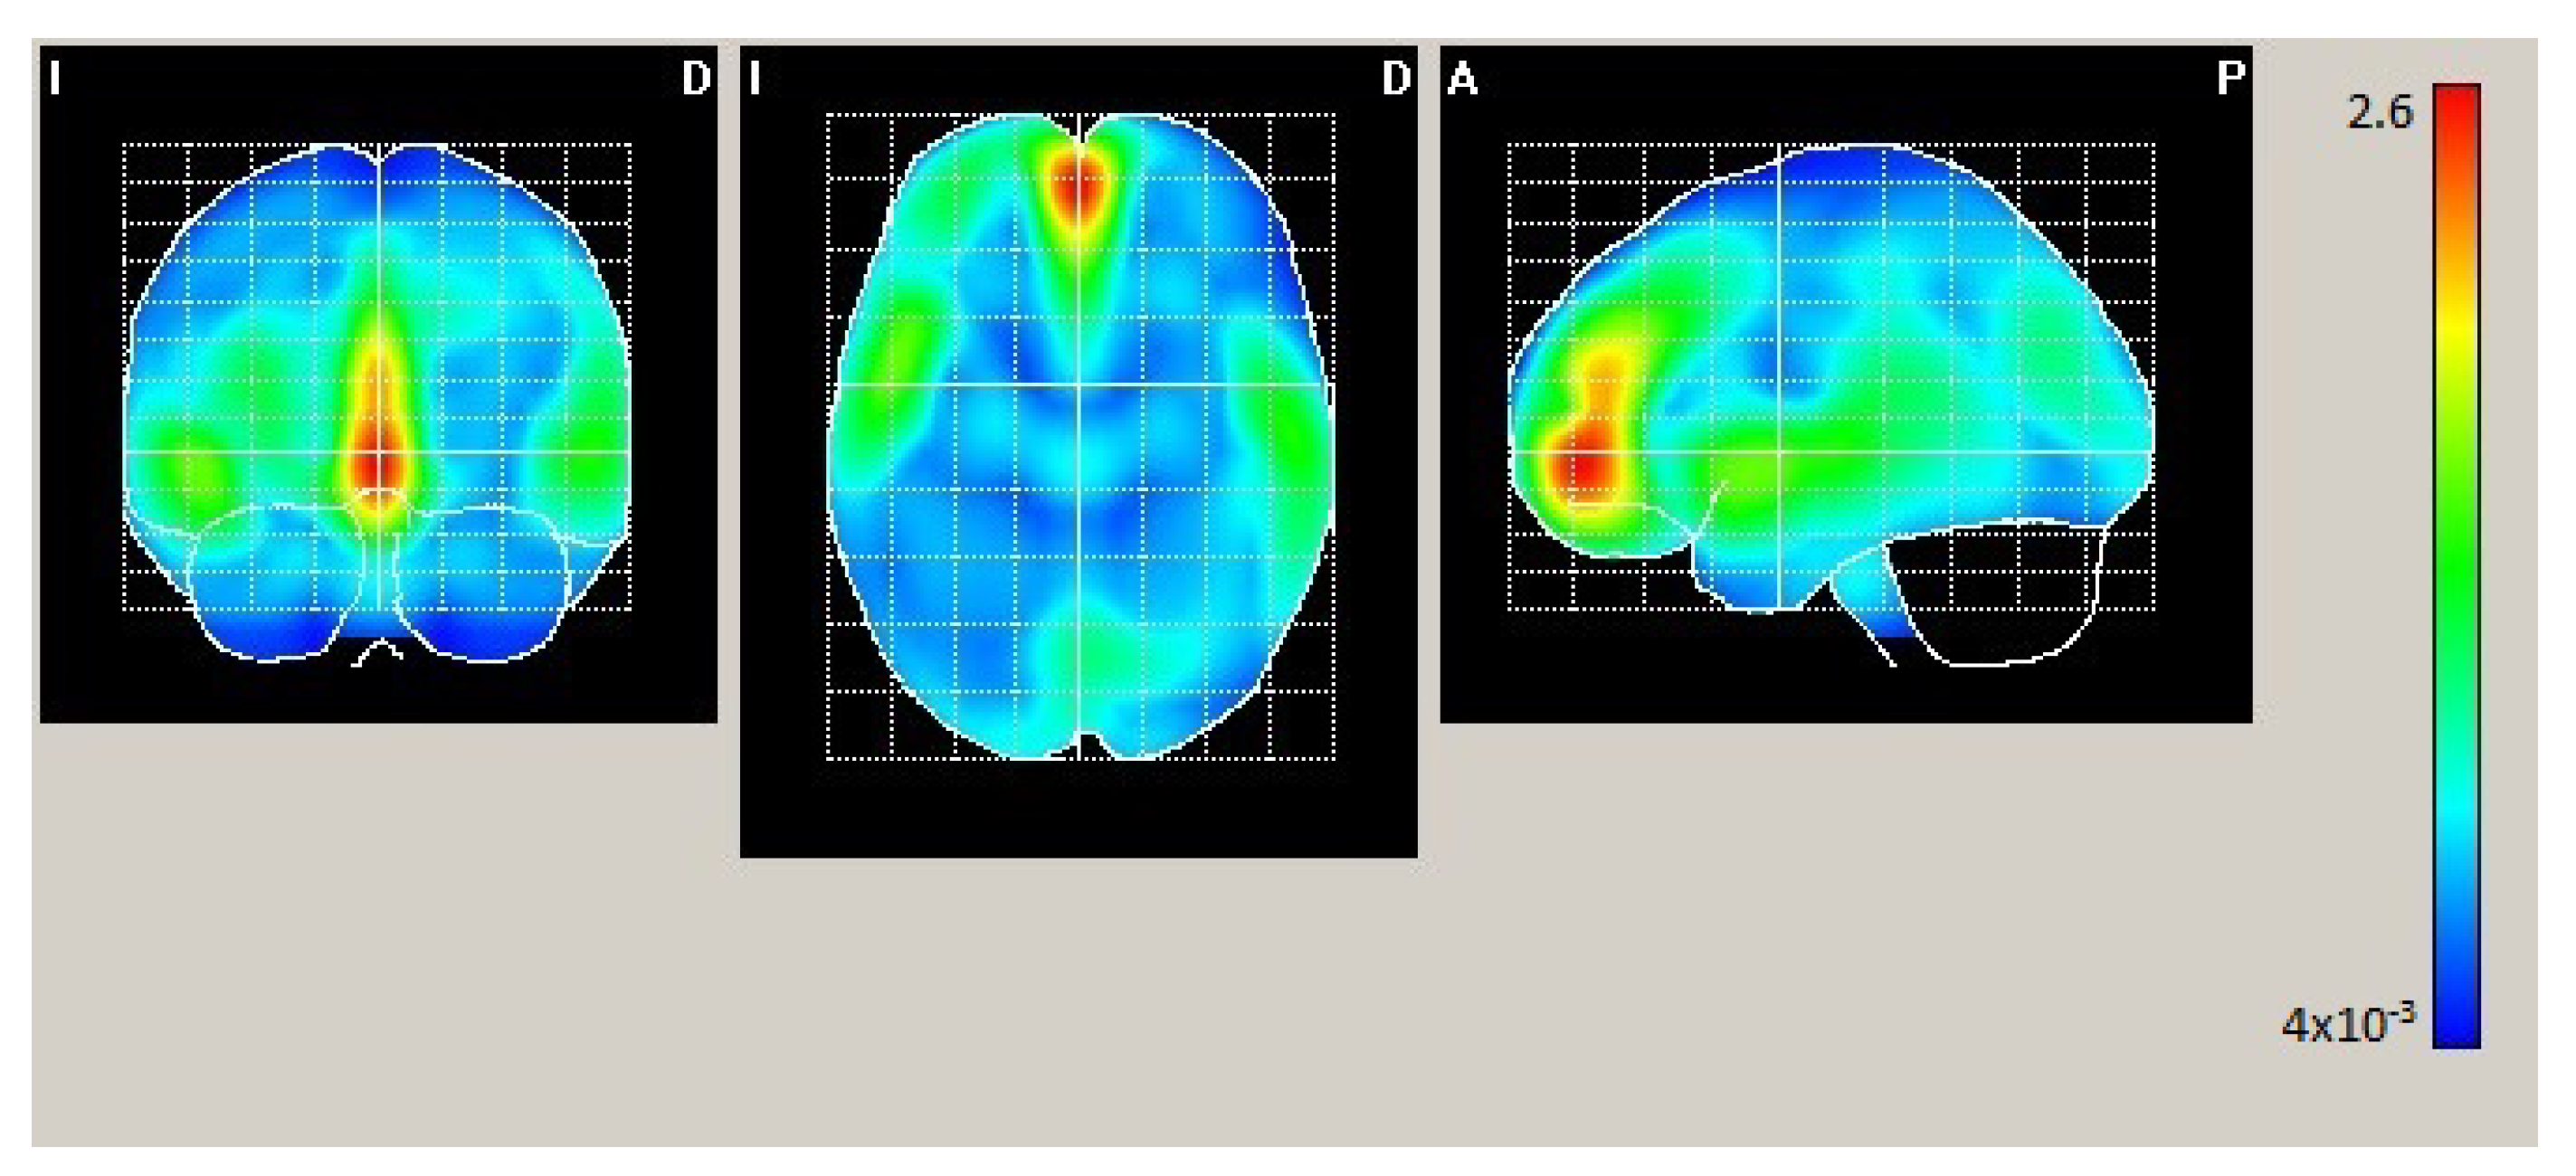
| Frontal_Mid_Orb_L | −2 | 54 | −4 | 2.631 |
| Frontal_Mid_Orb_R | 2 | 54 | −4 | 2.590 |
| Frontal_Sup_Medial_L | −2 | 54 | 0 | 2.586 |
| Cingulum_Ant_L | −2 | 50 | 0 | 2.568 |
| Frontal_Sup_Medial_R | 2 | 50 | 0 | 2.535 |
| AAL | X | Y | Z | Act. [µA/m] |
|---|---|---|---|---|
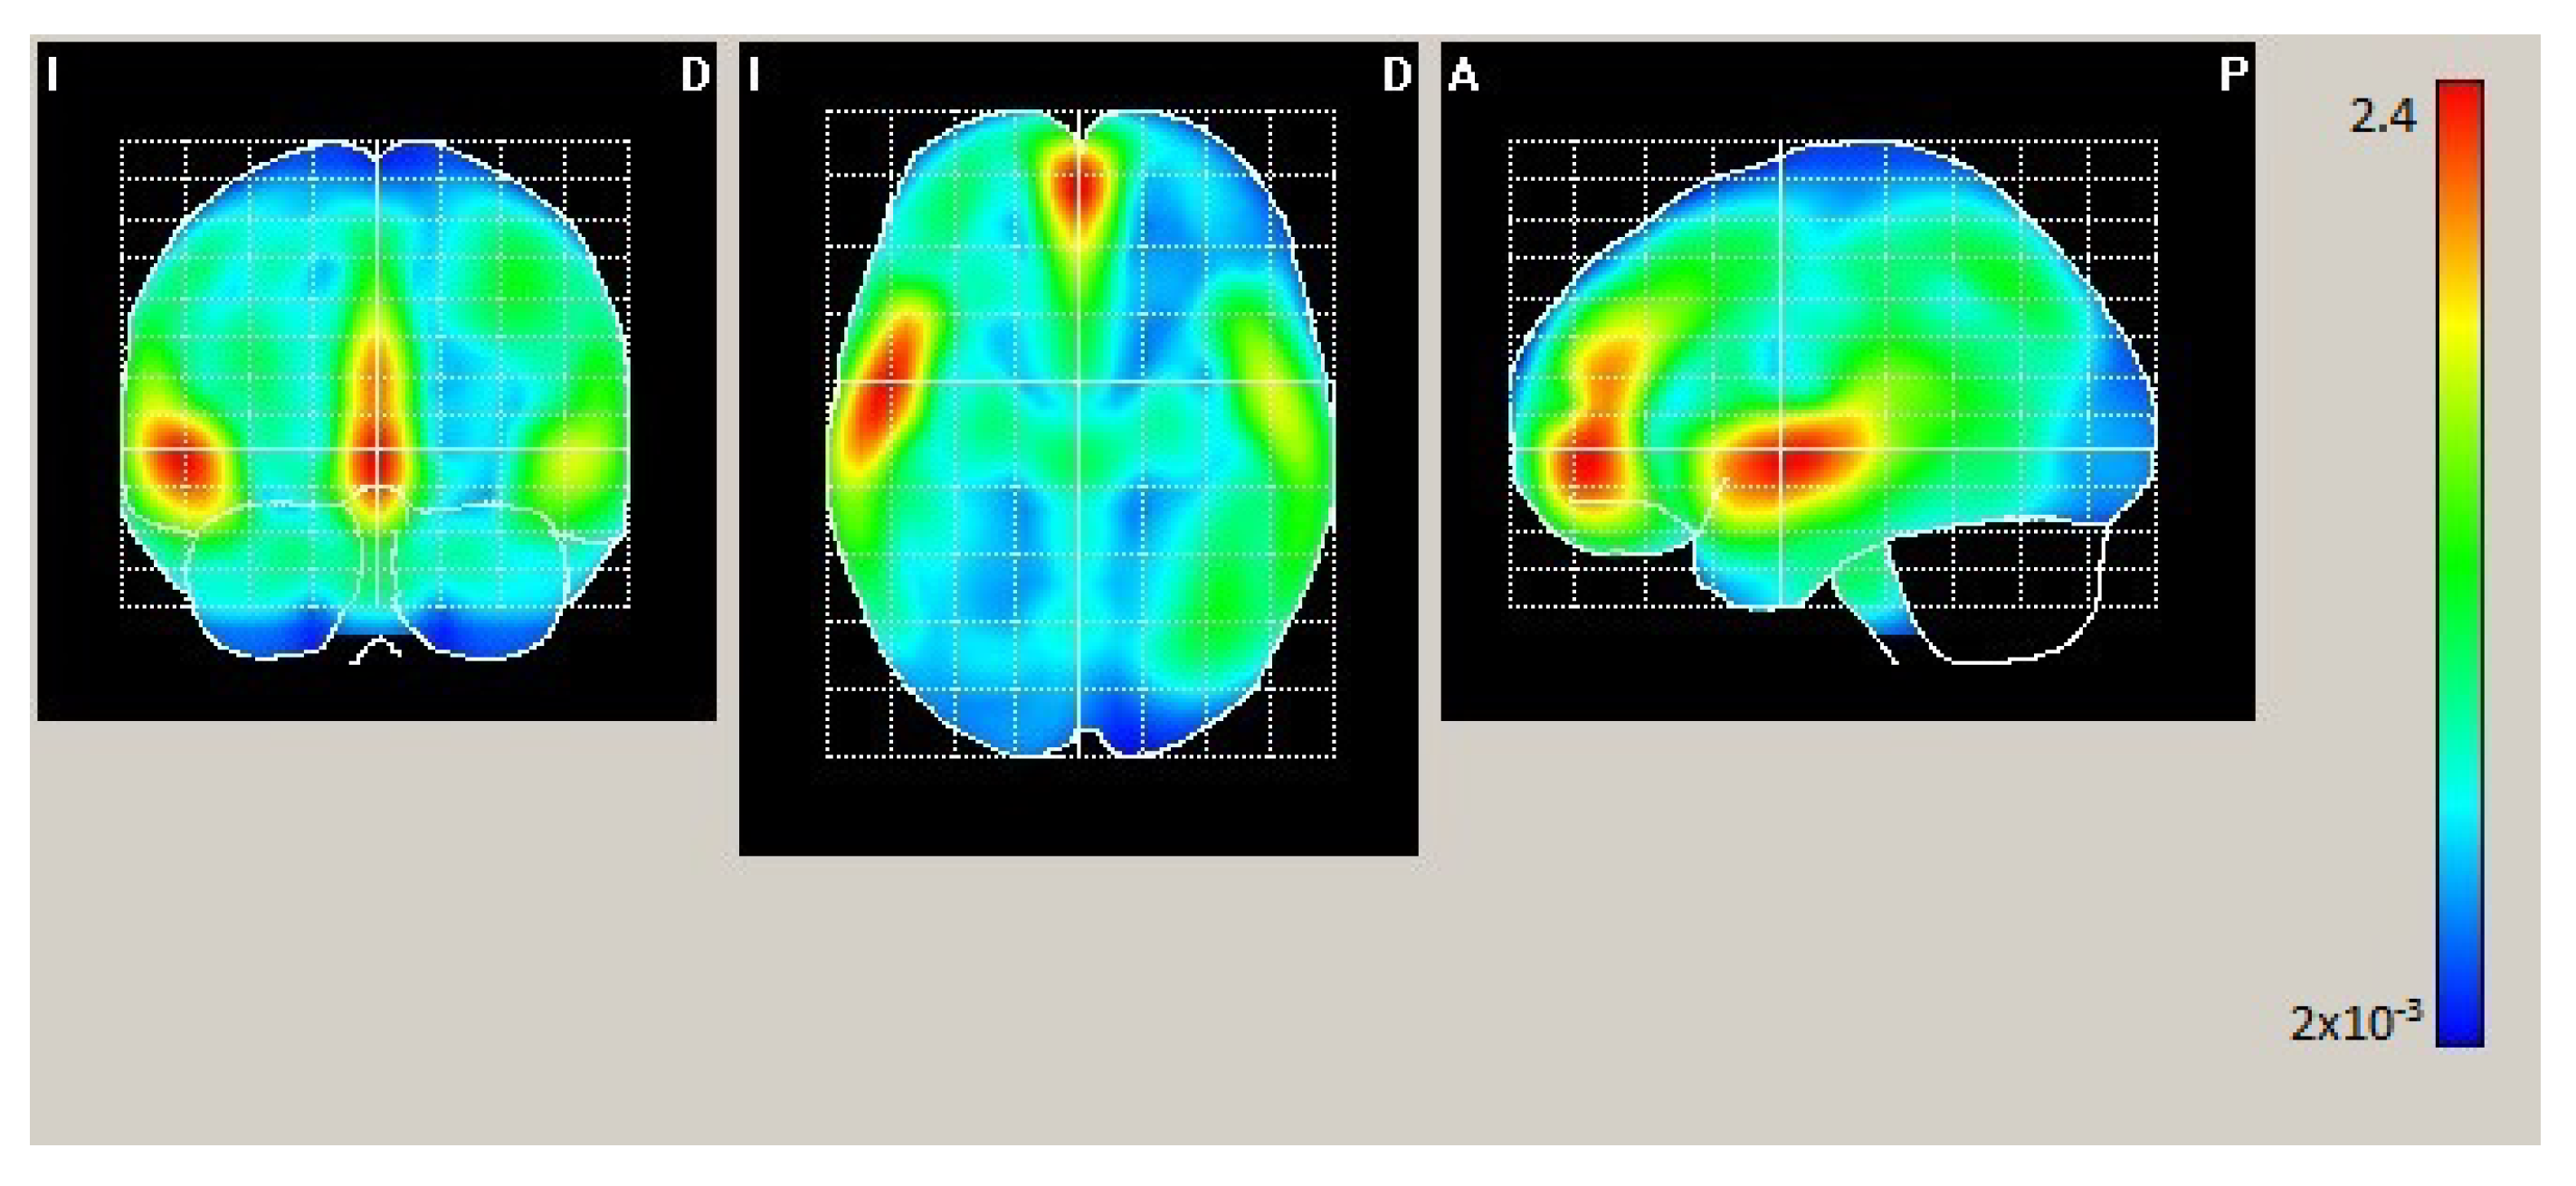
| Frontal_Mid_Orb_L | −2 | 50 | −4 | 2.407 |
| Temporal_Sup_L | −50 | −2 | −4 | 2.401 |
| Frontal_Mid_Orb_R | 2 | 50 | −4 | 2.39 |
| Cingulum_Ant_L | −2 | 50 | 0 | 2.382 |
| Frontal_Sup_Medial_R | 2 | 50 | 0 | 2.364 |
| Frontal_Sup_Medial_L | −2 | 54 | 0 | 2.352 |
| Temporal_Pole_Sup_L | −50 | 6 | 0 | 2.254 |
| Insula_L | −46 | 6 | −4 | 2.249 |
Publisher’s Note: MDPI stays neutral with regard to jurisdictional claims in published maps and institutional affiliations. |
© 2022 by the authors. Licensee MDPI, Basel, Switzerland. This article is an open access article distributed under the terms and conditions of the Creative Commons Attribution (CC BY) license (https://creativecommons.org/licenses/by/4.0/).
Share and Cite
García López, Á.; Cerdán, V.; Ortiz, T.; Sánchez Pena, J.M.; Vergaz, R. Emotion Elicitation through Vibrotactile Stimulation as an Alternative for Deaf and Hard of Hearing People: An EEG Study. Electronics 2022, 11, 2196. https://doi.org/10.3390/electronics11142196
García López Á, Cerdán V, Ortiz T, Sánchez Pena JM, Vergaz R. Emotion Elicitation through Vibrotactile Stimulation as an Alternative for Deaf and Hard of Hearing People: An EEG Study. Electronics. 2022; 11(14):2196. https://doi.org/10.3390/electronics11142196
Chicago/Turabian StyleGarcía López, Álvaro, Víctor Cerdán, Tomás Ortiz, José Manuel Sánchez Pena, and Ricardo Vergaz. 2022. "Emotion Elicitation through Vibrotactile Stimulation as an Alternative for Deaf and Hard of Hearing People: An EEG Study" Electronics 11, no. 14: 2196. https://doi.org/10.3390/electronics11142196