Article

Simulation of Authentication in Information-Processing Electronic Devices Based on Poisson Pulse Sequence Generators

1
Department of Information Technology Security, Lviv Polytechnic National University, 79013 Lviv, Ukraine
2
Purdue School of Engineering and Technology, Indiana University—Purdue University Indianapolis (IUPUI), Indianapolis, IN 46202, USA
*
Author to whom correspondence should be addressed.
Electronics 2022, 11(13), 2039; https://doi.org/10.3390/electronics11132039
Submission received: 24 May 2022 / Revised: 25 June 2022 / Accepted: 26 June 2022 / Published: 29 June 2022
(This article belongs to the Special Issue Cybersecurity and Data Science)

Abstract

:
Poisson pulse sequence generators are quite well studied, have good statistical properties, are implemented both in software and hardware, but have not yet been used for the purpose of authentication. The work was devoted to modeling authenticators of information-processing electronic devices by creating a bit template simulator based on a Poisson pulse sequence generator (PPSG). The generated templates imitated an important property of real bit templates, which reflected the physical uniqueness of electronic devices, namely Hamming distances between arbitrary template pairs for the same device were much smaller than the distance between arbitrary template pairs for two different devices. The limits of the control code values were determined by setting the range of the average frequency values of the output pulse sequence with the Poisson distribution law. The specified parameters of the output pulse sequence were obtained due to the optimization of the parameters of the PPSG structural elements. A combination of pseudo-random sequences with the control code’s different values formed the bit template. The comparison of the Hamming distance between the standard and real-time templates with a given threshold value was used as a validation mechanism. The simulation experiment results confirmed the unambiguous authentication of devices. The simulation results also showed similarities with the real data obtained for the bit templates of personal computers’ own noise. The proposed model could be used for improving the cybersecurity of a corporate network as an additional factor in the authentication of information-processing electronic devices for which the measurement of noise with the required accuracy is not possible or significantly difficult.

1. Introduction

The ability to authenticate electronic information-processing devices based on their unique characteristics attracts the attention of researchers who work to ensure the cybersecurity of information systems. The uniqueness of electronic devices at the physical level makes it possible to carry out authentication using various methods, namely physically non-cloneable functions for the Internet of Things (IoT) [1,2], error vector trajectories of the Global System for Mobile Communications (GSM) mobile phone signals [3], the spectrum of noise in the signal of radioactivity sensors [4], spontaneous electromagnetic radiation from operating mobile phones, light-emitting diode (LED) screens, laptops [5], wireless fidelity transmitters [6], etc. Authentication accuracy depends on the chosen method and conditions of experiments, but usually does not reach 100 percent.
The implementation of the idea of authentication by individual characteristics is based on a preliminary measurement of a physical quantity; for example, electromagnetic interference from operating units of the device, the so-called internal electrical noise. The method of authentication for electronic information-processing devices (personal computers) by the individual forms of correlograms of their internal electrical noise is known [7]. The device authenticator—noise bit template—is calculated from the normalized autocorrelation function of noise. In the future, bit templates could be compared with each other using the selected metric; this is the Hamming distance in the simplest case. An important property of the bit template set, obtained from sequential measurements of the internal noise of a single device, is their closeness in the sense that the Hamming distances between possible pairs of bit templates are small, while the distances between pairs of templates for different devices are much larger. This makes it possible to reliably distinguish these devices, i.e., to authenticate them. The reference templates from each electronic device are pre-recorded on the server. During authentication, the device presents a real-time template, which is compared with a reference template. Authentication is confirmed if the distance between templates is less than a threshold value for the claimed device. Bit template variations provide dynamic authentication because the templates do not repeat exactly, and thus the authenticator reuse attack is eliminated. There are known experiments, a result of which made it possible to authenticate stationary personal computers of the same series with an accuracy of 98.6% [8].
An integrated sound card can be used to measure the internal noise of computers. Usually, noise bit templates of desktop computers are stable over time. For laptops the situation is slightly different. If the laptop gets into a location with a strong external electromagnetic field that significantly affects the internal noise of the laptop, then authentication errors occur [8]. In addition, not all electronic information-processing devices have integrated ADCs, for example, many microprocessors do not have an integrated ADC. For them, the use of internal noise as a sign of authentication is not possible. Therefore, in this study, the problem of modeling authentication features based on Poisson pulse sequence generators was formulated.
Generators of random or pseudo-random pulse sequences have been used for a long time to solve a wide range of problems in science and technology. Almost all standard program libraries have the embedded generators of pseudo-random sequences, which users could utilize. One of the most important generators is the Poisson pulse sequence generator (PPSG). These generators are widely used in different branches of techniques for simulating different processes that have a random temporal and spatial nature [9], for sociological and scientific research [10,11]. Such generators are effectively used to solve cybersecurity problems [12,13], to simulate the output signals of dosimetric detectors when designing them, and testing devices for measuring the parameters of ionizing radiation [14,15,16,17,18,19], because the number of radioactive decay particles detected by the detector over a period of time is subject to the Poisson distribution law.
In recently published works quite effective principles of realization of software and hardware PPSG are presented. Their structures, based on the use of pseudo-random number generators (PRNGs), were proposed [20,21,22,23,24,25,26,27] and methods for assessing the quality of their output signals were developed [28,29,30,31]. In this case the effectiveness of the possible application of the PPSG significantly depends on the quality of the designed generator and on the main characteristics of its output sequence.
The aim of this study was to model bit templates for the authentication of electronic information-processing devices based on a Poisson pulse sequence generator. The following tasks were solved to achieve this aim.
  • Optimization of the parameters of the PPSG’s structural elements in order to obtain the specified parameters of the output pulse sequence. Definition of the limits of control code values, specification of the range of values of the average frequency of the output pulse sequence, which corresponds to Poisson’s law of distribution.
  • The bit template simulator was proposed based on the Poisson pulse sequence generator. Bit sequences with given characteristics were the result of the simulator.
  • The simulation experiment was carried out to test the required properties of bit templates.
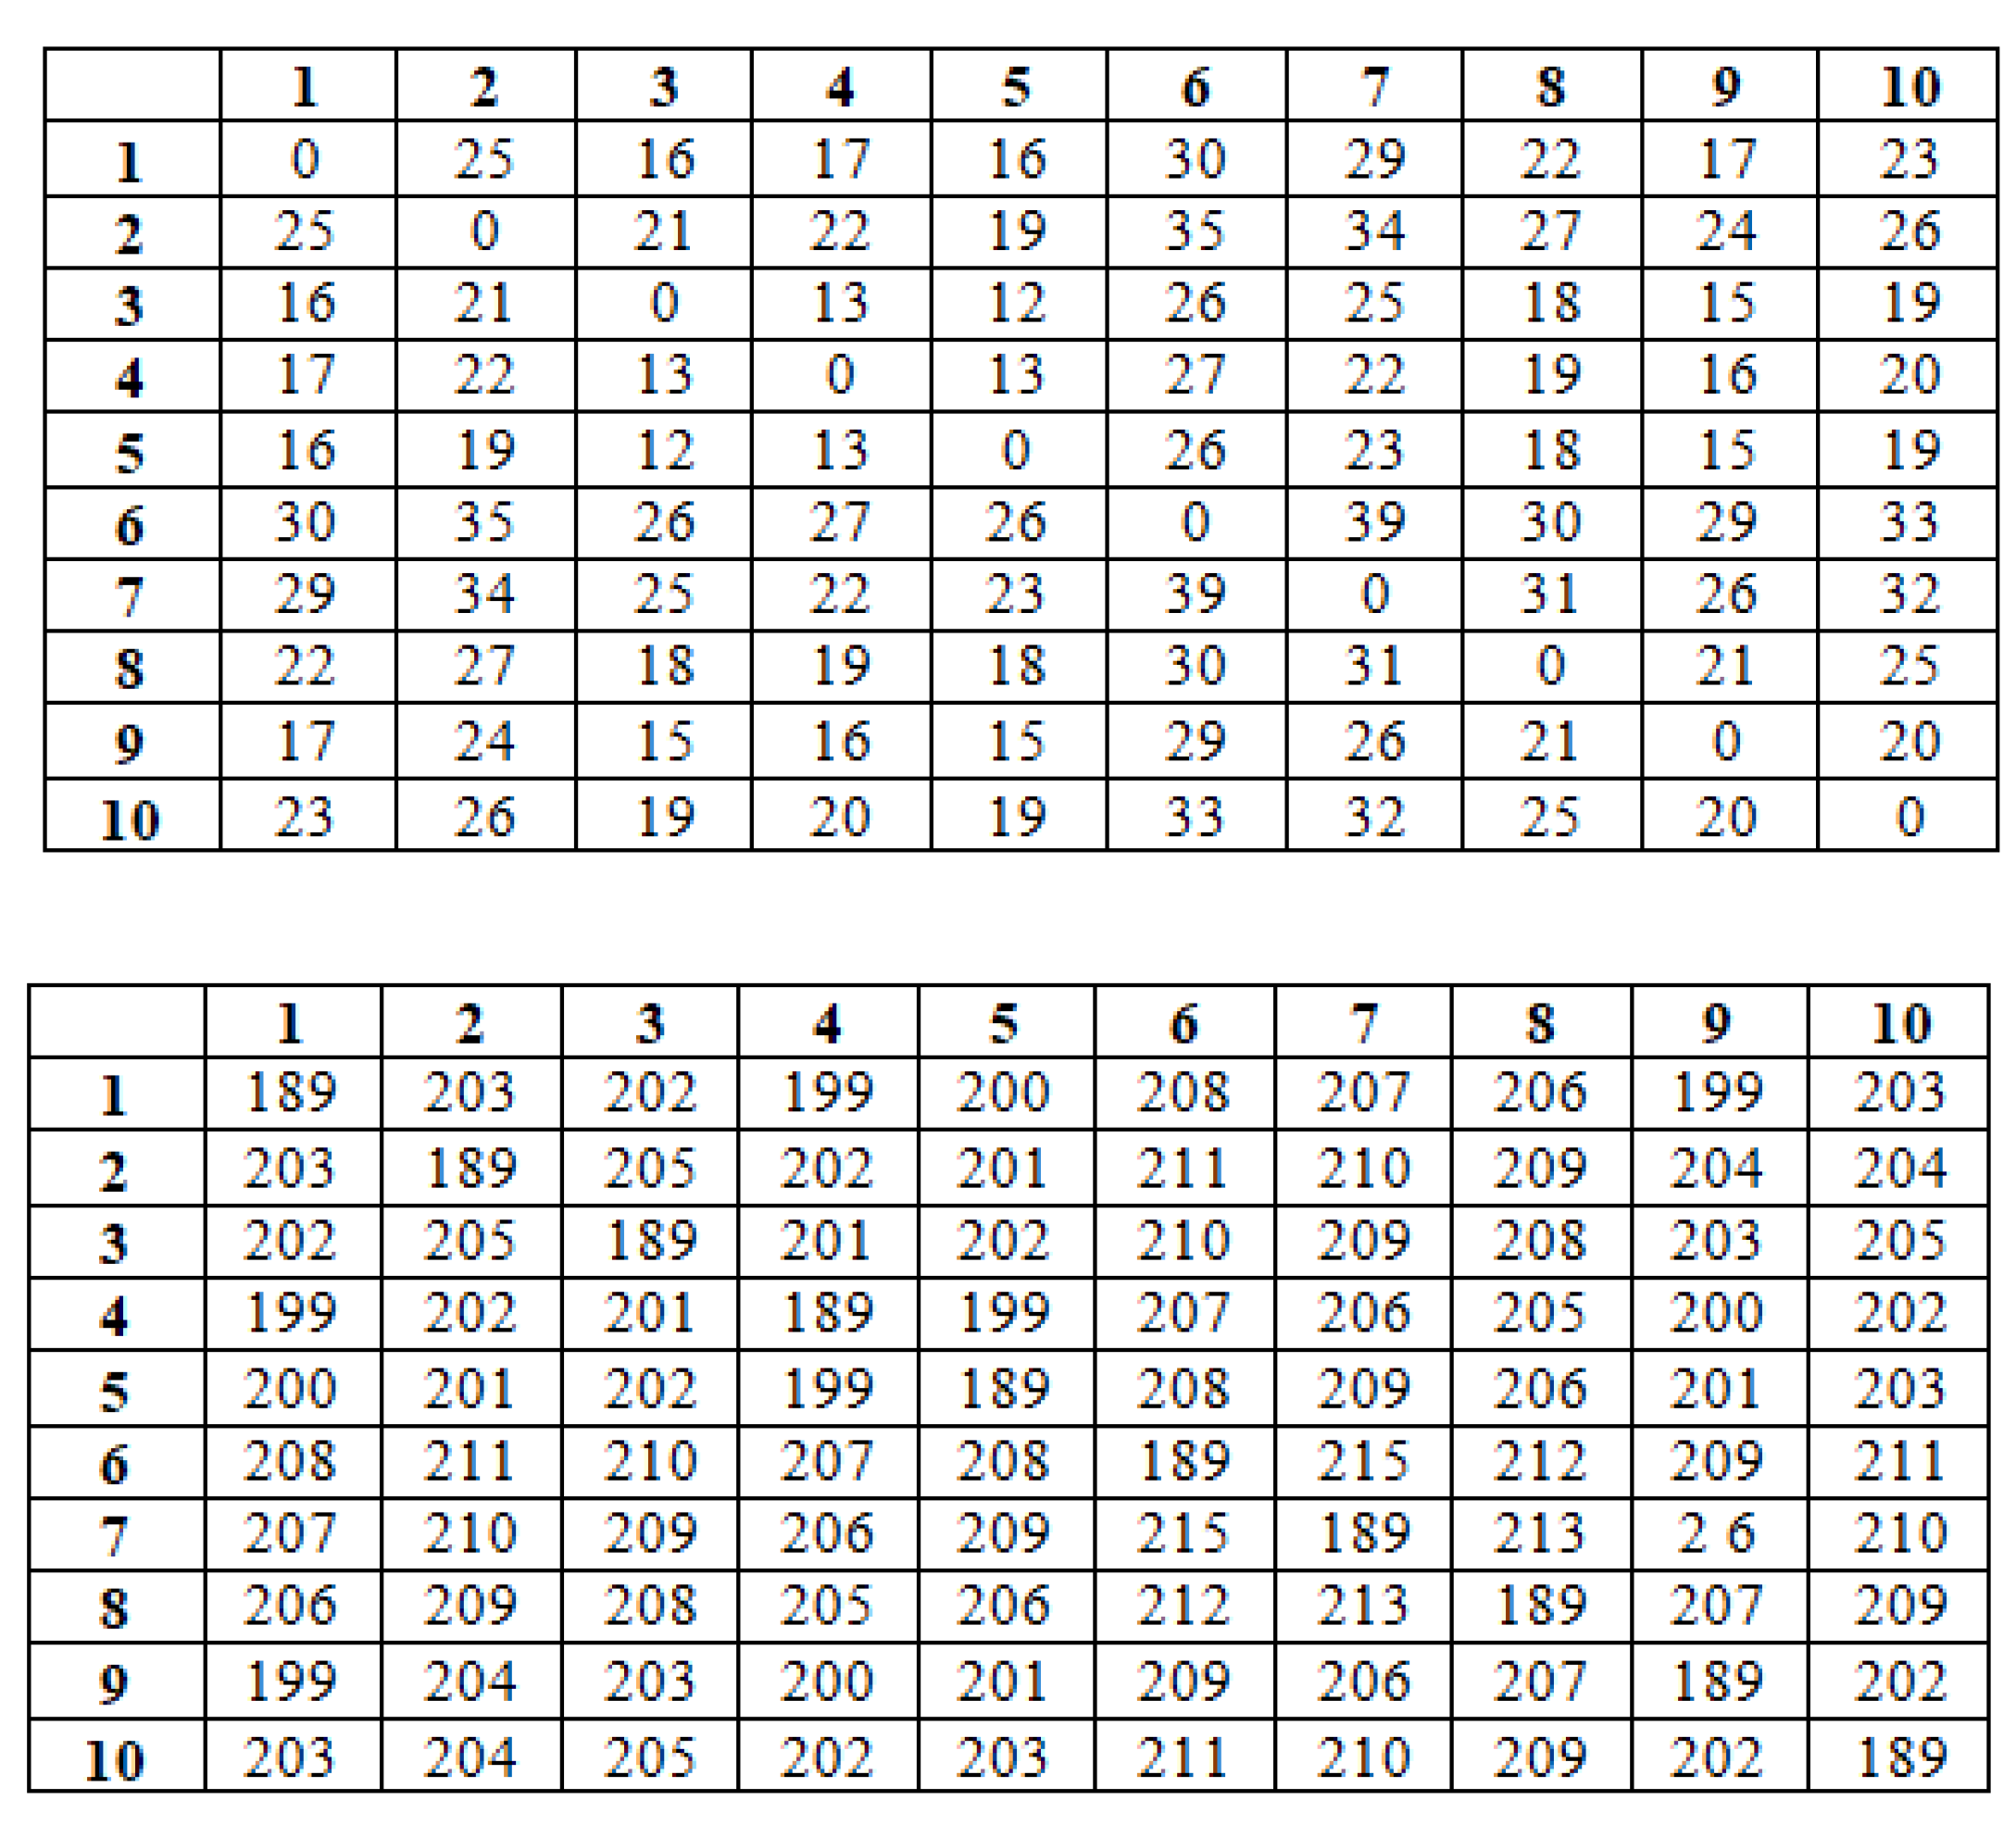
In this research, based on previously obtained results concerning Poisson pulse sequence generators and the development of the control code theory, the needed sequences were programmatically generated. Sample device bit templates were simulated based on these sequences and authentication was also performed programmatically. The examination consisted of calculating pairs of possible Hamming distances between the templates of the same device (intradistances) and for different devices (interdistances) and comparing them one with another.
Comparing the set of intradistances with the set of interdistances confirmed the main idea, that the generated templates could be unmistakably classified as being related to different devices. The threshold of distances was determined, according to which classification was made for specific parameters of the PPSG.
In this research the Poisson Pulse Sequence Generator was used for the first time to create device authentication templates based on the principle of biometrics. Compared with the best practices, which were using the measured values—electromagnetic radiation, internal electrical noise—the proposed method had several advantages. Benefits included 100% authentication, significantly more devices, and no time delay for measurements.

2. Materials and Methods

2.1. Structural Scheme PPSG and the Principle of Its Operation

The generator [16,17,18], whose structural scheme is illustrated in Figure 1, consisted of a modified additive Fibonacci generator (MAFG), which contained registers Rg1–Rg5, adders Ad1–Ad3, logical scheme LS, as well as a comparing scheme CS and logical element &. All the structural MAFG elements, except LS, worked in binary-decimal code.
On MAFG output, e.g., on Rg5 output, a sequence of pseudo-random numbers was formed in accordance with the following expression:
x j + 1 = ( x j + x j 1 + x j 2 + x j 3 + a ) m o d m
where x j , x j - 1 , x j - 2 , x j - 3 are the numbers in registers Rg4, Rg3, Rg2, Rg1, correspondingly, m = 10 q , and q is the number of decades of the scheme’s structural elements. The value of the variable a is determined by the logical equation
a = ( a 0 0 a 0 1 a 0 2 a 0 3 ) ( a q 1 0 a q 1 1 a q 1 2 a q 1 3 )
where a i j   ( i = 0 , 1 , 2 , 3 ; j = 0 , 1 , , q 1 ) is the value of bits of the binary-decimal number in Rg5. The number of members of Equation (2) can be selected from the range 0 4 q .
The theoretical average value of the pulse frequency at the PPSG output is determining from the following Equation [16]:
f o u t = G 10 q f m
where G is the control code, f m is the clock pulse frequency.

2.2. Output Signal Parameters and Internal Parameters of the Generator and Their Relationship

The main parameters of the output pulse sequence were as follows:
  • average value of frequency f o u t ;
  • value range of f o u t ;
  • step of frequency f o u t changing − Δ f o u t ;
  • the repetition period of the pulse sequence;
  • compliance of the pulse sequence with the Poisson distribution law.
The parameters of the output pulse sequence were determined by the following internal parameters of the generator (Figure 1):
  • the number of decades of the MAFG structural elements;
  • initial settings of the registers Rg1–Rg5;
  • number of members of Equation (2) involved in the implementation of the logic scheme LS.
The three internal parameters were clearly defined:
  • the repetition period of pseudo-random numbers in the output of the MAFG register (Rg5 output);
  • statistical characteristics of the number sequence of the MAFG output.
Based on the principle of PPSG construction, it could be argued that the repetition period of the output pulse sequence was equal to the repetition period of numbers in the MAFG output.
The repetition period and statistical characteristics of the sequence of numbers in the MAFG output determined the compliance of the output PPSG pulse sequence with the Poisson distribution law. However, that compliance significantly depended on the average frequency of an output sequence f o u t , whose theoretical value was determined by Equation (3) and, therefore, depended on the correlation between control code value G and value 10 q . In fact, when value G was approaching the value 10 q , then f o u t was approaching the clock frequency f m and, under such conditions, the output sequence started losing its pseudo-random properties. From the other side, the lower the frequency of the output sequence f o u t , the greater the time interval needed to be to determine its statistical characteristics. In this case such an interval should not exceed the repetition period of this sequence. Thus, in principle (theoretically), the original PPSG pulse sequence might conform to the Poisson distribution law for arbitrarily small average values f o u t , however, the sequence repetition period should be of a sufficiently large value. As a limit, if the average value f o u t went to zero, the repetition period should go to infinity.
These statements were practical in nature, satisfied most PPSG applications, and are confirmed below by specific calculations and simulation results. Theoretically, a more general approach to determine the correspondence of the output sequence to the Poisson distribution law could be considered, taking into account the value of the average repetition frequency, repetition period, observation time, and the chosen method of estimating statistical characteristics. However, such an approach needs to be refined to be applied in practice.
Taking into account the above, the average frequency f o u t , the range of its values, and the step change could be calculated theoretically using Equation (3). The real values of these quantities were determined as a result of simulation and/or experimentally.

2.3. Estimation Method for Statistical Characteristics of the Output Signal

This research was carried out using a generalized method of studying the parameters of the output PPSG pulse sequence for compliance with the Poisson distribution law using Pearson’s test [32].
In accordance with the proposed method, the flow of input pulses of the PPSG was divided into n equal groups, each of which consisted of i m a x pulses. The maximum number of groups was n m a x . The groups of input pulses corresponded to the groups of output pulses with the number of pulses k 1 , k 2 , k n m a x . The proposed method was based on the classical testing method of the hypothesis of the distribution of the general totality according to Poisson’s law using Pearson’s criterion ( χ 2 criterion) [32,33,34]. In this case, taking into account the specifics of the PPSG construction, the following additions were proposed:
  • we fixed nominal (theoretical) average value of numbers k 1 , k 2 , k n m a x k c , regardless of the control code value G;
  • the value i m a x was variable, depended on the value G, and was determined by the equation
i m a x = 10 q G k c   .
As a result of the application of this method we obtained the value χ c 2 . According to the tables of critical distribution points of χ 2 [33,34], according to the selected level of significance α (usually α is assigned one of the three following values: 0.1; 0.05; 0.01), the number of degrees of freedom k could be obtained using the critical value χ c r 2 . If χ c 2 < χ c r 2 there was no reason not to accept the hypothesis that the pulse flux corresponded to the Poisson distribution law.
When determining the statistical characteristics of the PPSG output signal in the range of values of the control code G, it was useful to average the last (current) h values of χ c 2 . Obtained by such a way, variable χ c a v 2 was comparable with χ c r 2 . The averaging of the values χ c 2 was necessary for a certain “smoothing” of the results. Based on the simulation experience, one could select value h = 5 , which could be changed if needed for a clearer (more integrated) determination of the control code range G, in which the output pulse sequence corresponded to the Poisson distribution law.
When designing a PPSG, it is also useful to pre-determine the statistical characteristics of the number sequence, in this case at the MAFG output. This could be achieved using standard statistical tests, such as NIST statistical tests [22,23,24,25,26,27,32,35].

2.4. Defining the Limits of the Range of the Control Code Values

Lower G 1 and upper G 2 limits of the control code values G, in which the statistical characteristics of the output pulse sequence corresponded to the Poisson distribution law, could be determined based on the following.
The sequence evaluation time should not be longer than its repetition period T n . That is, based on the above methodology, the following inequality must be satisfied:
i m a x n m a x T n
From Equation (4) and inequality (5) we obtain
G 10 q k c n m a x T n
This meant that the value G 1 was the smallest integer number satisfying Inequality (6). As a result of PPSG simulation, it was found that the value G 2 satisfied the following condition:
G G 2 = s 10 q
In this case the value of the coefficient s was determined separately for a concrete number of MAFG decades q, and depended on the initial settings of the registers Rg1–Rg5, the number of involved members of Equation (2) and, under certain conditions, was close to 0.1.

3. Results

3.1. Investigation of the PPSG Based on MAFG When q = 3

3.1.1. Determining the Repetition Period of the MAFG

At a fixed number of decades, the MAFG repetition period of a pseudo-random sequence of numbers in its output T n and, thus, the repetition period of the pulse sequence in the output of the PPSG, also depended on the number of involved members of Equation (2) and from the initial settings of the registers Rg1–Rg5.
The performed investigations showed that the initial settings of the registers affected the statistical characteristics of the output sequence. The values of these settings obtained as a simulation result, when the statistical characteristics were satisfactory, is shown below.
Dependence of the repetition period T n on the used number of members from Equation (2) was significant. Some confirmed results are presented in Table 1, which were obtained for such initial states of registers Rg1–Rg5, correspondingly 1, 0, 0, 0, 0.
Optimization of equation choosing for the output signal LS was a separate partial task requiring additional research. Its solution would also affect the speed of the generator.

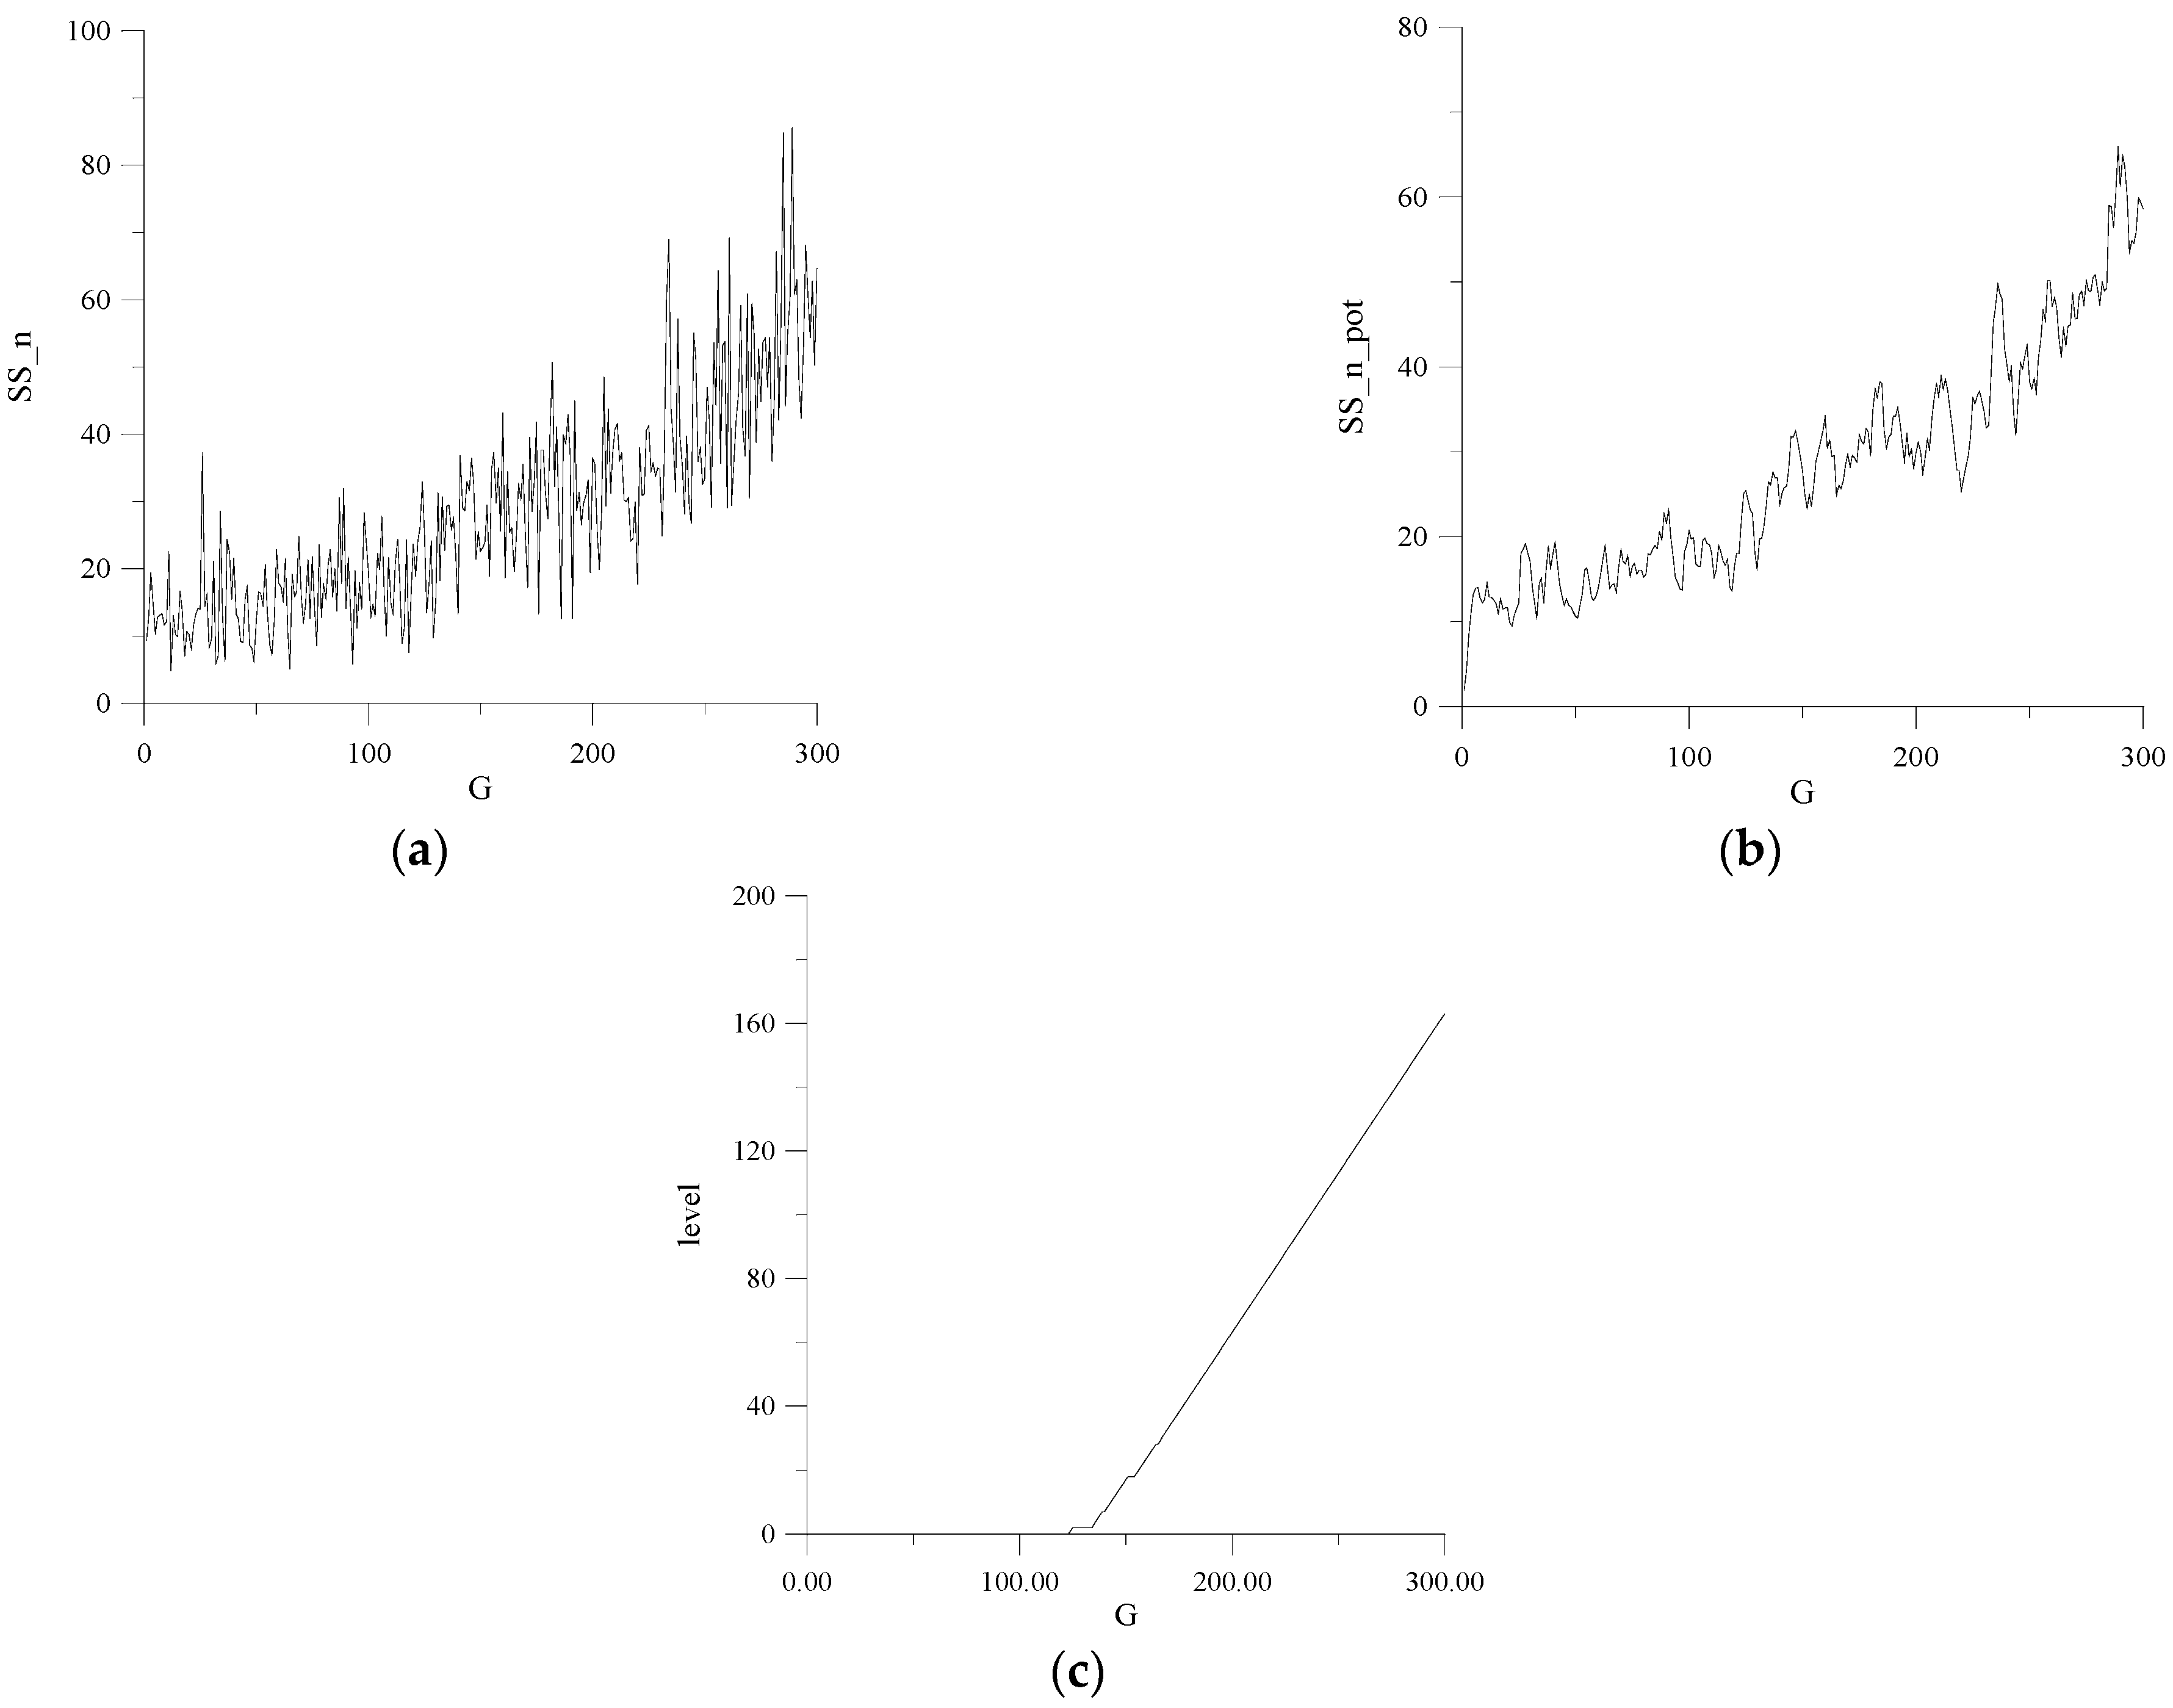
3.1.2. Determination of Statistical Characteristics and the Range of Values of the Control Code

Figure 2 illustrates the investigation results of PPSG statistical characteristics based on the MAFG for q = 3 .
Here the following notations were used:
  • SS_n—value χ c 2 ;
  • SS_n_pot—the average value of the last five (current) values χ c 2 χ c a v 2 ;
  • Level—number of values χ c a v 2 greater than χ c r 2 .
The results were obtained at the following values of the method parameters for evaluating the quality of the pulse sequence: n m a x = 1000 , k c = 10 , χ c r 2 = 25 .
The output signal of the logic circuit of the LS was formed by the following expression:
a = ( a 0 0 a 0 1 a 0 2 a 0 3 ) ( a 1 0 a 1 1 a 1 2 a 1 3 ) ( a 2 0 a 2 1 a 2 2 a 2 3 )
as a result of the search for initial states of various variants of registers Rg1–Rg5, it was found that the value of these settings was satisfactory—G, 0, 0, 0, 0, correspondingly. That is, the option in which the initial settings depended on the control code. This was for such initial settings for which results are presented in Figure 2.
Thus, the range of the control code values G − ( G 1 ÷ G 2 ) , in which the original pulse sequence corresponded to the Poisson distribution law, in this case (when q = 3 ), was determined by the equation
G 1 = 1 ,   G 2 = 124
In this case, the value G 1 = 1 , determined as a result of simulation, coincided with the value G 1 , defined theoretically by the expression (6):
G 10 q k c n m a x T n = 10 3 10 10 3 10 9 = 10 2

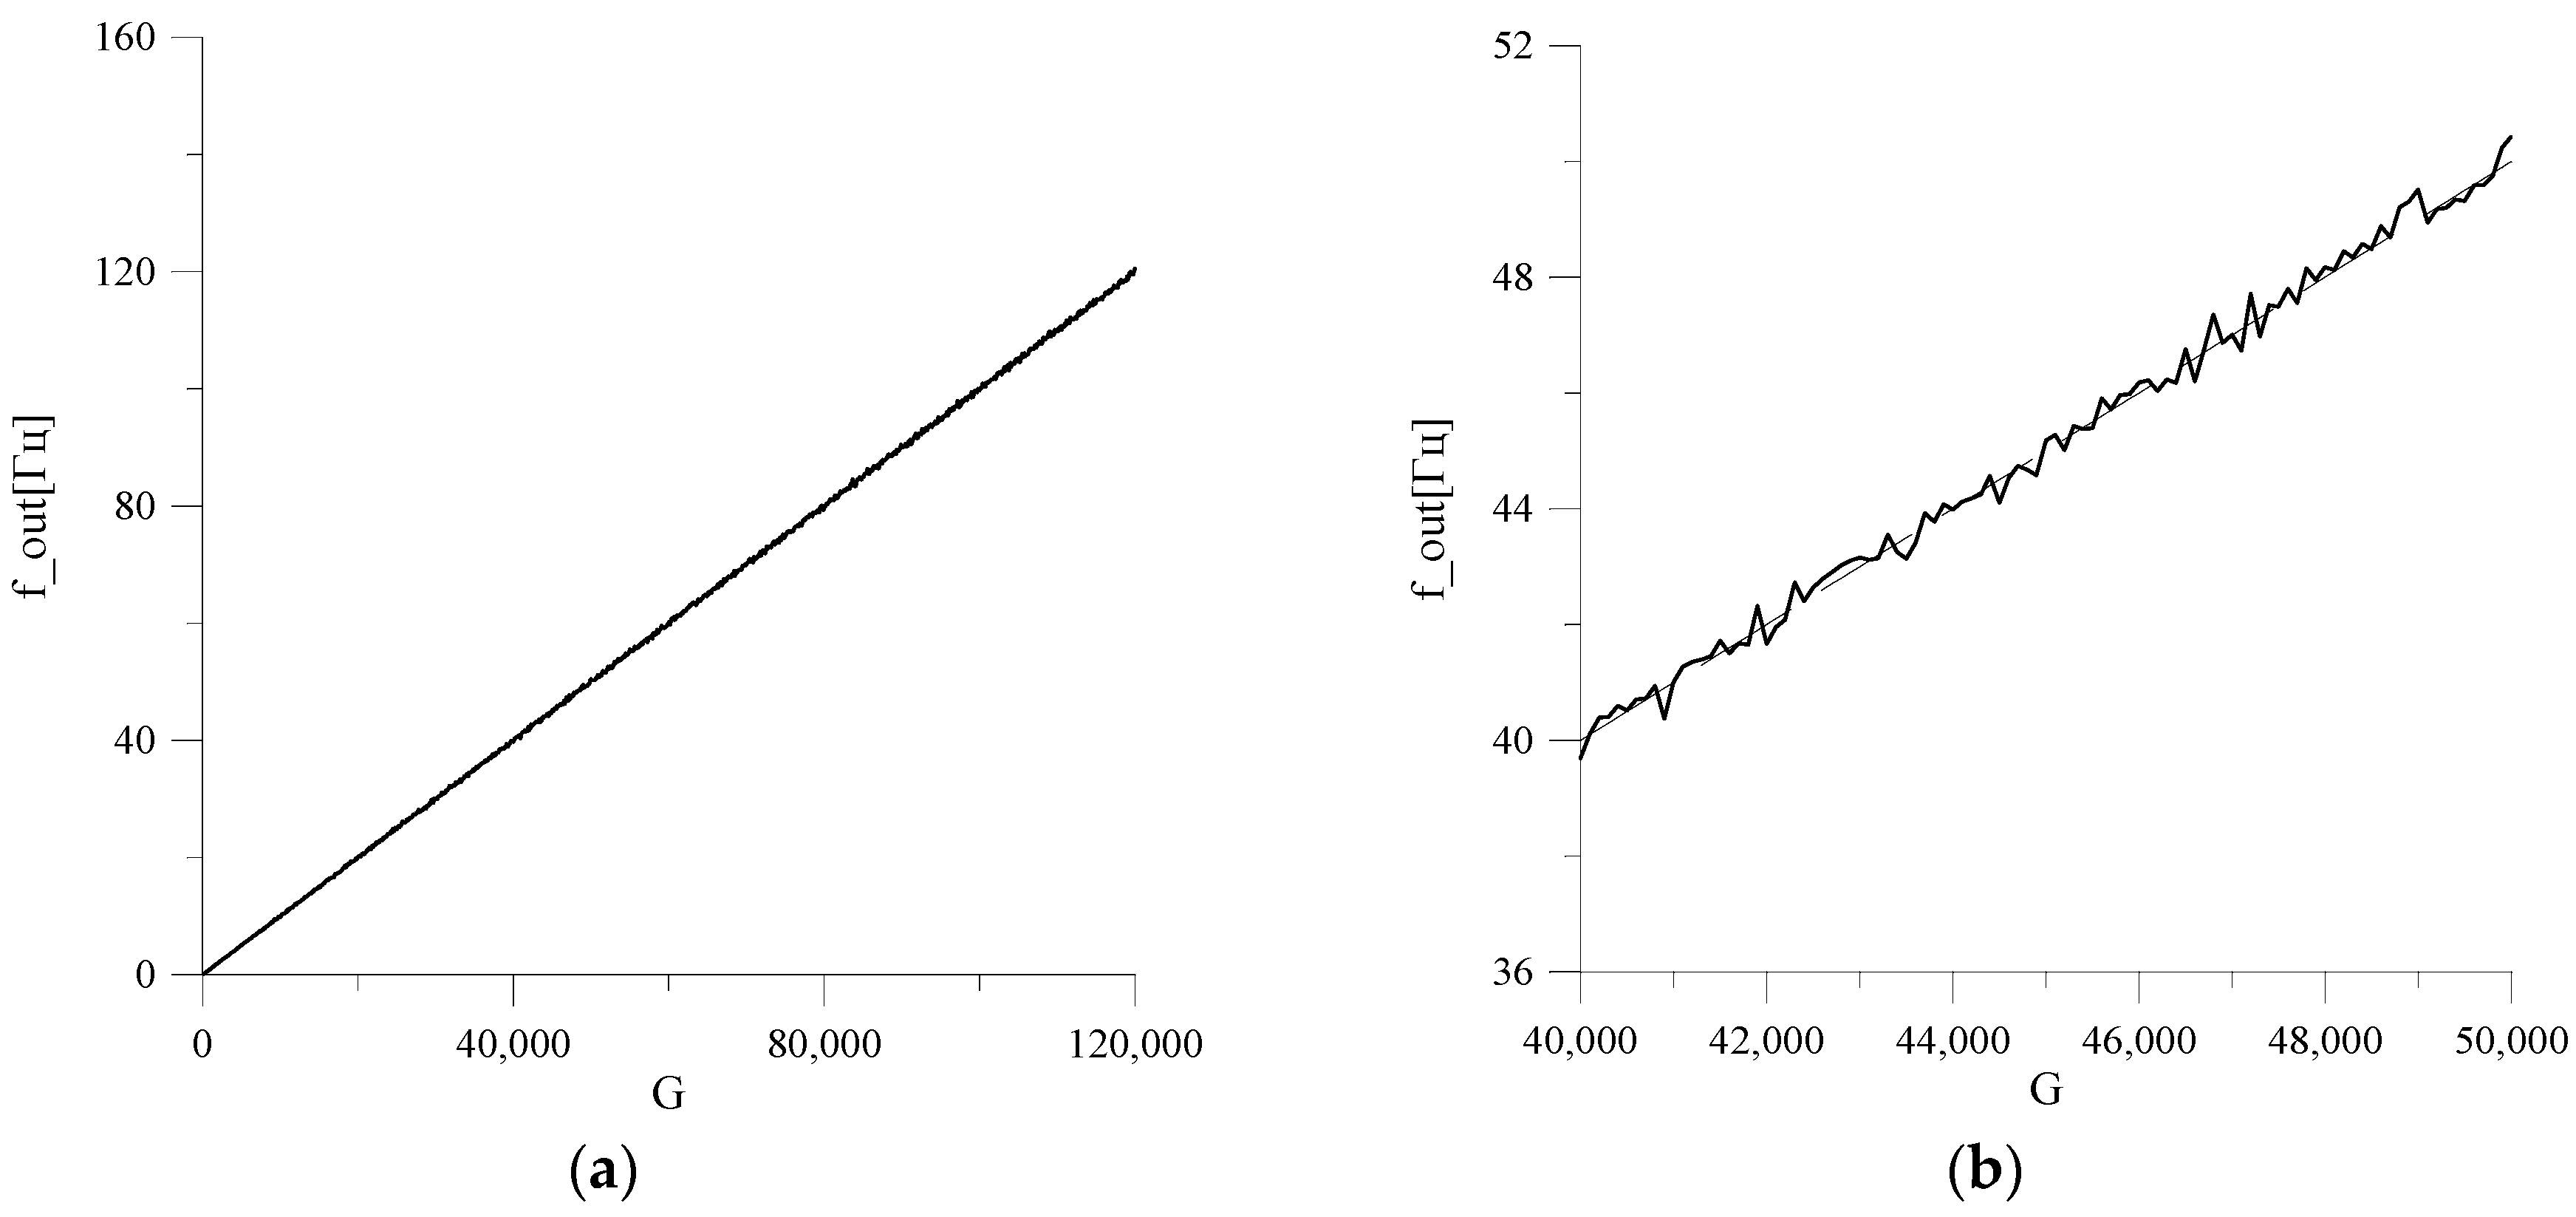
3.2. Dependence of the Average Value of the Output Signal Frequency on the Control Code

This section is divided by subheadings. It should provide a concise and precise description of the experimental results and their interpretation, as well as the experimental conclusions that can be drawn.
Figure 3a illustrates the dependence of the average frequency of the PPSG output pulse sequence on the control code G, while Figure 3b illustrates a fragment of that dependence.
Here solid lines show the dependences obtained by simulation, and dotted lines show theoretical values, calculated on the basis of Equation (3). Solid and dotted lines in Figure 3a almost coincide. To specify the calculations, it was accepted that f m = 1000   Hz . All real dependences were obtained for the condition of formation of the LS output signal correspondingly with logical Equation (8) and explained initial states Rg1–Rg5: G, 0, 0, 0, 0, correspondingly.
Thus, the dependences of the values of the average frequency of the output pulse sequence of the generator from the control code, obtained as a result of simulation, were close to theoretical. That practically allowed the use of Equation (3) while determining the average frequencies of the PPSG output signal.

3.3. Investigation of the PPSG Based on MAFG When q = 6

3.3.1. Determining the MAFG Repetition Period

Dependence of the repetition period T n on the number of involved members of Equation (2) is presented in Table 2. The following initial states of the registers Rg1–Rg5, correspondingly 1, 0, 0, 0, 0, were obtained.

3.3.2. Determination of Statistical Characteristics and the Range of Values of the Control Code

Investigation results of the PPSG statistical characteristics based on MAFG for q = 6 are presented in Figure 4.
The results were obtained for the same values of the parameters of the quality assessing method of the pulse sequence, as in the previous case (for q = 3 ): n m a x = 1000 , k c = 10 , χ c r 2 = 25 .
Output signal of the logic scheme LS was formed according to the following expression:
a = ( a 0 0 a 0 1 a 0 2 a 0 3 ) ( a 1 0 a 1 1 a 1 2 a 1 3 ) ( a 2 0 a 2 1 a 2 2 a 2 3 ) ( a 3 0 a 3 1 a 3 2 a 3 3 ) ( a 4 0 a 4 1 a 4 2 a 4 3 ) ( a 5 0 a 5 1 a 5 2 a 5 3 )
where the initial settings of registers Rg1–Rg5 were correspondingly the following: G, 0, 0, 0, 0.
Control code range values G ( G 1 ÷ G 2 ) , in which the output pulse sequence corresponded to the Poisson distribution law, in this case (when q = 6 ), was determined by the following equation.
G 1 = 1 , G 2 = 111010
In this case the value G 1 = 1 , determined as a result of simulation, coincided with the value G 1 , determined theoretically by Expression (6):
G 10 q k c n m a x T n = 10 6 10 10 3 10 10 = 10 0 .

3.4. Dependence of the OUTPUT Signal Frequency Average Value on the Control Code

Figure 5a illustrates the dependence of the output of the PPSG’s pulse sequence average frequency on the control code G, while Figure 5b shows a fragment of this dependence.
Here, similarly to Figure 3, solid lines illustrate the dependences obtained by simulation, and dotted lines illustrate theoretical values, calculated on the basis of Equation (3). Solid and dotted lines in Figure 5a almost coincide. It was accepted that. f m = 1000   Hz . All the real dependences were obtained under the condition of LS output signal formation according to the logic of Equation (11) and the above-justified initial states Rg1–Rg5: G, 0, 0, 0, 0, correspondingly.
The fundamental difference between the dependencies presented in Figure 3 and Figure 5 is that they were obtained using different values for the control code step changing G Δ G : in Figure 3 (for q = 3 ) when Δ G = 1 ; while in Figure 5 (for q = 6 ) when Δ G = 1000 .
A decrease in value Δ G for q = 6 , led to some ambiguity in establishing the average frequency value of the PPSG output sequence. This is illustrated in Figure 6 where the dependences were similar to the dependences in Figure 5, for Δ G = 100 .

3.5. Comparing PPSG Characteristics Based on MAFG for q = 3 and q = 6

Increasing the number of decades of the generator could significantly increase the repetition period of the sequence of numbers in the MAFG output and, thus, also the pulse sequence period of the PPSG output. However, this did not lead automatically to an increase in the generator’s “distinguishing ability” concerning the established value of the output sequence average frequency f o u t , which was actually setting the ability to specify the changing step f o u t Δ f o u t .
The performed research showed that “distinguishing ability”, at a fixed value for the number of decades q, depended on the initial settings of the registers Rg1–Rg5 and on the involved members of Equation (2), which determined the logic of signal generation on the output of the LS scheme. In this case, the statistical characteristics of the original sequence depended on these parameters. Taking into account the above considerations, improving a generator’s “distinguishing ability” could be the subject of a separate study.
As far as increasing the number of decades from q = 3 to q = 6 , during the above-mentioned conditions, in fact did not lead to an increase in the PPSG’s “distinguishing ability” (decreasing Δ f o u t ) and expanded the range f o u t . For future work, it would be worth considering the possibility of the practical use of this generator when q = 3 .

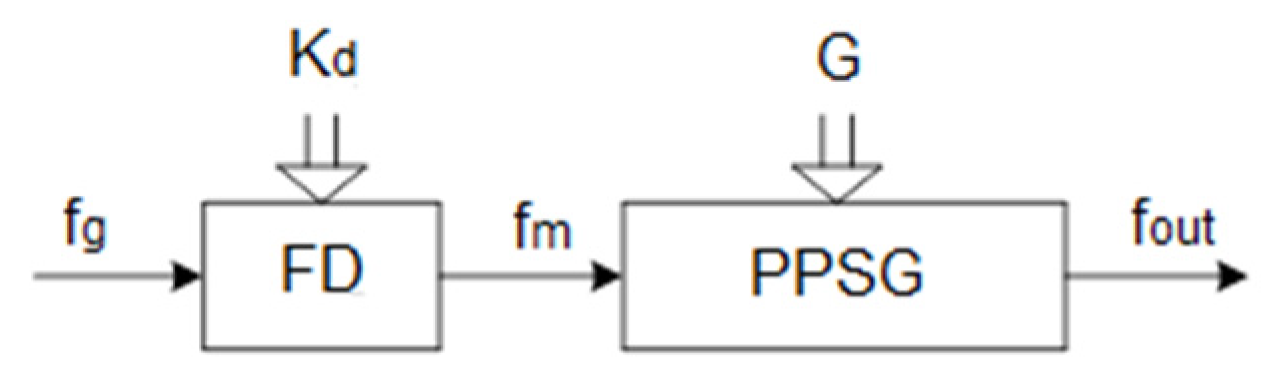
3.6. Using the PPSG Based on the MAFG When q = 3

Figure 7 shows the structural scheme of the device, in which to expand the range of average values of the output frequency, an additional frequency divider FD was introduced.
At the FD output the clock pulse sequence was formed for the PPSG, the frequency of which was determined by the equation
f m = f g K d
where K d is the division factor FD and f g is the reference generator frequency.
Some generator parameters are presented in the Table 3, of which one is presented in Figure 7, when f g = 1 MHz. The PPSG was implemented based on the MAFG for q = 3 , while its internal parameters corresponded to the above: the output signal of the logic scheme LS was formed by the expression (8), and the initial states of the registers Rg1–Rg5 were G, 0, 0, 0, 0, correspondingly. This allowed us to tell whether the statistical characteristics of the output pulse sequence in the given ranges of values f o u t , corresponded to Poisson’s law of distribution.
The construction of PPSGs based on MAFGs, all elements of which, except those of the LS, work in binary-decimal code, improves significantly the quality of the output sequence. This was confirmed by a generalized technique for studying parameters of the PPSG output pulse sequence for compliance with the Poisson distribution law using the Pearson test. Investigations of the proposed solutions illustrated that the dependences of the average frequency values of the generator’s output pulse sequence from the control code, obtained as a result of simulation, were close to the theoretical ones. It was shown that the number of decades was enough to choose q = 3 , because greater numbers of decades did not actually lead to an increased “distinguishing ability” for the PPSG; while scheme realization would be more complicated in that case. In order to expand the output frequency average values the introduction of a division factor into the PPSG structural scheme was proposed, which would be divided by the frequency of the reference generator. The question of the selecting number of the equation members to calculate the logical variable a, the value of which was obtained at the LS output, was rather significant. The number of data members of the equation and approaches to their choice significantly affected the size of the repetition period T n . Further research is needed in this direction in order to improve the initial characteristics of the PPSG and increase its performance.

4. Discussion

4.1. Structural Scheme of the Simulator for the Authentication Bit Templates and the Principle of Its Operation

Real bit templates of the internal electrical noise of desktop computers (PC), which are calculated according to the normalized autocorrelation function, have a length of 1000 bits and contain approximately the same number of zero bits “0” and single bits “1”. When comparing a pair of real-time templates of one PC, it turns out that they match for most positions. Only a few positions will have inverted bits. The positions of the inverted bits do not match for different pairs of templates. A comparison of the real-time bit noise templates of two different PCs showed much less similarity. The Hamming distances between the noise templates of different PCs were 5–10 times larger than the distances between the real-time noise templates of each PC. The developed Poisson pulse sequence generator made it possible to reproduce these properties.
The generator for q = 6 and G = 10,000 formed a bit sequence A, which contained mainly zero bits “0”, and the number of single bits “1” for every thousand bits was an average of 10. The positions of the single bits in each fragment of 1000 bits did not match. Therefore, to simulate the real-time templates of the same device, it was advisable to choose the control code of the generator G = 10,000. On average, the Hamming distance between a pair of such fragments will be 20. If at q = 6 the value of the control code G = 100,000, for the generated sequence B, the number of single bits “1” per thousand bits was on average equal to 100. The Hamming distance between two 1000-bit fragments of sequence B will be on average 200. The formation of fragments of bit sequences A and B is shown in Figure 8.
From the beginning, the generation process was set, so the first 1000 bits were discarded for both sequence A (A0) and sequence B (B0).
A combination (direct sum) of fragments of sequences A and B was used to form bit templates. For each electronic device, a reference template was first created, and the real-time templates were compared with it. To form a reference bit template for electronic device N, there was a need to combine one 1000-bit fragment of sequence B, for example B N with one 1000-bit fragment of sequence A, for example A 1 , Figure 9.
The fragment AM was used instead of A 1 to form the real-time template M of electronic device N. The bit templates of the electronic device N were calculated by the expression
B T N M = B N A M .
The structural scheme of the bit template simulator is shown in Figure 10.
The simulator functions were as follows. First, sequences A and B were generated and stored in the memory. To generate them, one could use one PPSG, which was started first with a control code G = 10,000, and then with a control code G = 100,000. Sequences were written to memory. Two PPSGs and two memory blocks were used to illustrate the process of forming and storing the necessary sequences in the scheme of Figure 10. The request Q for the template arrived at the control block, which sent a request to the memory for the required 1000-bit fragments of the A M of sequence A and B N of sequence B. Fragments A M and B N arrived at the adder, where the template B T N M was formed.

4.2. Results of the Simulation Experiment

Comparative analysis of the standard template set B T J 1 of individual devices J was performed for ten devices. The Hamming distances H ( B T J 1 , B T I 1 ) between pairs of standard template devices J and I were calculated. The calculated distances led to the following results in Table 4.
The results in Table 4 were obtained for the 90 distances, I = 1 . . 10 ,   J = 1 . . 10 , I J . Each template was characterized by the template group—standard templates and real-time templates. For successful device authentication distances within each group needed to be significantly lower than the distances between standard templates. To check the adequacy of the proposed simulator model, two types of comparisons should be performed: the first type compares distances inside of the each group (for the each device), while the second one compares distances between different groups (between the different devices).
Simulation experiments were performed to generate templates for two devices, 10 templates for each. The distances between different templates M K of one device N (group H1, intradistances) and distances between different templates M K of two devices N L (group H2, interdistances) were found, only 90 distances for each group. The distances between bit templates were calculated by the following expressions.
H 1 ( M , N ) = H ( B T N M , B T N K ) , H 2 ( M , N ) = H ( B T N M , B T L K ) .
The distances for M = K corresponded to the comparison of the reference template with itself for the same device and the comparison of the reference templates of two devices, and were not taken into account.
The results of calculations using Expression (16) are presented in Figure 11. The left side of the figure shows the distances between pairs of templates for the same device. (intradistances), whose numbers are indicated by columns and rows. The right side of the figure illustrates the distances between pairs of templates for different devices (interdistances).
The threshold value must be set in such a way to provide reliable authentication. For our calculations, as could be seen from Figure 12, the threshold value needed to exceed the maximum distance value of the intradistance group and be less than the minimum distance value of the interdistance group. In that case FRR and FAR were equal to zero.
The results of calculations of the distance distribution of group H1 for N = 1 and group H2 for N = 1 , L = 2 are presented in Figure 12 as histograms.
The characteristics of the distance distribution are shown in Table 5.
The distance between the histograms was 150 bits, providing unambiguous authentication between the two devices. The average values were in good agreement with the theoretical estimates.
The repetition period for the developed generator under certain conditions was not less than 10 9 (Table 2). This allowed the estimation of the possible number of authenticated devices, which was determined by the repetition period and the length of the fragments of the sequence B, which was 106. The same estimate was valid for the number of authentication requests for each of the devices. These estimates determined the class of tasks for which the proposed model could be applied. For example, it could be a large enough network with up to a million devices. If you accept the service life of each device as 10 years, then such a device could be authenticated up to 250 times a day.
Let us compare the obtained simulation results with the existing practice, which uses authentication by internal electrical noise [8]. For comparison, the following parameters were selected: authentication reliability, the number of devices in the corporate network that could be simultaneously authenticated, the bit template calculation time. The results are presented in the Table 6.
As can be seen, the proposed method in the article provided better performance compared to the practice of authentication by internal electrical noise.

5. Conclusions

As a result of this research we executed the modeling of bit templates for information-processing electronic device authentication on the basis of the pulse Poisson sequences generator. For the purposes of the study, the Poisson pulse sequence generator was developed based on a modified additive Fibonacci generator. The developed generator had improved statistical characteristics for the output pulse sequence and expanded capabilities for solving specific practical problems.
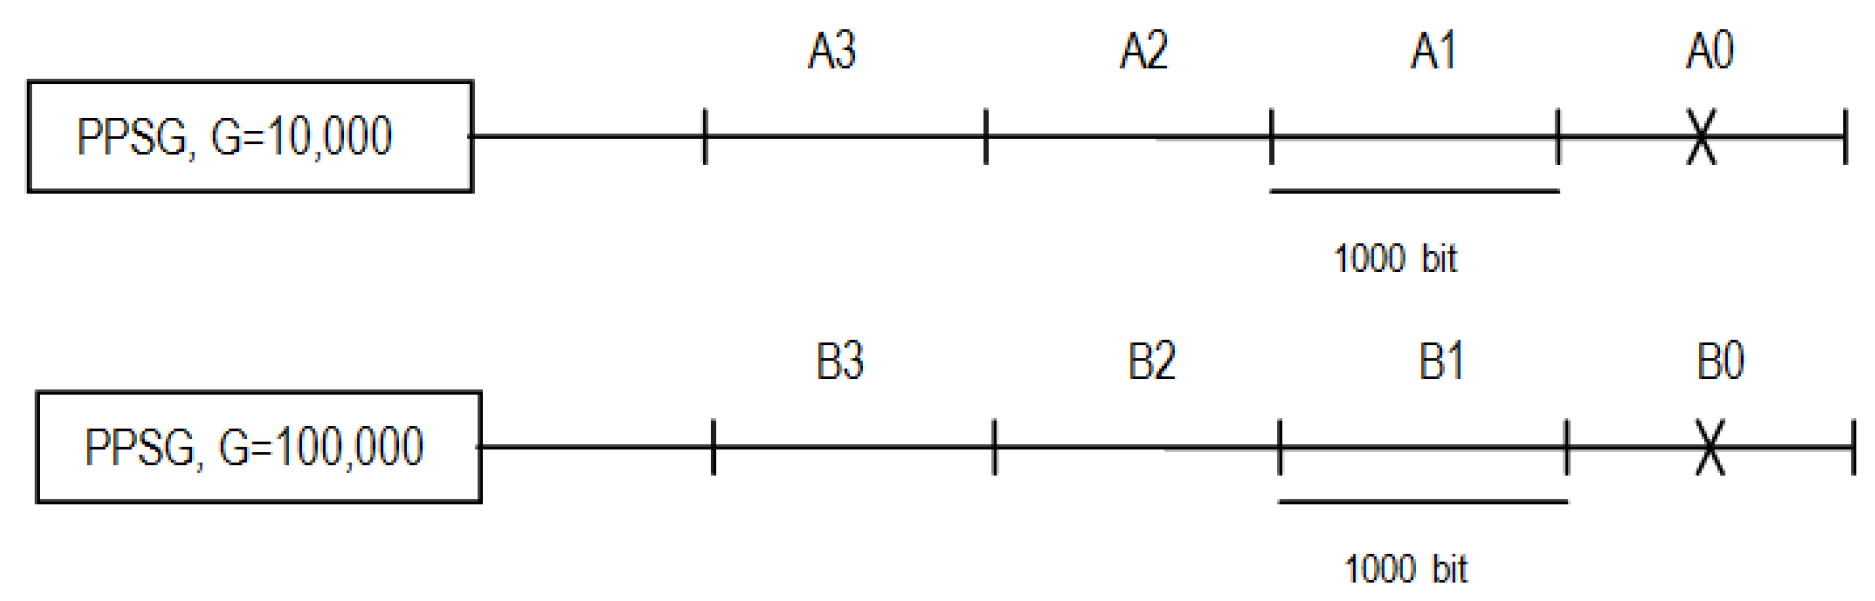
The proposed simulator scheme contained two generators. The generator for the value of the control code G = 10,000 formed a bit sequence A, fragments of which had properties of the real-time templates of each device. The generator for the value of the control code G = 100,000 formed a bit sequence B, fragments of which reflected the difference between the series of real-time templates of different devices. In the bit template of the device, these properties were preserved by applying the action of the direct sum of fragments of sequences A and B.
An imitation experiment to generate templates for two devices confirmed the effectiveness of the proposed simulator. The properties of the generated bit templates allowed them to be used for the purpose of unambiguous authentication of information-processing electronic devices.
Further research will focus on protecting such bit templates from a variety of attacks. From the authors’ point of view, the direction of detecting acoustic traps in speech recognition systems is also promising for the application of Poisson pulse sequence generators [36,37].

Author Contributions

Conceptualization, V.M. and E.N.; methodology, V.M. and C.J.; software, O.H.; validation, Y.L., M.R. and E.N.; formal analysis, C.J., M.S. and O.H.; investigation, V.M, E.N., C.J., M.S., O.H., Y.L. and M.R.; writing—original draft preparation, V.M., E.N. and M.S.; writing—review and editing, Y.L., C.J. and M.R.; supervision, E.N.; project administration, Y.L.; funding acquisition, E.N. and C.J. All authors have read and agreed to the published version of the manuscript.

Funding

This research was funded by CRDF Global, Grant Agreement G-202102-67366 “Developing software and hardware complex for dynamical authentication of information processing devices in a corporate network for cybersecurity purposes”, supported by the U.S. Department of State, the Bureau of European and Eurasian Affairs.

Institutional Review Board Statement

Not applicable.

Informed Consent Statement

Not applicable.

Data Availability Statement

Not applicable.

Conflicts of Interest

The authors declare no conflict of interest.

References

  1. Qureshi, M.; Munir, A. PUF-IPA: A PUF-based Identity Preserving Protocol for Internet of Things Authentication. In Proceedings of the 2020 IEEE 17th Annual Consumer Communications & Networking Conference (CCNC), Las Vegas, NV, USA, 10–13 January 2020. [Google Scholar] [CrossRef]
  2. Scholz, A.; Zimmermann, L.; Sikora, A.; Tahoori, M.B.; Aghassi-Hagmann, J. Embedded Analog Physical Unclonable Function System to Extract Reliable and Unique Security Keys. Appl. Sci. 2020, 10, 759. [Google Scholar] [CrossRef] [Green Version]
  3. Hasse, J.; Gloe, T.; Beck, M. Forensic identification of GSM mobile phones. In Proceedings of the first ACM Workshop on Information Hiding and Multimedia Security, Montpellier, France, 17–19 June 2013. [Google Scholar] [CrossRef]
  4. Svoboda, J.; Schanfein, M. Transducer Signal Noise Analysis for Sensor. In Proceedings of the 53rd Annual INMM Meeting, Idaho Falls, ID, USA, 15–19 July 2012. [Google Scholar]
  5. Chouchang, Y.; Alanson, P. Sample EM–ID: Tag–less Identification of Electrical Devices via Electromagnetic Emissions. In Proceedings of the 2016 IEEE International Conference on RFID (RFID), Orlando, FL, USA, 3–5 May 2016. [Google Scholar] [CrossRef]
  6. Wang, X.; Zhang, Y.; Zhang, H. Identification and authentication for wireless transmission security based on RF-DNA fingerprint. J. Wirel. Com. Netw. 2019, 230. [Google Scholar] [CrossRef] [Green Version]
  7. Nyemkova, E. Authentication of Personal Computers with Unstable Internal Noise. Int. J. Comput. 2020, 19, 569–574. [Google Scholar] [CrossRef]
  8. Sikora, A.; Nyemkova, E.; Lakh, Y. Accuracy Improvements of Identification and Authentication of Devices by EM-Measurements. In Proceedings of the 2020 IEEE 5th International Symposium on Smart and Wireless Systems within the Conferences on Intelligent Data Acquisition and Advanced Computing Systems (IDAACS-SWS), Dortmund, Germany, 17–18 September 2020. [Google Scholar] [CrossRef]
  9. Kuźmiński, Ł. Using the Poisson Distribution to Estimate the Risk of Hydrological Danger. Studia Ekon. Uniw. Ekon. W Katowicach 2014, 206, 7–19. (In Polish) [Google Scholar]
  10. Deon, A.; Menyaev, Y. Poisson Twister Generator by Cumulative Frequency Technology. Algorithms 2019, 12, 114. [Google Scholar] [CrossRef] [Green Version]
  11. Kim, D.; Kim, J.; Cho, Y.S. A Poisson Cluster Stochastic Rainfall Generator that Accounts for the Interannual Variability of Rainfall Statistics: Validation at Various Geographic Locations across the United States. J. Appl. Math. 2014, 560390. [Google Scholar] [CrossRef]
  12. Bentley, M.; Stephenson, A.; Toscas, P.; Zhu, Z. A Multivariate Model to Quantify and Mitigate Cybersecurity Risk. Risks 2020, 8, 61. [Google Scholar] [CrossRef]
  13. Leslie, N.O.; Harang, R.E.; Knachel, L.P.; Kott, A. Statistical Models for the Number of Successful Cyber Intrusions. J. Def. Modeling Simul. 2018, 15, 49–63. [Google Scholar] [CrossRef] [Green Version]
  14. Veiga, A.; Spinelli, E. A Pulse Generator with Poisson-Exponential Distribution for Emulation of Radioactive Decay Events. In Proceedings of the IEEE 7th Latin American Symposium on Circuits & Systems (LASCAS), Florianopolis, Brazil, 28 February–2 March 2016. [Google Scholar] [CrossRef]
  15. Arkani, M.; Khalafi, H.; Vosoughi, N. A Flexible Multichannel Digital Random Pulse Generator Based on FPGA. World J. Nucl. Sci. Technol. 2013, 3, 109–116. [Google Scholar] [CrossRef] [Green Version]
  16. Maksymovych, V.; Mandrona, M.; Harasymchuk, O. Dosimetric Detector Hardware Simulation Model Based on Modified Additive Fibonacci Generator. In Advances in Intelligent Systems and Computing; Hu, Z., Petoukhov, S., Dychka, I., He, M., Eds.; Springer: Cham, Switzerland, 2020; Volume 938, pp. 162–171. [Google Scholar]
  17. Maksymovych, V.N.; Harasymchuk, O.I.; Mandrona, M.N. Designing Generators of Poisson Pulse Sequences Based on the Additive Fibonacci Generators. J. Autom. Inf. Sci. 2017, 49, 1–13. [Google Scholar] [CrossRef]
  18. Maksymovych, V.; Harasymchuk, O.; Opirskyy, I. The Designing and Research of Generators of Poisson Pulse Sequences on Base of Fibonacci Modified Additive Generator. In Advances in Intelligent Systems and Computing; Hu, Z., Petoukhov, S., Dychka, I., He, M., Eds.; Springer: Cham, Switzerland, 2018; Volume 754, pp. 43–53. [Google Scholar]
  19. Pomme, S.; Keightley, J.; Fitzgerald, R. Uncertainty of Nuclear Counting. Metrologia 2015, 53. [Google Scholar] [CrossRef] [Green Version]
  20. Takami, K.; Shin-ichi, N.; Shigeru, Y. A Generation of Random-Time Pulses Having a Poisson Distribution. Keisoku Jido Seigyo Gakkai Ronbunshu 1981, 17, 409–414. [Google Scholar]
  21. Linares-Barranco, A.; Cascado, D.; Jimenez, G.; Civit, A.; Oster, M.; Linares-Barranco, B. Poisson AER Generator: Inter-Spike-Intervals Analysis. In Proceedings of the 2006 IEEE International Symposium on Circuits and Systems, Kos, Greece, 21–24 May 2006. [Google Scholar] [CrossRef]
  22. Maksymovych, V.; Shabatura, M.; Harasymchuk, O.; Karpinski, M.; Jancarczyk, D.; Sawicki, P. Development of Additive Fibonacci Generators with Improved Characteristics for Cybersecurity Needs. Appl. Sci. 2022, 12, 1519. [Google Scholar] [CrossRef]
  23. Mandrona, M.M.; Maksymovych, V.M.; Harasymchuk, O.I.; Kostiv, Y.M. Generator of Pseudorandom Bit Sequence with Increased Cryptographic Immunity. Metall. Min. Ind. 2014, 5, 25–29. [Google Scholar]
  24. Maksymovych, V.; Harasymchuk, O.; Karpinski, M.; Shabatura, M.; Jancarczyk, D.; Kajstura, K. A New Approach to the Development of Additive Fibonacci Generators Based on Prime Numbers. Electronics 2021, 10, 2912. [Google Scholar] [CrossRef]
  25. Mandrona, M.N.; Maksymovych, V.N. Comparative Analysis of Pseudorandom Bit Sequence Generators. J. Autom. Inf. Sci. 2017, 49, 78–86. [Google Scholar] [CrossRef]
  26. Maksymovych, V.M.; Mandrona, M.M.; Garasimchuk, O.I.; Kostiv, Y.M. A Study of the Characteristics of the Fibonacci Modified Additive Generator with a Delay. J. Autom. Inf. Sci. 2016, 48, 76–82. [Google Scholar] [CrossRef]
  27. Maksymovych, V.N.; Mandrona, M.N.; Kostiv, Y.M.; Harasymchuk, O.I. Investigating the Statistical Characteristics of Poisson Pulse Sequences Generators Constructed in Different Ways. J. Autom. Inf. Sci. 2017, 49, 11–19. [Google Scholar] [CrossRef]
  28. Blanco, A.; Orúe, A.B.; López, A.; Martín, A. On-the-Fly Testing an Implementation of Arrow Lightweight PRNG Using a LabVIEW Framework. In Advances in Intelligent Systems and Computing; Kacprzyk, J., Ed.; Springer: Cham, Switzerland, 2019; Volume 951, pp. 175–184. [Google Scholar]
  29. Jakobsson, K.S. Theory, Methods and Tools for Statistical Testing of Pseudo and Quantum Random Number Generators. Master’s Thesis, Linköpings Universitet, Linköping, Sweden, 2014; p. 143. [Google Scholar]
  30. Faster Randomness Testing with the NIST Statistical Test Suite. Available online: https://crocs.fi.muni.cz/_media/public/crocs/sys_space_2014.pdf (accessed on 20 December 2021).
  31. Gorbenko, I.D.; Gorbenko, Y.I. Applied Cryptology: Theory Practice Application; Fort Publishing House: Kharkiv, Ukraine, 2012; p. 880. [Google Scholar]
  32. Holland, R.; St. John, R. Chi square variants: The lehman distribution. In Statistical Electromagnetics Book; CRC Press: Boca Raton, FL, USA, 1999; p. 48. [Google Scholar] [CrossRef]
  33. Almeida, F.M.L., Jr.; Barbi, M.; do Vale, M.A.B. A Proposal for a Different Chi-Square Function for Poisson Distributions. Nucl. Instrum. Methods Phys. Res. Sect. A Accel. Spectrometers Detect. Assoc. Equip. 2000, 449, 383–395. [Google Scholar] [CrossRef] [Green Version]
  34. Horoneskul, M. Tables of Functions and Critical Distribution Points. Sections: Probability Theory. Mathematical Statistics, Mathematical Methods in Psychology. 2009. (in Ukrainian). Available online: http://repositsc.nuczu.edu.ua/bitstream/123456789/1530/1/Tablici.pdf (accessed on 20 December 2021).
  35. NIST SP 800-22. A Statistical Test Suite for Random and Pseudorandom Number Generators for Cryptographic Applications. Available online: http://csrc.nist.gov/publications/nistpubs/800-22-rev1a/SP800-22rev1a.pdf (accessed on 20 December 2021).
  36. Kwon, H.; Yoon, H.; Park, K.-W. Acoustic-decoy: Detection of adversarial examples through audio modification on speech recognition system. Neurocomputing 2020, 417, 357–370. [Google Scholar] [CrossRef]
  37. Kwon, H.; Kim, Y.; Yoon, H.; Choi, D. Selective Audio Adversarial Example in Evasion Attack on Speech Recognition System. IEEE Trans. Inf. Forensics Secur. 2019, 15, 526–538. [Google Scholar] [CrossRef]
Figure 1. PPSG structural scheme based on MAFG.
Electronics 11 02039 g001
Figure 2. PPSG statistical characteristics based on MAFG ( q = 3 ) : (a) the value χ c 2 ; (b) the average value of the last five (current) values χ c 2 χ c a v 2 ; (c) number of values χ c a v 2 greater than χ c r 2 . G—control code value.
Electronics 11 02039 g002
Figure 3. The value of the average frequency of the PPSG output signal based on MAFG ( q = 3 ) when Δ G = 1 : (a) the dependence of the average frequency on the control code G; (b) the fragment of that dependence. G—control code value.
Electronics 11 02039 g003
Figure 4. PPSG statistical characteristics based on MAFG ( q = 6 ) : (a) the value χ c 2 ; (b) the average value of the last five (current) values χ c 2 χ c a v 2 ; (c) number of values χ c a v 2 greater than χ c r 2 . G—control code value.
Electronics 11 02039 g004aElectronics 11 02039 g004b
Figure 5. Output signal average frequency of the PPSG based on MAFG ( q = 6 ) , when Δ G = 1000 : (a) the dependence of the average frequency on the control code G; (b) the fragment of that dependence. G—control code value.
Electronics 11 02039 g005
Figure 6. Output signal average frequency of the PPSG based on MAFG ( q = 6 ) , when Δ G = 100 : (a) the dependence of the average frequency on the control code G; (b) the fragment of that dependence. G—control code value.
Electronics 11 02039 g006
Figure 7. Structural scheme of the Poisson pulse sequence generator with an extended range of average values in the output frequency.
Electronics 11 02039 g007
Figure 8. Derivation of groups A and B of bit sequences with a length of 1000 bits for the subsequent formation of bit templates.
Electronics 11 02039 g008
Figure 9. Formation of reference and real-time templates by two simulators, t i is the time of template formation.
Electronics 11 02039 g009
Figure 10. The structural scheme of the bit template simulator based on the PPSG.
Electronics 11 02039 g010
Figure 11. Distances between pairs of templates of the same device (top) and two different devices (bottom).
Electronics 11 02039 g011
Figure 12. Histograms of the distance distribution between bit templates of one device (intradistances) and two devices (interdistances).
Electronics 11 02039 g012
Table 1. Dependence T n on output signal a of the logical scheme LS, q = 3 .
aTn
a = 0 18,599
a = a 0 0 18,599
a = a 0 0 a 0 1 103,404,839
a = a 0 0 a 0 1 a 0 2 4,348,679
a = a 0 0 a 0 1 a 0 2 a 0 3 20,121,479
a = a 0 0 a 0 1 a 0 2 a 0 3 a 1 0 > 10 9
a = ( a 0 0 a 0 1 a 0 2 a 0 3 ) ( a 1 0 a 1 1 a 1 2 a 1 3 ) ( a 2 0 a 2 1 a 2 2 a 2 3 ) > 10 9
Table 2. Dependence of T n on the output signal a of a logical scheme LS ( q = 6 ) .
aTn
a = 0 9,255,555
a = a 0 0 4,649,999
a = a 0 0 a 0 1 > 10 9
a = a 0 0 a 0 1 a 0 2 > 10 9
a = a 0 0 a 0 1 a 0 2 a 0 3 > 10 9
a = a 0 0 a 0 1 a 0 2 a 0 3 a 1 0 > 10 9
a = ( a 0 0 a 0 1 a 0 2 a 0 3 ) ( a 1 0 a 1 1 a 1 2 a 1 3 ) ( a 2 0 a 2 1 a 2 2 a 2 3 ) ( a 3 0 a 3 1 a 3 2 a 3 3 ) ( a 4 0 a 4 1 a 4 2 a 4 3 ) ( a 5 0 a 5 1 a 5 2 a 5 3 ) > 10 10
Table 3. PPSG parameters with additional FD.
Kdfm [Hz]Gfout [Hz]Δfout [Hz]
11,000,000110001000
22000
10010,000
10100,0001100100
2200
10010,000
10010,00011010
220
1001000
10001000111
22
100100
10,00010010.10.1
20.2
10010
100,0001010.010.01
20.02
1001
1,000,000110.0010.1
20.002
1000.1
Table 4. The characteristics of the distance distribution between standard templates.
Average ValueStandard DeviationMinimum ValueMaximum Value
18410165205
Table 5. The characteristics of the distance distribution.
DistributionAverage ValueStandard DeviationMinimum ValueMaximum Value
Intradistances2361239
Interdistances2055189215
Table 6. Comparison results by efficiency parameters.
MethodReliabilityNumber of DevicesMeasuring Time, s
Internal electric noises98.61752
Simulator based on a PPSG1001,000,000-
Publisher’s Note: MDPI stays neutral with regard to jurisdictional claims in published maps and institutional affiliations.

