
Recent Advances in Machine Learning Applied to Ultrasound Imaging


Abstract
:1. Introduction
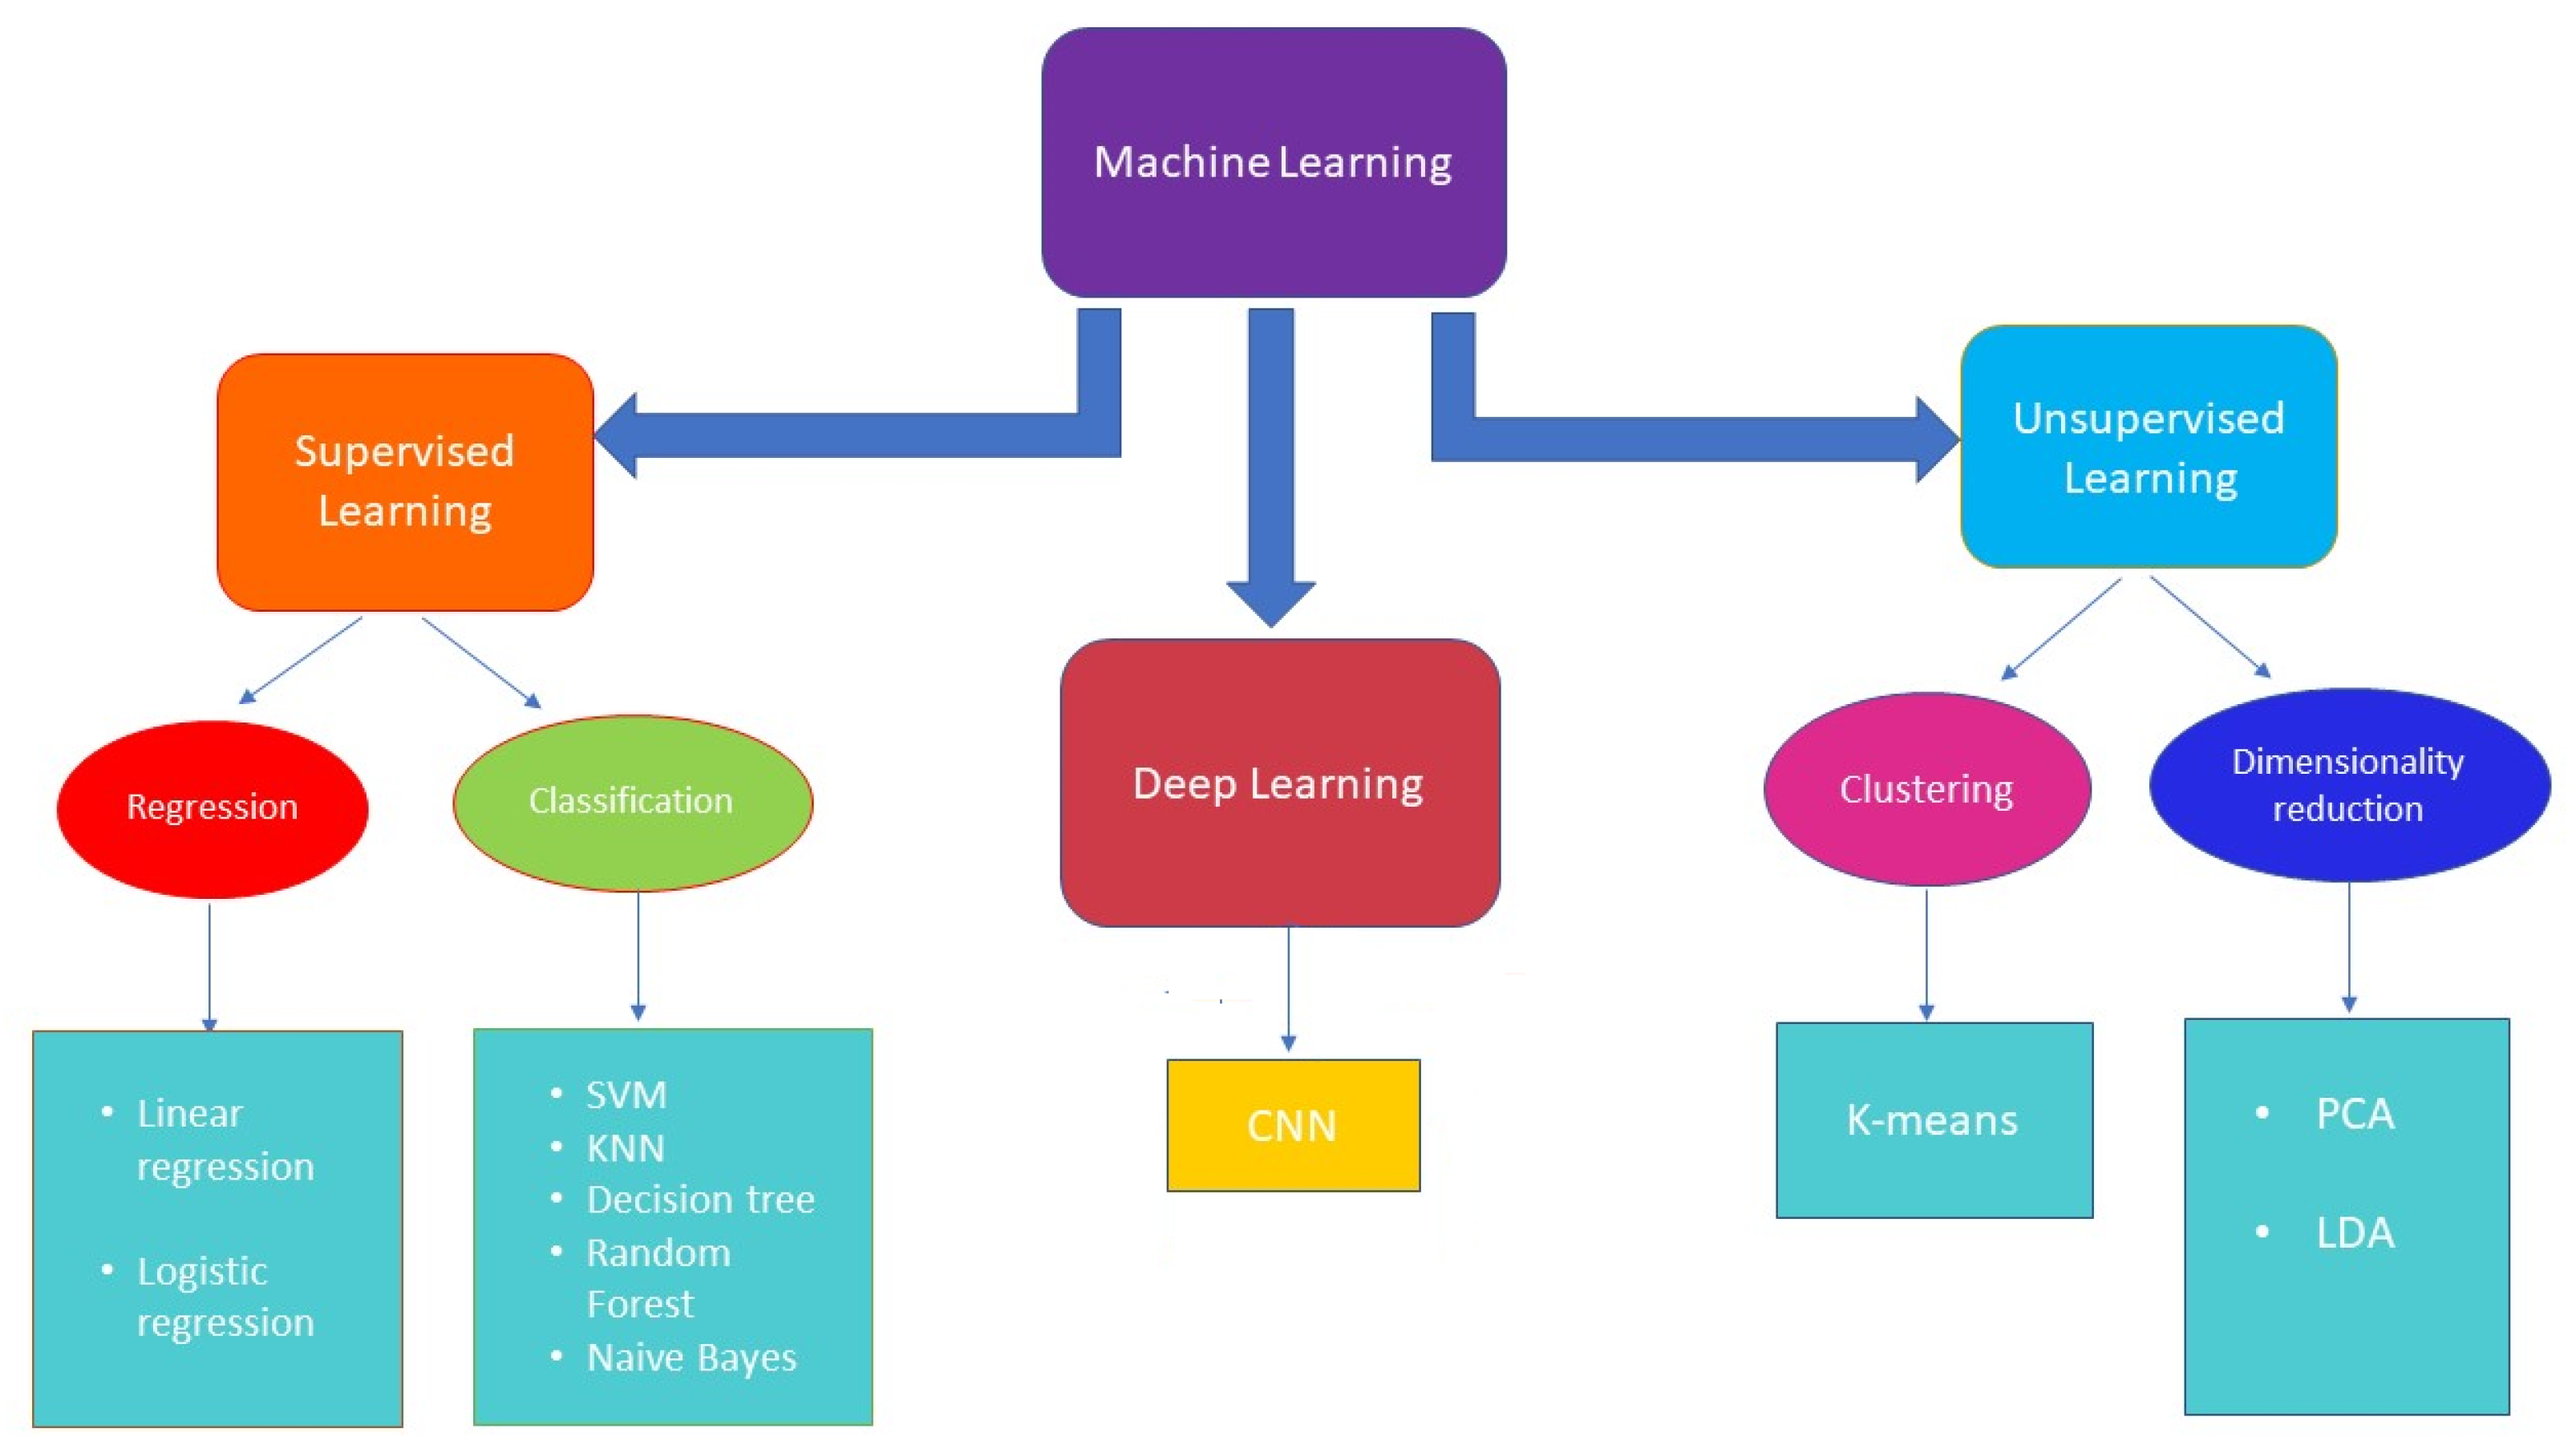
2. Machine Learning
- Linear regression, which establishes a relation between dependent variables (output) and independent variables (input) through a fitting line. Linear regression can be of two types: simple and multiple linear regression, where the first includes one independent variable, while the second includes two or more independent variables.
- Logistic regression, which is a statistical tool used to model a binomial result, i.e., binary problems with one or more explanatory variables. In this way, it is possible to describe the data and the relationship between a binary dependent variable and one or more independent variables.
- Naive Bayes is based on an underlying probabilistic model and enables capture of the uncertainty of a model by determining the probabilities of the outcomes. The Bayesian classification can solve predictive problems by providing practical learning algorithms and combining observed data. This classification provides a useful perspective for understanding and evaluating learning algorithms [32].
- Support vector machine (SVM) is a method for the classification of two groups of data points, which exploits a hyperplane that divides two categories of data points with the largest margin [33]. Linear SVM is the most simple form of an SVM classifier, where examples are represented as points in space and mapped out so that the examples belonging to two different categories are divided by a clear gap that maximizes the difference. The prediction of the category to which examples belong is made on the basis of the side on which they fall. SVM can be performed either linearly or non-linearly. Non-linear SVM results are useful when data are not separable linearly. This approach involves implementation of a kernel trick [31], a non-linear function which replaces the scalar product, thus maximizing the hyperspace. The most used kernels are polynomial and Gaussian.
- Decision tree, the goal of which is to create a model that predicts the value of a certain variable by learning some decision rules obtained from data features. It consists of a tree that classifies instances by sorting them based on feature values; each node of the decision tree is an instance feature to be classified and each branch corresponds to a value that can be assigned to the node. Basically, the procedure consists of classifying the instances and sorting them on their feature values [34].
- Random forest (RF) combines the output of multiple decision trees to reach a single result. The random forest algorithm is an extension of the bagging method because it utilizes both bagging and feature randomness to create an uncorrelated forest of decision trees. RF is employed for classification, regression, and other activity based on the construction of a multitude of decision trees during the training and generates the class that represents the overall prediction of the single trees. Random forest corrects the overfitting problem of decision trees [35].
- K-nearest neighbors (K-NN) aims to predict a new instance by knowing the data points which are separated into different classes. Specifically, within each class there are associated data points or instances, the set of which defines the data set. Its operation is based on the similarity of the characteristics; that is, the closer an instance is to a data point, the more the algorithm considers them similar. To evaluate the similarity, the algorithm uses some distance, such as Euclidean [36], Chebyshev [37], or Minkowski [38]. In addition to the distance, KNN plans to set a parameter k, chosen in an arbitrary way, which identifies the number of minimum distances; the class that obtains the greatest number of these distances is chosen as a prediction [39].
- Linear discriminant analysis (LDA) is a commonly used technique for supervised classification problems, which aims to reduce their dimensions. It is used for modeling differences in groups, i.e., separating two or more classes. It transfers features from higher to lower dimension spaces. LDA, as SVM, computes optimal hyperplanes with respect to their individual objectives. However, LDA hyperplanes are optimal only when the covariance matrices are identical for all of the classes, while SVM computes optimal hyperplanes without making an assumption [40].
- K-means clustering, which initially defines k centroids and iteratively selects the closest data points to each centroid and assigns them to the centroid itself [33].
- Principal component analysis (PCA) reduces the dimensionality of a data set consisting of many variables correlated with each other, either heavily or lightly, while retaining the variation present in the dataset, to the maximum extent. The same operation is performed by converting the original variables to a new set of variables, named principal components, which are orthogonal and are ordered in such a way that the retention of variation present in the original variables decreases by moving down the order [41].
3. Ultrasound Imaging
4. ML in US Medical Diagnostics
- the general issues related to organ diseases;
- the most recent papers on innovative ML techniques organized according to the methodology adopted: detection, segmentation and classification.
4.1. Breast
4.2. Arteries
4.3. Heart
4.4. Liver
- focal liver lesions, solid formations that can be benign or malignant,
- liver fibrosis, excessive accumulation of extracellular matrix proteins, such as collagen,
- fatty liver or liver steatosis, conditions based on the accumulation of excess fat in the liver,
- liver tumors.
4.5. Fetus
4.6. Lungs
4.7. Other Organs
- Prostate [190,191,192]: research activity has mainly focused on prostate segmentation on ultrasound images, fundamental in biopsy needle placement and radiotherapy treatment planning; it is quite challenging due to the relatively low quality of US images. In recent years, segmentation based on deep learning techniques has been widely developed due to several benefits compared to classical techniques which are difficult to apply in real-time image-guided interventions.
- Thyroid [88,134,193,194,195,196,197,198,199,200,201,202,203,204,205,206]: the risk of malignancy of thyroid nodules can be evaluated on the basis of nodule ultrasonographic characteristics, such as echogenicity and calcification. Much activity has been devoted to automate thyroid detection through CAD systems, mainly based on CNN.
- Kidneys [207,208,209,210,211,212,213,214,215,216,217,218,219,220]: US image-based diagnosis are widely used for the detection of kidney abnormalities including cysts and tumors. For the early diagnosis of kidney diseases, DNN and SVM are very often used as machine learning models for abnormality detection and classification.
5. ML in US Non-Destructive Evaluation
6. Conclusions
Funding
Institutional Review Board Statement
Informed Consent Statement
Conflicts of Interest
References
- Sant’Ana, D.; Carneiro Brito Pache, M.; Martins, J.; Astolfi, G.; Pereira Soares, W.; Neves de Melo, S.; da Silva Heimbach, N.; de Moraes Weber, V.; Gonçalves Mateus, R.; Pistori, H. Computer vision system for superpixel classification and segmentation of sheep. Ecol. Inform. 2022, 68, 101551. [Google Scholar]
- Chabot, D.; Stapleton, S.; Francis, C. Using Web images to train a deep neural network to detect sparsely distributed wildlife in large volumes of remotely sensed imagery: A case study of polar bears on sea ice. Ecol. Inform. 2022, 68, 101547. [Google Scholar] [CrossRef]
- Ahmed, T.; Rahman, T.; Roy, B.; Uddin, J. Drone Detection by Neural Network Using GLCM and SURF Features. J. Inf. Syst. Telecommun. 2021, 9, 15–23. [Google Scholar] [CrossRef]
- Saad, A.; Mohamed, A. An integrated human computer interaction scheme for object detection using deep learning. Comput. Electr. Eng. 2021, 96, 107475. [Google Scholar] [CrossRef]
- Thakkar, H.; Desai, A.; Singh, P.; Samhitha, K. ReLearner: A Reinforcement Learning-Based Self Driving Car Model Using Gym Environment. In Communications in Computer and Information Science; 1528 CCIS; Springer: Cham, Switzerland, 2022; pp. 399–409. [Google Scholar]
- Gadri, S.; Adouane, N. Efficient Traffic Signs Recognition Based on CNN Model for Self-Driving Cars. Lect. Notes Netw. Syst. 2022, 371, 45–54. [Google Scholar]
- Heiyanthuduwa, T.; Nikini Umasha Amarapala, K.; Vinura Budara Gunathilaka, K.; Satheesh Ravindu, K.; Wickramarathne, J.; Kasthurirathna, D. VirtualPT: Virtual reality based home care physiotherapy rehabilitation for elderly. In Proceedings of the ICAC 2020—2nd International Conference on Advancements in Computing, Malabe, Sri Lanka, 10–11 December 2020; pp. 311–316. [Google Scholar]
- Saitta, A.; Ntalampiras, S. Language-agnostic speech anger identification. In Proceedings of the 2021 44th International Conference on Telecommunications and Signal Processing (TSP 2021), Brno, Czech Republic, 26–28 July 2021; pp. 249–253. [Google Scholar]
- Wang, R.; Müller, R. Bioinspired solution to finding passageways in foliage with sonar. Bioinspir. Biomim. 2021, 16, 066022. [Google Scholar] [CrossRef]
- Nadimi, N.; Javidan, R.; Layeghi, K. Efficient detection of underwater natural gas pipeline leak based on synthetic aperture sonar (Sas) systems. J. Mar. Sci. Eng. 2021, 9, 1273. [Google Scholar] [CrossRef]
- Sun, T.; Jin, J.; Liu, T.; Zhang, J. Active sonar target classification method based on fisher’s dictionary learning. Appl. Sci. 2021, 11, 10635. [Google Scholar] [CrossRef]
- Mazeika, L.; Raišutis, R.; Jankauskas, A.; Rekuvienė, R.; Šliteris, R.; Samaitis, V.; Nageswaran, C.; Budimir, M. High sensitivity ultrasonic NDT technique for detecting creep damage at the early stage in power plant steels. Int. J. Press. Vessel. Pip. 2022, 196, 104613. [Google Scholar] [CrossRef]
- Netzelmann, U.; Mross, A.; Waschkies, T.; Weber, D.; Toma, E.; Neurohr, H. Nondestructive Testing of the Integrity of Solid Oxide Fuel Cell Stack Elements by Ultrasound and Thermographic Techniques. Energies 2022, 15, 831. [Google Scholar] [CrossRef]
- Zhao, H.; Zhang, C.; He, J.; Li, Y.; Li, B.; Jiang, X.; Ta, D. Nondestructive Evaluation of Special Defects Based on Ultrasound Metasurface. Front. Mater. 2022, 8, 552. [Google Scholar] [CrossRef]
- Carotenuto, R.; Merenda, M.; Iero, D.; Della Corte, F. Mobile synchronization recovery for ultrasonic indoor positioning. Sensors 2020, 20, 702. [Google Scholar] [CrossRef] [Green Version]
- Carotenuto, R.; Merenda, M.; Iero, D.; Corte, F. Simulating signal aberration and ranging error for ultrasonic indoor positioning. Sensors 2020, 20, 3548. [Google Scholar] [CrossRef]
- Iula, A. Ultrasound systems for biometric recognition. Sensors 2019, 19, 2317. [Google Scholar] [CrossRef] [Green Version]
- Iula, A.; Micucci, M. Experimental validation of a reliable palmprint recognition system based on 2D ultrasound images. Electronics 2019, 8, 1393. [Google Scholar] [CrossRef] [Green Version]
- Nardiello, D.; Iula, A. A new recognition procedure for palmprint features extraction from ultrasound images. Lect. Notes Electr. Eng. 2019, 512, 110–118. [Google Scholar]
- Yovel, Y.; Franz, M.; Stilz, P.; Schnitzler, H.U. Plant classification from bat-like echolocation signals. PLoS Comput. Biol. 2008, 4, e1000032. [Google Scholar] [CrossRef]
- Pujol, O.; Masip, D. Geometry-based ensembles: Toward a structural characterization of the classification boundary. IEEE Trans. Pattern Anal. Mach. Intell. 2009, 31, 1140–1146. [Google Scholar] [CrossRef] [PubMed]
- Koley, C.; Midya, B. 3-D object recognition system using ultrasound. In Proceedings of the 3rd International Conference on Intelligent Sensing and Information Processing (ICISIP 2005), Bangalore, India, 14–17 December 2005; pp. 99–104. [Google Scholar]
- Ding, J.; Cheng, H.; Huang, J.; Liu, J.; Zhang, Y. Breast ultrasound image classification based on multiple-instance learning. J. Digit. Imaging 2012, 25, 620–627. [Google Scholar] [CrossRef]
- Alberti, M.; Balocco, S.; Gatta, C.; Ciompi, F.; Pujol, O.; Silva, J.; Carrillo, X.; Radeva, P. Automatic bifurcation detection in coronary IVUS sequences. IEEE Trans. Biomed. Eng. 2012, 59, 1022–1031. [Google Scholar] [CrossRef] [PubMed]
- Barros, R.; Ebecken, N. Development of a ship classification method based on Convolutional neural network and Cyclostationarity Analysis. Mech. Syst. Signal Process. 2022, 170, 108778. [Google Scholar] [CrossRef]
- Zhang, L.; Müller, R. Large-scale recognition of natural landmarks with deep learning based on biomimetic sonar echoes. Bioinspir. Biomim. 2022, 17, 026011. [Google Scholar] [CrossRef]
- Polap, D.; Wawrzyniak, N.; Wlodarczyk-Sielicka, M. Side-scan sonar analysis using roi analysis and deep neural networks. IEEE Trans. Geosci. Remote Sens. 2022. [Google Scholar] [CrossRef]
- Li, S.; Zhao, J.; Zhang, H.; Qu, S. Sub-Bottom Profiler Sonar Image Missing Area Reconstruction Using Multi-Survey Line Patch Group Deep Learning. IEEE Geosci. Remote Sens. Lett. 2022, 19. [Google Scholar] [CrossRef]
- Qin, X.; Luo, X.; Wu, Z.; Shang, J.; Zhao, D. Deep Learning-Based High Accuracy Bottom Tracking on 1-D Side-Scan Sonar Data. IEEE Geosci. Remote Sens. Lett. 2022, 19. [Google Scholar] [CrossRef]
- Gerg, I.; Monga, V. Structural Prior Driven Regularized Deep Learning for Sonar Image Classification. IEEE Trans. Geosci. Remote Sens. 2022, 60. [Google Scholar] [CrossRef]
- Mahesh, B. Machine Learning Algorithms—A review. Int. J. Sci. Res. 2018, 9, 381–386. [Google Scholar]
- Hoare, Z. Naive Bayes classifier: True and estimated errors for 2-class, 2-features case. In Proceedings of the 2006 3rd International IEEE Conference Intelligent Systems, London, UK, 4–6 September 2006; pp. 566–570. [Google Scholar]
- Qingyang, W. A Review of Methods Used in Machine Learning and Data Analysis. In Proceedings of the International Conference on Machine Learning and Computing, Zhuhai, China, 22–24 February 2019. [Google Scholar]
- Gareth, J.; Witten, D.; Hastie, T.; Tibshirani, R. Tree-Based Methods; Springer: New York, NY, USA, 2013; pp. 303–335. [Google Scholar]
- Breiman, L. Random forests. Mach. Learn. 2001, 45, 5–32. [Google Scholar] [CrossRef] [Green Version]
- Bridges, D. The Euclidean distance construction of order homomorphisms. Math. Soc. Sci. 1988, 15, 179–188. [Google Scholar] [CrossRef]
- Mousa, A.; Yusof, Y. An improved Chebyshev distance metric for clustering medical images. In AIP Conference Proceedings; AIP Publishing LLC: New York, NY, USA, 2015; Volume 1691. [Google Scholar]
- Du, W. Minkowski-type distance measures for generalized orthopair fuzzy sets. Int. J. Intell. Syst. 2018, 33, 802–817. [Google Scholar] [CrossRef]
- Zhang, Z. Introduction to machine learning: K-nearest neighbors. Ann. Transl. Med. 2016, 4, 218. [Google Scholar] [CrossRef] [Green Version]
- Gokcen, I.; Peng, J. Comparing linear discriminant analysis and support vector machines. In Lecture Notes in Computer Science (Including Subseries Lecture Notes in Artificial Intelligence and Lecture Notes in Bioinformatics); Springer: Berlin/Heidelberg, Germany, 2002; Volume 2457, pp. 104–113. [Google Scholar]
- Rodionova, O.; Kucheryavskiy, S.; Pomerantsev, A. Efficient tools for principal component analysis of complex data—A tutorial. Chemom. Intell. Lab. Syst. 2021, 213, 104304. [Google Scholar] [CrossRef]
- Guo, Y.; Liu, Y.; Oerlemans, A.; Lao, S.; Wu, S.; Lew, M. Deep learning for visual understanding: A review. Neurocomputing 2016, 187, 27–48. [Google Scholar] [CrossRef]
- Shrestha, A.; Mahmood, A. Review of deep learning algorithms and architectures. IEEE Access 2019, 7, 53040–53065. [Google Scholar] [CrossRef]
- Ronneberger, O.; Fischer, P.; Brox, T. U-net: Convolutional networks for biomedical image segmentation. In Lecture Notes in Computer Science (Including Subseries Lecture Notes in Artificial Intelligence and Lecture Notes in Bioinformatics); Springer: Berlin/Heidelberg, Germany, 2015; Volume 9351, pp. 234–241. [Google Scholar]
- Yuan, Z.W.; Zhang, J. Feature extraction and image retrieval based on AlexNet. In Proceedings of the Eighth International Conference on Digital Image Processing (ICDIP 2016), Chengu, China, 20–22 May 2016; Volume 10033. [Google Scholar]
- Wu, Z.; Shen, C.; van den Hengel, A. Wider or Deeper: Revisiting the ResNet Model for Visual Recognition. Pattern Recognit. 2019, 90, 119–133. [Google Scholar] [CrossRef] [Green Version]
- Azhari, H. Basic of Biomedical Ultrasound for Engineers; Wiley: Hoboken, NJ, USA, 2010. [Google Scholar]
- Zander, D.; Hüske, S.; Hoffmann, B.; Cui, X.; Dong, Y.; Lim, A.; Jenssen, C.; Löwe, A.; Koch, J.B.H.; Dietrich, C.F. Ultrasound Image Optimization (“Knobology”): B-Mode. Ultrasound Int. Open 2020, 6, E14–E24. [Google Scholar] [CrossRef] [PubMed]
- Nishimura, R.; Callahan, M.; Schaff, H.; Ilstrup, D.; Miller, F.; Tajik, A. Noninvasive Measurement of Cardiac Output by Continuous-Wave Doppler Echocardiography: Initial Experience and Review of the Literature. Mayo Clin. Proc. 1984, 59, 484–489. [Google Scholar] [CrossRef]
- Bonagura, J.; Miller, M.; Darke, P. Doppler echocardiography. I. Pulsed-wave and continuous-wave examinations. Vet. Clin. N. Am. Small Anim. Pract. 1998, 28, 1325–1359. [Google Scholar] [CrossRef]
- Arning, C.; Grzyska, U. Color Doppler imaging of cervicocephalic fibromuscular dysplasia. Cardiovasc. Ultrasound 2004, 2, 7. [Google Scholar] [CrossRef] [PubMed] [Green Version]
- Shung, K.K. Diagnostic Ultrasound; CRC Press: Boca Raton, FL, USA, 2006. [Google Scholar]
- Shi, C.; Luo, X.; Guo, J.; Najdovski, Z.; Fukuda, T.; Ren, H. Three-dimensional intravascular reconstruction techniques based on intravascular ultrasound: A technical review. IEEE J. Biomed. Health Inform. 2018, 22, 806–817. [Google Scholar] [CrossRef]
- Gennisson, J.L.; Deffieux, T.; Fink, M.; Tanter, M. Ultrasound elastography: Principles and techniques. Diagn. Interv. Imaging 2013, 94, 487–495. [Google Scholar] [CrossRef]
- Iula, A.; Nardiello, D. 3-D Ultrasound Palmprint Recognition System Based on Principal Lines Extracted at Several under Skin Depths. IEEE Trans. Instrum. Meas. 2019, 68, 4653–4662. [Google Scholar] [CrossRef]
- Sharma, G.; Dave, R.; Sanadya, J.; Sharma, P.; Sharma, K. Various types and management of breast cancer: An overview. J. Adv. Pharm. Technol. Res. 2010, 1, 109–126. [Google Scholar]
- Santiago-Montero, R.; Sossa, H.; Gutiérrez-Hernández, D.; Zamudio, V.; Hernández-Bautista, I.; Valadez-Godínez, S. Novel mathematical model of breast cancer diagnostics using an associative pattern classification. Diagnostics 2020, 10, 136. [Google Scholar] [CrossRef] [PubMed] [Green Version]
- Ara, S.; Alam, F.; Rahman, M.; Akhter, S.; Awwal, R.; Hasan, M. Bimodal multiparameter-based approach for benign-malignant classification of breast tumors. Ultrasound Med. Biol. 2015, 41, 2022–2038. [Google Scholar] [CrossRef] [PubMed]
- Cao, Z.; Duan, L.; Yang, G.; Yue, T.; Chen, Q.; Fu, H.; Xu, Y. Breast tumor detection in ultrasound images using deep learning. In Lecture Notes in Computer Science (Including Subseries Lecture Notes in Artificial Intelligence and Lecture Notes in Bioinformatics); 10530 LNCS; Springer: Berlin/Heidelberg, Germany, 2017; pp. 121–128. [Google Scholar]
- Gao, Y.; Liu, B.; Zhu, Y.; Chen, L.; Tan, M.; Xiao, X.; Yu, G.; Guo, Y. Detection and recognition of ultrasound breast nodules based on semi-supervised deep learning: A powerful alternative strategy. Quant. Imaging Med. Surg. 2021, 11, 2265–2278. [Google Scholar] [CrossRef] [PubMed]
- Yang, X.; Zhou, D.; Zhou, Y.; Huang, Y.; Liu, H. Towards Zero Re-Training for Long-Term Hand Gesture Recognition via Ultrasound Sensing. IEEE J. Biomed. Health Inform. 2019, 23, 1639–1646. [Google Scholar] [CrossRef] [Green Version]
- Zheng, J.; Lin, D.; Gao, Z.; Wang, S.; He, M.; Fan, J. Deep Learning Assisted Efficient AdaBoost Algorithm for Breast Cancer Detection and Early Diagnosis. IEEE Access 2020, 8, 96946–96954. [Google Scholar] [CrossRef]
- Cao, Z.; Duan, L.; Yang, G.; Yue, T.; Chen, Q. An experimental study on breast lesion detection and classification from ultrasound images using deep learning architectures. BMC Med. Imaging 2019, 19, 51. [Google Scholar] [CrossRef]
- Li, J.; Bu, Y.; Lu, S.; Pang, H.; Luo, C.; Liu, Y.; Qian, L. Development of a Deep Learning–Based Model for Diagnosing Breast Nodules With Ultrasound. J. Ultrasound Med. 2021, 40, 513–520. [Google Scholar] [CrossRef]
- Wang, S.; Niu, S.; Qu, E.; Forsberg, F.; Wilkes, A.; Sevrukov, A.; Nam, K.; Mattrey, R.; Ojeda-Fournier, H.; Eisenbrey, J. Characterization of indeterminate breast lesions on B-mode ultrasound using automated machine learning models. J. Med. Imaging 2020, 7, 057002. [Google Scholar] [CrossRef]
- Gu, P.; Lee, W.M.; Roubidoux, M.; Yuan, J.; Wang, X.; Carson, P. Automated 3D ultrasound image segmentation to aid breast cancer image interpretation. Ultrasonics 2016, 65, 51–58. [Google Scholar] [CrossRef] [PubMed] [Green Version]
- Badawy, S.; Mohamed, A.N.; Hefnawy, A.; Zidan, H.; GadAllah, M.; El-Banby, G. Automatic semantic segmentation of breast tumors in ultrasound images based on combining fuzzy logic and deep learning—A feasibility study. PLoS ONE 2021, 16, e0251899. [Google Scholar] [CrossRef] [PubMed]
- Hu, Y.; Guo, Y.; Wang, Y.; Yu, J.; Li, J.; Zhou, S.; Chang, C. Automatic tumor segmentation in breast ultrasound images using a dilated fully convolutional network combined with an active contour model. Med. Phys. 2019, 46, 215–228. [Google Scholar] [CrossRef] [Green Version]
- Huang, K.; Zhang, Y.; Cheng, H.; Xing, P.; Zhang, B. Semantic segmentation of breast ultrasound image with fuzzy deep learning network and breast anatomy constraints. Neurocomputing 2021, 450, 319–335. [Google Scholar] [CrossRef]
- Ilesanmi, A.; Chaumrattanakul, U.; Makhanov, S. A method for segmentation of tumors in breast ultrasound images using the variant enhanced deep learning. Biocybern. Biomed. Eng. 2021, 41, 802–818. [Google Scholar] [CrossRef]
- Liao, W.X.; He, P.; Hao, J.; Wang, X.Y.; Yang, R.L.; An, D.; Cui, L.G. Automatic Identification of Breast Ultrasound Image Based on Supervised Block-Based Region Segmentation Algorithm and Features Combination Migration Deep Learning Model. IEEE J. Biomed. Health Inform. 2020, 24, 984–993. [Google Scholar] [CrossRef]
- Pourasad, Y.; Zarouri, E.; Parizi, M.; Mohammed, A. Presentation of novel architecture for diagnosis and identifying breast cancer location based on ultrasound images using machine learning. Diagnostics 2021, 11, 1870. [Google Scholar] [CrossRef]
- Vakanski, A.; Xian, M.; Freer, P. Attention-Enriched Deep Learning Model for Breast Tumor Segmentation in Ultrasound Images. Ultrasound Med. Biol. 2020, 46, 2819–2833. [Google Scholar] [CrossRef]
- Webb, J.; Adusei, S.; Wang, Y.; Samreen, N.; Adler, K.; Meixner, D.; Fazzio, R.; Fatemi, M.; Alizad, A. Comparing deep learning-based automatic segmentation of breast masses to expert interobserver variability in ultrasound imaging. Comput. Biol. Med. 2021, 139, 104966. [Google Scholar] [CrossRef]
- Xu, Y.; Wang, Y.; Yuan, J.; Cheng, Q.; Wang, X.; Carson, P. Medical breast ultrasound image segmentation by machine learning. Ultrasonics 2019, 91, 1–9. [Google Scholar] [CrossRef]
- Yap, M.; Goyal, M.; Osman, F.; Martí, R.; Denton, E.; Juette, A.; Zwiggelaar, R. Breast ultrasound lesions recognition: End-to-end deep learning approaches. J. Med. Imaging 2019, 6, 011007. [Google Scholar]
- Han, L.; Huang, Y.; Dou, H.; Wang, S.; Ahamad, S.; Luo, H.; Liu, Q.; Fan, J.; Zhang, J. Semi-supervised segmentation of lesion from breast ultrasound images with attentional generative adversarial network. Comput. Methods Programs Biomed. 2020, 189, 105275. [Google Scholar] [CrossRef] [PubMed]
- Shia, W.C.; Lin, L.S.; Chen, D.R. Classification of malignant tumours in breast ultrasound using unsupervised machine learning approaches. Sci. Rep. 2021, 11, 1418. [Google Scholar] [CrossRef] [PubMed]
- Gonzelez-Luna, F.; Hernandez-Lopez, J.; Gomez-Flores, W. A performance evaluation of machine learning techniques for breast ultrasound classification. In Proceedings of the 2019 16th International Conference on Electrical Engineering, Computing Science and Automatic Control (CCE 2019), Mexico City, Mexico, 11–13 September 2019. [Google Scholar]
- Fleury, E.; Marcomini, K. Performance of machine learning software to classify breast lesions using BI-RADS radiomic features on ultrasound images. Eur. Radiol. Exp. 2019, 3, 34. [Google Scholar] [CrossRef] [Green Version]
- Destrempes, F.; Trop, I.; Allard, L.; Chayer, B.; Khoury, M.; Lalonde, L.; Cloutier, G. BI-RADS assessment of solid breast lesions based on quantitative ultrasound and machine learning. In Proceedings of the IEEE International Ultrasonics Symposium (IUS), Glasgow, UK, 6–9 October 2019; Volume 2019, pp. 1909–1911. [Google Scholar]
- Mishra, A.; Roy, P.; Bandyopadhyay, S.; Das, S. Breast ultrasound tumour classification: A Machine Learning—Radiomics based approach. Expert Syst. 2021, 38, e12713. [Google Scholar] [CrossRef]
- Romeo, V.; Cuocolo, R.; Apolito, R.; Stanzione, A.; Ventimiglia, A.; Vitale, A.; Verde, F.; Accurso, A.; Amitrano, M.; Insabato, L.; et al. Clinical value of radiomics and machine learning in breast ultrasound: A multicenter study for differential diagnosis of benign and malignant lesions. Eur. Radiol. 2021, 31, 9511–9519. [Google Scholar] [CrossRef]
- Zhang, Z.; Li, Y.; Wu, W.; Chen, H.; Cheng, L.; Wang, S. Tumor detection using deep learning method in automated breast ultrasound. Biomed. Signal Process. Control 2021, 68, 102677. [Google Scholar] [CrossRef]
- Shin, S.; Lee, S.; Yun, I.; Kim, S.; Lee, K. Joint weakly and semi-supervised deep learning for localization and classification of masses in breast ultrasound images. IEEE Trans. Med. Imaging 2019, 38, 762–774. [Google Scholar] [CrossRef] [Green Version]
- Tanaka, H.; Chiu, S.W.; Watanabe, T.; Kaoku, S.; Yamaguchi, T. Computer-aided diagnosis system for breast ultrasound images using deep learning. Phys. Med. Biol. 2019, 64, 235013. [Google Scholar] [CrossRef]
- Wu, T.; Sultan, L.; Tian, J.; Cary, T.; Sehgal, C. Machine learning for diagnostic ultrasound of triple-negative breast cancer. Breast Cancer Res. Treat. 2019, 173, 365–373. [Google Scholar] [CrossRef]
- Zhu, Y.C.; AlZoubi, A.; Jassim, S.; Jiang, Q.; Zhang, Y.; Wang, Y.B.; Ye, X.D.; DU, H. A generic deep learning framework to classify thyroid and breast lesions in ultrasound images. Ultrasonics 2021, 110, 106300. [Google Scholar] [CrossRef] [PubMed]
- Chen, C.; Wang, Y.; Niu, J.; Liu, X.; Li, Q.; Gong, X. Domain Knowledge Powered Deep Learning for Breast Cancer Diagnosis Based on Contrast-Enhanced Ultrasound Videos. IEEE Trans. Med. Imaging 2021, 40, 2439–2451. [Google Scholar] [CrossRef]
- Marcon, M.; Ciritsis, A.; Rossi, C.; Becker, A.; Berger, N.; Wurnig, M.; Wagner, M.; Frauenfelder, T.; Boss, A. Diagnostic performance of machine learning applied to texture analysis-derived features for breast lesion characterisation at automated breast ultrasound: A pilot study. Eur. Radiol. Exp. 2019, 3, 44. [Google Scholar] [CrossRef] [PubMed] [Green Version]
- Wan, K.; Wong, C.; Ip, H.; Fan, D.; Yuen, P.; Fong, H.; Ying, M. Evaluation of the performance of traditional machine learning algorithms, convolutional neural network and AutoML Vision in ultrasound breast lesions classification: A comparative study. Quant. Imaging Med. Surg. 2021, 11, 1381–1393. [Google Scholar] [CrossRef]
- Al-Dhabyani, W.; Fahmy, A.; Gomaa, M.; Khaled, H. Deep learning approaches for data augmentation and classification of breast masses using ultrasound images. Int. J. Adv. Comput. Sci. Appl. 2019, 10, 618–627. [Google Scholar] [CrossRef] [Green Version]
- Huo, L.; Tan, Y.; Wang, S.; Geng, C.; Li, Y.; Ma, X.; Wang, B.; He, Y.; Yao, C.; Ouyang, T. Machine learning models to improve the differentiation between benign and malignant breast lesions on ultrasound: A multicenter external validation study. Cancer Manag. Res. 2021, 13, 3367–3379. [Google Scholar] [CrossRef] [PubMed]
- Ciritsis, A.; Rossi, C.; Eberhard, M.; Marcon, M.; Becker, A.; Boss, A. Automatic classification of ultrasound breast lesions using a deep convolutional neural network mimicking human decision-making. Eur. Radiol. 2019, 29, 5458–5468. [Google Scholar] [CrossRef]
- Bajaj, R.; Huang, X.; Kilic, Y.; Jain, A.; Ramasamy, A.; Torii, R.; Moon, J.; Koh, T.; Crake, T.; Parker, M.; et al. A deep learning methodology for the automated detection of end-diastolic frames in intravascular ultrasound images. Int. J. Cardiovasc. Imaging 2021, 37, 1825–1837. [Google Scholar] [CrossRef]
- Hughes, J.; Yuan, N.; He, B.; Ouyang, J.; Ebinger, J.; Botting, P.; Lee, J.; Theurer, J.; Tooley, J.; Nieman, K.; et al. Deep learning evaluation of biomarkers from echocardiogram videos. EBioMedicine 2021, 73, 103613. [Google Scholar] [CrossRef]
- Kagiyama, N.; Shrestha, S.; Cho, J.; Khalil, M.; Singh, Y.; Challa, A.; Casaclang-Verzosa, G.; Sengupta, P. A low-cost texture-based pipeline for predicting myocardial tissue remodeling and fibrosis using cardiac ultrasound: Texture-based myocardial tissue characterization using cardiac ultrasound. EBioMedicine 2020, 54, 102726. [Google Scholar] [CrossRef] [PubMed]
- Yu, C.J.; Yeh, H.J.; Chang, C.C.; Tang, J.H.; Kao, W.Y.; Chen, W.C.; Huang, Y.J.; Li, C.H.; Chang, W.H.; Lin, Y.T.; et al. Lightweight deep neural networks for cholelithiasis and cholecystitis detection by point-of-care ultrasound. Comput. Methods Programs Biomed. 2021, 211, 106382. [Google Scholar] [CrossRef] [PubMed]
- Maraci, M.; Yaqub, M.; Craik, R.; Beriwal, S.; Self, A.; Von Dadelszen, P.; Papageorghiou, A.; Noble, J. Toward point-of-care ultrasound estimation of fetal gestational age from the trans-cerebellar diameter using CNN-based ultrasound image analysis. J. Med. Imaging 2020, 7, 014501. [Google Scholar]
- Wang, X.; Liu, Z.; Du, Y.; Diao, Y.; Liu, P.; Lv, G.; Zhang, H. Recognition of Fetal Facial Ultrasound Standard Plane Based on Texture Feature Fusion. Comput. Math. Methods Med. 2021, 2021, 6656942. [Google Scholar] [CrossRef] [PubMed]
- Shang, S.; Huang, C.; Yan, W.; Chen, R.; Cao, J.; Zhang, Y.; Guo, Y.; Du, G. Performance of a computer aided diagnosis system for SARS-CoV-2 pneumonia based on ultrasound images. Eur. J. Radiol. 2022, 146, 110066. [Google Scholar] [CrossRef] [PubMed]
- Jana, B.; Oswal, K.; Mitra, S.; Saha, G.; Banerjee, S. Detection of peripheral arterial disease using Doppler spectrogram based expert system for Point-of-Care applications. Biomed. Signal Process. Control 2019, 54, 101599. [Google Scholar] [CrossRef]
- Sakar, B.; Serbes, G.; Aydin, N. Emboli detection using a wrapper-based feature selection algorithm with multiple classifiers. Biomed. Signal Process. Control 2022, 71, 103080. [Google Scholar] [CrossRef]
- Sofian, H.; Than, J.; Mohammad, S.; Noor, N. Calcification detection of coronary artery disease in intravascular ultrasound image: Deep feature learning approach. Int. J. Integr. Eng. 2018, 10, 43–57. [Google Scholar] [CrossRef]
- Sofian, H.; Than, J.; Mohamad, S.; Noor, N. Calcification detection for intravascular ultrasound image using direct acyclic graph architecture: Pre-Trained model for 1-channel image. Indones. J. Electr. Eng. Comput. Sci. 2021, 22, 787–794. [Google Scholar] [CrossRef]
- Sofian, H.; Ming, J.; Muhammad, S.; Noor, N. Calcification detection using convolutional neural network architectures in intravascular ultrasound images. Indones. J. Electr. Eng. Comput. Sci. 2019, 17, 1313–1321. [Google Scholar] [CrossRef]
- Willemink, M.; Varga-Szemes, A.; Schoepf, U.; Codari, M.; Nieman, K.; Fleischmann, D.; Mastrodicasa, D. Emerging methods for the characterization of ischemic heart disease: Ultrafast Doppler angiography, micro-CT, photon-counting CT, novel MRI and PET techniques, and artificial intelligence. Eur. Radiol. Exp. 2021, 5, 12. [Google Scholar] [CrossRef]
- Cui, H.; Xia, Y.; Zhang, Y. Supervised machine learning for coronary artery lumen segmentation in intravascular ultrasound images. Int. J. Numer. Methods Biomed. Eng. 2020, 36, e3348. [Google Scholar] [CrossRef] [PubMed]
- Zhang, C.; Guo, X.; Guo, X.; Molony, D.; Li, H.; Samady, H.; Giddens, D.; Athanasiou, L.; Tang, D.; Nie, R.; et al. Machine learning model comparison for automatic segmentation of intracoronary optical coherence tomography and plaque cap thickness quantification. CMES—Comput. Model. Eng. Sci. 2020, 123, 631–646. [Google Scholar] [CrossRef]
- Bajaj, R.; Huang, X.; Kilic, Y.; Ramasamy, A.; Jain, A.; Ozkor, M.; Tufaro, V.; Safi, H.; Erdogan, E.; Serruys, P.; et al. Advanced deep learning methodology for accurate, real-time segmentation of high-resolution intravascular ultrasound images. Int. J. Cardiol. 2021, 339, 185–191. [Google Scholar] [CrossRef]
- Blanco, P.; Ziemer, P.; Bulant, C.; Ueki, Y.; Bass, R.; Räber, L.; Lemos, P.; García-García, H. Fully automated lumen and vessel contour segmentation in intravascular ultrasound datasets. Med. Image Anal. 2022, 75, 102262. [Google Scholar] [CrossRef] [PubMed]
- Zhou, R.; Guo, F.; Azarpazhooh, M.; Hashemi, S.; Cheng, X.; Spence, J.; Ding, M.; Fenster, A. Deep Learning-Based Measurement of Total Plaque Area in B-Mode Ultrasound Images. IEEE J. Biomed. Health Inform. 2021, 25, 2967–2977. [Google Scholar] [CrossRef]
- Lee, J.G.; Ko, J.; Hae, H.; Kang, S.J.; Kang, D.Y.; Lee, P.; Ahn, J.M.; Park, D.W.; Lee, S.W.; Kim, Y.H.; et al. Intravascular ultrasound-based machine learning for predicting fractional flow reserve in intermediate coronary artery lesions. Atherosclerosis 2020, 292, 171–177. [Google Scholar] [CrossRef] [PubMed]
- Guvenir Torun, S.; Torun, H.; Hansen, H.; Gandini, G.; Berselli, I.; Codazzi, V.; de Korte, C.; van der Steen, A.; Migliavacca, F.; Chiastra, C.; et al. Multicomponent Mechanical Characterization of Atherosclerotic Human Coronary Arteries: An Experimental and Computational Hybrid Approach. Front. Physiol. 2021, 12, 1480. [Google Scholar] [CrossRef]
- Boyd, C.; Brown, G.; Kleinig, T.; Dawson, J.; McDonnell, M.; Jenkinson, M.; Bezak, E. Machine learning quantitation of cardiovascular and cerebrovascular disease: A systematic review of clinical applications. Diagnostics 2021, 11, 551. [Google Scholar] [CrossRef]
- Savaş, S.; Topaloglu, N.; Kazcı, O.; Koşar, P. Classification of Carotid Artery Intima Media Thickness Ultrasound Images with Deep Learning. J. Med. Syst. 2019, 43, 273. [Google Scholar] [PubMed]
- Skandha, S.; Gupta, S.; Saba, L.; Koppula, V.; Johri, A.; Khanna, N.; Mavrogeni, S.; Laird, J.; Pareek, G.; Miner, M.; et al. 3-D optimized classification and characterization artificial intelligence paradigm for cardiovascular/stroke risk stratification using carotid ultrasound-based delineated plaque: Atheromatic™ 2.0. Comput. Biol. Med. 2020, 125, 103958. [Google Scholar] [CrossRef] [PubMed]
- Hsu, K.C.; Lin, C.H.; Johnson, K.; Liu, C.H.; Chang, T.Y.; Huang, K.L.; Fann, Y.C.; Lee, T.H. Autodetect extracranial and intracranial artery stenosis by machine learning using ultrasound. Comput. Biol. Med. 2020, 116, 103569. [Google Scholar] [CrossRef] [PubMed]
- Saba, L.; Sanagala, S.; Gupta, S.; Koppula, V.; Laird, J.; Viswanathan, V.; Sanches, M.; Kitas, G.; Johri, A.; Sharma, N.; et al. A Multicenter Study on Carotid Ultrasound Plaque Tissue Characterization and Classification Using Six Deep Artificial Intelligence Models: A Stroke Application. IEEE Trans. Instrum. Meas. 2021, 70, 1–12. [Google Scholar] [CrossRef]
- Luo, X.; Ara, L.; Ding, H.; Rollins, D.; Motaganahalli, R.; Sawchuk, A. Computational methods to automate the initial interpretation of lower extremity arterial Doppler and duplex carotid ultrasound studies. J. Vasc. Surg. 2021, 74, 988–996.e1. [Google Scholar] [CrossRef] [PubMed]
- Klingensmith, J.; Haggard, A.; Ralston, J.; Qiang, B.; Fedewa, R.; Elsharkawy, H.; Geoffrey Vince, D. Tissue classification in intercostal and paravertebral ultrasound using spectral analysis of radiofrequency backscatter. J. Med. Imaging 2019, 6, 047001. [Google Scholar] [CrossRef] [PubMed]
- Khanna, N.; Jamthikar, A.; Gupta, D.; Piga, M.; Saba, L.; Carcassi, C.; Giannopoulos, A.; Nicolaides, A.; Laird, J.; Suri, H.; et al. Rheumatoid Arthritis: Atherosclerosis Imaging and Cardiovascular Risk Assessment Using Machine and Deep Learning–Based Tissue Characterization. Curr. Atheroscler. Rep. 2019, 21, 7. [Google Scholar] [CrossRef]
- Jamthikar, A.; Gupta, D.; Khanna, N.; Saba, L.; Araki, T.; Viskovic, K.; Suri, H.; Gupta, A.; Mavrogeni, S.; Turk, M.; et al. A low-cost machine learning-based cardiovascular/stroke risk assessment system: Integration of conventional factors with image phenotypes. Cardiovasc. Diagn. Ther. 2019, 9, 420–430. [Google Scholar] [CrossRef] [Green Version]
- Guo, X.; Maehara, A.; Matsumura, M.; Wang, L.; Zheng, J.; Samady, H.; Mintz, G.; Giddens, D.; Tang, D. Predicting plaque vulnerability change using intravascular ultrasound + optical coherence tomography image-based fluid–structure interaction models and machine learning methods with patient follow-up data: A feasibility study. BioMedical Eng. Online 2021, 20, 34. [Google Scholar] [CrossRef] [PubMed]
- Gudigar, A.; Nayak, S.; Samanth, J.; Raghavendra, U.; Ashwal, A.; Barua, P.; Hasan, M.; Ciaccio, E.; Tan, R.S.; Rajendra Acharya, U. Recent trends in artificial intelligence-assisted coronary atherosclerotic plaque characterization. Int. J. Environ. Res. Public Health 2021, 18, 10003. [Google Scholar] [CrossRef]
- Golemati, S.; Patelaki, E.; Gastounioti, A.; Andreadis, I.; Liapis, C.; Nikita, K. Motion synchronisation patterns of the carotid atheromatous plaque from B-mode ultrasound. Sci. Rep. 2020, 10, 11221. [Google Scholar] [CrossRef]
- Coelewij, L.; Waddington, K.; Robinson, G.; Chocano, E.; McDonnell, T.; Farinha, F.; Peng, J.; Dönnes, P.; Smith, E.; Croca, S.; et al. Serum Metabolomic Signatures Can Predict Subclinical Atherosclerosis in Patients with Systemic Lupus Erythematosus. Arterioscler. Thromb. Vasc. Biol. 2021, 41, 1446–1458. [Google Scholar] [CrossRef] [PubMed]
- Lo Vercio, L.; del Fresno, M.; Larrabide, I. Lumen-intima and media-adventitia segmentation in IVUS images using supervised classifications of arterial layers and morphological structures. Comput. Methods Programs Biomed. 2019, 177, 113–121. [Google Scholar] [CrossRef]
- Cha, D.; Kang, T.; Min, J.; Joo, I.; Sinn, D.; Ha, S.; Kim, K.; Lee, G.; Yi, J. Deep learning-based automated quantification of the hepatorenal index for evaluation of fatty liver by ultrasonography. Ultrasonography 2021, 40, 565–574. [Google Scholar] [CrossRef]
- Dozen, A.; Komatsu, M.; Sakai, A.; Komatsu, R.; Shozu, K.; Machino, H.; Yasutomi, S.; Arakaki, T.; Asada, K.; Kaneko, S.; et al. Image segmentation of the ventricular septum in fetal cardiac ultrasound videos based on deep learning using time-series information. Biomolecules 2020, 10, 1526. [Google Scholar] [CrossRef]
- Shozu, K.; Komatsu, M.; Sakai, A.; Komatsu, R.; Dozen, A.; Machino, H.; Yasutomi, S.; Arakaki, T.; Asada, K.; Kaneko, S.; et al. Model-agnostic method for thoracic wall segmentation in fetal ultrasound videos. Biomolecules 2020, 10, 1691. [Google Scholar] [CrossRef] [PubMed]
- Perez-Gonzalez, J.; Arámbula Cosío, F.; Huegel, J.; Medina-Bañuelos, V. Probabilistic Learning Coherent Point Drift for 3D Ultrasound Fetal Head Registration. Comput. Math. Methods Med. 2020, 2020, 4271519. [Google Scholar] [CrossRef] [PubMed] [Green Version]
- Xue, W.; Cao, C.; Liu, J.; Duan, Y.; Cao, H.; Wang, J.; Tao, X.; Chen, Z.; Wu, M.; Zhang, J.; et al. Modality alignment contrastive learning for severity assessment of COVID-19 from lung ultrasound and clinical information. Med. Image Anal. 2021, 69, 101975. [Google Scholar] [CrossRef]
- Ouahabi, A.; Taleb-Ahmed, A. Deep learning for real-time semantic segmentation: Application in ultrasound imaging. Pattern Recognit. Lett. 2021, 144, 27–34. [Google Scholar] [CrossRef]
- Penatti, O.; Werneck, R.; de Almeida, W.; Stein, B.; Pazinato, D.; Mendes Júnior, P.; Torres, R.; Rocha, A. Mid-level image representations for real-time heart view plane classification of echocardiograms. Comput. Biol. Med. 2015, 66, 66–81. [Google Scholar] [CrossRef]
- Sulas, E.; Urru, M.; Tumbarello, R.; Raffo, L.; Pani, D. Automatic detection of complete and measurable cardiac cycles in antenatal pulsed-wave Doppler signals. Comput. Methods Programs Biomed. 2020, 190, 105336. [Google Scholar] [CrossRef]
- Farahani, N.; Enayati, M.; Sundaram, D.; Damani, D.; Kaggal, V.; Zacher, A.; Geske, J.; Kane, G.; Arunachalam, S.; Pasupathy, K.; et al. Application of machine learning for detection of hypertrophic cardiomyopathy patients from echocardiogram measurements. In Proceedings of the 2021 Design of Medical Devices Conference (DMD 2021), Minneapolis, MN, USA, 12–15 April 2021. [Google Scholar]
- Hur, D.; Sugeng, L. Non-invasive Multimodality Cardiovascular Imaging of the Right Heart and Pulmonary Circulation in Pulmonary Hypertension. Front. Cardiovasc. Med. 2019, 6, 24. [Google Scholar] [CrossRef] [PubMed] [Green Version]
- Vaseli, H.; Liao, Z.; Abdi, A.; Girgis, H.; Behnami, D.; Luong, C.; Dezaki, F.; Dhungel, N.; Rohling, R.; Gin, K.; et al. Designing lightweight deep learning models for echocardiography view classification. In Progress in Biomedical Optics and Imaging; Proceedings of SPIE; SPIE: Philadelphia, PA, USA, 2019; Volume 10951. [Google Scholar]
- Puyol-Anton, E.; Ruijsink, B.; Gerber, B.; Amzulescu, M.; Langet, H.; De Craene, M.; Schnabel, J.; Piro, P.; King, A. Regional Multi-View Learning for Cardiac Motion Analysis: Application to Identification of Dilated Cardiomyopathy Patients. IEEE Trans. Biomed. Eng. 2019, 66, 956–966. [Google Scholar] [CrossRef] [Green Version]
- Xi, P.; Guan, H.; Shu, C.; Borgeat, L.; Goubran, R. An integrated approach for medical abnormality detection using deep patch convolutional neural networks. Vis. Comput. 2020, 36, 1869–1882. [Google Scholar] [CrossRef]
- Mahalingam, D.; Chelis, L.; Nizamuddin, I.; Lee, S.; Kakolyris, S.; Halff, G.; Washburn, K.; Attwood, K.; Fahad, I.; Grigorieva, J.; et al. Detection of hepatocellular carcinoma in a high-risk population by a mass spectrometry-based test. Cancers 2021, 13, 3109. [Google Scholar] [CrossRef]
- Brehar, R.; Mitrea, D.A.; Vancea, F.; Marita, T.; Nedevschi, S.; Lupsor-Platon, M.; Rotaru, M.; Badea, R. Comparison of deep-learning and conventional machine-learning methods for the automatic recognition of the hepatocellular carcinoma areas from ultrasound images. Sensors 2020, 20, 3085. [Google Scholar] [CrossRef]
- Schmauch, B.; Herent, P.; Jehanno, P.; Dehaene, O.; Saillard, C.; Aubé, C.; Luciani, A.; Lassau, N.; Jégou, S. Diagnosis of focal liver lesions from ultrasound using deep learning. Diagn. Interv. Imaging 2019, 100, 227–233. [Google Scholar] [CrossRef] [PubMed]
- Zamanian, H.; Mostaar, A.; Azadeh, P.; Ahmadi, M. Implementation of combinational deep learning algorithm for non-alcoholic fatty liver classification in ultrasound images. J. Biomed. Phys. Eng. 2021, 11, 73–84. [Google Scholar] [CrossRef] [PubMed]
- Wang, W.; Zhang, J.C.; Tian, W.S.; Chen, L.D.; Zheng, Q.; Hu, H.T.; Wu, S.S.; Guo, Y.; Xie, X.Y.; Lu, M.D.; et al. Shear wave elastography-based ultrasomics: Differentiating malignant from benign focal liver lesions. Abdom. Radiol. 2021, 46, 237–248. [Google Scholar] [CrossRef]
- Peng, J.; Peng, Y.; Lin, P.; Wan, D.; Qin, H.; Li, X.; Wang, X.; He, Y.; Yang, H. Differentiating infected focal liver lesions from malignant mimickers: Value of ultrasound-based radiomics. Clin. Radiol. 2022, 77, 104–113. [Google Scholar] [CrossRef]
- Li, W.; Lv, X.Z.; Zheng, X.; Ruan, S.M.; Hu, H.T.; Chen, L.D.; Huang, Y.; Li, X.; Zhang, C.Q.; Xie, X.Y.; et al. Machine Learning-Based Ultrasomics Improves the Diagnostic Performance in Differentiating Focal Nodular Hyperplasia and Atypical Hepatocellular Carcinoma. Front. Oncol. 2021, 11, 863. [Google Scholar] [CrossRef] [PubMed]
- Brattain, L.; Ozturk, A.; Telfer, B.; Dhyani, M.; Grajo, J.; Samir, A. Image Processing Pipeline for Liver Fibrosis Classification Using Ultrasound Shear Wave Elastography. Ultrasound Med. Biol. 2020, 46, 2667–2676. [Google Scholar] [CrossRef]
- Byra, M.; Styczynski, G.; Szmigielski, C.; Kalinowski, P.; Michalowski, L.; Paluszkiewicz, R.; Ziarkiewicz-Wróblewska, B.; Zieniewicz, K.; Sobieraj, P.; Nowicki, A. Transfer learning with deep convolutional neural network for liver steatosis assessment in ultrasound images. Int. J. Comput. Assist. Radiol. Surg. 2018, 13, 1895–1903. [Google Scholar] [CrossRef] [Green Version]
- Che, H.; Brown, L.; Foran, D.; Nosher, J.; Hacihaliloglu, I. Liver disease classification from ultrasound using multi-scale CNN. Int. J. Comput. Assist. Radiol. Surg. 2021, 16, 1537–1548. [Google Scholar] [CrossRef]
- Chou, T.H.; Yeh, H.J.; Chang, C.C.; Tang, J.H.; Kao, W.Y.; Su, I.C.; Li, C.H.; Chang, W.H.; Huang, C.K.; Sufriyana, H.; et al. Deep learning for abdominal ultrasound: A computer-aided diagnostic system for the severity of fatty liver. J. Chin. Med. Assoc. JCMA 2021, 84, 842–850. [Google Scholar] [CrossRef] [PubMed]
- Kim, T.; Lee, D.; Park, E.K.; Choi, S. Deep learning techniques for fatty liver using multi-view ultrasound images scanned by different scanners:development and validation study. JMIR Med. Inform. 2021, 9, e30066. [Google Scholar] [CrossRef]
- Mitrea, D.; Badea, R.; Mitrea, P.; Brad, S.; Nedevschi, S. Hepatocellular carcinoma automatic diagnosis within ceus and b-mode ultrasound images using advanced machine learning methods. Sensors 2021, 21, 2202. [Google Scholar] [CrossRef] [PubMed]
- Neogi, N.; Adhikari, A.; Roy, M. Use of a novel set of features based on texture anisotropy for identification of liver steatosis from ultrasound images: A simple method. Multimed. Tools Appl. 2019, 78, 11105–11127. [Google Scholar] [CrossRef]
- Zhang, H.; Guo, L.; Wang, D.; Wang, J.; Bao, L.; Ying, S.; Xu, H.; Shi, J. Multi-Source Transfer Learning Via Multi-Kernel Support Vector Machine plus for B-Mode Ultrasound-Based Computer-Aided Diagnosis of Liver Cancers. IEEE J. Biomed. Health Inform. 2021, 25, 3874–3885. [Google Scholar] [CrossRef]
- Yang, Q.; Wei, J.; Hao, X.; Kong, D.; Yu, X.; Jiang, T.; Xi, J.; Cai, W.; Luo, Y.; Jing, X.; et al. Improving B-mode ultrasound diagnostic performance for focal liver lesions using deep learning: A multicentre study. EBioMedicine 2020, 56, 102777. [Google Scholar] [CrossRef] [PubMed]
- Donald, I.; Macvicar, J.; Brown, T. Investigation of Abdominal Masses by pulsed ultrasound. Lancet 1958, 271, 1188–1195. [Google Scholar] [CrossRef]
- Gudigar, A.; Samanth, J.; Raghavendra, U.; Dharmik, C.; Vasudeva, A.; Padmakumar, R.; Tan, R.S.; Ciaccio, E.; Molinari, F.; Rajendra Acharya, U. Local Preserving Class Separation Framework to Identify Gestational Diabetes Mellitus Mother Using Ultrasound Fetal Cardiac Image. IEEE Access 2020, 8, 229043–229051. [Google Scholar] [CrossRef]
- Kim, H.; Lee, S.; Kwon, J.Y.; Park, Y.; Kim, K.; Seo, J. Automatic evaluation of fetal head biometry from ultrasound images using machine learning. Physiol. Meas. 2019, 40, 065009. [Google Scholar] [CrossRef] [Green Version]
- Liu, S.; Sun, Y.; Luo, N. Doppler Ultrasound Imaging Combined with Fetal Heart Detection in Predicting Fetal Distress in Pregnancy-Induced Hypertension under the Guidance of Artificial Intelligence Algorithm. J. Healthc. Eng. 2021, 2021, 4405189. [Google Scholar] [CrossRef]
- Qu, R.; Xu, G.; Ding, C.; Jia, W.; Sun, M. Deep Learning-Based Methodology for Recognition of Fetal Brain Standard Scan Planes in 2D Ultrasound Images. IEEE Access 2020, 8, 44443–44451. [Google Scholar] [CrossRef]
- Sahli, H.; Mouelhi, A.; Ben Slama, A.; Sayadi, M.; Rachdi, R. Supervised classification approach of biometric measures for automatic fetal defect screening in head ultrasound images. J. Med. Eng. Technol. 2019, 43, 279–286. [Google Scholar] [CrossRef]
- Zhu, F.; Liu, M.; Wang, F.; Qiu, D.; Li, R.; Dai, C. Automatic measurement of fetal femur length in ultrasound images: A comparison of random forest regression model and SegNet. Math. Biosci. Eng. 2021, 18, 7790–7805. [Google Scholar] [CrossRef] [PubMed]
- Rasheed, K.; Junejo, F.; Malik, A.; Saqib, M. Automated Fetal Head Classification and Segmentation Using Ultrasound Video. IEEE Access 2021, 9, 160249–160267. [Google Scholar] [CrossRef]
- Torrents-Barrena, J.; Monill, N.; Piella, G.; Gratacós, E.; Eixarch, E.; Ceresa, M.; González Ballester, M. Assessment of Radiomics and Deep Learning for the Segmentation of Fetal and Maternal Anatomy in Magnetic Resonance Imaging and Ultrasound. Acad. Radiol. 2021, 28, 173–188. [Google Scholar] [CrossRef] [PubMed]
- Xia, T.H.; Tan, M.; Li, J.H.; Wang, J.J.; Wu, Q.Q.; Kong, D.X. Establish a normal fetal lung gestational age grading model and explore the potential value of deep learning algorithms in fetal lung maturity evaluation. Chin. Med. J. 2021, 134, 1828–1837. [Google Scholar] [CrossRef]
- Crockart, I.; Brink, L.; du Plessis, C.; Odendaal, H. Classification of intrauterine growth restriction at 34–38 weeks gestation with machine learning models. Inform. Med. Unlocked 2021, 23, 100533. [Google Scholar] [CrossRef]
- Feng, M.; Wan, L.; Li, Z.; Qing, L.; Qi, X. Fetal Weight Estimation via Ultrasound Using Machine Learning. IEEE Access 2019, 7, 87783–87791. [Google Scholar] [CrossRef]
- Meng, Q.; Matthew, J.; Zimmer, V.; Gomez, A.; Lloyd, D.; Rueckert, D.; Kainz, B. Mutual Information-Based Disentangled Neural Networks for Classifying Unseen Categories in Different Domains: Application to Fetal Ultrasound Imaging. IEEE Trans. Med. Imaging 2021, 40, 722–734. [Google Scholar] [CrossRef]
- Miyagi, Y.; Hata, T.; Bouno, S.; Koyanagi, A.; Miyake, T. Recognition of fetal facial expressions using artificial intelligence deep learning. Donald Sch. J. Ultrasound Obstet. Gynecol. 2021, 15, 223–228. [Google Scholar]
- Miyagi, Y.; Hata, T.; Bouno, S.; Koyanagi, A.; Miyake, T. Recognition of facial expression of fetuses by artificial intelligence (AI). J. Perinat. Med. 2021, 49, 596–603. [Google Scholar] [CrossRef] [PubMed]
- Sridar, P.; Kumar, A.; Quinton, A.; Nanan, R.; Kim, J.; Krishnakumar, R. Decision Fusion-Based Fetal Ultrasound Image Plane Classification Using Convolutional Neural Networks. Ultrasound Med. Biol. 2019, 45, 1259–1273. [Google Scholar] [CrossRef] [PubMed]
- Tsai, C.H.; van der Burgt, J.; Vukovic, D.; Kaur, N.; Demi, L.; Canty, D.; Wang, A.; Royse, A.; Royse, C.; Haji, K.; et al. Automatic deep learning-based pleural effusion classification in lung ultrasound images for respiratory pathology diagnosis. Phys. Medica 2021, 83, 38–45. [Google Scholar] [CrossRef]
- Chen, C.H.; Lee, Y.W.; Huang, Y.S.; Lan, W.R.; Chang, R.F.; Tu, C.Y.; Chen, C.Y.; Liao, W.C. Computer-aided diagnosis of endobronchial ultrasound images using convolutional neural network. Comput. Methods Programs Biomed. 2019, 177, 175–182. [Google Scholar] [CrossRef] [PubMed]
- Chang, Y.; Lafata, K.; Segars, W.; Yin, F.F.; Ren, L. Development of realistic multi-contrast textured XCAT (MT-XCAT) phantoms using a dual-discriminator conditional-generative adversarial network (D-CGAN). Phys. Med. Biol. 2020, 65, 065009. [Google Scholar] [CrossRef]
- Zhou, B.; Bartholmai, B.; Kalra, S.; Zhang, X. Predicting lung mass density of patients with interstitial lung disease and healthy subjects using deep neural network and lung ultrasound surface wave elastography. J. Mech. Behav. Biomed. Mater. 2020, 104, 103682. [Google Scholar] [CrossRef]
- Tomlinson, G.; Thomas, N.; Chain, B.; Best, K.; Simpson, N.; Hardavella, G.; Brown, J.; Bhowmik, A.; Navani, N.; Janes, S.; et al. Transcriptional profiling of endobronchial ultrasound-guided lymph node samples aids diagnosis of mediastinal lymphadenopathy. Chest 2016, 149, 535–544. [Google Scholar] [CrossRef] [Green Version]
- Silva, S.; Ait Aissa, D.; Cocquet, P.; Hoarau, L.; Ruiz, J.; Ferre, F.; Rousset, D.; Mora, M.; Mari, A.; Fourcade, O.; et al. Combined Thoracic Ultrasound Assessment during a Successful Weaning Trial Predicts Postextubation Distress. Anesthesiology 2017, 127, 666–674. [Google Scholar] [CrossRef]
- Wang, X.; Burzynski, J.; Hamilton, J.; Rao, P.; Weitzel, W.; Bull, J. Quantifying lung ultrasound comets with a convolutional neural network: Initial clinical results. Comput. Biol. Med. 2019, 107, 39–46. [Google Scholar] [CrossRef] [PubMed]
- Xu, Y.; Zhang, Y.; Bi, K.; Ning, Z.; Xu, L.; Shen, M.; Deng, G.; Wang, Y. Boundary Restored Network for Subpleural Pulmonary Lesion Segmentation on Ultrasound Images at Local and Global Scales. J. Digit. Imaging 2020, 33, 1155–1166. [Google Scholar] [CrossRef]
- Suri, J.; Agarwal, S.; Gupta, S.; Puvvula, A.; Biswas, M.; Saba, L.; Bit, A.; Tandel, G.; Agarwal, M.; Patrick, A.; et al. A narrative review on characterization of acute respiratory distress syndrome in COVID-19-infected lungs using artificial intelligence. Comput. Biol. Med. 2021, 130, 104210. [Google Scholar] [CrossRef] [PubMed]
- Born, J.; Beymer, D.; Rajan, D.; Coy, A.; Mukherjee, V.; Manica, M.; Prasanna, P.; Ballah, D.; Guindy, M.; Shaham, D.; et al. On the role of artificial intelligence in medical imaging of COVID-19. Patterns 2021, 2, 100269. [Google Scholar] [CrossRef]
- Alhasan, M.; Hasaneen, M. Digital imaging, technologies and artificial intelligence applications during COVID-19 pandemic. Comput. Med. Imaging Graph. 2021, 91, 101933. [Google Scholar] [CrossRef]
- Li, W.; Deng, X.; Shao, H.; Wang, X. Deep learning applications for COVID-19 analysis: A state-of-the-art survey. CMES—Comput. Model. Eng. Sci. 2021, 129, 65–98. [Google Scholar] [CrossRef]
- McDermott, C.; Łącki, M.; Sainsbury, B.; Henry, J.; Filippov, M.; Rossa, C. Sonographic Diagnosis of COVID-19: A Review of Image Processing for Lung Ultrasound. Front. Big Data 2021, 4, 612561. [Google Scholar] [CrossRef] [PubMed]
- Kallel, A.; Rekik, M.; Khemakhem, M. Hybrid-based framework for COVID-19 prediction via federated machine learning models. J. Supercomput. 2021, 78, 7078–7105. [Google Scholar] [CrossRef]
- Cossio, M.; Gilardino, R. Would the Use of Artificial Intelligence in COVID-19 Patient Management Add Value to the Healthcare System? Front. Med. 2021, 8, 34. [Google Scholar] [CrossRef]
- Chandra, G.; Challa, M. AE-CNN Based Supervised Image Classification. Commun. Comput. Inf. Sci. 2021, 1378 CCIS, 434–442. [Google Scholar]
- Girum, K.; Lalande, A.; Hussain, R.; Créhange, G. A deep learning method for real-time intraoperative US image segmentation in prostate brachytherapy. Int. J. Comput. Assist. Radiol. Surg. 2020, 15, 1467–1476. [Google Scholar] [CrossRef]
- Karimi, D.; Zeng, Q.; Mathur, P.; Avinash, A.; Mahdavi, S.; Spadinger, I.; Abolmaesumi, P.; Salcudean, S. Accurate and robust deep learning-based segmentation of the prostate clinical target volume in ultrasound images. Med. Image Anal. 2019, 57, 186–196. [Google Scholar] [CrossRef] [PubMed]
- Lei, Y.; Tian, S.; He, X.; Wang, T.; Wang, B.; Patel, P.; Jani, A.; Mao, H.; Curran, W.; Liu, T.; et al. Ultrasound prostate segmentation based on multidirectional deeply supervised V-Net. Med. Phys. 2019, 46, 3194–3206. [Google Scholar] [CrossRef] [PubMed]
- Poudel, P.; Illanes, A.; Ataide, E.; Esmaeili, N.; Balakrishnan, S.; Friebe, M. Thyroid Ultrasound Texture Classification Using Autoregressive Features in Conjunction with Machine Learning Approaches. IEEE Access 2019, 7, 79354–79365. [Google Scholar] [CrossRef]
- Daulatabad, R.; Vega, R.; Jaremko, J.; Kapur, J.; Hareendranathan, A.; Punithakumar, K. Integrating User-Input into Deep Convolutional Neural Networks for Thyroid Nodule Segmentation. In Proceedings of the 2021 43rd Annual International Conference of the IEEE Engineering in Medicine & Biology Society (EMBC), Mexico City, Mexico, 1–5 November 2021; Volume 2021, pp. 2637–2640. [Google Scholar]
- Chen, Y.; Wang, Y.; Cai, Z.; Jiang, M. Predictions for central lymph node metastasis of papillary thyroid carcinoma via CNN-based fusion modeling of ultrasound images. Trait. Du Signal 2021, 38, 629–638. [Google Scholar] [CrossRef]
- Vadhiraj, V.; Simpkin, A.; O’connell, J.; Singh Ospina, N.; Maraka, S.; O’keeffe, D. Ultrasound image classification of thyroid nodules using machine learning techniques. Medicina 2021, 57, 527. [Google Scholar] [CrossRef] [PubMed]
- Sharifi, Y.; Bakhshali, M.; Dehghani, T.; DanaiAshgzari, M.; Sargolzaei, M.; Eslami, S. Deep learning on ultrasound images of thyroid nodules. Biocybern. Biomed. Eng. 2021, 41, 636–655. [Google Scholar] [CrossRef]
- Turk, G.; Ozdemir, M.; Zeydan, R.; Turk, Y.; Bilgin, Z.; Zeydan, E. On the identification of thyroid nodules using semi-supervised deep learning. Int. J. Numer. Methods Biomed. Eng. 2021, 37, e3433. [Google Scholar] [CrossRef] [PubMed]
- Gild, M.; Chan, M.; Gajera, J.; Lurie, B.; Gandomkar, Z.; Clifton-Bligh, R. Risk stratification of indeterminate thyroid nodules using ultrasound and machine learning algorithms. Clin. Endocrinol. 2021, 96, 646–652. [Google Scholar] [CrossRef] [PubMed]
- Gulame, M.; Dixit, V.; Suresh, M. Thyroid nodules segmentation methods in clinical ultrasound images: A review. Mater. Today Proc. 2021, 45, 2270–2276. [Google Scholar] [CrossRef]
- Gomes Ataide, E.; Ponugoti, N.; Illanes, A.; Schenke, S.; Kreissl, M.; Friebe, M. Thyroid nodule classification for physician decision support using machine learning-evaluated geometric and morphological features. Sensors 2020, 20, 6110. [Google Scholar] [CrossRef]
- Zhou, H.; Wang, K.; Tian, J. Online Transfer Learning for Differential Diagnosis of Benign and Malignant Thyroid Nodules with Ultrasound Images. IEEE Trans. Biomed. Eng. 2020, 67, 2773–2780. [Google Scholar] [CrossRef]
- Sun, C.; Zhang, Y.; Chang, Q.; Liu, T.; Zhang, S.; Wang, X.; Guo, Q.; Yao, J.; Sun, W.; Niu, L. Evaluation of a deep learning-based computer-aided diagnosis system for distinguishing benign from malignant thyroid nodules in ultrasound images. Med. Phys. 2020, 47, 3952–3960. [Google Scholar] [CrossRef]
- Ma, X.; Xi, B.; Zhang, Y.; Zhu, L.; Sui, X.; Tian, G.; Yang, J. A machine learning-based diagnosis of thyroid cancer using thyroid nodules ultrasound images. Curr. Bioinform. 2020, 15, 349–358. [Google Scholar] [CrossRef]
- Stib, M.; Pan, I.; Merck, D.; Middleton, W.; Beland, M. Thyroid Nodule Malignancy Risk Stratification Using a Convolutional Neural Network. Ultrasound Q. 2020, 36, 164–172. [Google Scholar] [CrossRef] [PubMed]
- Yu, X.; Wang, H.; Ma, L. Detection of thyroid nodules with ultrasound images based on deep learning. Curr. Med. Imaging 2020, 16, 174–180. [Google Scholar] [CrossRef]
- George, M.; Anita, H. Analysis of Kidney Ultrasound Images Using Deep Learning and Machine Learning Techniques: A Review. Lect. Notes Netw. Syst. 2022, 317, 183–199. [Google Scholar]
- Ma, L.; Dong, M.; Li, G.; Liu, J.; Wu, J.; Lu, H.; Zou, G.; Zhuo, L.; Mou, S.; Zheng, M. Predicting renal diseases with deep learning model based on shear wave elastography and convolutional neural network. Chin. J. Med. Imaging Technol. 2021, 37, 919–922. [Google Scholar]
- Patil, S.; Choudhary, S. Deep convolutional neural network for chronic kidney disease prediction using ultrasound imaging. Bio-Algorithms Med.-Syst. 2021, 17, 137–163. [Google Scholar] [CrossRef]
- Sudharson, S.; Kokil, P. Computer-aided diagnosis system for the classification of multi-class kidney abnormalities in the noisy ultrasound images. Comput. Methods Programs Biomed. 2021, 205, 106071. [Google Scholar] [CrossRef] [PubMed]
- De Jesus-Rodriguez, H.; Morgan, M.; Sagreiya, H. Deep Learning in Kidney Ultrasound: Overview, Frontiers, and Challenges. Adv. Chronic Kidney Dis. 2021, 28, 262–269. [Google Scholar] [CrossRef] [PubMed]
- Herle, H.; Padmaja, K. Machine Learning Based Techniques for Detection of Renal Calculi in Ultrasound Images. In Proceedings of the Communications in Computer and Information Science, Nashik, India, 23–24 April 2021; 1440 CCIS. Springer: Berlin/Heidelberg, Germany, 2021; pp. 452–462. [Google Scholar]
- Shi, S. A novel hybrid deep learning architecture for predicting acute kidney injury using patient record data and ultrasound kidney images. Appl. Artif. Intell. 2021, 35, 1329–1345. [Google Scholar] [CrossRef]
- Alex, D.; Chandy, D. Exploration of a framework for the identification of chronic kidney disease based on 2d ultrasound images: A survey. Curr. Med. Imaging 2021, 17, 464–478. [Google Scholar] [CrossRef]
- Li, G.; Liu, J.; Wu, J.; Tian, Y.; Ma, L.; Liu, Y.; Zhang, B.; Mou, S.; Zheng, M. Diagnosis of renal diseases based on machine learning methods using ultrasound images. Curr. Med. Imaging 2021, 17, 425–432. [Google Scholar] [CrossRef]
- Sudharson, S.; Kokil, P. An ensemble of deep neural networks for kidney ultrasound image classification. Comput. Methods Programs Biomed. 2020, 197, 105709. [Google Scholar] [CrossRef] [PubMed]
- Ma, F.; Sun, T.; Liu, L.; Jing, H. Detection and diagnosis of chronic kidney disease using deep learning-based heterogeneous modified artificial neural network. Future Gener. Comput. Syst. 2020, 111, 17–26. [Google Scholar] [CrossRef]
- Sagreiya, H.; Akhbardeh, A.; Li, D.; Sigrist, R.; Chung, B.; Sonn, G.; Tian, L.; Rubin, D.; Willmann, J. Point Shear Wave Elastography Using Machine Learning to Differentiate Renal Cell Carcinoma and Angiomyolipoma. Ultrasound Med. Biol. 2019, 45, 1944–1954. [Google Scholar] [CrossRef]
- Zheng, Q.; Furth, S.; Tasian, G.; Fan, Y. Computer-aided diagnosis of congenital abnormalities of the kidney and urinary tract in children based on ultrasound imaging data by integrating texture image features and deep transfer learning image features. J. Pediatr. Urol. 2019, 15, 75.e1–75.e7. [Google Scholar] [CrossRef] [Green Version]
- Yin, S.; Peng, Q.; Li, H.; Zhang, Z.; You, X.; Liu, H.; Fischer, K.; Furth, S.; Tasian, G.; Fan, Y. Multi-instance Deep Learning with Graph Convolutional Neural Networks for Diagnosis of Kidney Diseases Using Ultrasound Imaging. In Lecture Notes in Computer Science (Including Subseries Lecture Notes in Artificial Intelligence and Lecture Notes in Bioinformatics), Shenzhen, China, 17 October 2019; 11840 LNCS; Springer: Berlin/Heidelberg, Germany, 2019; pp. 146–154. [Google Scholar]
- Pyle, R.; Bevan, R.; Hughes, R.; Rachev, R.; Ali, A.; Wilcox, P. Deep Learning for Ultrasonic Crack Characterization in NDE. IEEE Trans. Ultrason. Ferroelectr. Freq. Control 2021, 68, 1854–1865. [Google Scholar] [CrossRef]
- Oliveira, M.; Simas Filho, E.; Albuquerque, M.; Santos, Y.; da Silva, I.; Farias, C. Ultrasound-based identification of damage in wind turbine blades using novelty detection. Ultrasonics 2020, 108, 106166. [Google Scholar] [CrossRef]
- Li, T.H. From zero crossings to quantile-frequency analysis of time series with an application to nondestructive evaluation. Appl. Stoch. Model. Bus. Ind. 2020, 36, 1111–1130. [Google Scholar] [CrossRef]
- Nasir, V.; Fathi, H.; Kazemirad, S. Combined machine learning—Wave propagation approach for monitoring timber mechanical properties under UV aging. Struct. Health Monit. 2021, 20, 2035–2053. [Google Scholar] [CrossRef]
- Obaton, A.F.; Wang, Y.; Butsch, B.; Huang, Q. A non-destructive resonant acoustic testing and defect classification of additively manufactured lattice structures. Weld. World 2021, 65, 361–371. [Google Scholar] [CrossRef]
- Rodrigues, L.; Cruz, F.; Oliveira, M.; Simas Filho, E.; Albuquerque, M.; Silva, I.; Farias, C. Carburization level identification in industrial HP pipes using ultrasonic evaluation and machine learning. Ultrasonics 2019, 94, 145–151. [Google Scholar] [CrossRef]
- Silva, L.; Simas Filho, E.; Albuquerque, M.; Silva, I.; Farias, C. Embedded decision support system for ultrasound nondestructive evaluation based on extreme learning machines. Comput. Electr. Eng. 2021, 90, 106891. [Google Scholar] [CrossRef]
- Soltani Firouz, M.; Farahmandi, A.; Hosseinpour, S. Early Detection of Freeze Damage in Navel Orange Fruit Using Nondestructive Low Intensity Ultrasound Coupled with Machine Learning. Food Anal. Methods 2021, 14, 1140–1149. [Google Scholar] [CrossRef]
- Arbaoui, A.; Ouahabi, A.; Jacques, S.; Hamiane, M. Concrete cracks detection and monitoring using deep learning-based multiresolution analysis. Electronics 2021, 10, 1772. [Google Scholar] [CrossRef]
- Salazar, A.; Safont, G.; Vergara, L.; Vidal, E. Pattern recognition techniques for provenance classification of archaeological ceramics using ultrasounds. Pattern Recognit. Lett. 2020, 135, 441–450. [Google Scholar] [CrossRef]


| Ref. | Organ | Objective | Technique | Results | Datasets |
|---|---|---|---|---|---|
| [60] | Breast | Recognition of | Faster R-CNN | Mean accuracy: 87% | Public |
| breast ultrasound | for detection of | Performances of | 6746 and | ||
| nodules with | nodules and SSL | SSL and SL | 2220 nodules | ||
| low labeled images | for classification | are comparable | |||
| [95] | Arteries | Detection of | Bi-GRU NN | Mean accuracy: 80% | Private |
| end-diastolic | trained by a | Better accuracy | 20 coronary | ||
| frames in NIRS-IVUS | segment of | than expert analysts | arteries | ||
| images of | 64 frames | with Doppler criteria | |||
| coronary arteries | |||||
| [96] | Heart | Evaluation of | CNN with | Mean ROC AUC | Public |
| biomarkers | residual | Anemia: 80% | 108521 | ||
| from | connections and | BNP: 84% | echocardiogram | ||
| echocardiogram | spatio-temporal | Troponin I: 75% | studies | ||
| videos | convolutions for | BUN: 71.5% | |||
| estimation of | |||||
| biomarker values | |||||
| [97] | Heart | Extract information | Texture-based features | ROC AUC: 80% | Public |
| associated | extracted with unsupervised | Sensitivity: 86.4% | 392 subjects | ||
| with myocardial | similarity networks | Specificity: 83.3% | |||
| remodeling | ML models (DT,RF,LR,NN) | Prediction of | |||
| from still | for prediction of | myocardial fibrosis | |||
| ultrasound | functional remodeling | only from textures | |||
| images | LR for predicting | of ultrasound images | |||
| presence of fibrosis | |||||
| [98] | Liver | Detection of | SSD and FPN to | ROC AUC | Public |
| gallstones and | classify gallstones with | ResNet-50: 92% | 89,000 images | ||
| acute cholecystitis | features extracted | MobileNetV2: 94% | |||
| with still images | by ResNet-50 and | detect cholecystitis | |||
| for preliminary | MobileNetV2 | and gallstones with | |||
| diagnosis | to classify | acceptable discrimination | |||
| cholecystitis | and speed | ||||
| [99] | Fetus | Gestational age and | AlexNet variation | Accuracy % | Private |
| automatic estimation | for TC frames | TC plane detection: 99% | 5000 TC images | ||
| from TC diameter | extraction | TC segmentation: 97.98% | |||
| as a POCUS solution | FCN for TC | Accurate GA | |||
| localization and | estimation | ||||
| measurment | |||||
| [100] | Fetus | Automatic | LH-SVM | Accuracy: 94.67% | Private |
| recognition | SVM for learning of | Average precision: 94.25% | 943 standard | ||
| and classification | features extracted | Average recall rate: 93.88% | planes | ||
| of FFUSP | by LBP and HOG | Average F1 score: 94.88% | 424 nasolabial | ||
| for diagnosis | Effective prediction | coronal planes | |||
| of cardiac | and classification | 50 nonstandard | |||
| conditions | of FFUSP | planes | |||
| [101] | Lungs | Assist diagnosis | Pre-trained ResNet50 | Average F1-score | Public |
| of Covid19 | Fully connected layer | Bal dataset: 93.5% | 3909 images | ||
| on LUS images | for feature extraction | Unbal dataset: 95.3% | |||
| of FFUSP | Global average pooling | Improves performances | |||
| for features classification. | in radiologists’ diagnosis |
| Ref. | Organ | Objective | Technique | Datasets | Results |
|---|---|---|---|---|---|
| [67] | Breast | Automatic | Fuzzy preprocessing | GA: 95.45% | Public |
| semantic | 8 CNN-based | Mean IoU: 78.7% | 1200 images | ||
| segmentation | SS models | BF: 68.08% | |||
| of breast | Improvements only | ||||
| tumors | with batch processing | ||||
| [69] | Breast | Automatic | BUS images enhanced | TPR: 90.33% | Private |
| semantic | with wavelet features | FPR: 90.00% | 325 BUS images | ||
| segmentation | Fuzzy FCN segmentation | IoU: 81.29% | |||
| of breast | Fine-tuning based on | Fuzzy FCN | |||
| tumors | anatomy constraints with | provides better | |||
| conditional random fields | performances | ||||
| CRFs performs | than non-fuzzy FCN | ||||
| [70] | Breast | Automatic | Preprocessing through CLAHE | Mean values | Public |
| semantic | UNet variant based on | HD: 77.6% | 264 BUS images | ||
| segmentation | VE block for encoding | JM: 80.1% | 830 BUS images | ||
| of breast | Concatenated convolutions | DM: 90.7% | |||
| tumors | for segmentation | Better segmentation | |||
| results than | |||||
| classic CNN methods | |||||
| [73] | Breast | Segmentation of | UNet modified | DSC: 90.5% | Private |
| tumors by | with attention | Better accuracy | 510 images | ||
| incorporating | blocks accounting | with saliency maps | |||
| prior domain | for input saliency | Robustness to | |||
| specific | maps to generate | images from | |||
| knowledge | segmentation | different US scanners | |||
| [111] | Arteries | Measurement | 8 UNet++ with | Mean DSC: 87.15% | Private |
| of total carotid | different backbones | Datasets collected in | 144 subjects | ||
| plaque area in | and architectures | different institutions | 497 subjects | ||
| B-mode images | Small datasets for | ||||
| algorithm training | |||||
| [112] | Arteries | Automatic | MFCNN for | Median values | Public |
| segmentation | preliminary segmentation | JI_lumen: 0.913 | 160 IVUS | ||
| of lumen and | GP regressor to | JI_vessel: 0.94 | pullbacks | ||
| vessel contours | construct lumen | HD_lumen: 0.196 mm | |||
| and vessel contours | HD_vessel: 0.163 mm | ||||
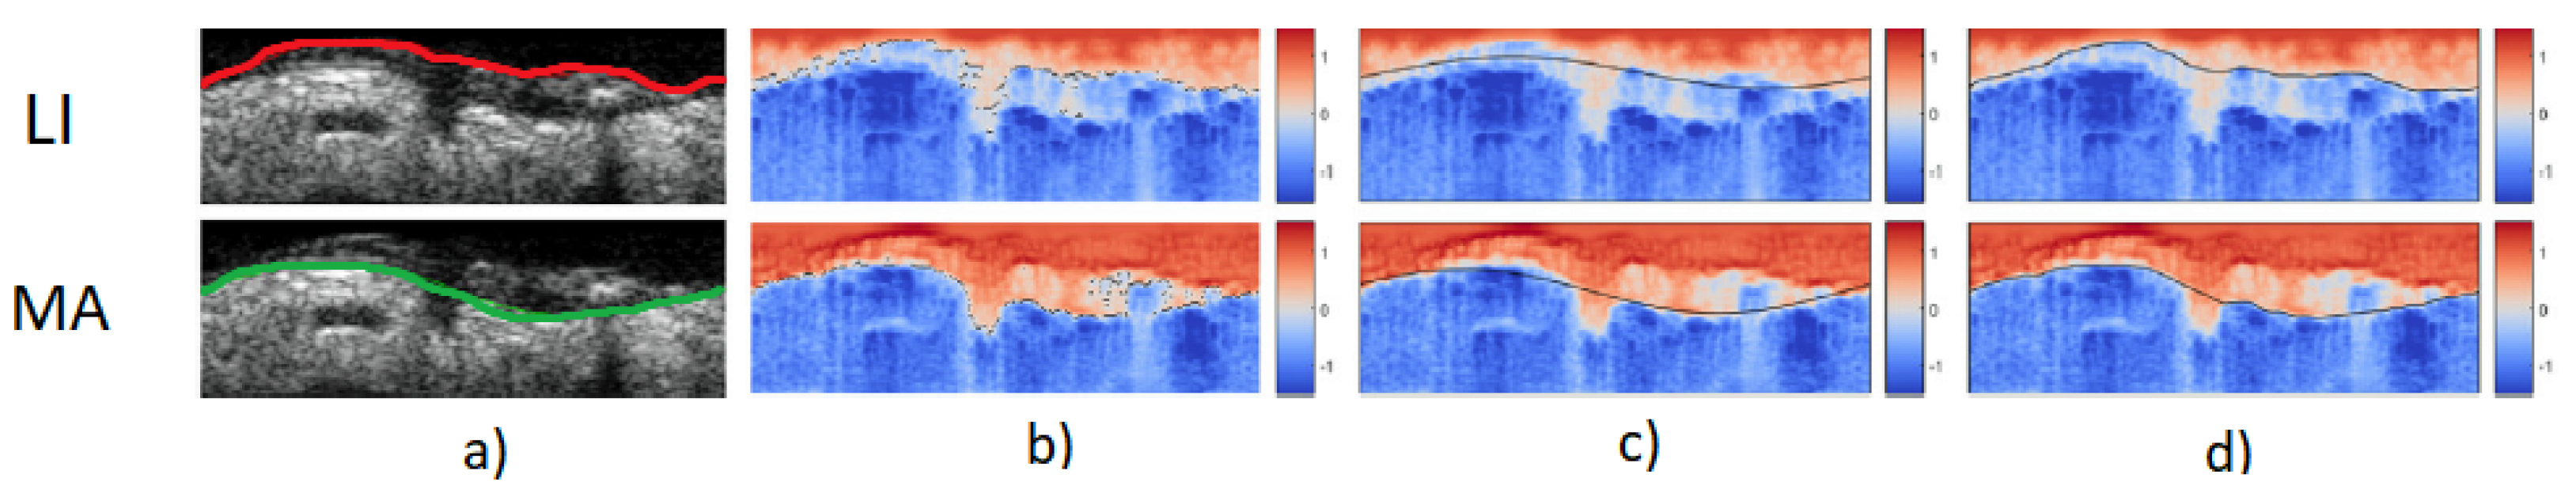
| [128] | Arteries | Lumen intima and | SVM and RF for | JM | Public |
| media-adventia | classification maps | LI: 0.88 ± 0.8 mm | 435 images | ||
| fully automatic | LI and MA segmentation | MA: 0.84 ± 0.9 mm | |||
| segmentation of | with deformable contours | Good accuracy | |||
| arterial layers | method | Modular and open-source | |||
| [129] | Liver | Automatic | DCNN developed | ICCs | Private |
| quantification | with ICNet for | Hepatic: 91.9% | 294 liver images | ||
| of the hepatorenal | organ segmentation | Renal: 91.6% | |||
| index (HRI) for | Gaussian texture for | HRI: 73.4% | |||
| evaluation of | HRI quantification | Results comparable to | |||
| fatty liver | those of radiologists | ||||
| [130] | Fetus | Automatic | CSC: UNet variant | MIOU: 0.55 | Private |
| segmentation | that calibrate | Better than DeepLabv3+ | 421 fetal cardiac | ||
| of the ventricular | segmentation with | and U-net | US videos | ||
| septum | time-series information | ||||
| [131] | Fetus | Automatic | U-net/DeepLabV3+ | IoU | Private |
| segmentation | segmentation enhanced | DeepLabv3+: 0.47 | 538 4VC images | ||
| of the thoracic | with MultiFrame and | U-Net: 0.493 | in 280 videos | ||
| wall in | Cylinder methods | Improved performances | |||
| ultrasound videos | without altering | ||||
| NN structure | |||||
| [132] | Fetus | Automatic | CPD variation for | Target registration | Private |
| fetal head | point cloud segmentation | error: 6.38 ± 3.24 mm | 18 fetal brain | ||
| segmentation from | and estimation of | ||||
| 3D noisy images | probabilistic weights | ||||
| obtained with RF | |||||
| [133] | Lungs | Assessment of | DSA-MIL to combine | Accuracy | Public |
| COVID19 from | multiple LUS data | Patient severity: 75% | 233 patients | ||
| LUS and | MA-CLR | Binari identification: 87.5 % | |||
| clinical information | for combination | Especially suited for | |||
| of LUS data and | pregnant women | ||||
| clinical information | and children | ||||
| [134] | Thyroid | Efficient and | CNN based on a layer | IoU: 79.5% | Public |
| precise semantic | that integrates dense | TPF: 88.5% | 3794 images | ||
| segmentation of | connectivity, dilated | FPF: 0.13% | |||
| thyroid nodules | convolutions and | High accuracy/efficiency | |||
| factorized filters | Real time |
| Ref. | Organ | Objective | Technique | Results | Datasets |
|---|---|---|---|---|---|
| [78] | Breast | Classification of | Pretrained ResNet-101 | Sensitivity: 94.34% | Private |
| tumors between | for feature extraction | Specificity: 93.22% | 2099 images | ||
| benign and | Linear SVM | PPV: 92.6% | |||
| malignant from | for classification | NPV: 94.8% | |||
| B-mode images | More accurate | ||||
| performances | |||||
| than radiologists | |||||
| [89] | Breast | Classification of | 3D CNN | Sensitivity: 97.2% | Public |
| tumors between | for temporal/spatial | Accuracy: 86.3% | 221 lesions | ||
| benign and | extraction | Domain knowledge | |||
| malignant | DKG-TAM for | allows diagnostics | |||
| from CEUS | temporal attention | improvements | |||
| DKG-CAM for | |||||
| features concatenation | |||||
| [91] | Breast | Highly automatic | AutoML Vision | Accuracy: 86% | Public |
| classification of | For comparison: | Sensitivity: 84% | 895 images | ||
| tumors from | CNN and | Specificity: 88% | |||
| B-mode images | ML classifiers | F1: 0.83 | |||
| (RF, KNN, LDA, LR) | AutoML Vision | ||||
| comparable with | |||||
| other methods | |||||
| [93] | Breast | Evaluation of ML | 6 ML classifiers: | LR | Public |
| methods for | LR, RF, Extra Trees, | ROC AUC: 90.6% | 1345 patients | ||
| breast cancer | SVM, MLP, XG Boost | Brier score: 0.65 | |||
| diagnosis images | |||||
| [119] | Arteries | Characterization and | 7 CNN | Mean accuracy | Public |
| classification of | for data optimization | DL: 93.55% | 346 patients | ||
| carotid ultrasound | TL for characterizing | TL: 94.55% | |||
| plaque tissues | carotid plaques and | ML: 89% | |||
| 4 ML models | |||||
| (KNN, SVM,DT,RF) | |||||
| [120] | Arteries | Automation of the | HNN for classification | Accuracy | Public |
| initial interpretation | of aortillac and | Normal: 97% | 5761 LEAD | ||
| of lower extremity | trifurcation disease | Aortillac: 82% | studies | ||
| arterial Doppler | RF for | Femoropopliteal: 90.1% | 18,659 | ||
| and duplex carotid | classification | Trifurcation: 90.5% | duplex | ||
| ultrasound studies | of stenosis | Good performances | carotid | ||
| studies | |||||
| [139] | Heart | Lightweight and | Three teacher | Accuracy: 89 % | Public |
| fast transthoracic | networks (VGG-16, | Six times | 16,612 | ||
| ecocardiography | DenseNet and Resnet) | faster than | echocines | ||
| classification for | transfer learned | huge models | |||
| diagnosis of | knowledge to | ||||
| cardiac conditions | lighweight models | ||||
| [146] | Liver | Differentiation of | SVM algorithm | AUC: 0.94% | Private |
| malignant from | for establishing | Sensitivity: 92.59% | 175 focal lesions | ||
| benign focal liver | two predictive | Specificity: 87.5% | |||
| lesions using | models: ultrasomics | PPV: 94.59% | |||
| 2D SWE-based | features and | NPV: 82.50% | |||
| ultrasomics | SWE measurements | Good accuracy | |||
| of combined method | |||||
| [147] | Liver | Differentiation of | LR and PCA to | AUC | Private |
| of infected focal | reduce dimension | HCC: 0.836% | 104 focal | ||
| liver lesions | of radiomics features | CC: 0.766% | liver lesions | ||
| from malignant | NB, DT,KNN,LR,SVM | cHCC-CC: 0.74 | 485 hepatic | ||
| mimickers in | to obtain | Liver metastasis: 0.808 | tumors | ||
| B-mode images | predictive models | MH tumor: 0.745 | |||
| [149] | Liver | Liver fibrosis | Image proc pipeline: | AUC | Private |
| classification | Quality assessment | Specificity: 71% | 5526 SWE | ||
| with SWE images | ROI selection | Sensitivity: 95% | images | ||
| fibrosis classification | Better accuracy | ||||
| with SVM, RF, CNN, FCNN | than manual methods | ||||
| [155] | Liver | Identification of | Five different | Sensitivity: 99% | Private |
| liver steatosis | classifiers (MLP, | Accuracy: 100% | 340 images | ||
| from anisotropy | PNN,SVM,LVQ, | with anisotropy | |||
| features in B-mode | Bayesian) | features and | |||
| images | Three features | PNN classifiers | |||
| sets including | |||||
| anisotropy features | |||||
| [165] | Fetus | Classification and | CNN AlexNet for | Accuracy: 96 % | Public |
| segmentation of | classification of | Almost automatic | 10,000 labeled | ||
| fetal head | headframes | gestational age | images | ||
| from ultrasound | CNN Unet for | estimation | 1000 ultrasound | ||
| videos | segmentation of | videos | |||
| classified | |||||
| headframes | |||||
| [174] | Lungs | Development of | Deep learning | Accuracy | Private |
| a system for | based on Reg-STN | Frame: 92.2% | 623 videos | ||
| accurate interpretation | trained with | Video: 91.1% | |||
| of pleural effusion | supervised and | Good agreement | |||
| in LUS images | weakly supervised | with expert | |||
| methods models | clinicians |
Publisher’s Note: MDPI stays neutral with regard to jurisdictional claims in published maps and institutional affiliations. |
© 2022 by the authors. Licensee MDPI, Basel, Switzerland. This article is an open access article distributed under the terms and conditions of the Creative Commons Attribution (CC BY) license (https://creativecommons.org/licenses/by/4.0/).
Share and Cite
Micucci, M.; Iula, A. Recent Advances in Machine Learning Applied to Ultrasound Imaging. Electronics 2022, 11, 1800. https://doi.org/10.3390/electronics11111800
Micucci M, Iula A. Recent Advances in Machine Learning Applied to Ultrasound Imaging. Electronics. 2022; 11(11):1800. https://doi.org/10.3390/electronics11111800
Chicago/Turabian StyleMicucci, Monica, and Antonio Iula. 2022. "Recent Advances in Machine Learning Applied to Ultrasound Imaging" Electronics 11, no. 11: 1800. https://doi.org/10.3390/electronics11111800