1. Introduction
The coordination of comprehensive public transportation services requires a refined analysis of passengers’ travel behaviors. Therefore, the establishment of an intelligent bus-dispatching model aims to achieve operational cost-effectiveness for both passengers and bus operators.
Several in-depth studies have been carried out in this field. For instance, Petersen et al. [
1] identified a few irregular peaks in bus-commuting times based on a multi-output and multi-time-step convolutional LSTM neural network; their findings could be used to analyze passenger-flow changes during traffic congestion and emergencies in metropolitan areas. Fang et al. [
2] proposed a computationally efficient Contextual Spatial-Temporal Graph Attention Network for a Travel Time Estimation (Con-STGAT) framework, to increase accuracy through spatial–temporal correlation. In their study, they applied Convolution, thereby capturing the bus routes in nearby road segments, while calculating the travel time on each road segment in advance. Wihartiko et al. [
3] established an integer programming model using an improved genetic algorithm to optimize a bus timetable. Li et al. [
4] studied timetable optimization for one bus line. By taking the bus travel time as a fuzzy variable, a fuzzy dual-objective model was established to minimize the total time efficiency for both the service providers and end users. Consideration has also been given to passengers transferring between different types of public transport. Wei et al. [
5] established an uncertain bi-level programming model to optimize a bus timetable. An algorithm to estimate distribution was designed to solve the bi-level models. Wu et al. [
6] studied the coordination of multiple bus schedules within transfer stations. Morales et al. [
7] established an injection stochastic model based on the second moment of headway distribution to determine when a bus should be injected within the headway. Liu et al. [
8] established a dual-objective integer-programming model that considers the common interests of passengers and bus operators. Cao et al. [
9] explored the decision-making algorithm of a real-time automated shuttle bus service (ASBS) based on the graph theory of the deficit function. In view of the complexity of a large-scale Genetic algorithm, the binary variable iterative method was used in the modelling. In addition, neural networks [
10,
11,
12], fuzzy control [
13,
14], and deep learning [
15] have been widely used in bus scheduling. Through the recent introduction of customized buses [
16,
17,
18], the adoption of different payment methods [
19,
20,
21], and the promotion of self-driving vehicles [
22,
23,
24,
25], the complexity of bus-passenger flow has significantly increased, which has led to new challenges for bus-scheduling services.
The bus-passenger-flow statistics usually adopt the binocular algorithm which collects the passenger-flow data via sensitive multi-channel video, in a complex environment. Through this reliable on-board passenger flow data, we can evaluate the daily ticket number and supervise ticketing combined with the ticketing system. Although many scientists adopt more advanced algorithms to improve the accuracy, many shortfalls are still evidenced in public-transport management. One example is that the ability to resolve the accumulated factors from a chain of rare events has still not been realized.
One key challenge for bus scheduling is to accurately determine passenger flow. In recent years, the ticket-payment method has gradually shifted from a single-card method to multiple-payment methods such as QR codes, digital wallets, and facial-recognition. As a result, the significance of single-card data for an OD analysis has continuously declined. In addition, public-transport subsidizing policies could cause a discrepancy between the number of passengers and the number of payment transfers. These factors together will impact the accuracy of passenger-flow analyses to a certain extent.
Therefore, improving the accuracy of passenger OD analysis and enhancing data verification is essential to establishing an intelligent bus-scheduling model. To this end, a database for passenger behavior was established in this study based on multi-sensor data fusion and payment authenticity verification. The study aimed to propose an intelligent bus scheduling algorithm that minimizes passenger wait time and maximizes operational efficiency. The method was tested based on real-time passenger flow data as well as historical data, to improve bus-route planning and operation management.
2. Refinement Analysis of Bus Passenger Flow Based on Multiple Payment Methods
Bus passenger flow data represent a key component for regulatory decision making and operation management. However, for the current bus payment data, only the boarding location of passengers can be retrieved. Unfortunately, the destination location of passengers is unknown, and is still hard to detect. Moreover, since the data only contain part of the bus travel information, the data cannot reflect the real bus-traveling situations. There are three main problems:
- (1)
For ordinary buses, the payment data (e.g., bus card and QR code) only reflect the number of card-users boarding a bus. For bus rapid transit (BRT) buses, the payment data only contains the card-user flow entering any one of the stations, while the passenger flow exiting the station is unknown.
- (2)
The on-board passenger-flow-detection technology is able to obtain the flow of passengers boarding and leaving the bus, yet the quantity of the flow of passengers boarding on and leaving the bus is limited, and only certain buses are covered.
- (3)
The diversified payment data and on-board video passenger flow data only meet the scheduling demand of a limited quantity of the flow of passengers boarding and leaving the bus for buses. The data are not sufficient to analyze urban-scale travel information and thus, do not provide comprehensive decision-making support for bus scheduling.
In order to improve the quality of public-transport services and optimally allocate transportation resources, we focused on the passenger payment data and built analysis methods. Firstly, the data including passenger payment data, on board passenger flow video data, real-time vehicle positioning data, as well as the bus waybill data and bus station passenger-flow data from the other intelligent bus systems, were collected and arranged. Then, to further analyze bus-passenger flow based on the original public-transport analysis, according to the means-end chain theory, the spatiotemporal distribution of passenger flow data was obtained to carry out the Origin–Destination (OD) analysis of passenger flow. Finally, the passenger-flow-refinement analysis based on various dimensions including vehicle, station, and passenger flow, could be carried out. The flowchart of bus passenger flow analysis is showed in
Figure 1.
2.1. Passenger Flow Analysis with Diversified Payment Data
The refinement analysis of bus-passenger-flow involves multi-dimensional passenger-flow analyses, including a passenger-travel analysis, vehicle-passenger-flow analysis, station-passenger-flow analysis, route-passenger-flow analysis, and regional-passenger flow-OD analysis. A passenger flow analysis with diversified payment data is composed of the following four types of analyses:
- (1)
Passenger-travel analysis: travel characteristics of a bus and a subway (transferring to a bus).
- (2)
Vehicle-passenger-flow analysis: used to obtain individual passenger OD data.
- (3)
OD analysis of bus stations: used to display the bus stations according to their OD levels, which can provide data references for bus-network modification and scheduling.
- (4)
OD analysis of bus routes: used to display the bus routes according to their OD levels and to perform a bus corridor analysis.
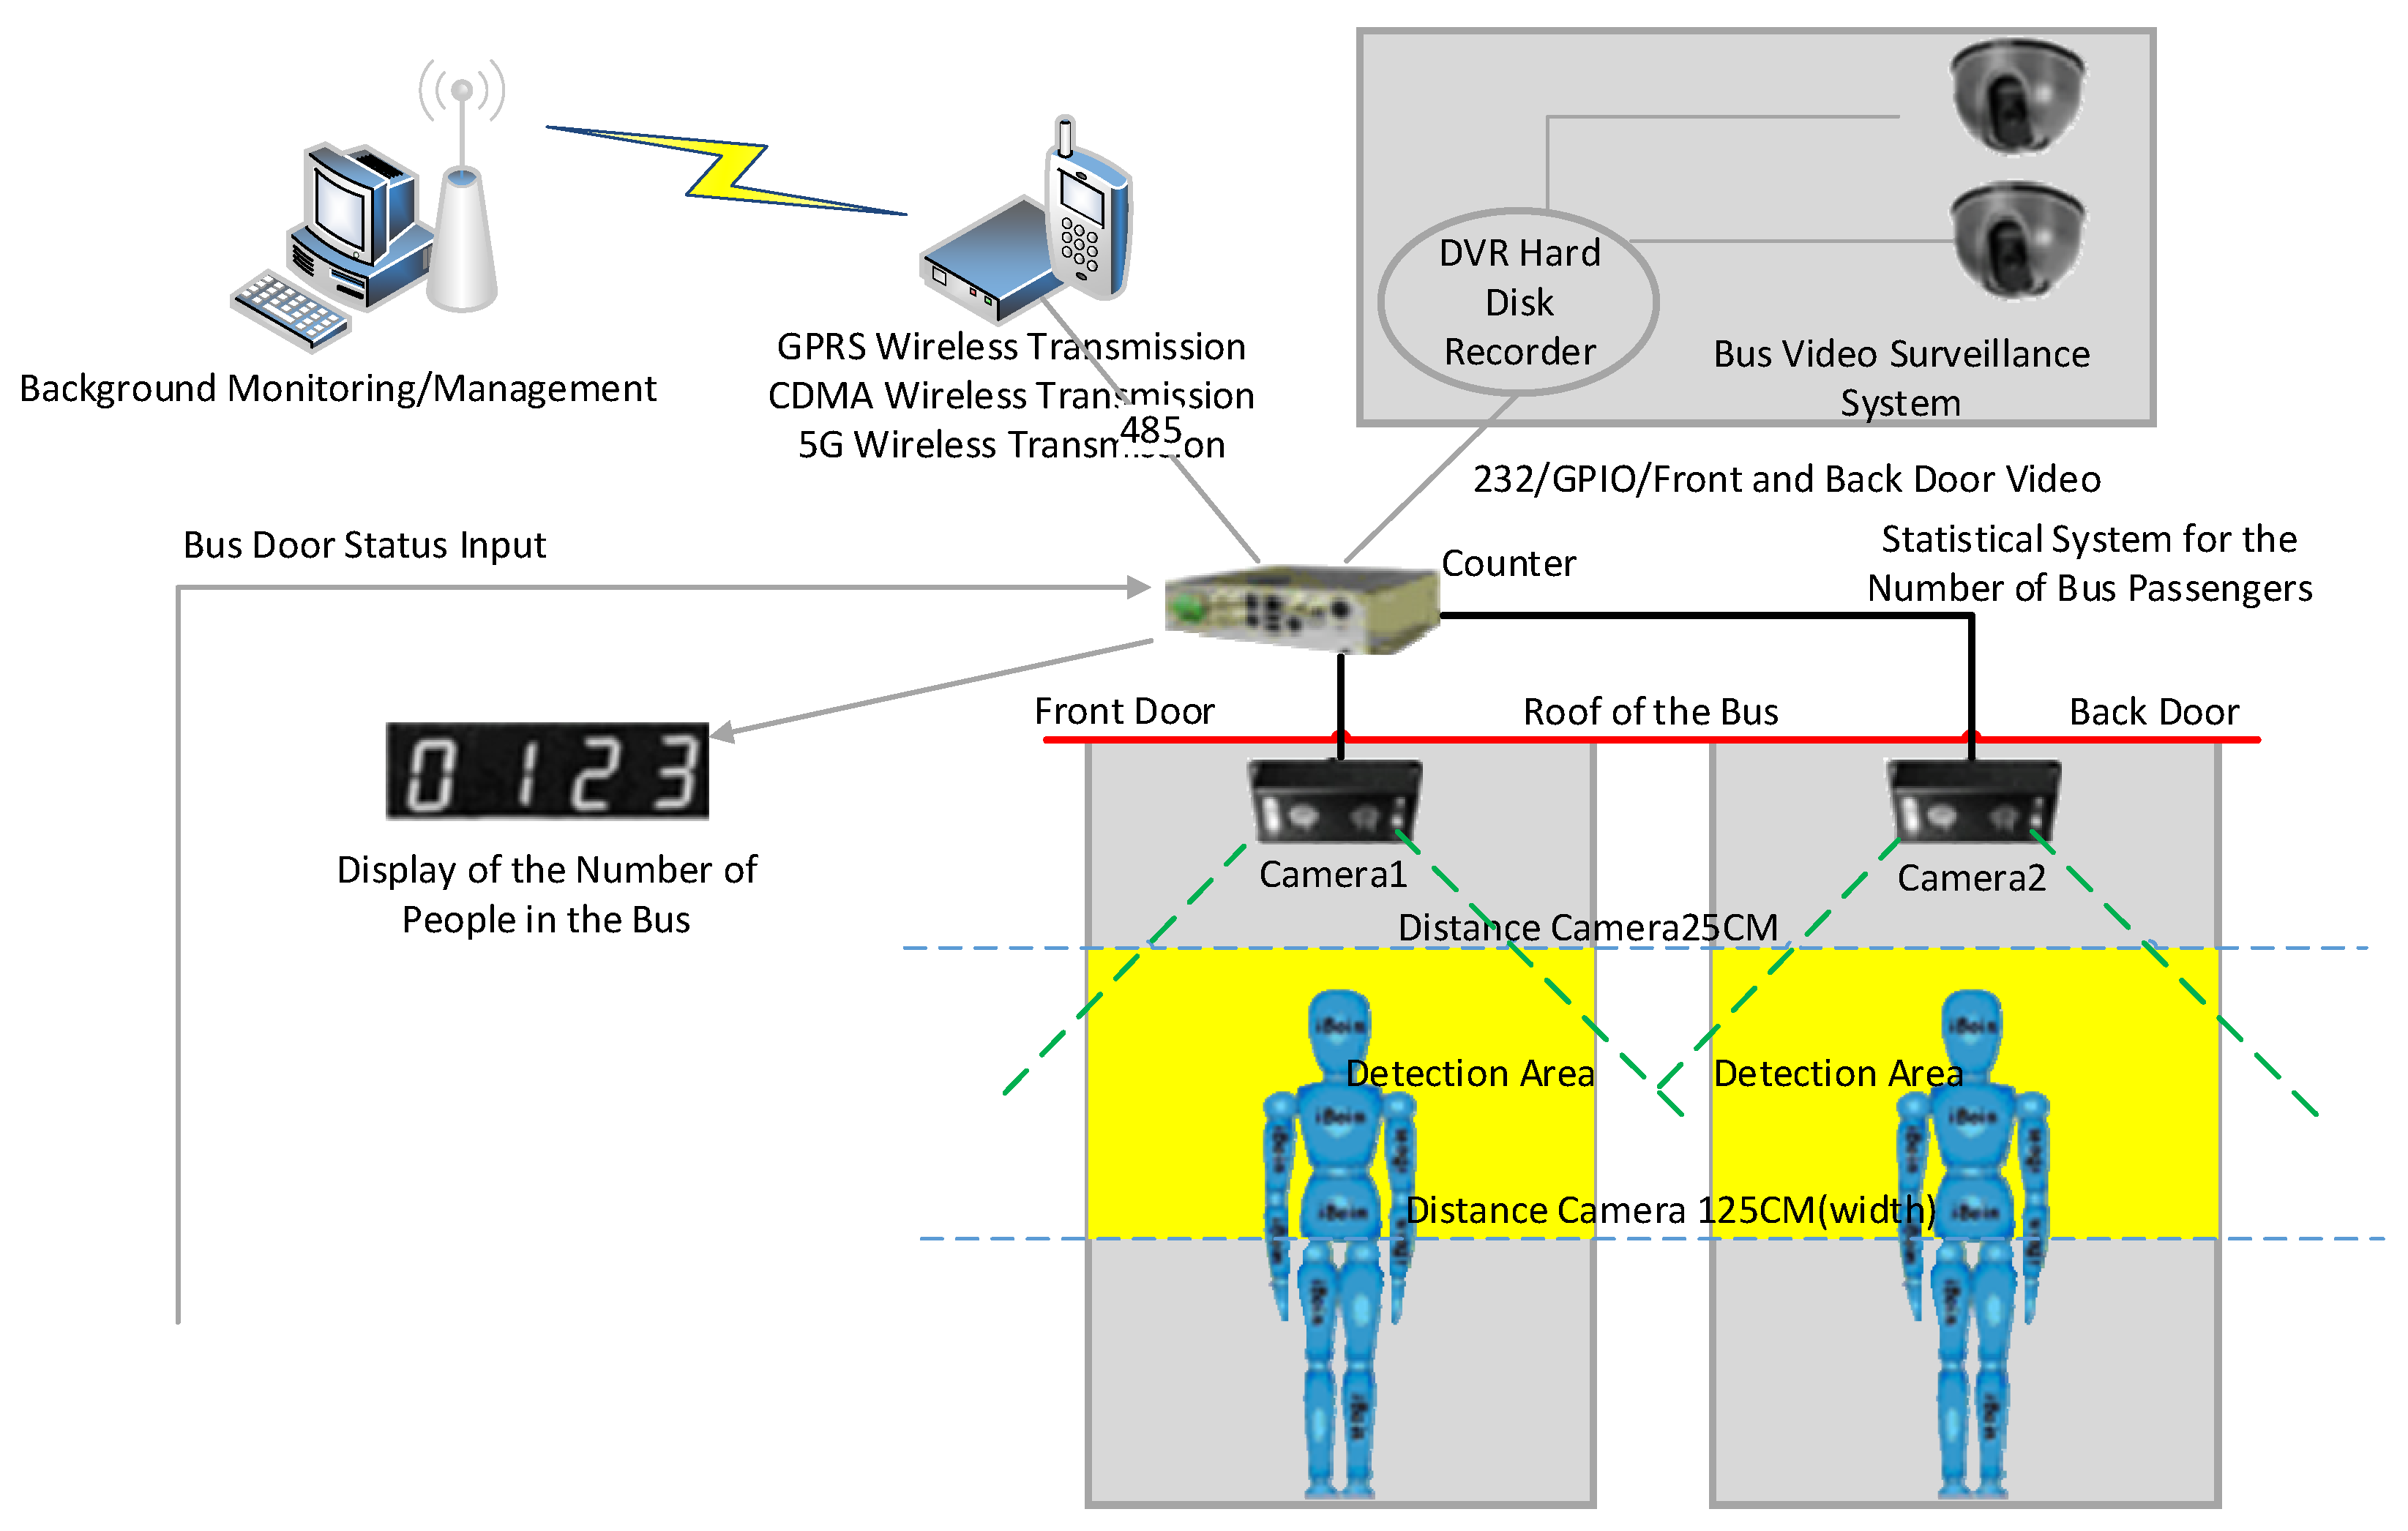
2.2. Video Passenger Flow Data
In this study, video acquisition devices installed on the front and rear doors of the buses and the BRT buses were used to collect and calculate passenger flow data accurately.
Figure 2 provides a schematic diagram of the video-data collection and transmission processes.
The video data enabled a real-time congestion analysis and the signalling of an early warning in busses based on the congestion degree. Specifically, based on the video passenger-flow data, the real-time passenger capacity of each vehicle was calculated. Then, according to the vehicle’s passenger-carrying capacity, the congestion degree was calculated in real time. The congestion degree was divided into the following three levels: low, medium, and high [
21,
26,
27].
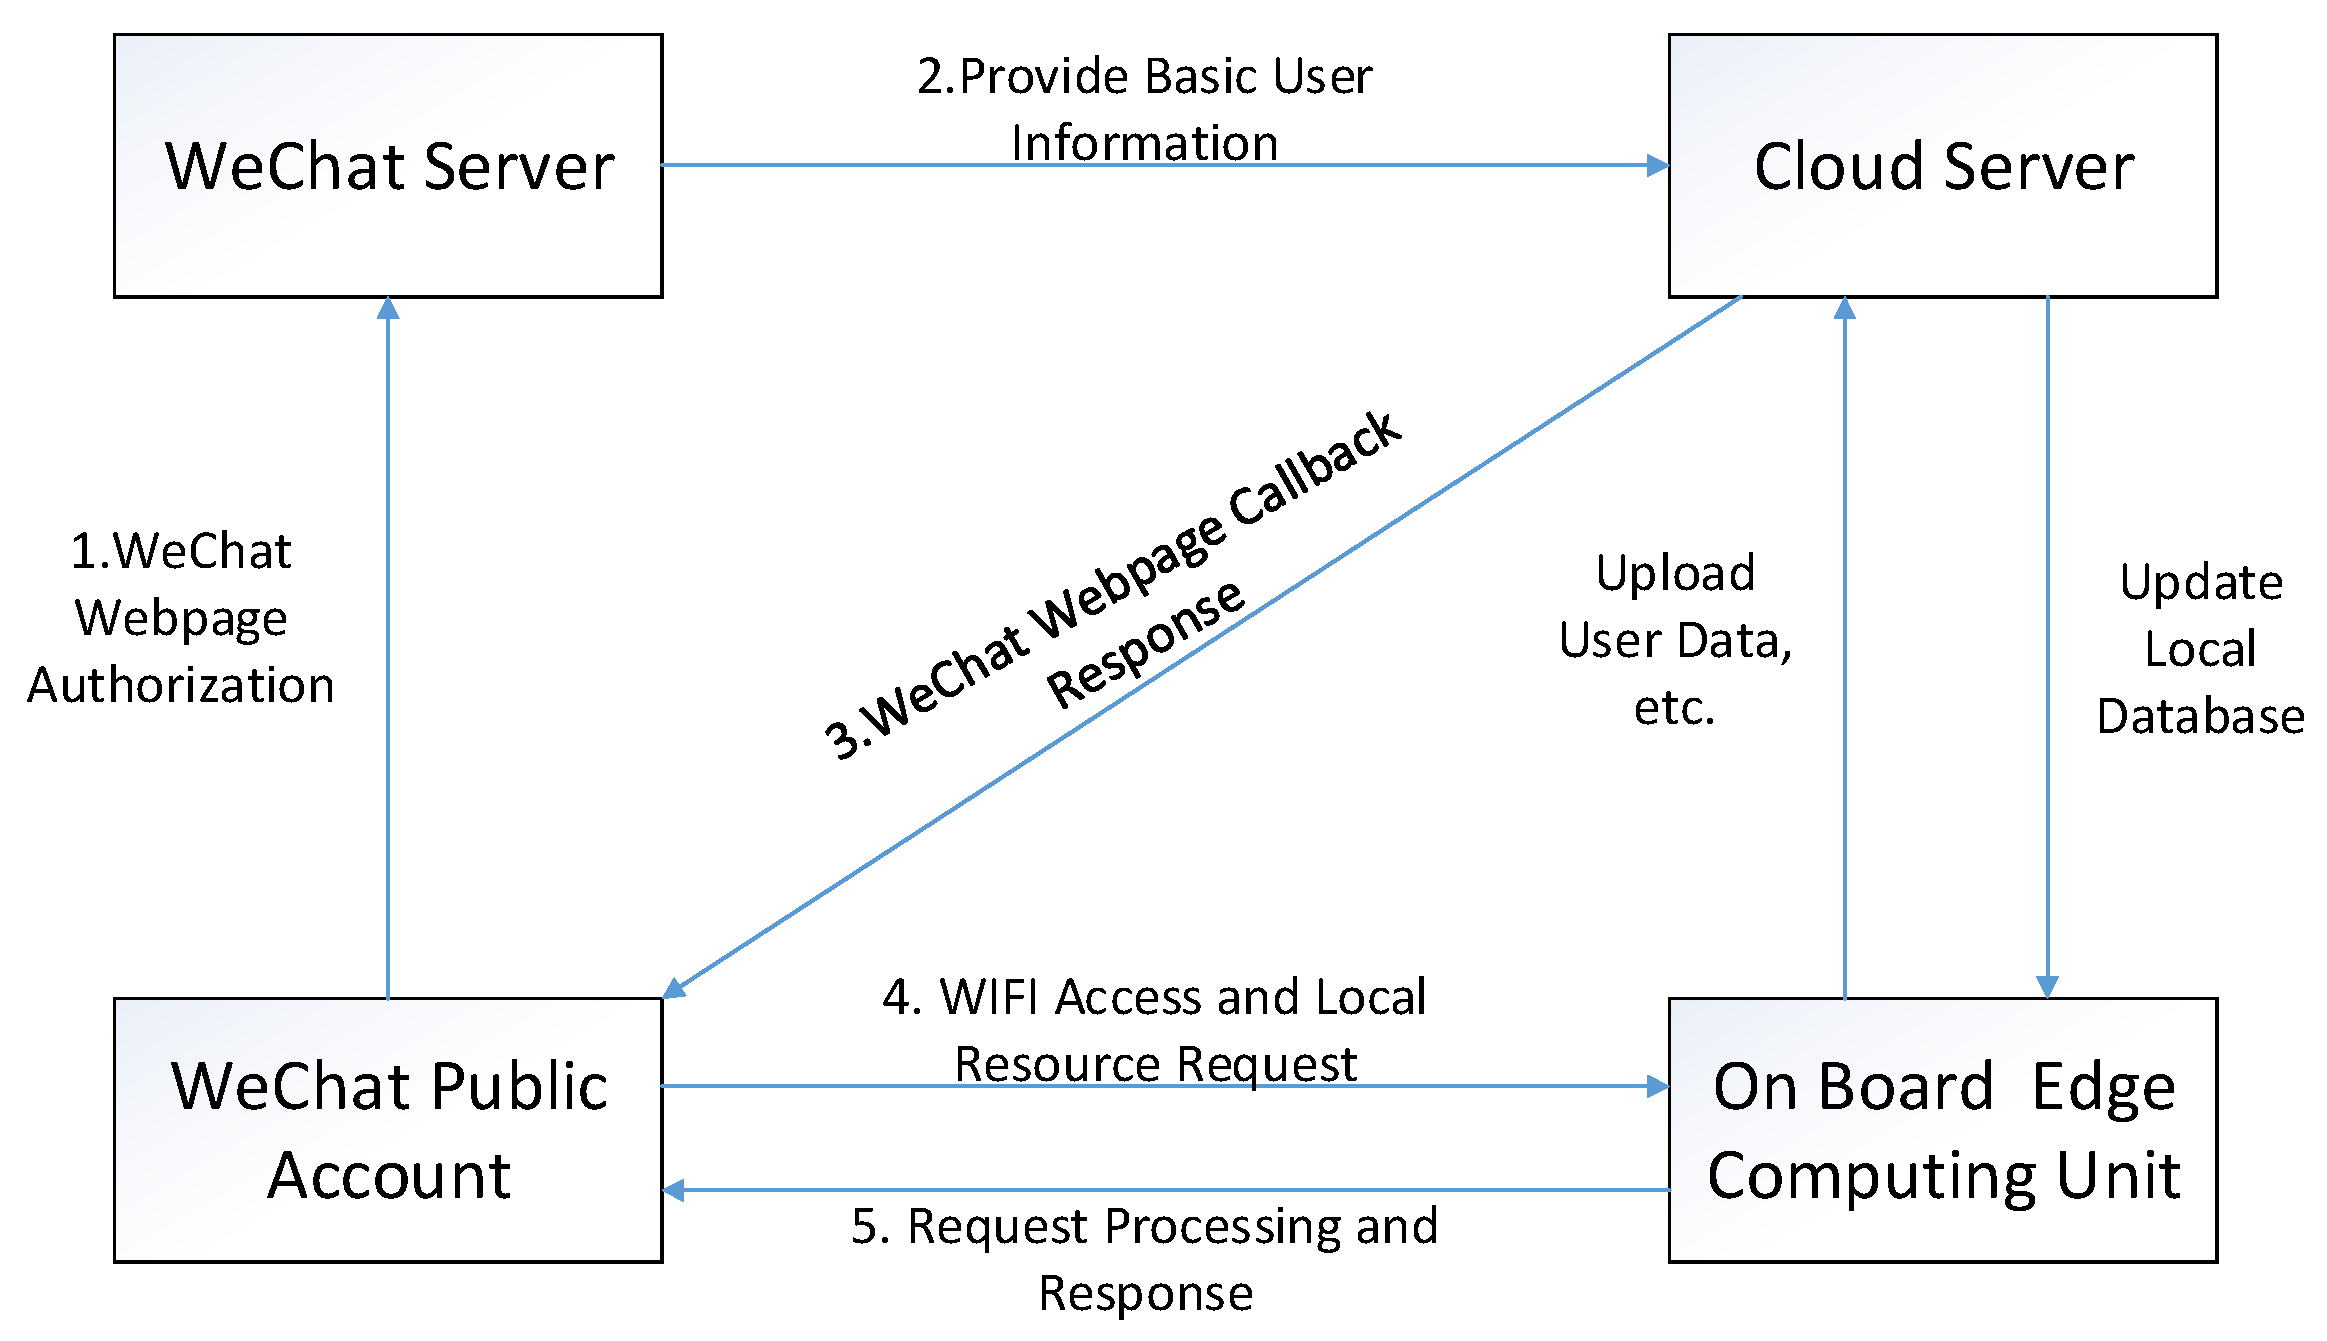
2.3. Mobile Edge Computing
In the intelligent transportation service scenario, an onboard edge device was deployed in each vehicle. A router module and an edge server module were encapsulated in the device. The router module ensured the rapid response of the network information services and overcame the problems of a limited external network bandwidth, large communication latency, and a weak Wi-Fi signal. The edge server acted as the core module of the onboard edge device, and it was also the focus of the mobile terminal-software system developed in this study. In contrast to the centralized data processing mode based on cloud computing, edge servers were distributed in different vehicles. By offloading some computing and storage tasks from the cloud servers to the edge servers, the service response time was shortened since the edge servers were close to the users.
The mobile edge computing system included the following four parts: intelligent mobile terminal, WeChat server, vehicle on-board edge device, and cloud server. The workflow of the application software system is shown in
Figure 3.
A long TCP connection was established between the edge server and the cloud server to enable interactions between them. The edge server regularly sent data packets to the cloud, including user personal information, user behavior data, edge server CPU load, and memory usage. Furthermore, the cloud regularly updated the local database of each edge server.
In addition, roadside unit (RSU) devices installed along the routes of autonomous buses could also be used as fixed-edge computing devices and communication relays.
3. Intelligent Bus Scheduling Based on Payment Authenticity Verification
Payment-authenticity verification refers to the review of passenger payment data and the actual riding behavior. Taking a certain bus route as an example, the actual number of passengers could be obtained through video data analysis and edge computing, and the relationship with the total number of payments made by passengers at the stations of the route. The diversified payment data were audited before data sorting using the following two perspectives: the integrity and the authenticity of the riding behavior of the passengers.
After authenticity verification, considering the current application of new technologies such as self-driving buses, the intelligent scheduling method included the following five steps:
Step 1: Multiple RSUs were installed at equal intervals along the bus route to achieve relay communication between the dispatch center and the autonomous driving bus.
Step 2: For any specific bus route, buses were dispatched at equal intervals. Bus scheduling for each route was independently controlled.
Step 3: Every time the self-driving bus passed one of the RSUs, the data for the quantity of the flow of passengers boarding and leaving the bus were sent to the dispatch center.
Step 4: The dispatch center monitored the quantity of the flow of passengers boarding and leaving the bus in real time. When the quantity of the flow of passengers boarding and leaving the bus on a bus exceeded the threshold for a single ride, the bus was marked as an overloaded vehicle, and the specific station was labeled as an overloaded station. Then, the bus at the next shift was notified through the RSU and dispatched toward the overloaded station.
Step 5: The dispatch center monitored the number of overloaded vehicles in real time, and if the number exceeded the set threshold, the departure interval of the buses on the route was shortened.
It should be noted that the departure interval was dynamically calculated, that is, according to the emergency operation plan, the time required to arrive at the overloaded station was calculated dynamically in the background according to the actual traffic conditions, and it was difficult to use a fixed, empirical value.
4. Results and Analysis
In this study, experimental tests were carried out in the following two dimensions: a specific bus route and the bus network. The bus-operation data in Changsha City on 3 December 2021 was used as the basis for the bus-travel-demand analysis. Based on multi-sensor data fusion and payment authenticity verification, intelligent bus scheduling was carried out. Changsha had a total of 294 bus routes and 5321 stations. On 3 December 2021, there were 36,813 bus trips, providing transportation services for 1,498,900 passengers. In terms of the payment methods, there were 2.2255 million registered mobile users at the time of the study. The bus route examined in this study was No. 115, which had 372 bus trips (including inbound and outbound trips) that day, transporting a total of 15,757 passengers.
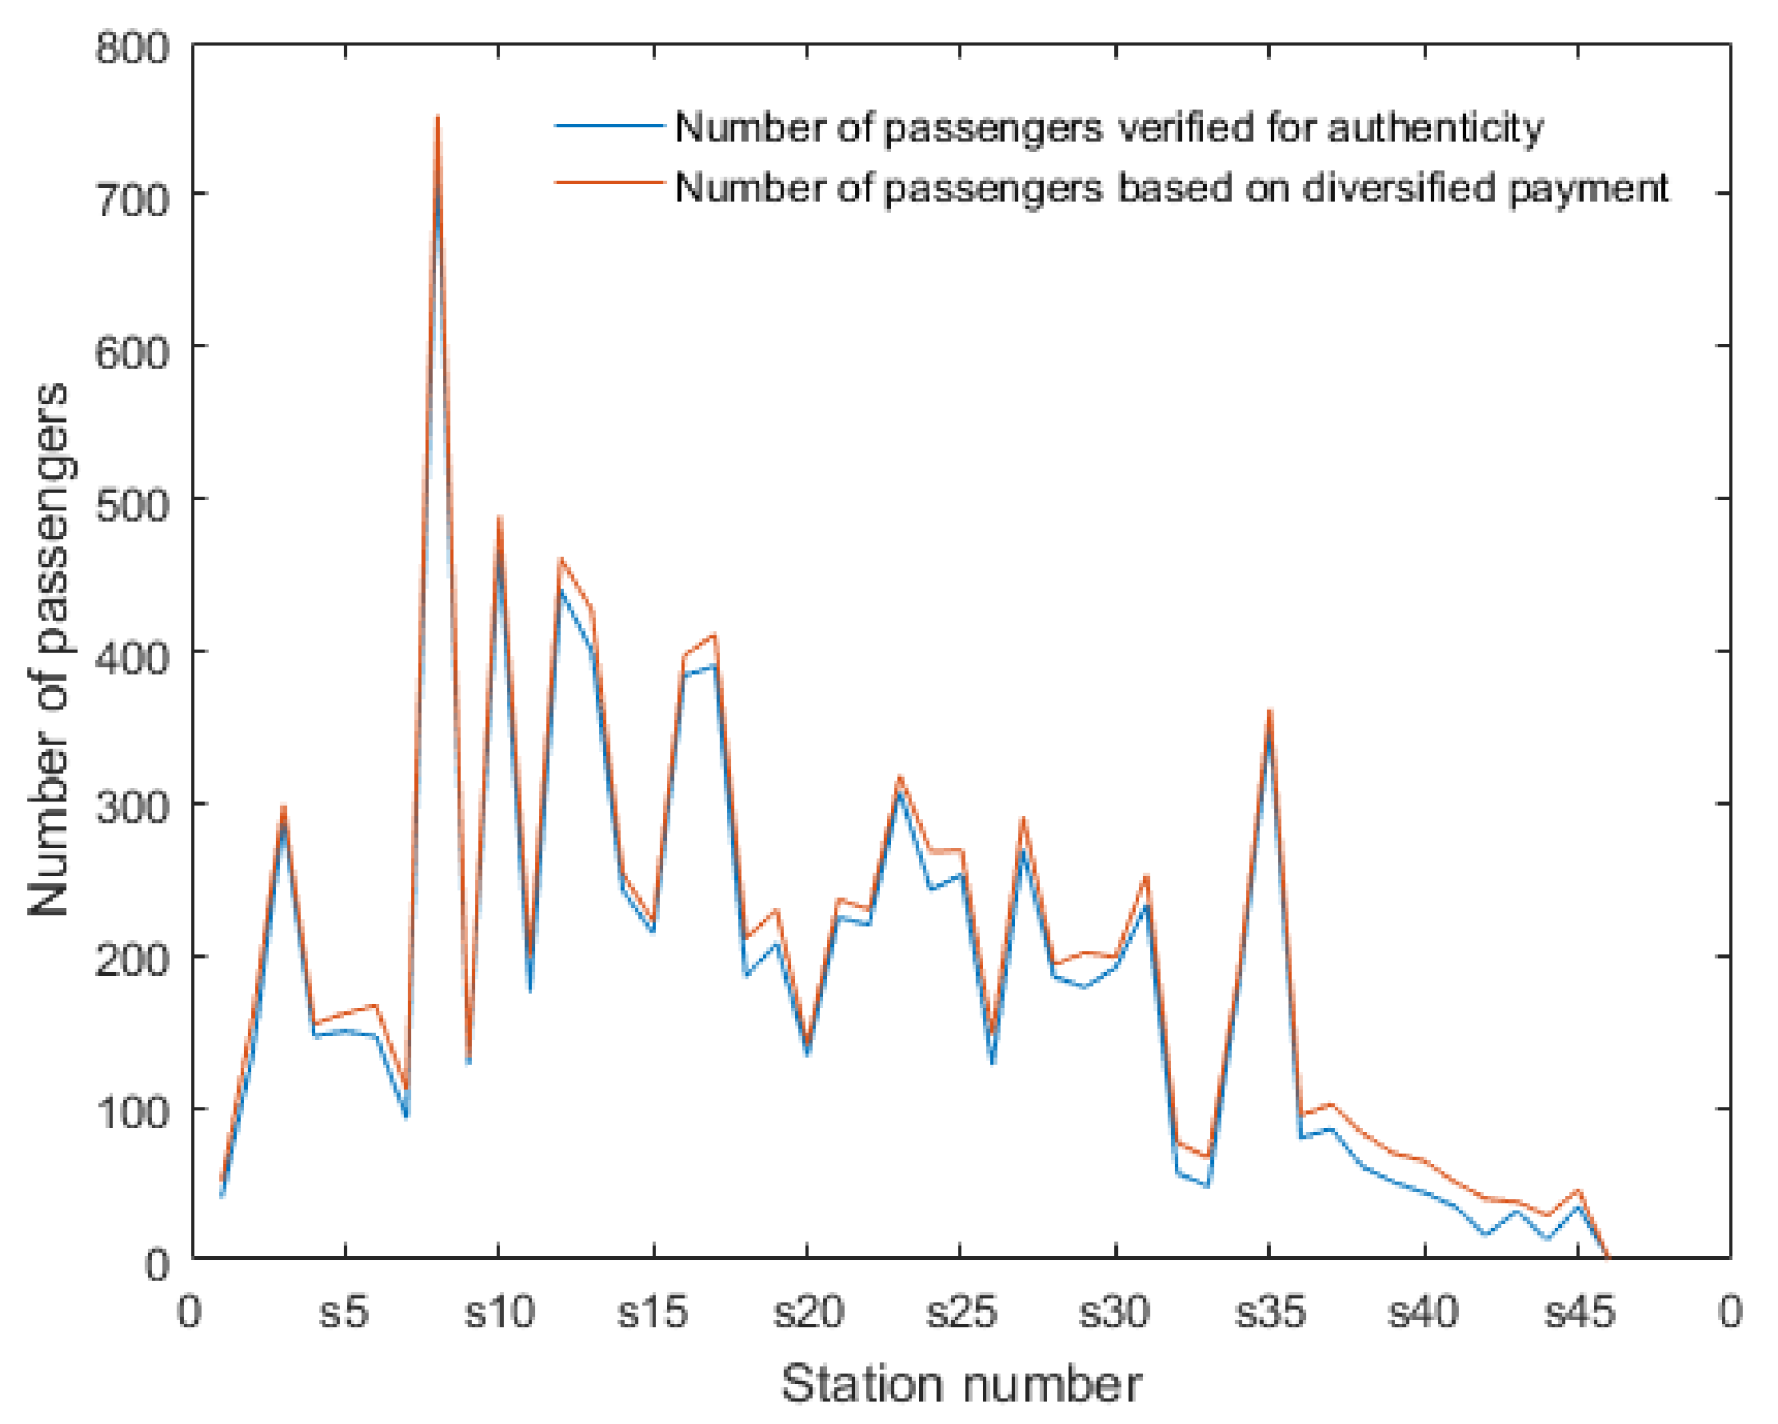
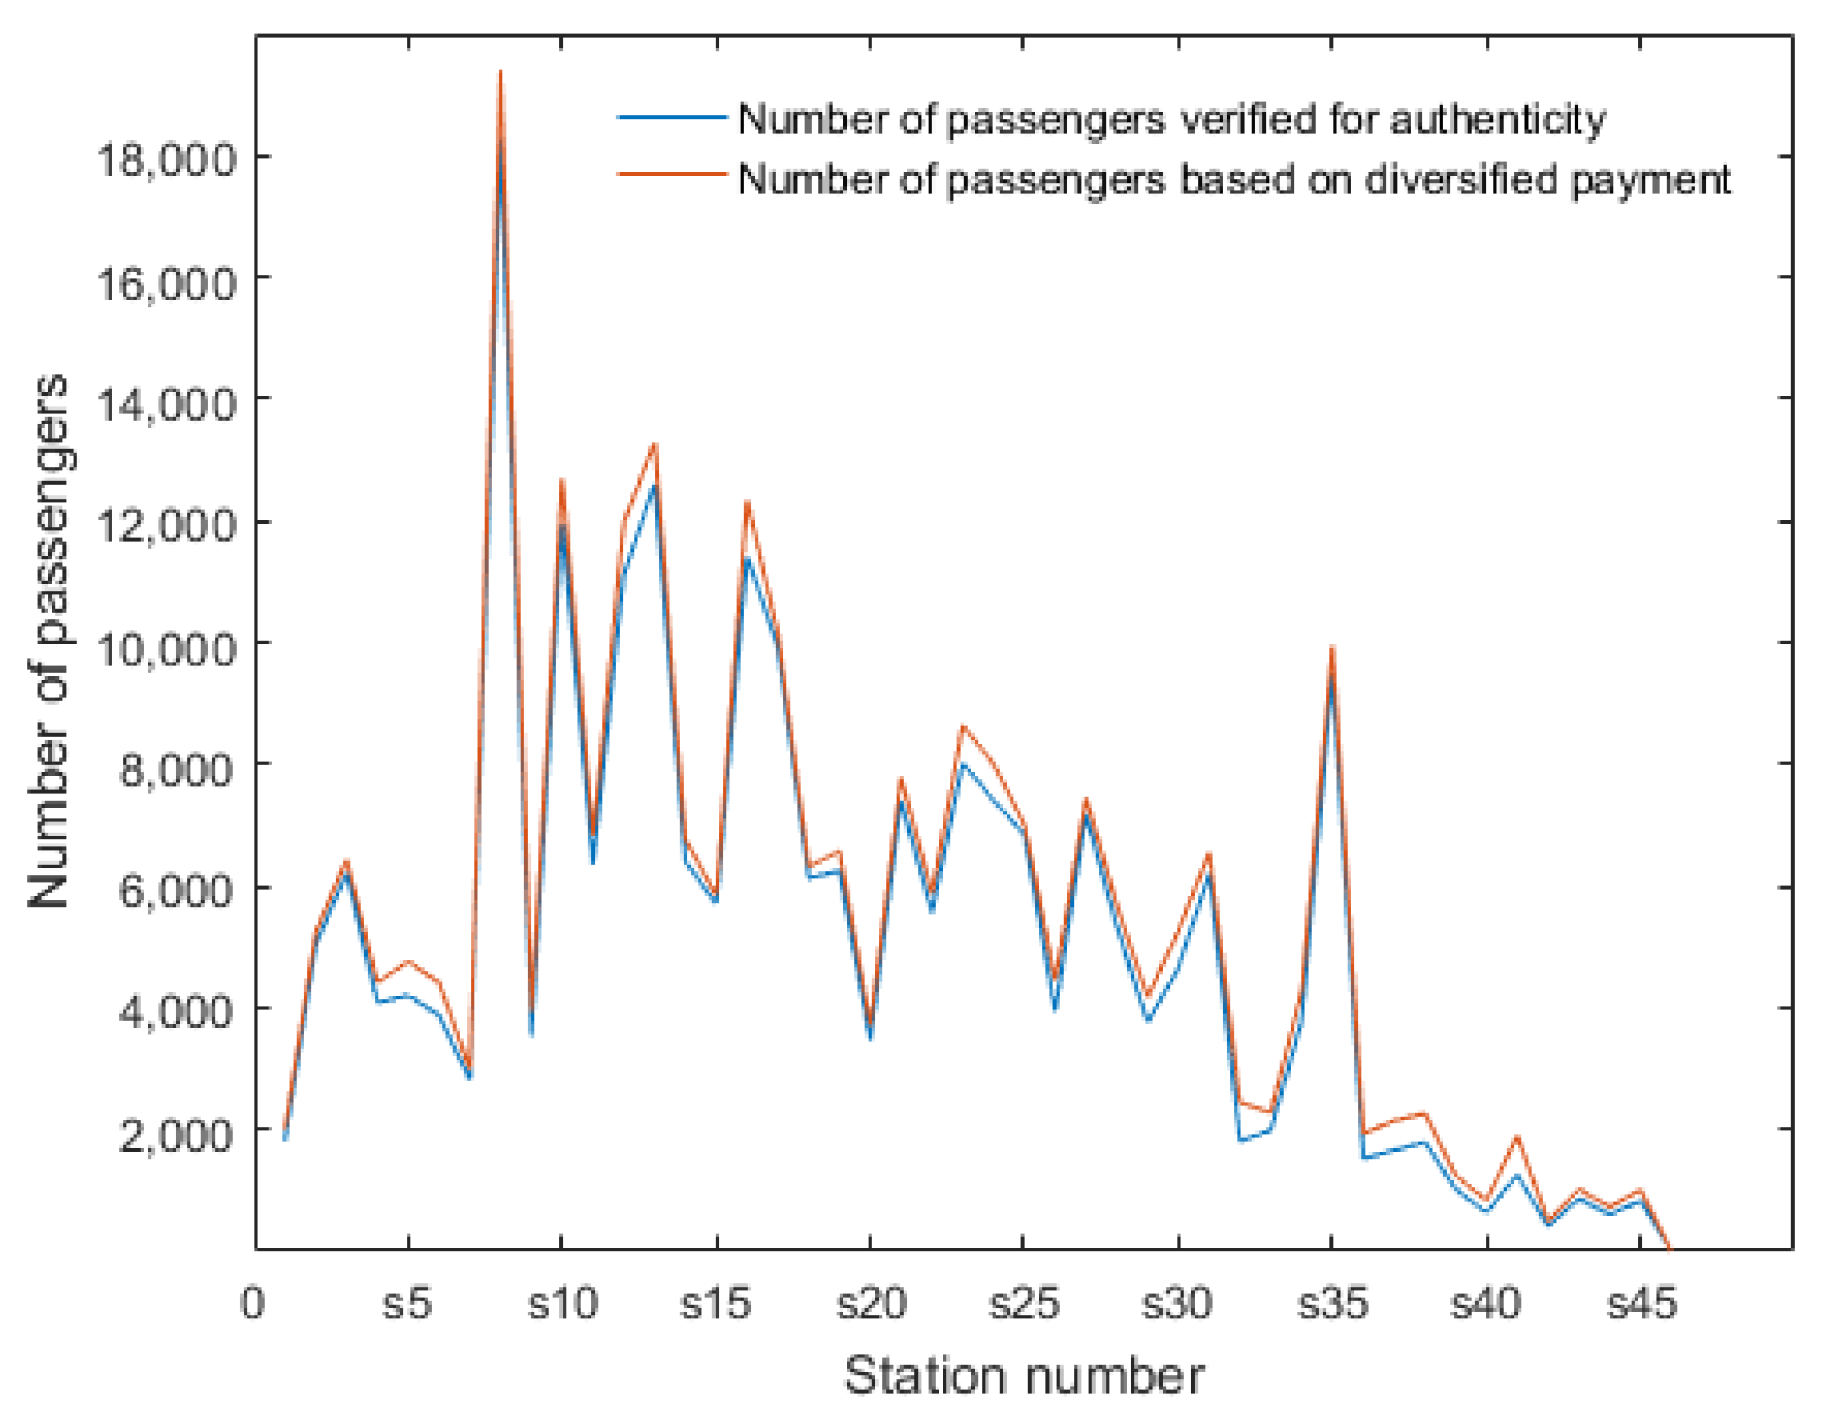
Figure 4 shows the number of diversified payments and the number after authenticity-verification, categorized by the time period and the station number of inbound No. 115 buses on 3 December 2021. The x-axis in the figure is the time period or station number (s), and the y-axis in the figure is the number of passengers, including the number of diversified payments and the number of passengers after authenticity verification.
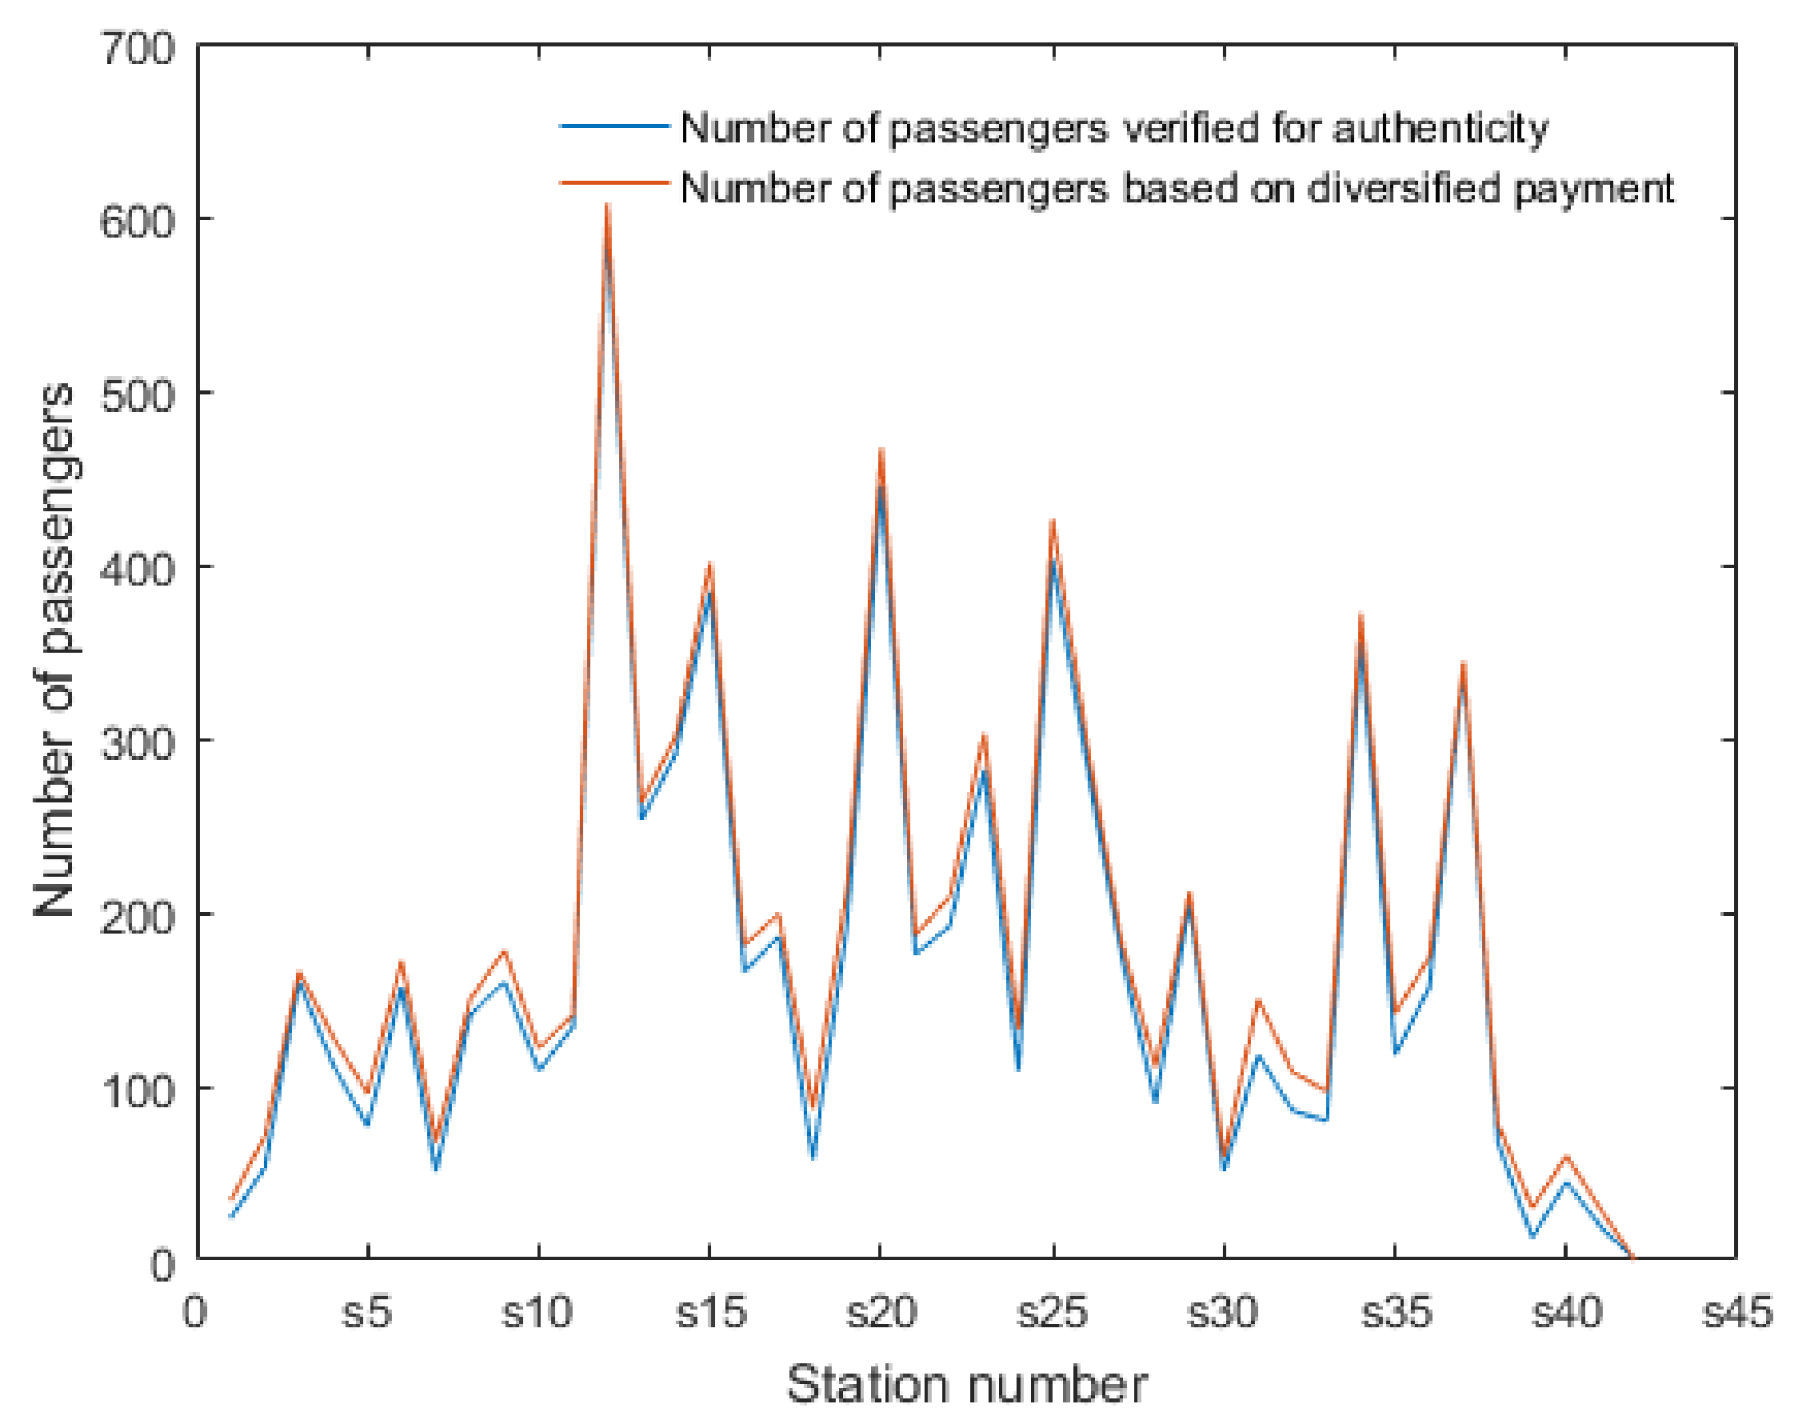
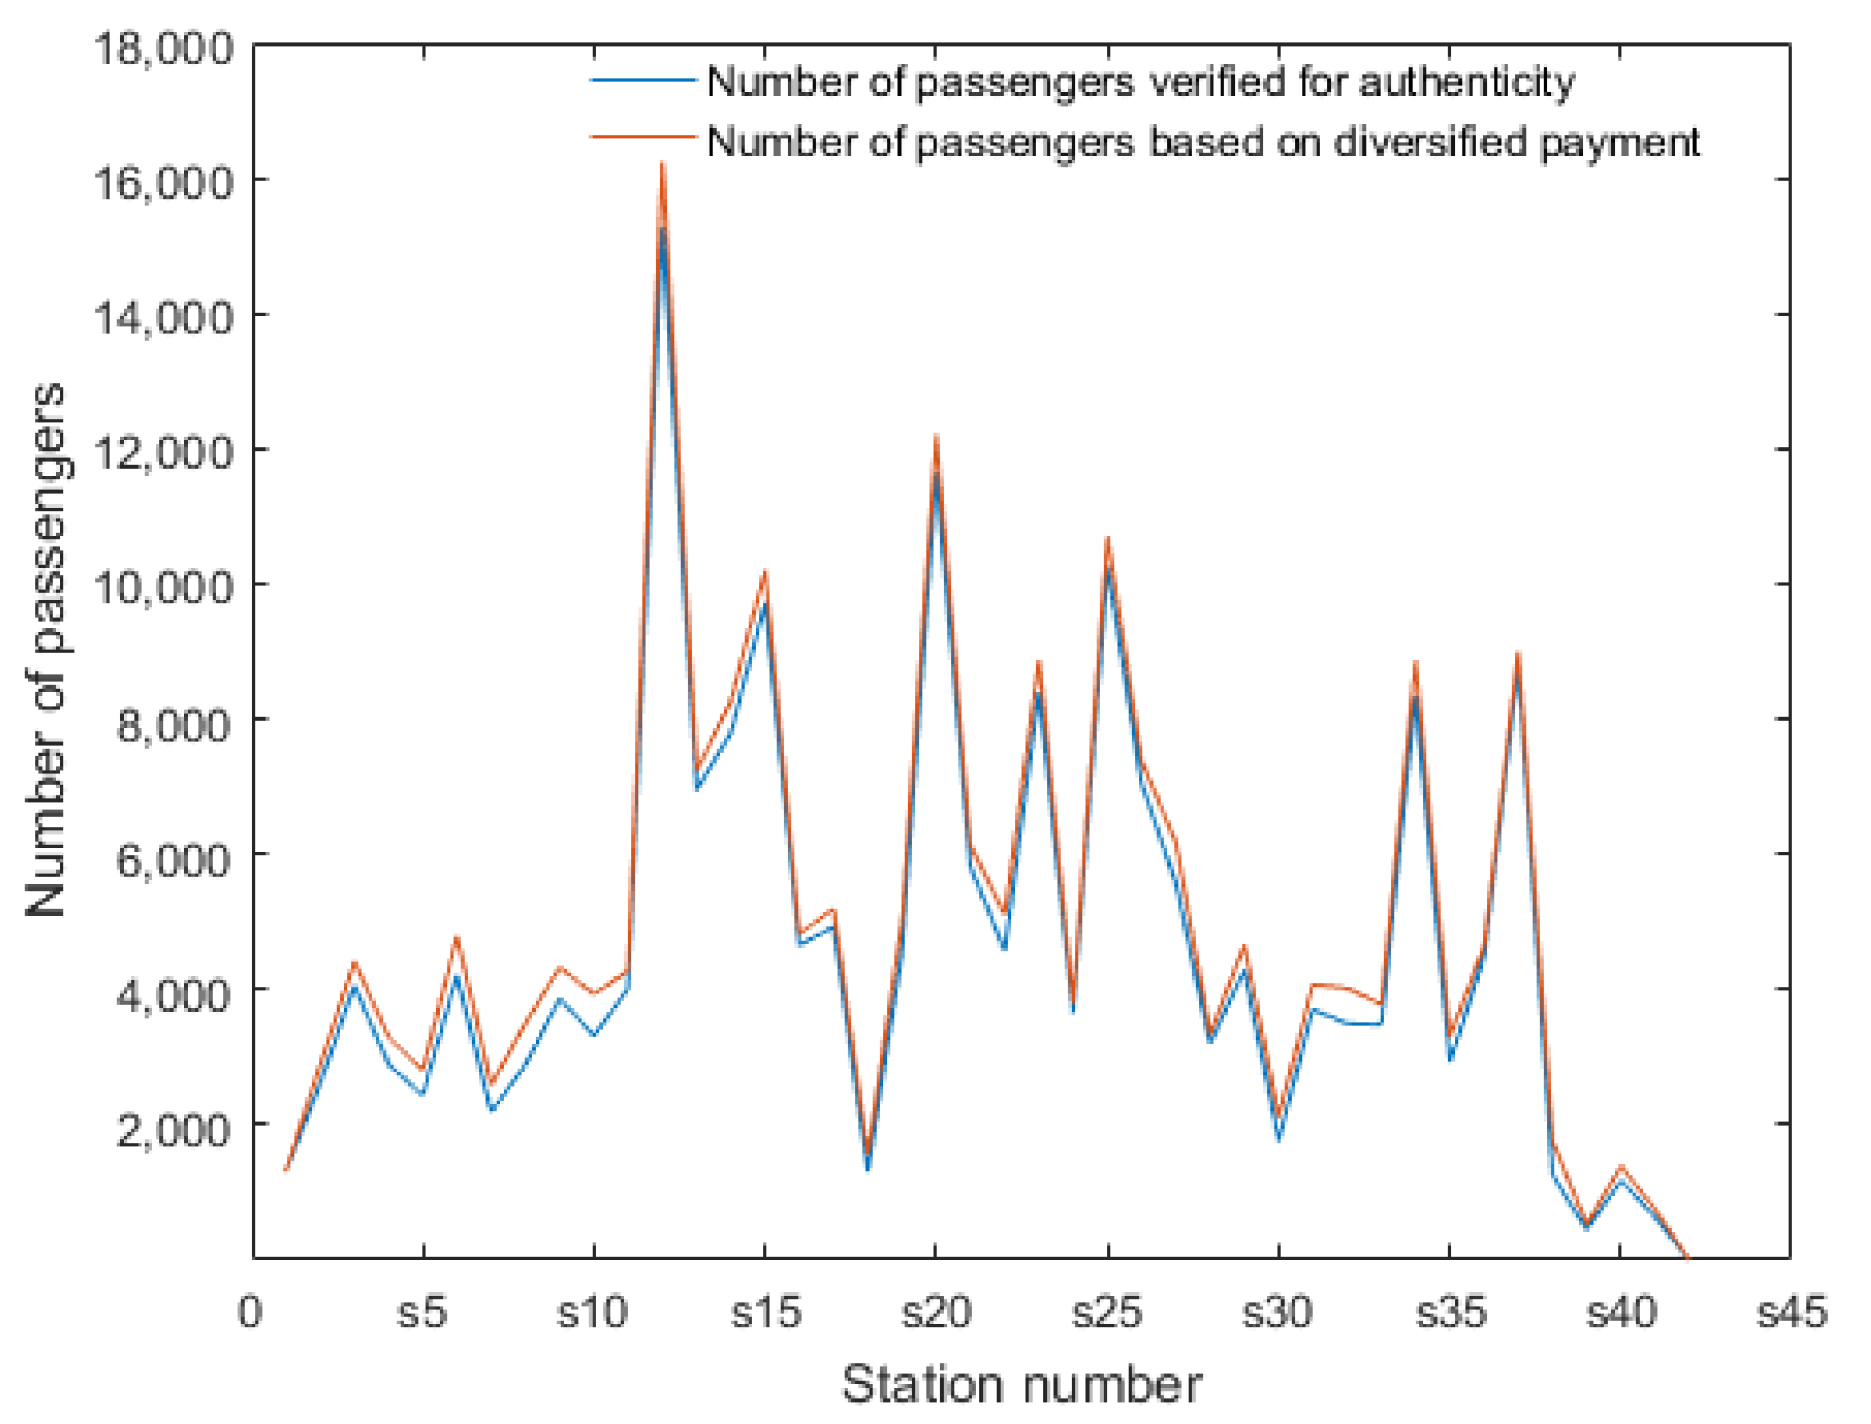
Figure 5 shows the data for outbound No. 115 buses. In order to accurately reflect the passengers’ riding behavior, the data for the route over the whole month were calculated using the same method, as shown in
Figure 6 and
Figure 7.
As shown in
Figure 4 and
Figure 5, the accuracies of the daily passenger flow data reached 84.31–100.00% and 80.47–100.00%, respectively, with averages of 92.10% and 92.67%. As shown in
Figure 6 and
Figure 7, the accuracies of the monthly passenger flow data reached 84.31–100.00% and 80.47–100.00%, respectively, with averages of 92.10% and 92.67%.
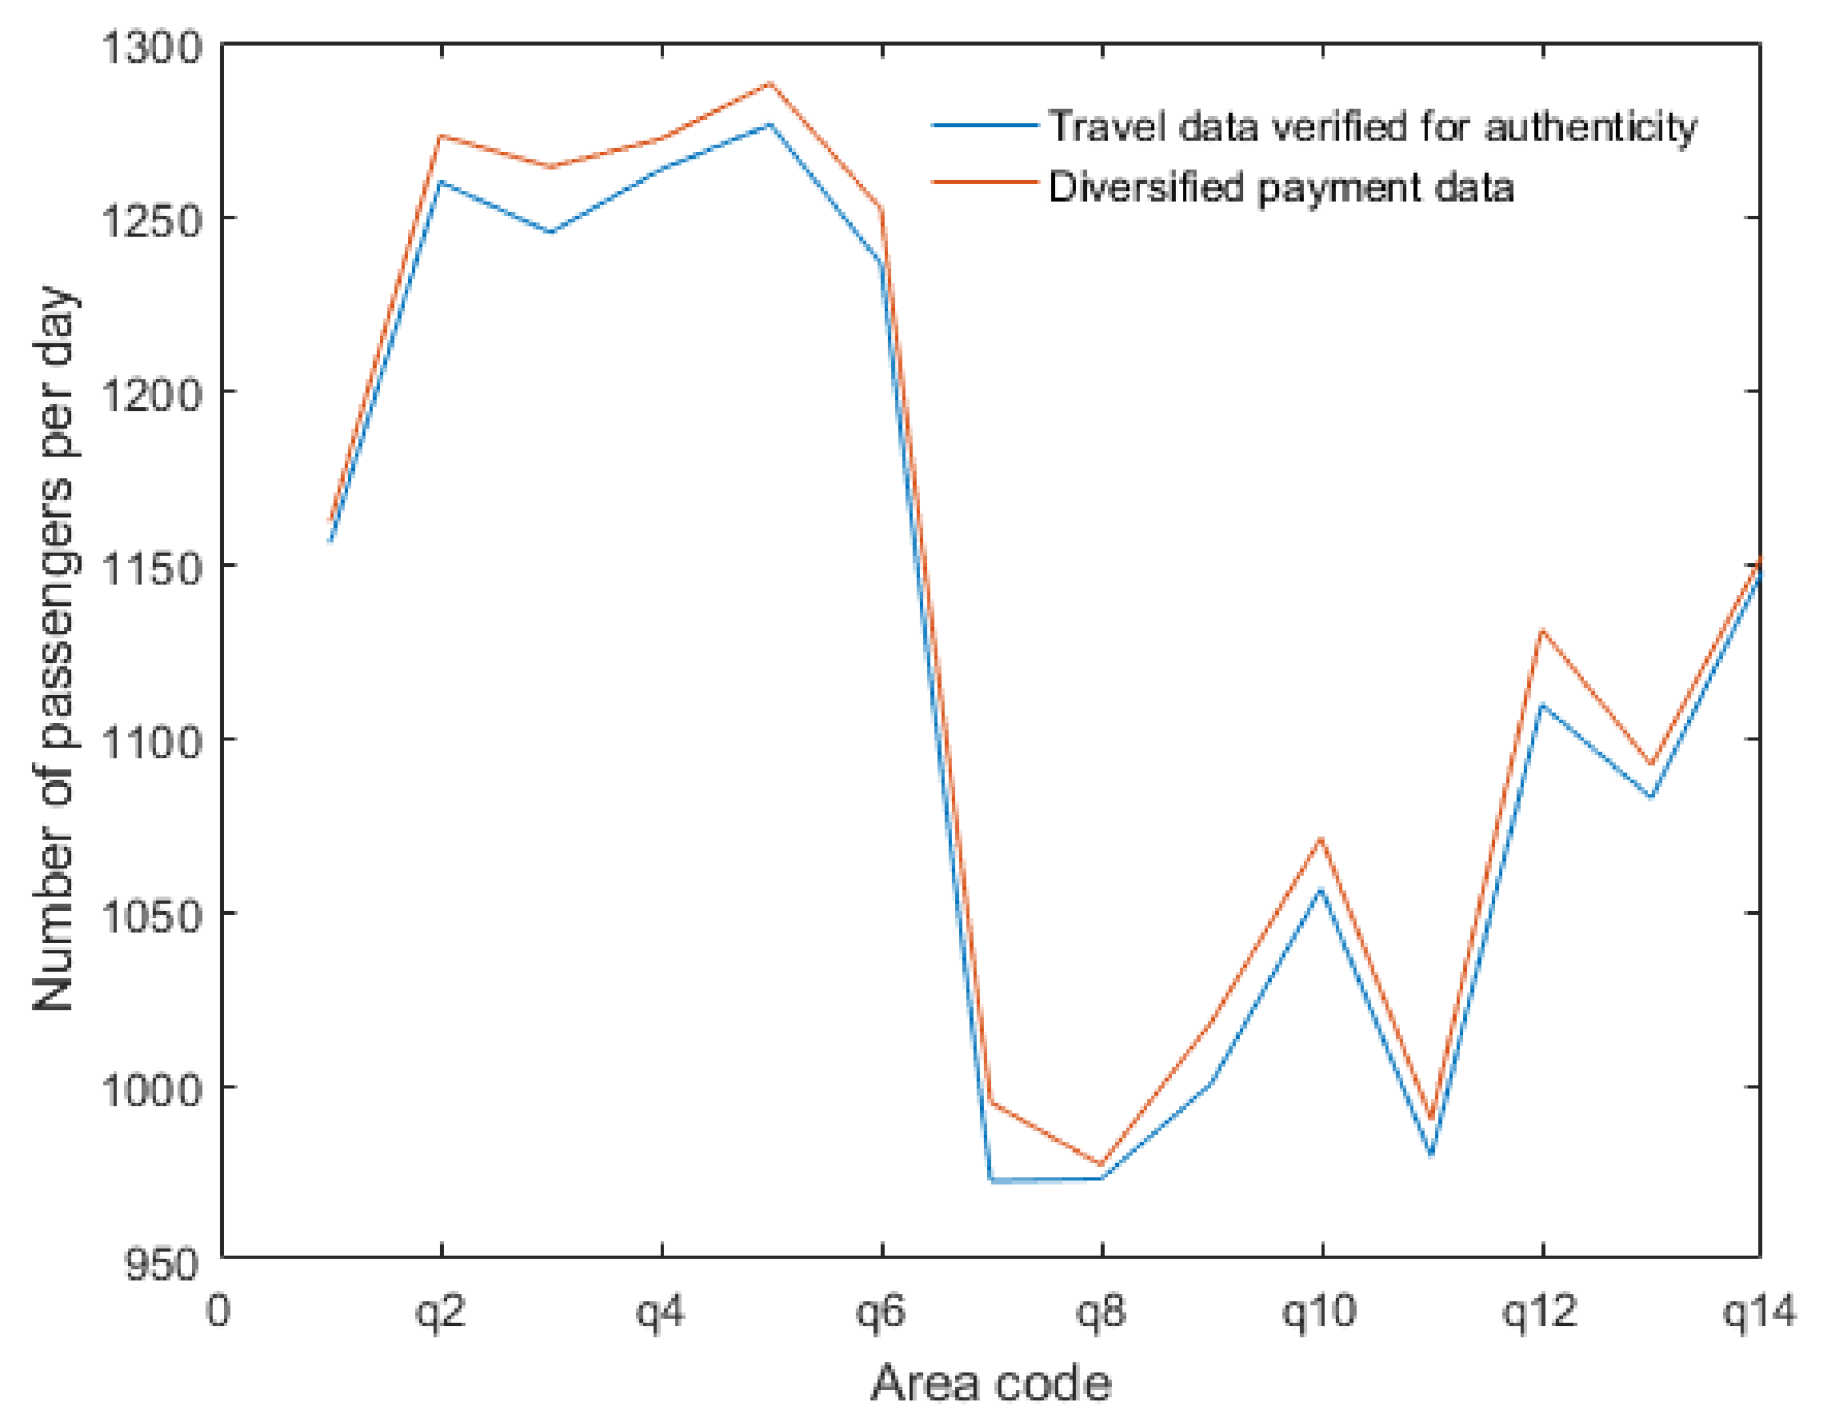
In order to reflect the passenger flow of the entire bus network, the bus network was divided into fourteen main bus areas (area code q) according to the distribution of the main roads and passenger-concentrated areas. A comparative analysis was conducted between the diversified payment data and the authenticity verification data, as shown in
Figure 8. It should be noted that the public transport area was counted according to the total number of upward and downward bus lines.
According to the statistical results of the fourteen bus areas, the accuracy of the daily average passenger flow reached 97.73–99.60%, with an average of 98.87%. Taking bus No. 115 as an example, based on the diversified payment data of the passengers and the travel data that were verified for authenticity, and using the actual bus-operation data and the actual timetable on the day as the test data, a traffic simulation was conducted using the intelligent bus-scheduling method. The applicability of the scheduling method was analyzed based on the accurate vehicle-load data and the travel data that was verified for authenticity.
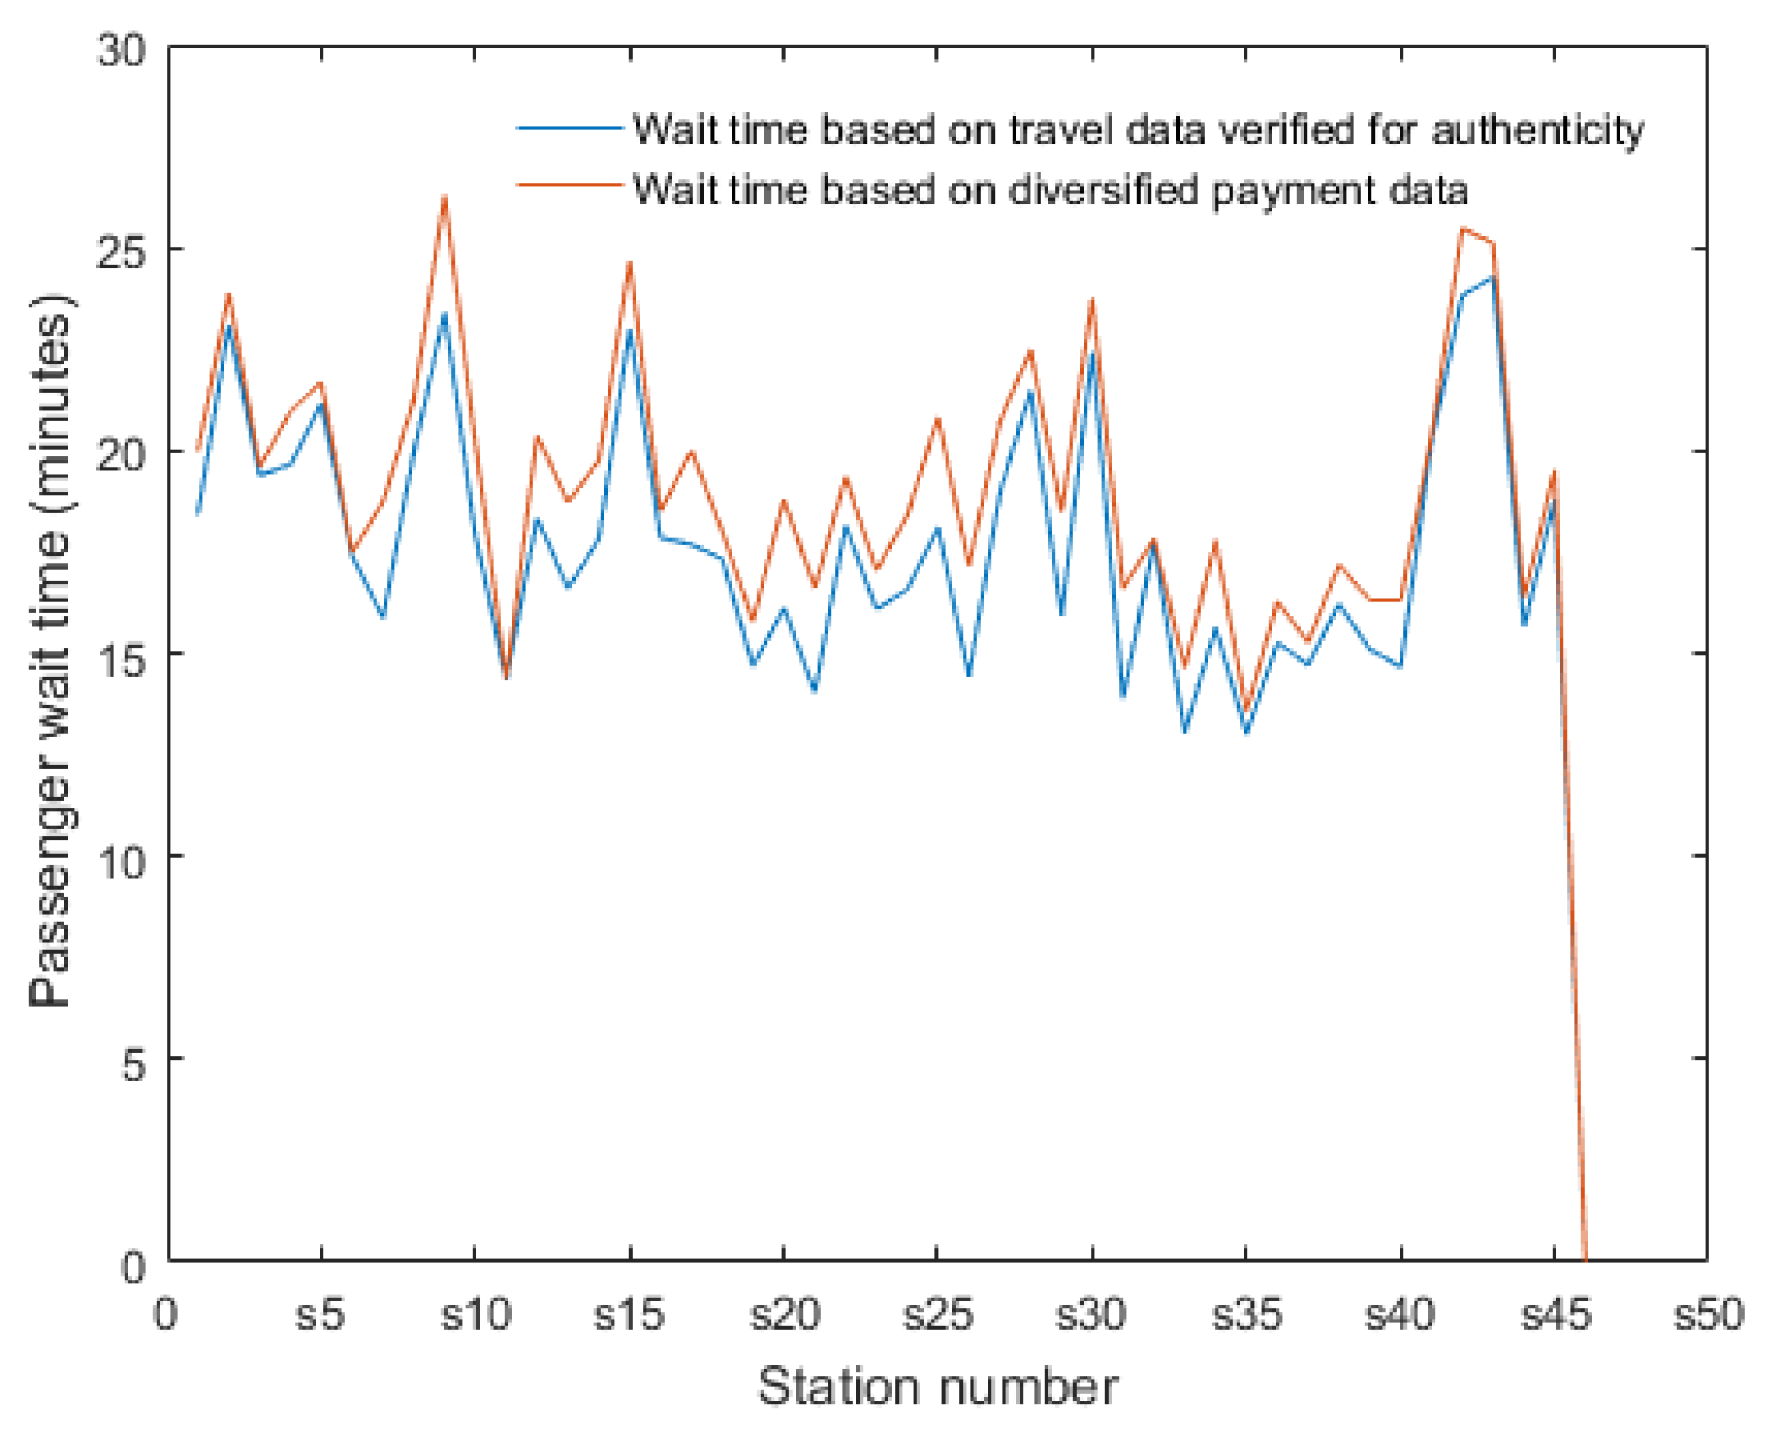
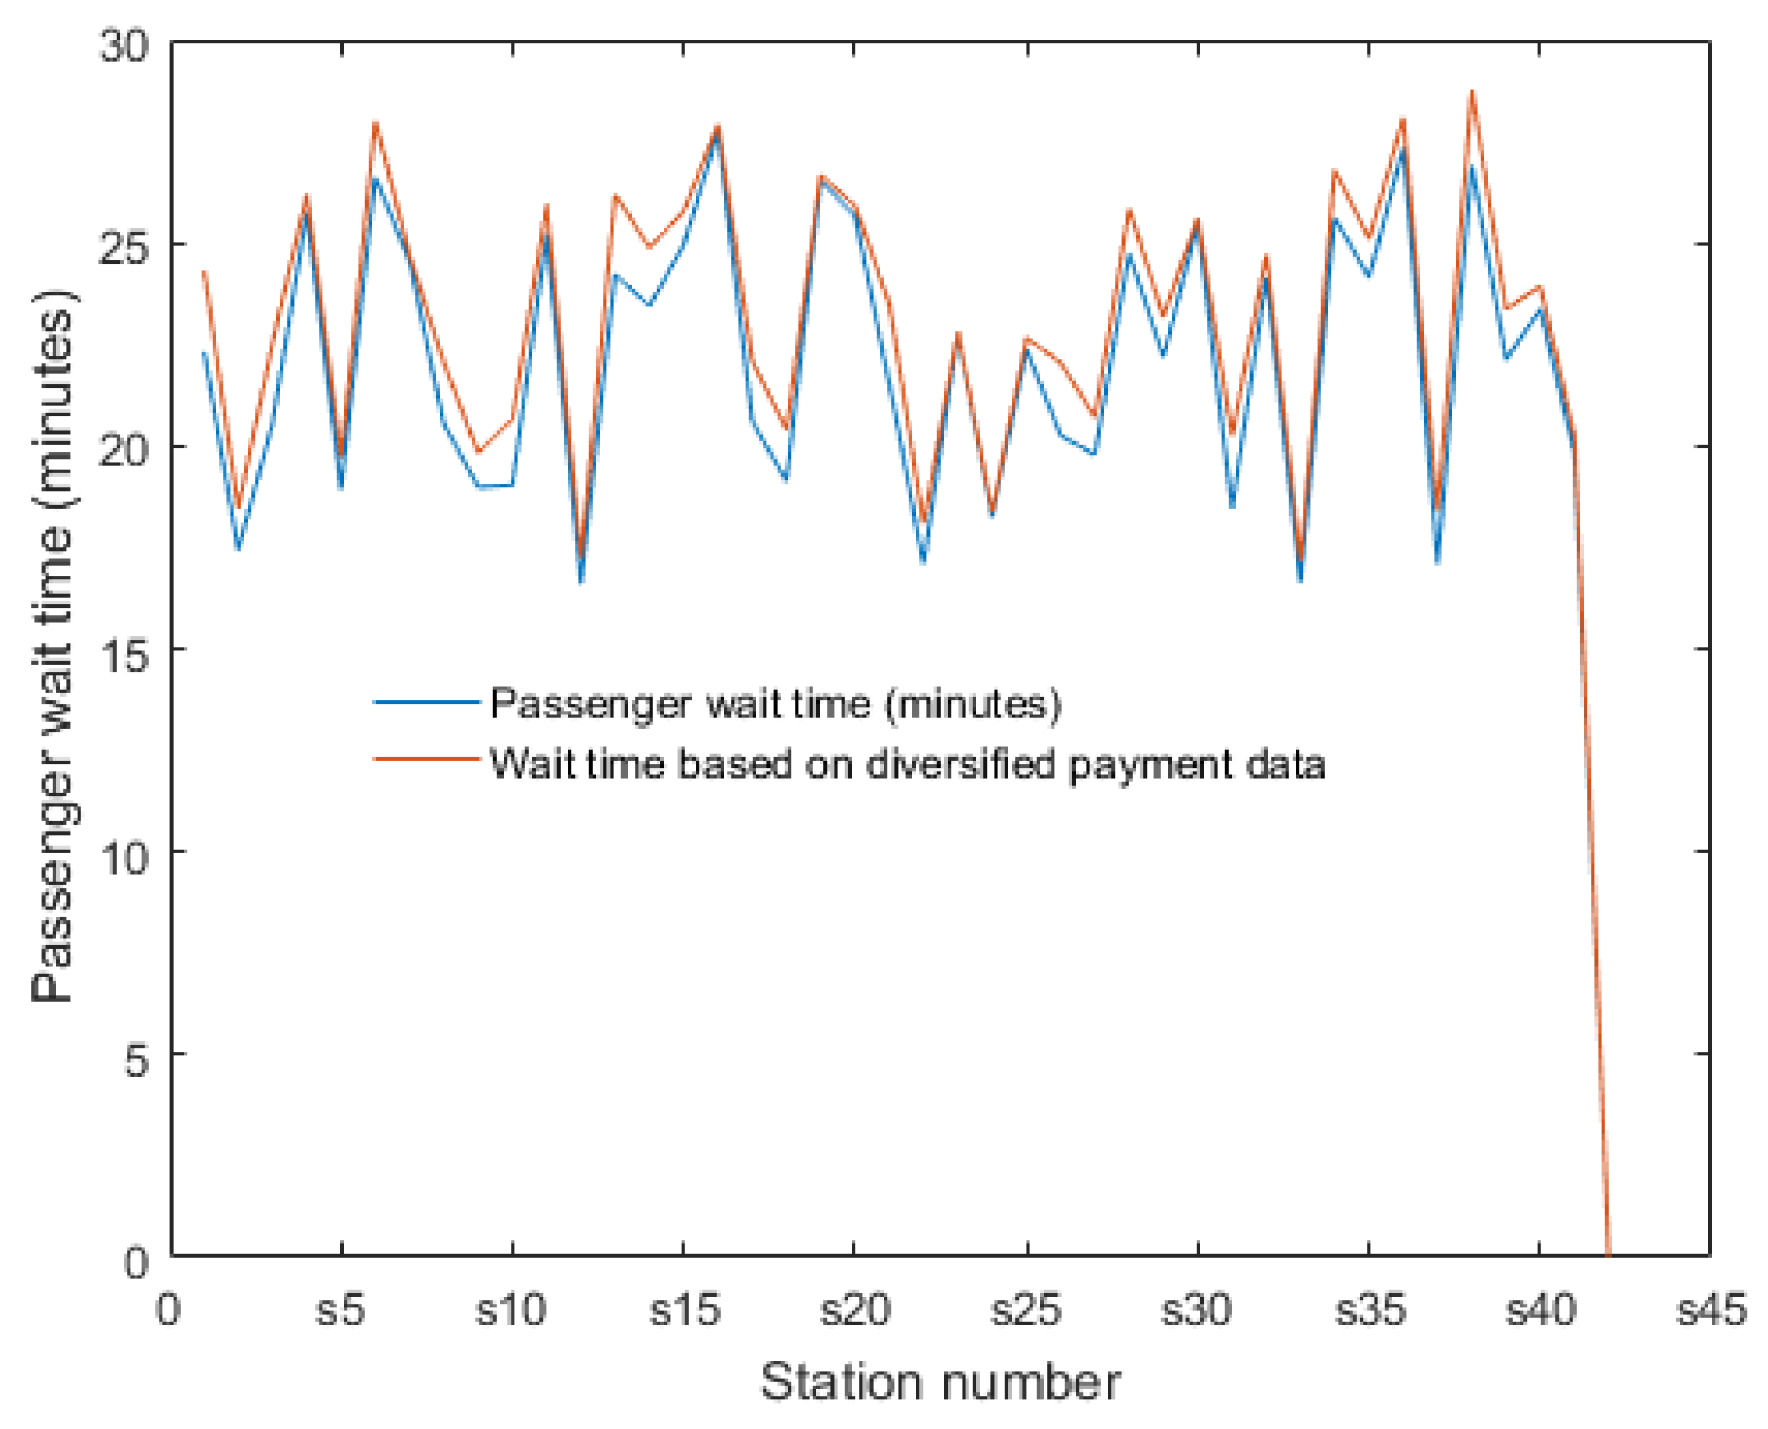
In this study, the fixed-line operation cost, as the consideration condition of bus dispatching, was not considered for bus scheduling, and only the wait time of the passengers (the wait time was deduced from the signaling data of the passengers using mobile payment) was used as the verification index. The whole-route bus frequency and the partial-route bus frequency were coordinated. In the scheduling method, only the whole-route buses served the passengers. That is, all the buses completed the entire route one by one. Based on the comparison of the diversified payment data and the travel data verified for authenticity, the wait time of the passengers was calculated for the same scheduling algorithm, as shown in
Figure 9 and
Figure 10. The x-axis in the figures is the station number, and the
y-axis in the figures is the per-passenger wait time for December 2021. The data for the 46th station in
Figure 9 are represented by zero. This is because the station was the terminal station, and there were no waiting passengers. As shown in
Figure 10, the outbound route had only 42 stations, and the 42nd station was the terminal, so the data are represented by zero.
In general, the bus-scheduling method based on travel data that were verified for authenticity led to a shorter wait time than the method based on diversified payment data. It can be seen from the figure that the difference was more obvious in the morning and evening peak hours. During off-peak hours and for low vehicle load conditions, the difference between the two was not obvious. In addition, the scheduling efficiency was higher on working days than on holidays. According to our results, the per-passenger wait time was reduced by 12.37% for the inbound No. 115 buses using the method proposed in this study, while the per-passenger wait time was 9.07% for outbound buses.
5. Discussion and Conclusions
In order to improve the efficiency of bus scheduling, based on multi-sensor data fusion, we carried out passenger-payment-authenticity verification to ensure the accuracy of the passenger flow data. In view of the employment of self-driving buses, an intelligent bus scheduling method was established. With the premise of not increasing the operation cost, and with the objective of reducing passenger wait time, we used the real operational data to conduct a traffic simulation, thereby verifying the applicability of the intelligent bus-scheduling method. The results showed that the efficiency of the bus scheduling was effectively improved after the verification of the authenticity of the passenger-flow data, which was beneficial for the operation efficiency of the whole bus network. Since the abnormal data points were blacklisted and preliminarily processed in the early stage, some traffic cards with abnormalities were blacklisted and preliminarily handled, so the comparison occurred between preliminary-handled data and processed data. Moreover, considering the limitations of the proposed method and the conducted tests, more practical factors could be incorporated into the bus-optimization-scheduling problem in future research in this area, such as traffic lights and co-route buses. In bus-scheduling optimization, the objectives of passenger wait time, bus-operating cost, and cross-vehicle penalty were comprehensively considered, and the multi-objective model was converted into a single-objective model with cost-conversion parameters. However, the determination of the parameter values remains a challenge. The stochasticity of travel demand varied greatly in different cities and even in different areas within a city. In future work, we will try to directly solve the multi-objective model.
Author Contributions
Conceptualization, T.Z. and H.S.; methodology, J.S.; software, H.W.; validation, L.H. and M.L.; formal analysis, J.X.; investigation, T.Z.; resources, W.G. and T.Z.; data curation, X.L.; writing—original draft preparation, H.S.; writing—review and editing, W.G. and J.Y.; visualization, L.H. and M.L.; supervision, J.X.; project administration, W.G. and J.Y.; funding acquisition, W.G. and H.W. All authors have read and agreed to the published version of the manuscript.
Funding
This work is supported by Guangdong Natural Science Foundation (Grant No.2020A1515010584), Changsha Bus Card Data Audit System Project (Grant No. CSCG-202103150160), Key Industry Innovation Chain Project of Shaanxi Province (Grant No. 2021ZDLGY07-10, No. 2021ZDLNY03-08), the Key Research and Development plan of Shaanxi Province (Grant No. 2018ZDXM-GY-041).
Data Availability Statement
Access to the original data used to support the findings of this study is restricted by the relevant law-enforcement departments in order to protect vehicle information privacy and on a law-enforcement basis. Data are available from the relevant law-enforcement departments for researchers who meet the criteria for access to confidential data.
Conflicts of Interest
The authors declare no conflict of interest.
References
- Petersen, N.C.; Rodrigues, F.; Pereira, F.C. Multi-output bus travel time prediction with convolutional LSTM neural network. Expert Syst. Appl. 2019, 120, 426–435. [Google Scholar] [CrossRef] [Green Version]
- Fang, X.; Huang, J.; Wang, F.; Zeng, L.; Liang, H.; Wang, H. Constgat: Contextual Spatial-Temporal Graph Attention Network for Travel Time Estimation at Baidu Maps. In Proceedings of the 26th ACM SIGKDD International Conference on Knowledge Discovery & Data Mining, Virtual, 6–10 June 2020; pp. 2697–2705. [Google Scholar]
- Wihartiko, F.D.; Buono, A.; Silalahi, B.P. Integer programming model for optimizing bus timetable using genetic algorithm. In IOP Conference Series: Materials Science and Engineering; IOP Publishing: Bristol, UK, 2017; Volume 166, p. 012016. [Google Scholar]
- Li, X.; Du, H.; Ma, H.; Shang, C. Timetable optimization for single bus line involving fuzzy travel time. Soft Comput. 2018, 22, 6981–6994. [Google Scholar] [CrossRef] [Green Version]
- Wei, M.; Sun, B. Bi-level programming model for multi-modal regional bus timetable and vehicle dispatch with stochastic travel time. Clust. Comput. 2017, 20, 401–411. [Google Scholar] [CrossRef]
- Wu, W.; Liu, R.; Jin, W.; Ma, C. Stochastic bus schedule coordination considering demand assignment and rerouting of passengers. Transp. Res. Part B 2019, 121, 275–303. [Google Scholar] [CrossRef]
- Morales, D.; Muñoz, J.C.; Gazmuri, P. A stochastic model for bus injection in an unscheduled public transport service. Transp. Res. Part C Emerg. Technol. 2020, 113, 277–292. [Google Scholar] [CrossRef]
- Liu, T.; Ceder, A.; Chowdhury, S. Integrated public transport timetable synchronization with vehicle scheduling. Transp. A Transp. Sci. 2017, 13, 932–954. [Google Scholar] [CrossRef]
- Cao, Z.; Ceder, A. Autonomous shuttle bus service timetabling and vehicle scheduling using skip-stop tactic. Transp. Res. Part C 2019, 102, 370–395. [Google Scholar] [CrossRef]
- Zhao, Z.; Ren, Y.; Mu, C.; Zou, T.; Hong, K.S. Adaptive Neural-Network-Based Fault-Tolerant Control for a Flexible String with Composite Disturbance Observer and Input Constraints. IEEE Trans. Cybern. 2021, in press. [Google Scholar] [CrossRef]
- Liu, C.; Wen, G.; Zhao, Z.; Sedaghati, R. Neural-Network-based Sliding Mode Control of an Uncertain Robot Using Dynamic Model Approximated Switching Gain. IEEE Trans. Cybern. 2021, 51, 2339–2346. [Google Scholar] [CrossRef]
- Ren, Y.; Zhao, Z.; Zhang, C.; Yang, Q.; Hong, K.S. Adaptive Neural-Network Boundary Control for a Flexible Manipulator with Input Constraints and Model Uncertainties. IEEE Trans. Cybern. 2021, 51, 4796–4807. [Google Scholar] [CrossRef]
- Liu, Z.; Shi, J.; Zhao, X.; Zhao, Z.; Li, H.X. Adaptive Fuzzy Event-triggered Control of Aerial Refueling Hose System with Actuator Failures. IEEE Trans. Fuzzy Syst. 2021, in press. [Google Scholar] [CrossRef]
- Jiang, Y.; Wang, Y.; Miao, Z.; Na, J.; Zhao, Z.; Yang, C. Composite Learning based Adaptive Neural Control for Dual Arm Robots with Relative Motion. IEEE Trans. Neural Netw. Learn. Syst. 2020, in press. [Google Scholar] [CrossRef]
- Lan, X.; Liu, Y.; Zhao, Z. Cooperative control for swarming systems based on reinforcement learning in unknown dynamic environment. Neurocomputing 2020, 410, 410–418. [Google Scholar] [CrossRef]
- Li, M.; Wang, L.; Yang, J.; Zhang, Z.; Zhang, N.; Xiang, Y.; Zhou, H. Passenger Flow Forecast for Customized Bus Based on Time Series Fuzzy Clustering algorithm. Interact. Stud. 2019, 20, 42–60. [Google Scholar] [CrossRef]
- Yang, J.; Zhang, Z.; Zhang, N.; Li, M.; Zheng, Y.; Wang, L.; Zhang, Y. Vehicle Text Data Compression and Transmission Method Based on Maximum Entropy Neural Network and Optimized Huffman Encoding Algorithms. Complexity 2019, 2019, 8616215. [Google Scholar] [CrossRef]
- Yang, J.; Zhang, N.; Li, M.; Zheng, Y.; Wang, L.; Li, Y.; Luo, L. Vehicle Information Influence Degree Screening Method Based on GEP Optimized RBF Neural Network. Complexity 2018, 2018, 1067927. [Google Scholar] [CrossRef]
- Wang, L.; Yang, J.; Zhang, N.; Yang, J.; Li, Y.; He, J.; Zhou, H. A spatial–temporal estimation model of residual energy for pure electric buses based on traffic performance index. Tech. Gaz. 2017, 24, 1803–1811. [Google Scholar]
- Wang, L.; Yang, J.; Zhang, N.; Yang, J.; Li, Y.; He, J.; Zhou, H. Time-Space Relationship Analysis Model on the Bus Driving Characteristics of Different Drivers Based on the Traffic Performance Index System. Tech. Gaz. 2018, 25, 236–244. [Google Scholar]
- Qing-Bo, W.E.I.; Yue-Jiang, S.U.; Yuan, G.; Jing-Feng, Y.A.N.G.; Jun-Jie, M.O. Real Time Estimation of Bus Loading Rate Based on Bus Electronic Payment Data. J. Transp. Syst. Eng. Inf. Technol. 2021, 21, 75–81. [Google Scholar]
- Yang, J.; Luo, Z.; Zhang, N.; Wang, H.; Li, M.; Xiao, J. Numerical Calibration Method for Vehicle Velocity Data from Electronic Registration Identification of Motor Vehicles Based on Mobile Edge Computing and Particle Swarm Optimization Neural Network. Complexity 2020, 2020, 2413564. [Google Scholar] [CrossRef]
- Yang, J.; Luo, Z.; Zhang, N.; Xiao, J.; Wang, H.; Zhou, S.; Li, M. Stochastic Parameter Identification Method for Driving Trajectory Simulation Process Based on Mobile Edge Computing and Self-Organizing Feature Mapping. Complexity 2021, 2021, 8884390. [Google Scholar]
- Song, H.; Zhou, S.; Chang, Z.; Su, Y.; Liu, X.; Yang, J. Collaborative Processing and Data Optimization of Environmental Perception Technologies for Autonomous Vehicles. Assem. Autom. 2021, 41, 283–291. [Google Scholar] [CrossRef]
- Zhou, S.; Chang, Z.; Song, H.; Su, Y.; Liu, X.; Yang, J. Optimal Resource Management and Allocation for Autonomous-vehicle-Infrastructure Cooperation Under Mobile Edge Computing. Assem. Autom. 2021, 41, 384–392. [Google Scholar] [CrossRef]
- Wang, H.; Yu, R.; Pan, R.; Yang, J. Fast Tag Identification for Mobile RFID Robots in Manufacturing Environments. Assem. Autom. 2021, 41, 292–301. [Google Scholar] [CrossRef]
- Wang, H.; Wang, S.; Yao, J.; Pan, R.; Huang, Q.; Zhang, H.; Yang, J. Effective anti-collision algorithms for RFID robots system. Assem. Autom. 2019, 40, 55–64. [Google Scholar] [CrossRef]
| Publisher’s Note: MDPI stays neutral with regard to jurisdictional claims in published maps and institutional affiliations. |
© 2022 by the authors. Licensee MDPI, Basel, Switzerland. This article is an open access article distributed under the terms and conditions of the Creative Commons Attribution (CC BY) license (https://creativecommons.org/licenses/by/4.0/).


 ,
, 


