1. Introduction
Under the goal of “carbon neutralization”, energy storage has become the focus of development because of its rapid charging and discharging characteristics. On the power generation side, energy storage can be connected to make the power grid more “friendly” towards new energy sources such as wind power and photovoltaic [
1,
2,
3,
4]. On the user side, energy storage can cut the peaks and fill the valleys, improving users’ power consumption habits and reducing peak power consumption. According to the “14th five-year plan”, China’s energy storage will reach more than 30 million kilowatts in 2025. Compared with 2020, the scale of the energy storage market will expand nearly tenfold, and local policies and market mechanisms will be better, which means that the application of energy storage in various scenarios needs to be further improved. With the increase in energy storage reserve capacity on the user side, making good use of this energy storage capacity can increase the system stability and the economy of energy storage on the user side [
5,
6,
7,
8,
9].
At present, China mainly implements two-part electricity price and timeshare electrovalence policies for industrial users, hoping that industrial users can change their electricity consumption habits, but industrial production habits are difficult to change [
10,
11,
12,
13]. Therefore, the industrial users can be equipped with energy storage systems to reduce the maximum demand of users, according to the policy, and adopt the strategy of low charge and high discharge according to the time-of-use electricity pricing to charge during low electricity price periods, discharging in the high electricity price periods and peak load periods. This method not only improves the power consumption habits of users, but also obtains economic benefits by using the peak valley electricity price difference and the maximum demand electricity charge difference [
14,
15,
16,
17,
18]. However, the energy storage battery needs more deep discharge when participating in the peak shaving on the user side, which will produce a large battery degradation effect, limiting the economy of peak shaving.
Therefore, the economic benefits of user-side energy storage participating in frequency regulation can improve the economy of user equipped energy storage. At present, China’s small capacity energy storage power stations cannot be allowed to compete for frequency regulation services, but the establishment of auxiliary service markets such as frequency regulation and standby is conducive to guiding investment to improve the flexibility of power systems [
19,
20,
21,
22,
23,
24,
25]. With the improvement of energy storage service market mechanisms, the future frequency regulation service market will certainly expand to individual participation, so the energy storage on the user side can not only achieve low absorption and high amplification, but it can also participate in the frequency regulation service market to obtain revenue [
26,
27,
28,
29], which will encourage industrial users to actively equip energy storage batteries and reduce peak power consumption.
In other countries, the frequency regulation market such as Pennsylvania–New Jersey–Maryland (PJM) in the United States is relatively mature. In this market, the energy storage devices represented by batteries and aircraft turbines has been introduced into the frequency regulation service market [
30]. Salles et al. [
31] used the battery energy storage systems in an Italian shopping mall to shave the peak consumption and get benefit from it. It has been proven that the strategy including peak shaving can increase the economy on the user side. However, this ignores that energy storage can also generate benefits by participating in frequency regulation services. The energy on the user side is used to participate in the frequency regulation service in the power market to obtain income [
32,
33,
34,
35,
36]. They make the energy on the user side follow the frequency regulation signals in the PJM market for equivalent output, similar to energy storage. Shi et al. [
37] used the battery storage system for peak shaving and frequency regulation through the joint optimization framework on the user side. Based on the degradation effect of energy storage batteries, it was found that the joint optimization has super linear gain compared with energy storage for frequency regulation or peak shaving alone, but this method is only used in the day-ahead planning stage, and simply follows the frequency regulation signal during the day’s frequency regulation real-time output. It fails to achieve real-time optimization, and the peak shaving model only considers the peak cost in the electricity price, not the difference of timeshare electrovalence. Based on the prediction model, Liu et al. [
38] proposed a model predictive control (MPC) intra-day rolling optimization frequency regulation model. The model considers the degradation effect, but it does not consider the operation and maintenance cost of the battery, and while it achieves intra-day optimization, it does not consider the day-ahead bidding capacity of the energy storage.
On the basis of this research, this paper puts forward a strategy for day-ahead peak shaving and frequency regulation planning and a frequency regulation rolling optimization output strategy for user-side intra-day energy storage. The strategy considers the degradation cost and operation and maintenance cost of energy storage. By solving the economic optimal model of peak shaving and frequency regulation coordinated output a day ahead, the division of peak shaving and frequency regulation capacity of energy storage is obtained, and a real-time output strategy of energy storage is obtained by MPC intra-day rolling optimization. Finally, through the 24-h economic analysis of the strategy proposed in this paper and the economic analysis of the whole life cycle, it can be concluded that the economic benefit of energy storage participating in peak shaving and frequency regulation coordinated output is much higher than that of energy storage batteries participating in peak shaving or frequency regulation under the same capacity. Through simulation, it is demonstrated that energy storage participating in peak shaving can reduce the battery degradation cost when energy storage is used for frequency regulation by reducing the number of battery cycles, thereby increasing the service life of energy storage batteries.
The main contributions of this work are described as follows:
A peak shaving and frequency regulation coordinated output strategy based on the existing energy storage participating is proposed to improve the economic problem of energy storage development and increase the economic benefits of energy storage on the industrial park.
The profit and cost models of peak shaving and frequency regulation are established.
The benefits brought by the output of energy storage, degradation cost and operation and maintenance costs are considered to establish an economic optimization model.
The intra-day model predictive control method is employed for rolling optimization.
2. Establishment of the Peak Shaving Model
In order to promote staggered peak power consumption, the industrial peak valley electricity price of a city in China is shown in
Table 1. For industrial parks with two-part electricity pricing, the electricity charge includes the electricity charge and the basic electricity charge [
39]. The electricity charge is calculated according to the amount of electricity consumption, and the basic electricity charge is calculated according to the maximum demand. For convenience of expression, function
f1(
x, y) is defined as follows.
where,
x and
y are mathematical variables.
On this basis, the total electricity charge for industrial users is calculated as follows.
where,
Cx is the demand price when the actual maximum demand is within the maximum contract limit,
So is the maximum contract limit, and
Cx1 is the demand price of the excess part when the actual maximum demand exceeds the maximum contract limit. According to the regulations,
Cx1/
Cx = 2. Let
s = [
s(1),
s(2),…,
s(
T)] be the vector of power demand.
Celec(
t) is the hourly electricity price,
s(
t) is the power demand of the industrial park,
ts is the data time step, and T is the amount of data.
Typical daily load curve of industrial park is shown in
Figure 1.
According to the daily load curve and electricity price table, the power demand of the industrial park is large when the electricity price is high, but the power demand is small when the electricity price is low, so the power consumption cost is high.
2.1. Income from Energy Storage Participating in Peak Shaving
By providing energy storage to reduce the maximum demand by charging in the low electricity price period and discharging in the peak electricity price period users can reduce the total electricity charge. The difference between the electricity charge without energy storage and peak shaving by energy storage is the income from participating in user side peak shaving, which is expressed as follows:
where,
b(
t) is the output of energy storage at each time.
b = [
b(1),
b(2), …,
b(
T)] is the vector of energy storage actions. This formula expresses the saving of electricity cost after energy storage participates in peak shaving, but the energy storage itself will deteriorate during charging, and daily maintenance is required to ensure the normal operation of energy storage.
2.2. Energy Storage Output Cost
In the operation of battery energy storage, the operation cost is a key problem that must be considered, and the degradation cost comes from the degradation of the battery under repeated charge and discharge cycles [
40,
41,
42]. Different batteries show different degradation characteristics. Lithium-ion batteries are a widely used form of battery energy storage. Therefore, the degradation cost model in this paper is mainly based on lithium-ion batteries.
In this paper, the rain flow cycle counting method is used to calculate the degradation cost of the energy storage battery. According to paper [
43], the relationship between the depth of discharge (DOD) of an energy storage battery and its cycle life is described as follows:
where,
Nmax is the cycle life (Times) of the battery, and
DOD is the discharge depth of the energy storage battery.
Using the rain flow counting method, the SOC change of the energy storage battery can be obtained according to the energy storage output
b(
t) of each cycle, and then the cycle output times and output depth of the energy storage in each output cycle can be obtained. In a certain cycle, the energy storage has conducted n cycle output, and the corresponding discharge cycle depth is set as
DOD(1),
DOD(2), …,
DOD(n). Then, the battery life decay rate in a certain energy storage output cycle is given as follows [
40]:
where
γ is the decay rate of battery life, and
Nmax (
DOD(
i)) is the maximum number of discharge cycles corresponding to
DOD(
i). Therefore, the degradation cost generated after one cycle of output of the energy storage battery is expressed as follows.
where
CS is the unit power cost of the PCS, that is, the unit power cost of the energy storage converter;
Pr is the rated configuration power of the energy storage;
CB is the unit capacity cost and
Er is the energy storage capacity.
Energy storage operation and maintenance cost refers to a series of costs such as battery maintenance, repair and inspection to ensure the normal use of energy storage battery within the specified service life [
44], which is related to the charging and discharging power and battery capacity of energy storage.
where
CPOM is the unit power operation and maintenance cost;
CBOM is the operation and maintenance cost per unit capacity, that is the operation and maintenance cost corresponding to absorbing/releasing 1 MWh of energy.
2.3. Model Establishment
According to the benefits and costs described above, the daily energy storage output planning model aiming at the lowest total electricity charge in the industrial park is established as follows:
where
b1(
t) is the variable, meaning the output of energy storage for peak shaving at each time,
b1 = [
b1(1),
b1(2), …,
b1(
T)] is the vector of battery actions for peak shaving.
The constraints are:
- (1)
SOC constraint of energy storage battery
where SOC
max and SOC
min respectively represent the maximum and minimum state of charge in the discharge area of the energy storage battery, SOC
1 represents the SOC of the energy storage battery at the initial time, and E
1 represents the peak shaving capacity of energy storage.
- (2)
Same constraint as initial state
Each optimization process is a cycle. During this cycle, the SOC of the energy storage battery shall be consistent, so as to facilitate the optimization and output of multiple cycles.
- (3)
Maximum power constraint of energy storage charge and discharge
where
bi1(
t) represents the charging power of the battery during peak shaving, and
bo1(
t) represents the discharge power of the battery during peak shaving.
3. Optimization Model of Energy Storage Battery Participating in Frequency Regulation
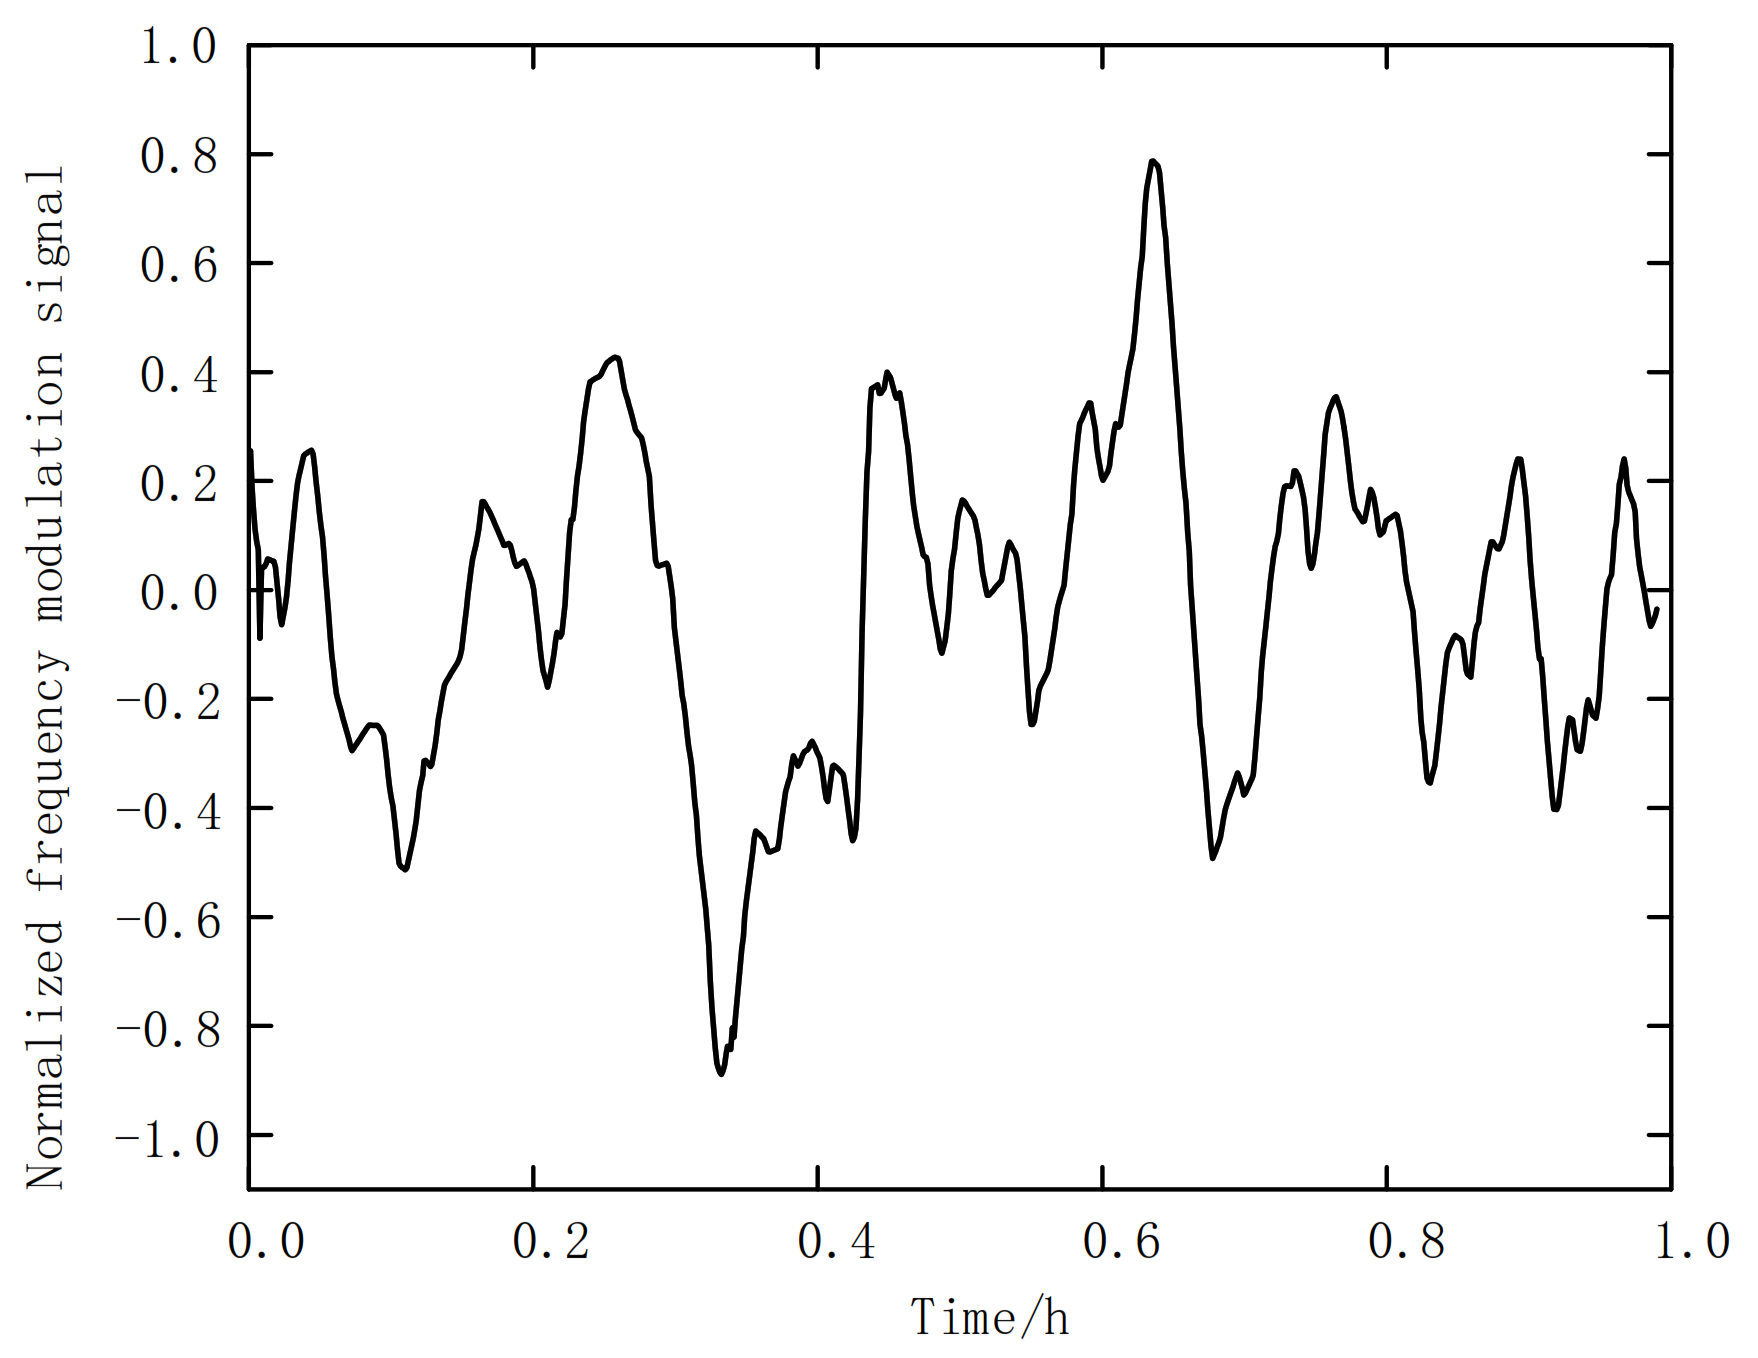
The energy storage battery has good response speed and climbing ability, so it can adapt to flexible frequency regulation signals. In this paper, the Reg_D frequency regulation signal of the American PJM market is used as the frequency regulation action instruction of energy storage battery.
Figure 2 shows a one-hour Reg_D frequency regulation signal, which is expressed in normalized form and ranges from [−1,1]. In this frequency regulation market, each energy storage power station willing to participate in frequency regulation service needs to submit bidding application and bidding capacity the day before the frequency regulation day. After winning the bid, the energy storage battery needs to output according to the frequency regulation signal. At the same time, the frequency regulation market will compensate the capacity of the winning energy storage. However, the energy storage unit that fails to comply with the regulations will also be adjusted and punished.
The power that battery energy storage needs to respond to in the process of frequency regulation
Pneed is described as follows.
where
r(
t) is the Rrg_D frequency regulation real-time signal and
CJ is the bid-marked capacity.
When participating in the frequency regulation service market, the mileage of the energy storage battery following the frequency regulation signal determines the benefits brought by the energy storage. Deeper following of the signal will give more frequency regulation mileage benefits and reduce the penalty caused by insufficient output. However, deeper following means a larger span of energy storage output, which will also bring more degradation, operation and maintenance costs. Therefore, a frequency regulation optimization model with the most economical energy storage battery is established.
- (1)
Traditional objective function
where
C and
b2(
t) are the variables,
C is the bidding capacity,
b2(
t) is output of energy storage for frequency regulation at each time.
cmis is the penalty coefficient, which represents the penalty amount required for every 1 MW·h of deviation between the energy storage output and the frequency regulation signal and
ct is the frequency regulation compensation coefficient, which represents the compensation amount for each 1 MW energy storage successfully bid by the grid service market every hour.
Rb is mileage compensation, and its calculation method is described as follow.
where,
K is the frequency regulation performance index,
cbp is the frequency regulation mileage price,
rb is the frequency regulation mileage in a certain frequency regulation stage. The calculation method was according to reference [
45,
46].
- (2)
Constraints
where,
P2max is the maximum power of frequency regulation of energy storage.
- (3)
Improve the objective function
In the constraint condition (18), the sum of the energy storage battery’s output for frequency regulation in an optimization cycle is 0. Therefore, in a frequency regulation optimization cycle, the output of the energy storage battery cannot impact the electricity charge, but it will have an impact on the basic electricity charge. This will fluctuate the total electricity charge after the energy storage battery participates in frequency regulation, so the objective function is improved as follows:
where
b2 = [
b2(1),
b2(2), …,
b2(
T)] is the vector of battery actions for frequency regulation.
6. Example Analysis
6.1. Parameter Setting
In order to verify the effectiveness of the scheme in improving the economy of energy storage on the user side, the actual Reg_D signal and industrial park load are used to simulate and verify. The experimental model is optimized by the CVX software package in MATLAB, which is a general software package to solve convex optimization problems. the parameters appearing in the model are assigned values as shown in
Table 2. Because the frequency regulation signal adopts the Reg_D of the PJM market in the United States, the currency unit in this paper is the US dollar. The frequency tariff is converted from one month to a single day price. Because the research focus of this paper is not to determine the optimal value of the user’s maximum contract limit, and the optimal value of the contract limit is a long-term fixed value and cannot be changed every day, so the maximum contract limit is specified as the determined value in the experimental process of this paper.
The parameters of energy storage battery used in this paper are shown in
Table 3.
6.2. Peak Shaving and Frequency Regulation Day-Ahead Optimization
In this paper, a long short-term memory (LSTM) network is used to predict the load and frequency regulation signal. Because the time steps of peak shaving and frequency regulation are different, peak shaving needs to optimize the electricity price and load demand of the whole day as a reference, so the optimization step is hour level, while the step size of Reg_D signal is 2 s, which is too different from the peak shaving time step. If they are optimized for 24 h, there will be up to 43,200 frequency regulation signals, which undoubtedly increases the optimization complexity. Therefore, in the day-ahead capacity planning stage in this paper, the load data is divided into 2 s from the original steps of 15 min, so four data in an hour are divided into 1800 data to match the frequency regulation steps, so Equation (18) can be solved to get E1 and E2. This process is repeated 24 times to obtain 24 groups of E1 and E2 per day, and the average value is taken for the final peak shaving and frequency regulation capacity allocation.
According to the capacity planning model of peak shaving and frequency regulation and the parameters given above, an energy storage battery with a maximum power of 1 MW and capacity of 1 MW·h was used to carry out the day-ahead peak shaving and frequency regulation planning on the user side. The obtained results are
E1 = 0.8 MW·h and
E2 = 0.2 MW·h. Then, we bring
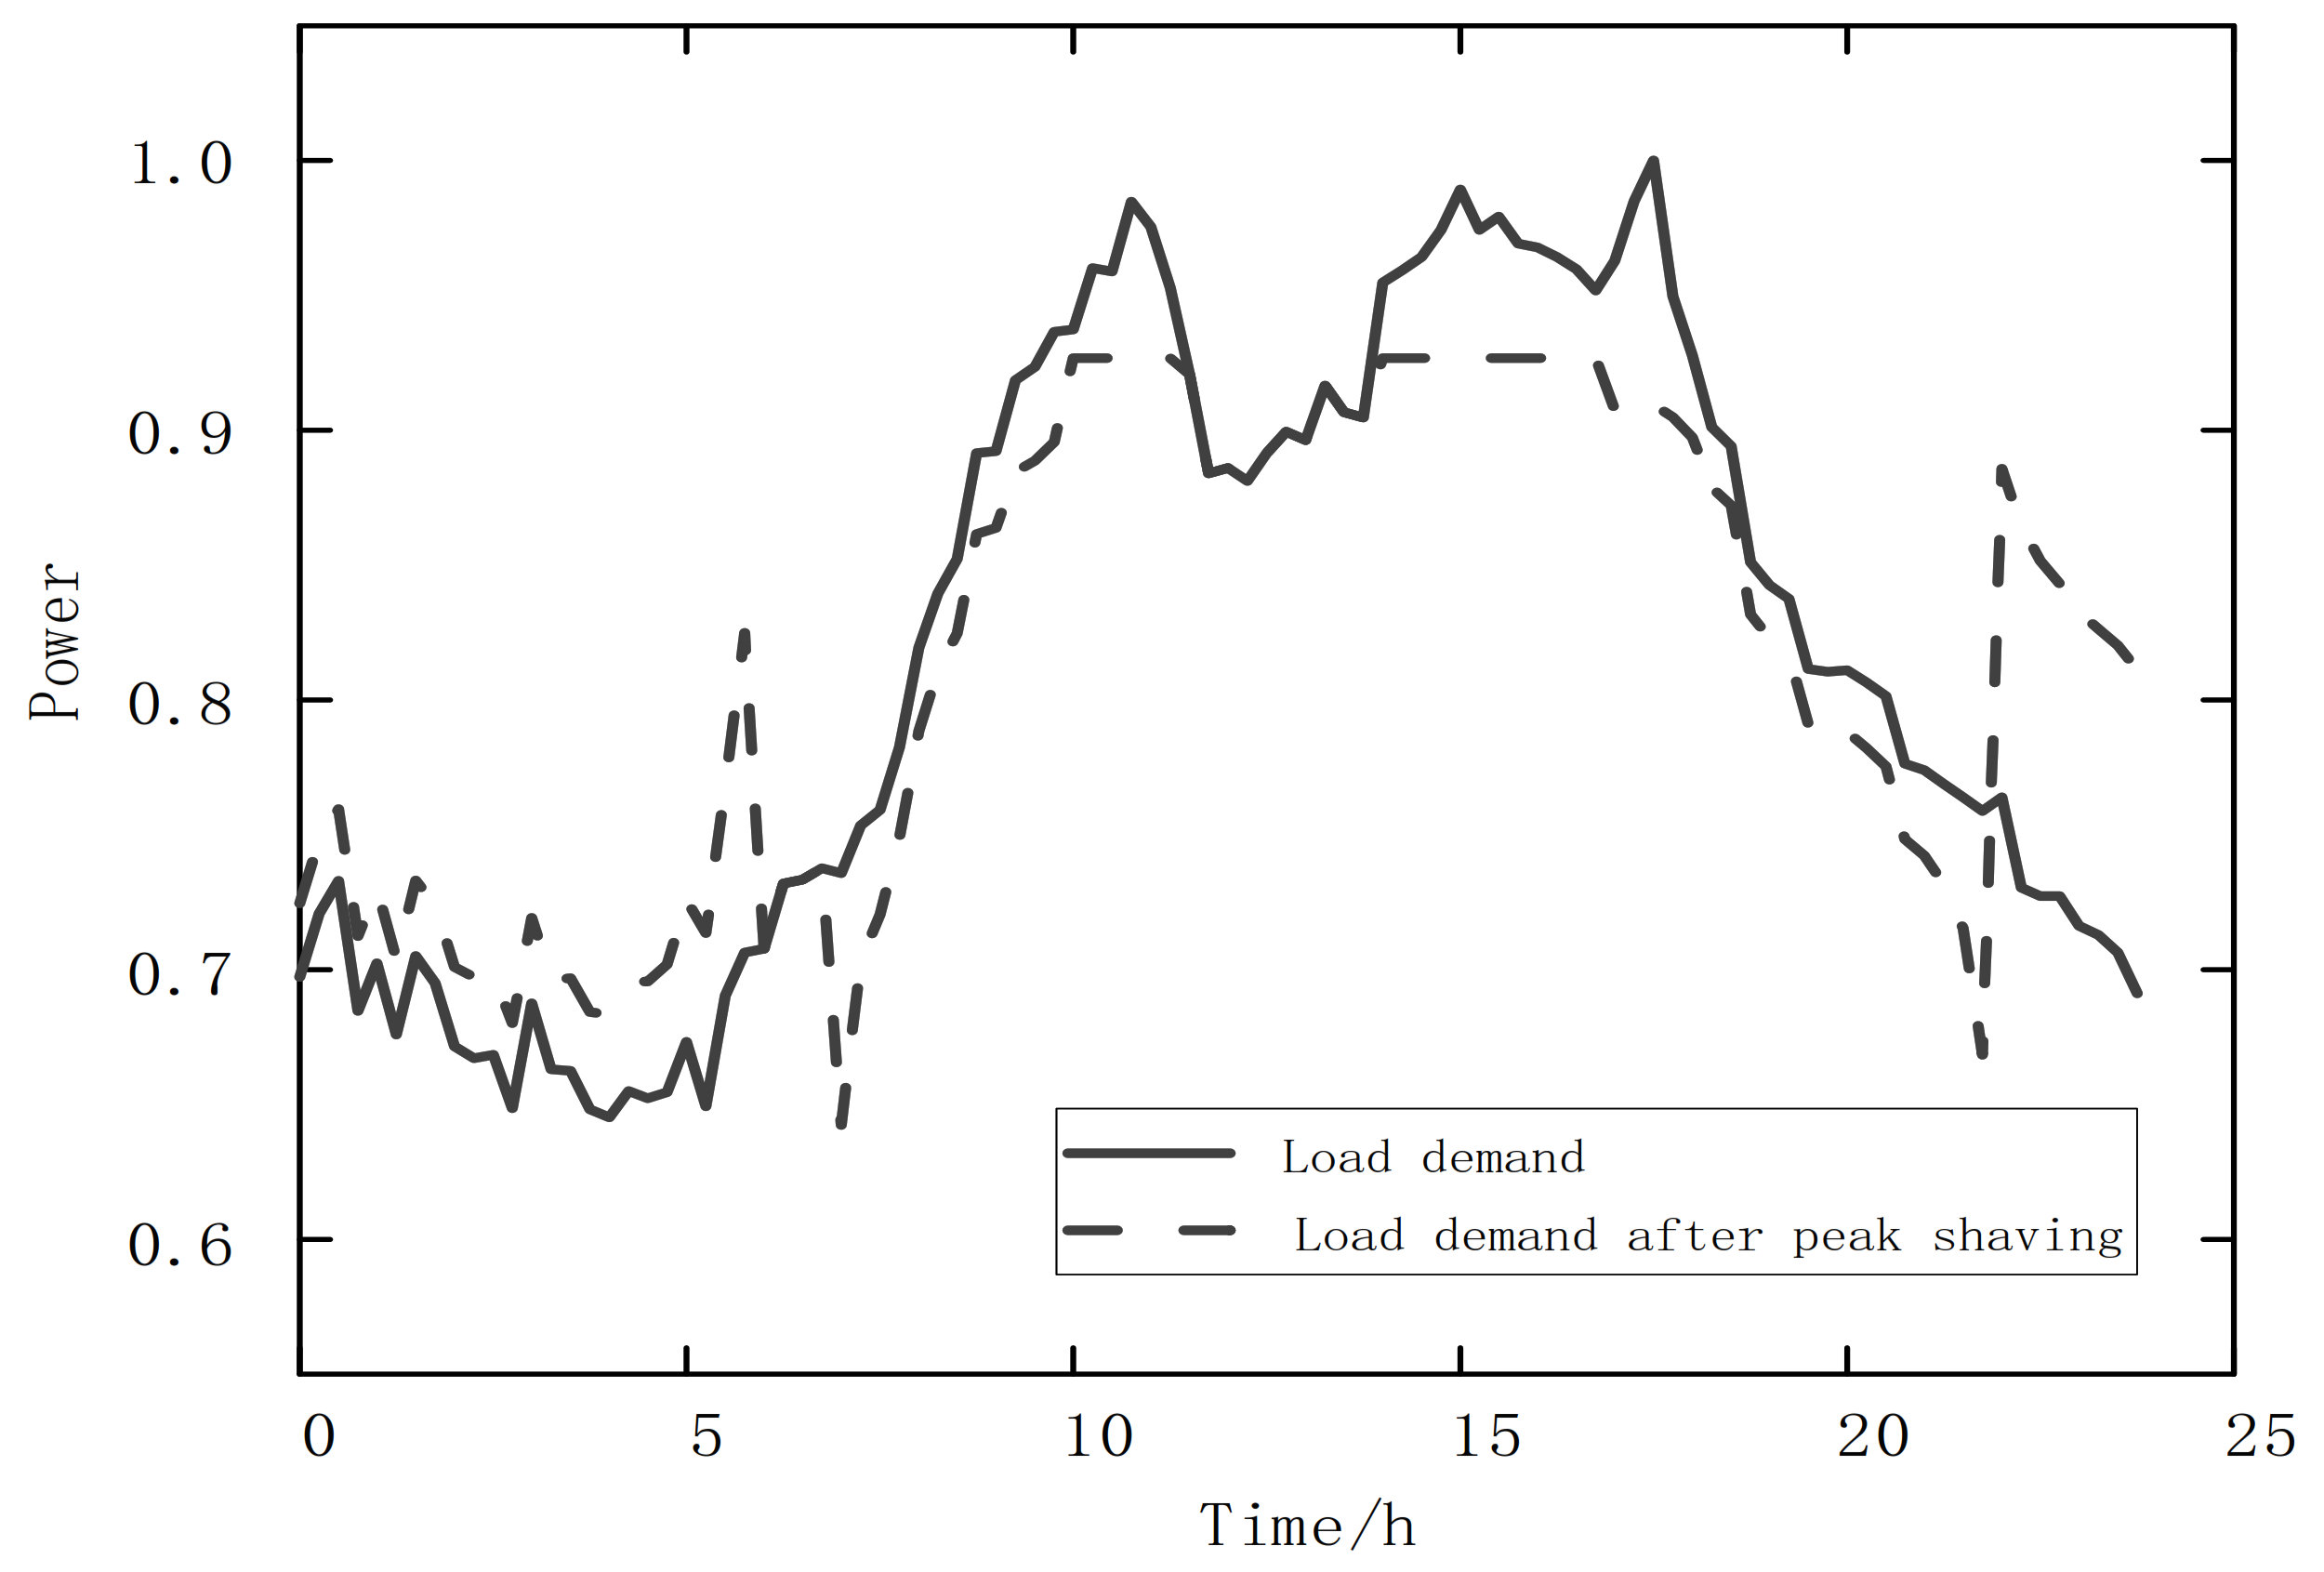
E1 into the peak shaving model shown in Equation (8) and so get the power curve required by the user after peak shaving is shown in
Figure 4. The energy storage output and SOC changes are shown in
Figure 5 and
Figure 6. The maximum output power of energy storage peak regulation is
P1max = 0.13 MW. According to
Figure 4, the energy storage battery charges in the night when the electricity price is low, and the energy storage discharges in the morning and afternoon when the electricity price is high, so as to reduce the power demand of users in the time when the electricity price is high. Maximum demand from industrial users is reduced based on maximum contract quotas.
According to the calculation rule of the user electricity charge, the 24 h electricity charge without energy storage battery is $2487, of which the demand electricity charge is $230. After adding the output of the energy storage battery, the electricity charge for 24 h is $2446, including the demand electricity charge of $199 and degradation cost and operation and maintenance cost of $52. Therefore, the energy storage power station is equipped with energy storage battery for peak shaving, which has limited savings on electricity charges. This is because if the energy storage output is small and the peak shaving is small, it has little impact on electricity charges. When the energy storage output is large, although the electricity charges are reduced, the degradation costs and operation and maintenance costs of the energy storage will also increase, resulting in no significant savings in total electricity charges.
Taking
E2 = 0.2 MWH and
P2max = 0.87 MW into the frequency regulation model, the optimal power C = 0.87 MW. The variation results of energy storage frequency regulation output and SOC are shown in
Figure 7 and
Figure 8.
It can be seen from the
Figure 7 that the energy storage battery tracks the Reg_D signal and sends output most of the time. When large-scale output of the energy storage is required, the model will take into account the degradation effect of the energy storage battery, operation and maintenance costs and power demand at the user side, so that the energy storage battery only responds to some frequency regulation commands and reduces the output depth. In this hour, the electricity charge of the industrial park is
$57.37. Participating in the service market through frequency regulation, the optimized electricity charge is
$37.60, including degradation cost and operation and maintenance cost of
$9.12. Thus, the user-side energy storage battery can participate in the market frequency regulation auxiliary service, which can effectively reduce the user’s electricity charge.
6.3. Intra-Day Real-Time Optimization
According to the LSTM that predicts the frequency regulation signal, the MPC model described in
Section 4 is used for rolling training on the frequency regulation day in which the energy storage with power of 0.87 MW and capacity of 0.2 MWH is used. The 24-h frequency regulation output is shown in
Figure 9.
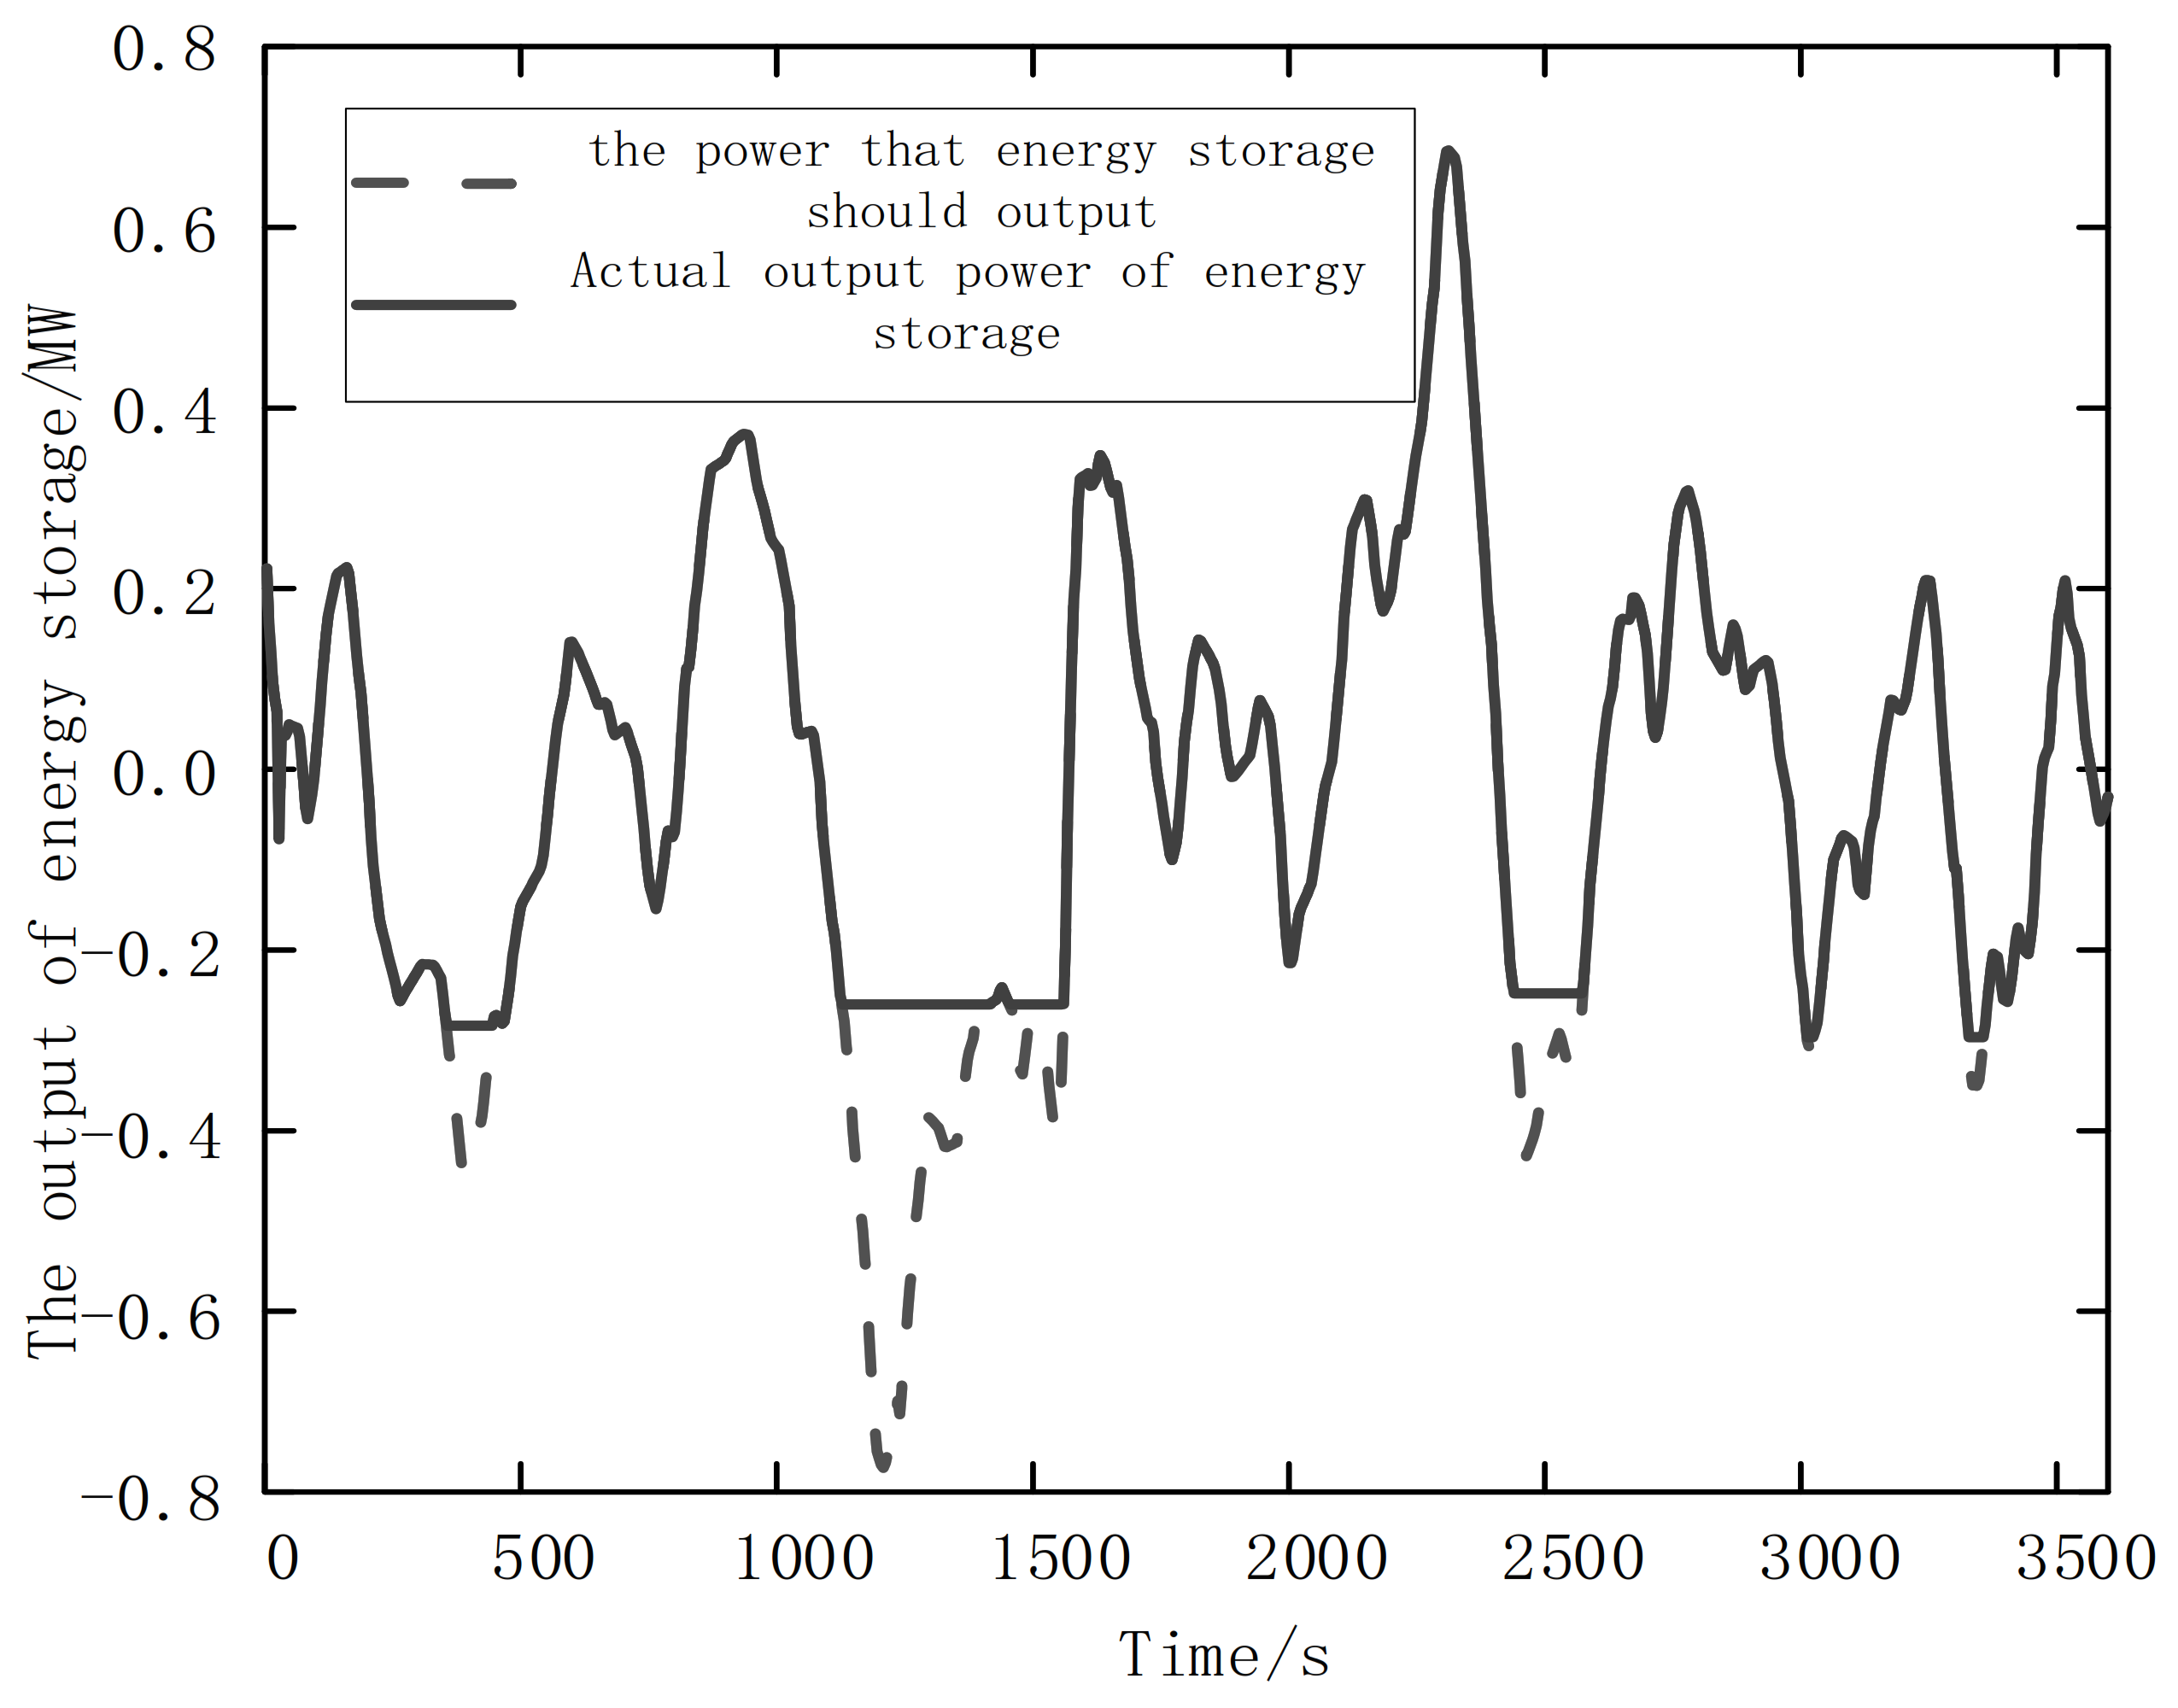
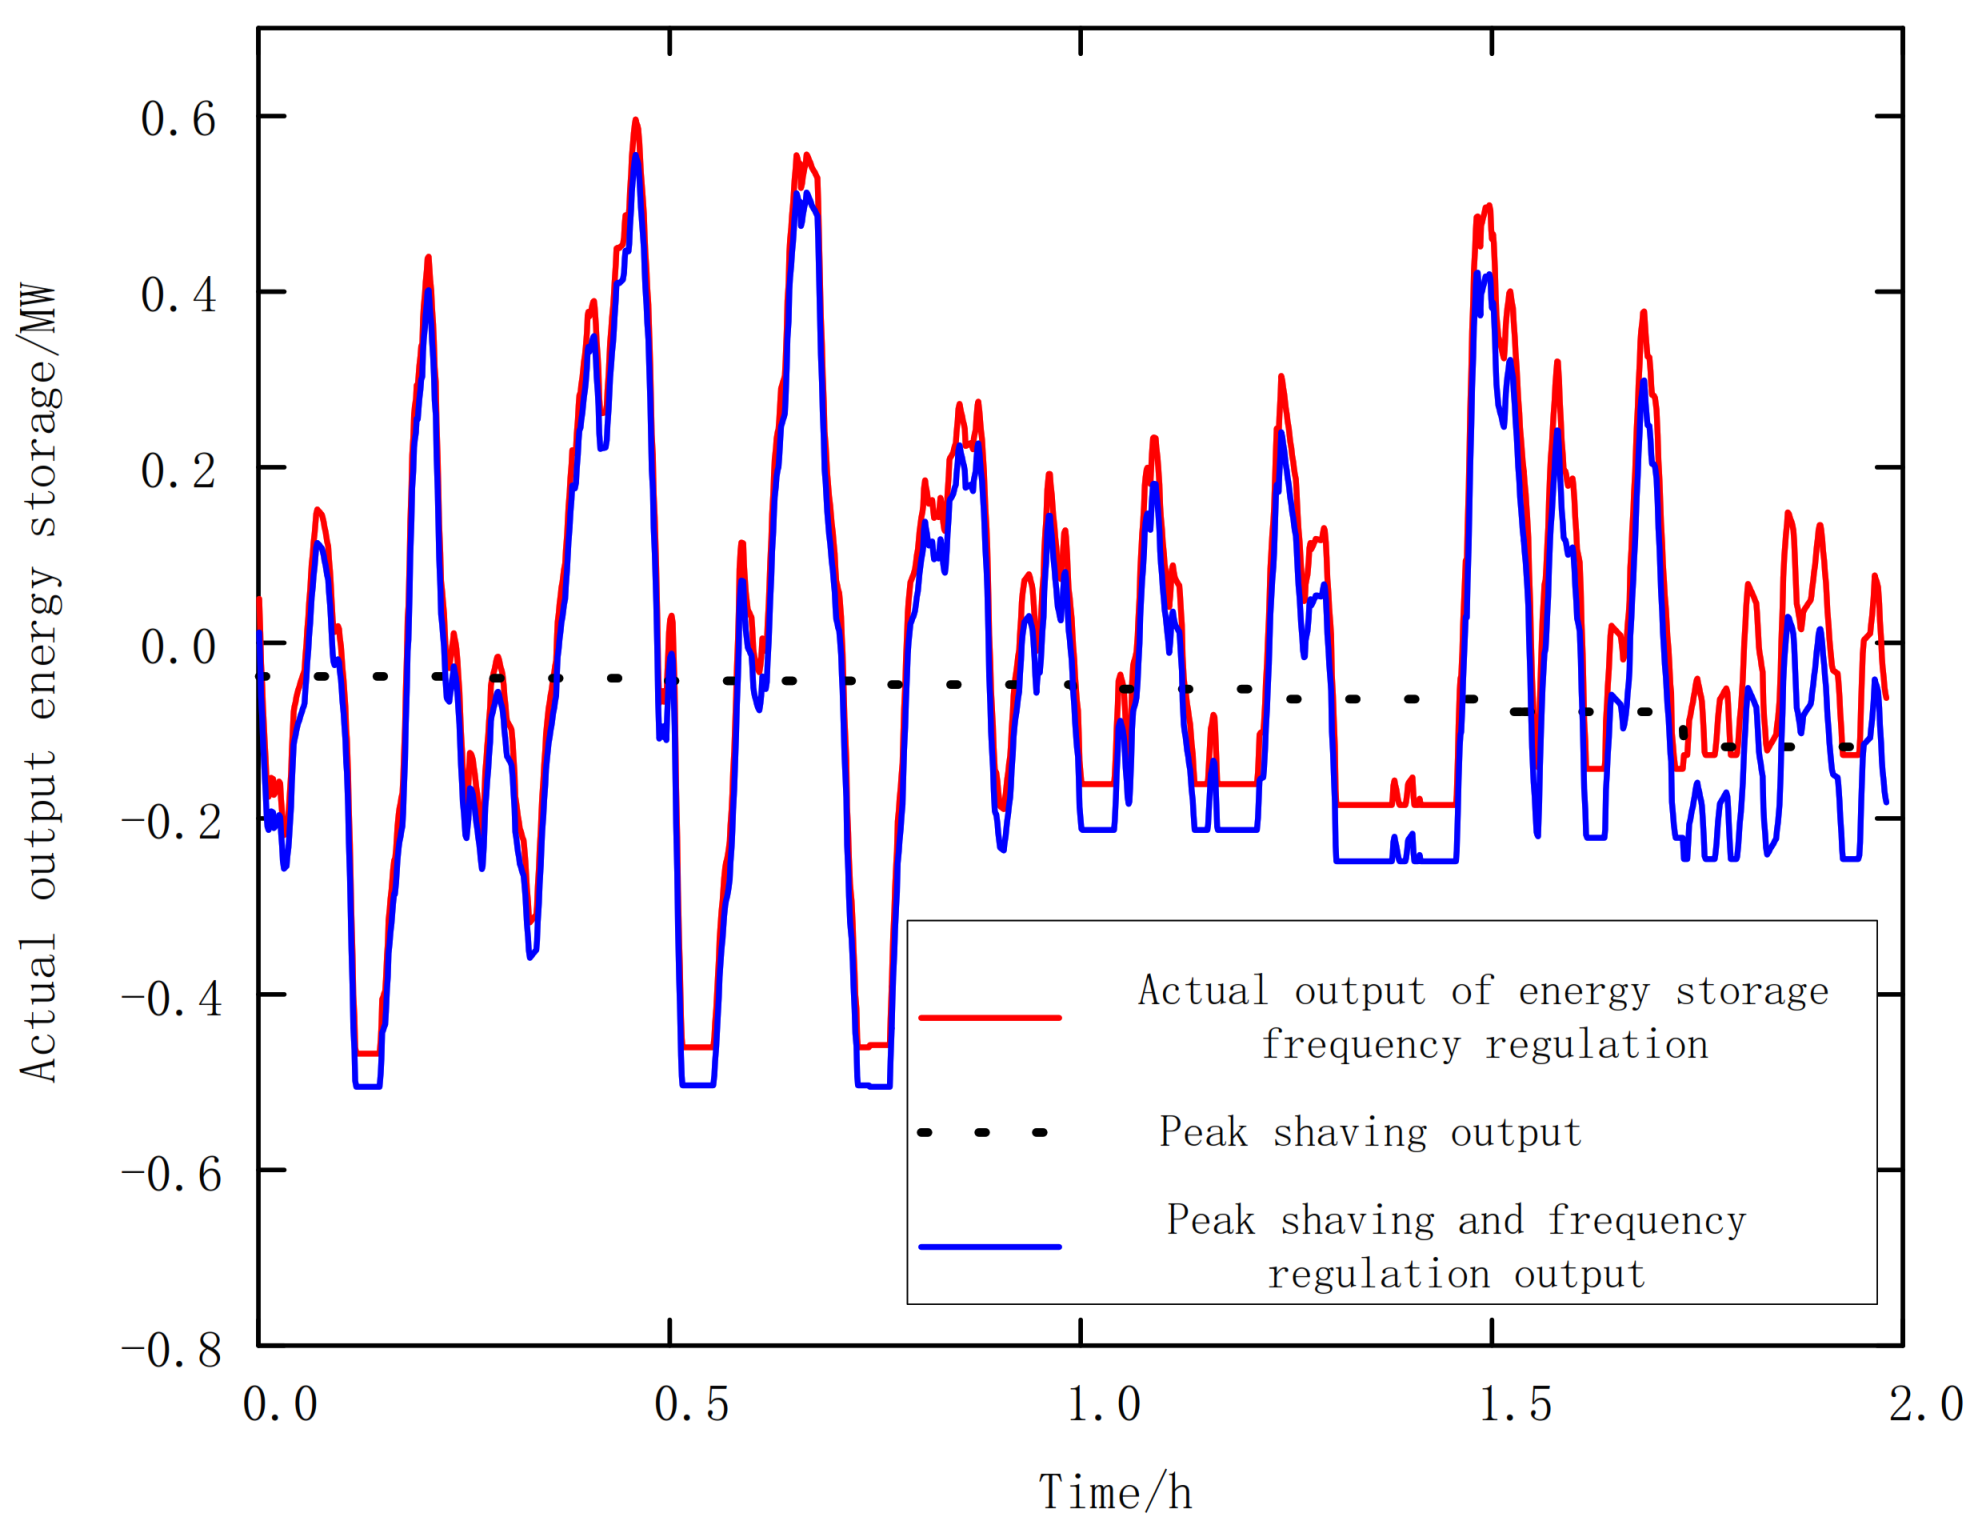
Since the total output of the energy storage battery in a day is equal to the sum of the frequency regulation output and the peak shaving output, we can take any continuous two hours in a day to observe, and the actual total output of energy storage is shown in
Figure 10.
6.4. Economic Analysis
This section compares the coordinated output of peak shaving and frequency regulation of energy storage with the economic benefits obtained by peak shaving or frequency regulation alone for a whole day. As shown in
Figure 11, the impact of using 1 MW and 1 MWH energy storage batteries for one day under different schemes on the electricity charge of the industrial park is shown respectively.
It can be seen from the
Figure 11 that the 24 h electricity charge of users obtained through the strategy in this paper is reduced by 10.96% compared with the output without energy storage, 5.8% compared with the output of peak shaving only for energy storage, and 3.6% compared with the output of frequency regulation only for energy storage. The benefit brought by the combined output of energy storage peak shaving and frequency regulation is better than that of the frequency regulation service or peak shaving alone with batteries of the same capacity and power.
This is due to the Reg_D frequency regulation signal frequently crossing the zero value, and the SOC of the battery can be recovered by following the signal. Therefore, there is little demand for capacity during energy storage frequency regulation. Although the profit obtained by using 1 MW bidding capacity is greater than that obtained by using 0.87 MW capacity for frequency regulation, it will also increase the degradation cost of energy storage battery each time following the signal. If 0.87 MW power is used for frequency regulation and 0.13 MW power is used for peak shaving, the benefit of frequency regulation is less than that of 1 MW power frequency regulation, but the cost of degradation benefit is lower, and the benefit of peak shaving will be obtained. Therefore, the optimal economic results of frequency regulation and peak shaving will be obtained. The degradation costs incurred by adopting various schemes are shown in
Table 4.
It can be seen from
Table 4 that the sum of degradation cost generated by 0.87 MW, 0.2 MW·h frequency regulation and 0.13 MW, 0.8 MW·h peak shaving alone is
$16 more than that generated by 1 MW, 1 MW·h combined frequency regulation with peak shaving. The reason for the cost reduction is that in the process of joint output, the frequency regulation signal has quite a lot of time, which is contrary to the peak shaving of energy storage, thus reducing the discharge depth of the storage battery and reducing the cost of degradation.
6.5. Economic Analysis Based on Life Cycle
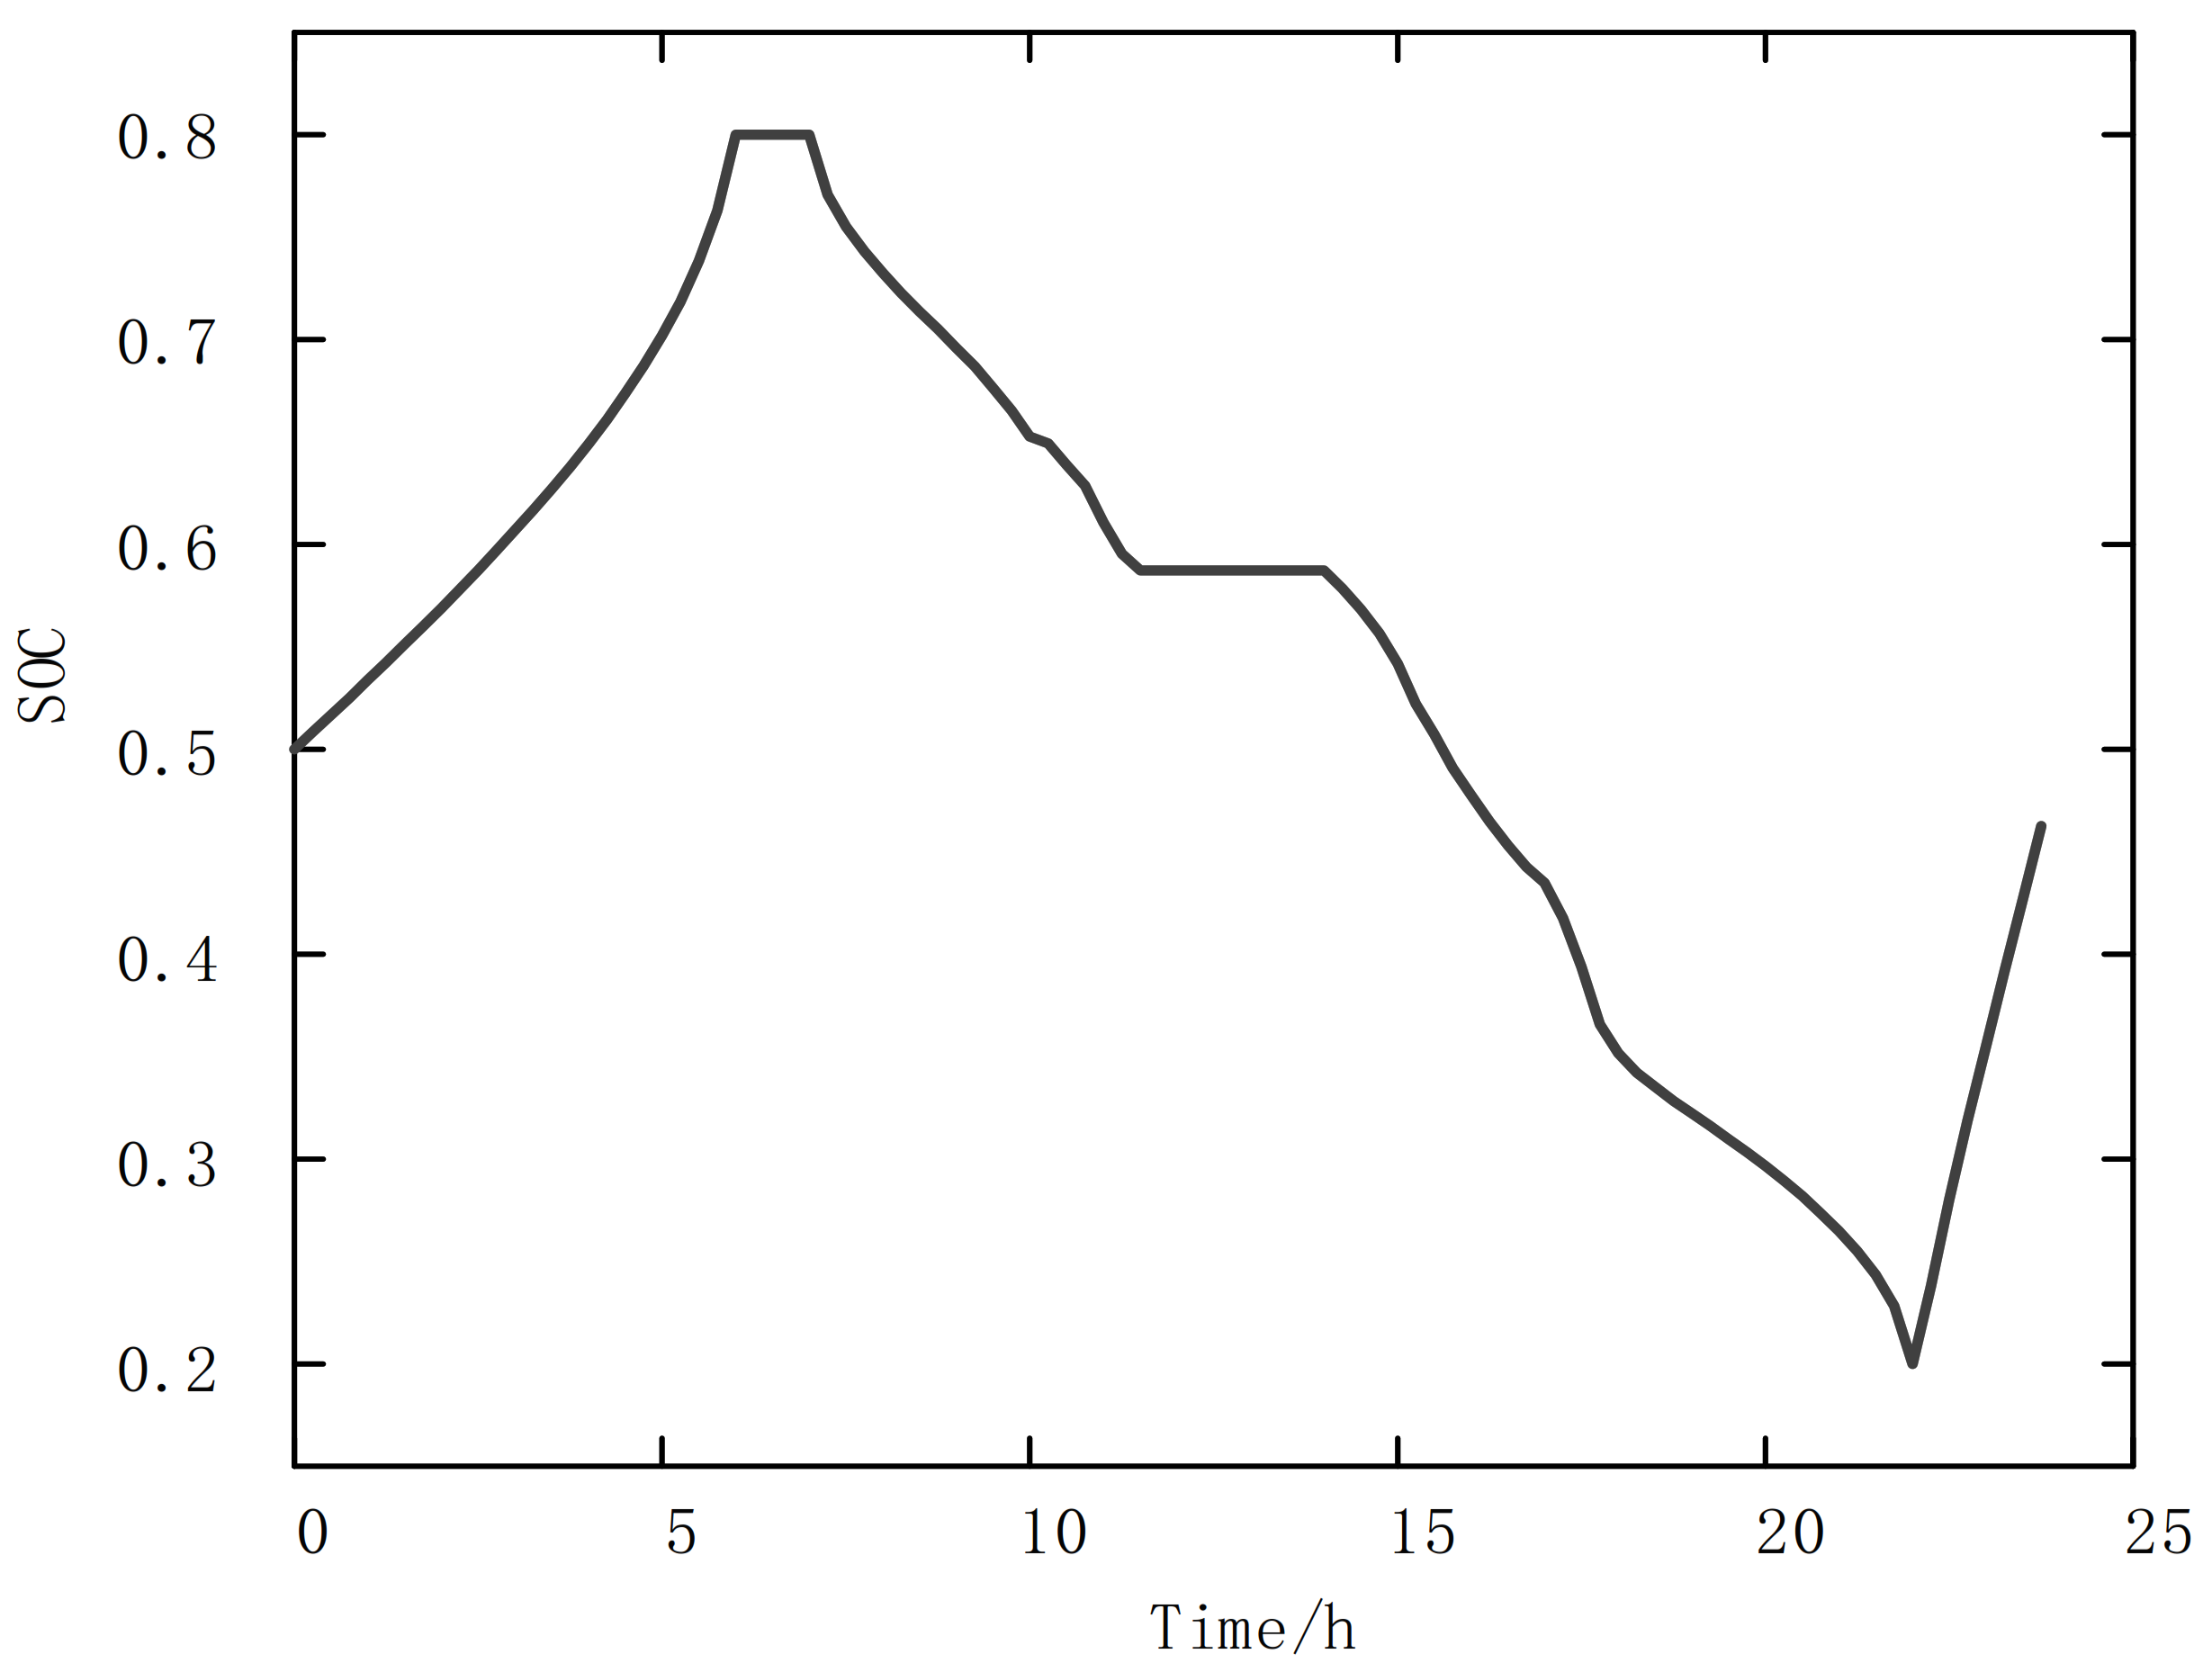
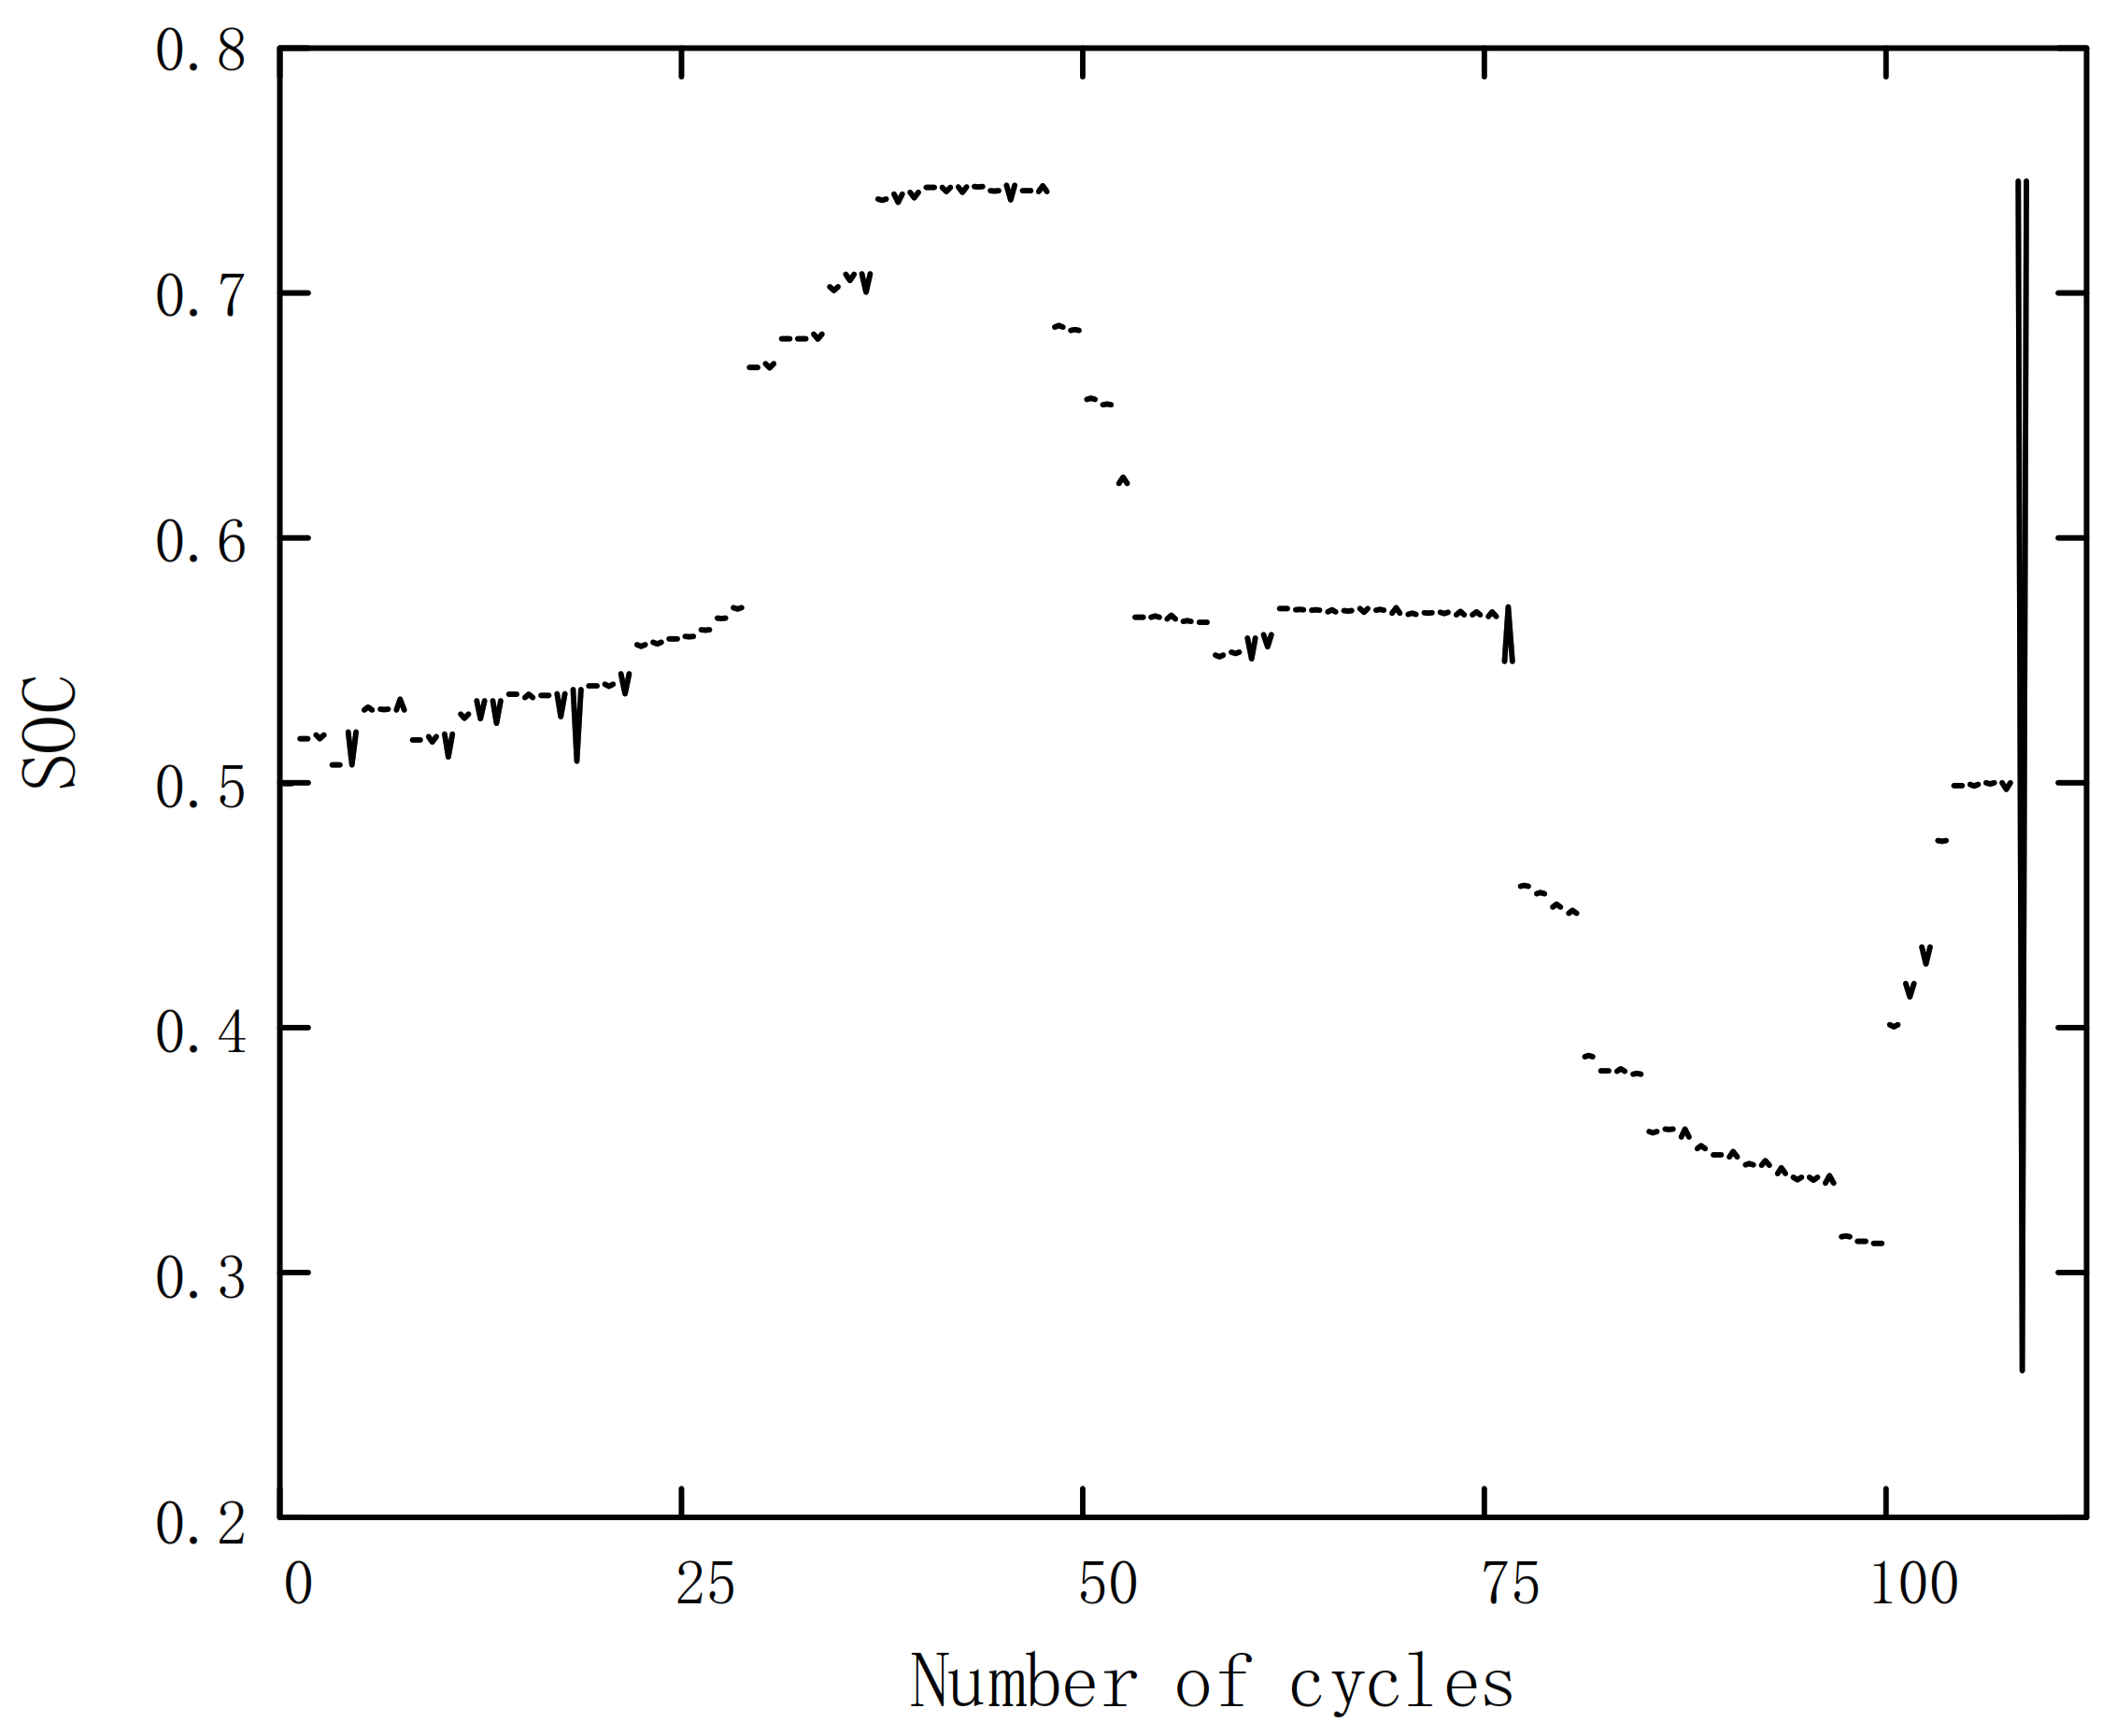
According to the 24 h energy storage peak shaving and frequency modulation output, the SOC change of the energy storage battery during the day is shown in
Figure 12.
According to the SOC change data over 24 h, the cycle times and cycle depth of peak shaving and frequency regulation of energy storage in a day can be obtained by using the rain flow counting method, as shown in the
Figure 13. The discharge cycle is composed of peak shaving deep cycle and several frequency regulation shallow cycles. A total of 109 cycles are carried out in 24 h, and the sum of cycle depths is 0.7171. According to the average cycle life of lithium battery, the operation life under the strategy proposed in this paper is 3 years.
In order to reflect the profitability of the strategy proposed, the rate of return on investment is introduced for evaluation. The rate of return on investment can be calculated by the ratio of the average annual net income over the entire life cycle of the system to the total investment amount, and the greater the rate of return on investment, the better the profitability of the project, which can be calculated as follows.
where,
K is the annual average investment of the project, namely
K =
CT/
TLCC.
NB is the average annual net income during the life cycle of the system.
According to the life of the energy storage battery, the economic analysis of the whole life cycle is carried out, and the costs and benefits are shown in
Table 5.
For comparison, using the same method, frequency regulation of 1 MW, 1 MW·h energy storage batteries and peak shaving of 1 MW, 1 MW·h energy storage batteries are used to perform a full-life economic analysis. The results are shown in
Table 6 and
Table 7.
Available from
Table 5,
Table 6 and
Table 7, the life cycle analysis results are different. For
Tlife, peak shaving only is the largest, followed by peak shaving and frequency regulation coordination output, and only frequency regulation is the smallest. This is because the SOC changes are different for different output strategies. When energy storage performs frequency modulation only, it needs to constantly switch between the two states of charging and discharging for tracking the Reg_D signal. Therefore, the corresponding number of energy storage cycles per day will increase. The cycle life of the energy storage battery is fixed, and when the number of cycles is reached, the battery needs to be replaced so greater battery replacement costs will be incurred. Therefore, the
C1 is the largest when the energy storage battery only participates in frequency regulation service. Similarly,
Tlife is the largest when energy storage participates peak shaving only, so the number of battery replacement required in the whole life cycle is the smallest. Therefore,
C1 is the smallest when energy storage only shaves the peaks, and the characteristics of
C3 are the same as
C1. Although the investment cost of energy storage only peak shaving is low, the income from energy storage only peak shaving is too small, such that the net income in the whole life cycle of energy storage only peak shaving is negative, and the rate of return on investment is also negative. Although the frequency regulation gain of the energy storage battery is very high when it is used only, the service life of the energy storage is too short due to long-term multiple cycles. By comparison, under the operation of the strategy proposed in this paper, the energy storage battery can reduce the output cycle required for participating in frequency regulation through peak regulation output (as shown in the
Figure 12). At the same time, the problem of low peak shaving income is compensated by the high income of frequency regulation services, so the income and life of energy storage batteries coexist, which has a higher investment value.
7. Conclusions
In order to improve the economy and investability of energy storage on the user side, this paper puts forward the peak shaving and frequency regulation coordinated output strategy in which the industrial park energy storage battery participates in the system frequency regulation service while peak shaving to obtain additional income.
The strategy divides the peak shaving and frequency regulation capacity of energy storage and obtains the output of peak shaving plan day ahead. The real-time output with optimal economy is obtained through MPC rolling optimization intra-day, and the degradation effect and operation and maintenance cost are considered while the maximum frequency regulation capacity compensation and mileage compensation are obtained, so as to improve the total revenue of the industrial park energy storage intra-day. Finally, the whole life cycle economic analysis of the strategy proposed in this paper shows that the peak shaving and frequency regulation coordinated output on the user side has a larger rate of return. When China’s frequency regulation service market is better in the future, this strategy provides a new idea for industrial park energy storage to improve its economy.


