Article

A Data Mining and Analysis Platform for Investment Recommendations

by
Elena Hernández-Nieves
1,*,
Javier Parra-Domínguez
1,
Pablo Chamoso
1,
Sara Rodríguez-González
1 and
Juan M. Corchado
1,2,3,4
1
BISITE Research Group, University of Salamanca, Edificio Multiusos I+D+i, 37007 Salamanca, Spain
2
Air Institute, IoT Digital Innovation Hub, Carbajosa de la Sagrada, 37188 Salamanca, Spain
3
Department of Electronics, Information and Communication, Faculty of Engineering, Osaka Institute of Technology, Osaka 535-8585, Japan
4
Pusat Komputeran dan Informatik, Universiti Malaysia Kelantan, Bachok 16300, Kelantan, Malaysia
*
Author to whom correspondence should be addressed.
Electronics 2021, 10(7), 859; https://doi.org/10.3390/electronics10070859
Submission received: 16 March 2021 / Revised: 29 March 2021 / Accepted: 31 March 2021 / Published: 4 April 2021

Abstract

:
This article describes the development of a recommender system to obtain buy/sell signals from the results of technical analyses and of forecasts performed for companies operating in the Spanish continuous market. It has a modular design to facilitate the scalability of the model and the improvement of functionalities. The modules are: analysis and data mining, the forecasting system, the technical analysis module, the recommender system, and the visualization platform. The specification of each module is presented, as well as the dependencies and communication between them. Moreover, the proposal includes a visualization platform for high-level interaction between the user and the recommender system. This platform presents the conclusions that were abstracted from the resulting values.

1. Introduction

Data analysis is a process of inspecting, cleaning, transforming, sorting, and modelling data for the purpose of finding useful information, reaching conclusions, and making appropriate decisions. In statistics, data analysis is divided into descriptive analytics, exploratory analytics, and predictive analytics.
Predictive analytics is defined as the branch of analytics that is used to make predictions regarding future events facing, for example, an organization. To do so, it will use various methods, such as data mining, text mining, artificial intelligence, statistics, or data modelling, among others. In addition, predictive analytics manages information technologies, analysis methods, and business process modelling with the purpose of anticipating future events that may happen to the organization in question.
In this research the focus is on predictive analytics with a specific approach to stock market analysis. It is assumed that a stock market prediction is considered successful if it achieves the best results using the minimum data input and the least complex stock market model [1]. Within the field of Artificial Intelligence, the emergence of Machine Learning and the increasing computing performance have allowed developing new services on the basis of traditional financial products, providing financial-economic instruments that provide higher versatility and greater speed [2]. As Jigar Patel et al. point out in [3], forecasting a stock’s value is difficult because of the uncertainty of prediction due to the large number of potential determinants. The authors suggest a method that includes both fundamental and technical analysis combined with Machine Learning algorithms, which is an approach to prediction that tries to improve its efficiency.
In contrast to other research that focuses on a single model for investment recommendation such as Artificial Neural Networks (ANN) or optimised decision trees, in this research, a series of algorithms (Random Forest Regressor, Gradient Boosting Regressor, SVM-LinearSVR, MLP Regressor and kNNNeighbors Regressor) are applied. In addition, technical analysis is used, combining Momentum Indicators and Moving Averages.The proposed recommendation system will remove subjectivity from the process after evaluating and validating the algorithms and will provide the user with the algorithm with the best accuracy. However, the main advantage of the investigated system consists in the possibility of consulting the whole process that the system has carried out (analysis, prediction and investment recommendations).
The research conducted in this study has led to the development of a platform that integrates different modules. The modular approach favours not only the overall research, but it is also good for achieving scalability, flexibility, and usability. The modules that make up the system are:
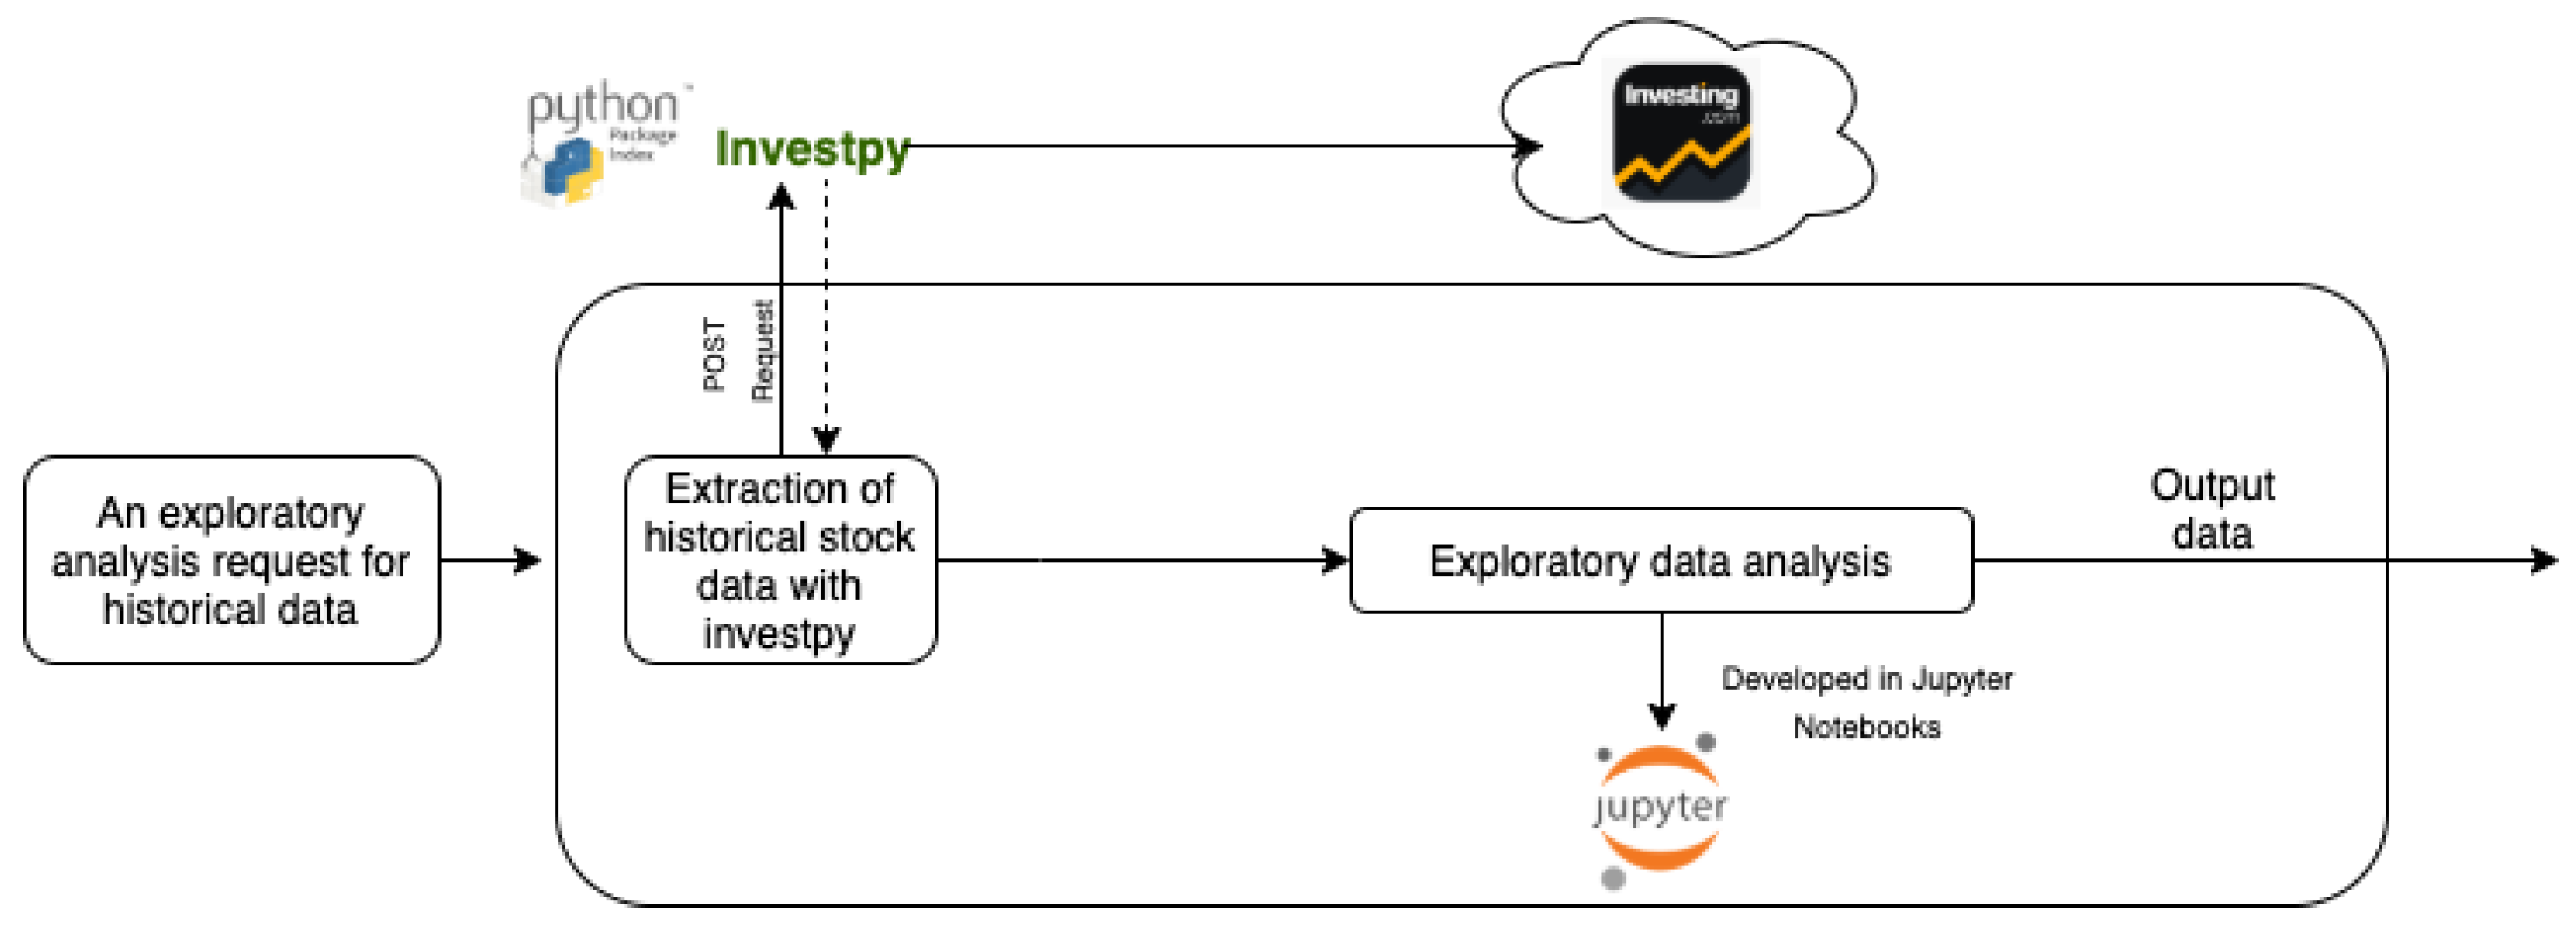
  • Analysis and data mining. The initial objective was to draw up a document that breaks down the functioning of the Spanish continuous market. The goal of this analysis was to determine the needs to be met by the prediction and recommendation model. Therefore, the market analysis has served as a starting point for the development of the platform. Regarding data extraction, given that the operation of the prediction and recommendation platform is based on a dataset containing the historical data of the companies in the continuous market, it has been necessary to create a system that is in charge of extracting the data in real time. Thus, this implies the need to find a reliable data source that contains the information that is required by the platform. It is possible to either make use of an Application Programming Interface (API) to allow for data retrieval, or to develop a system based on Web Scraping for the extraction and formatting of data. The analysis of the data greatly facilitates the subsequent development of a forecasting and recommendation system and the calculation of the technical analysis factors.
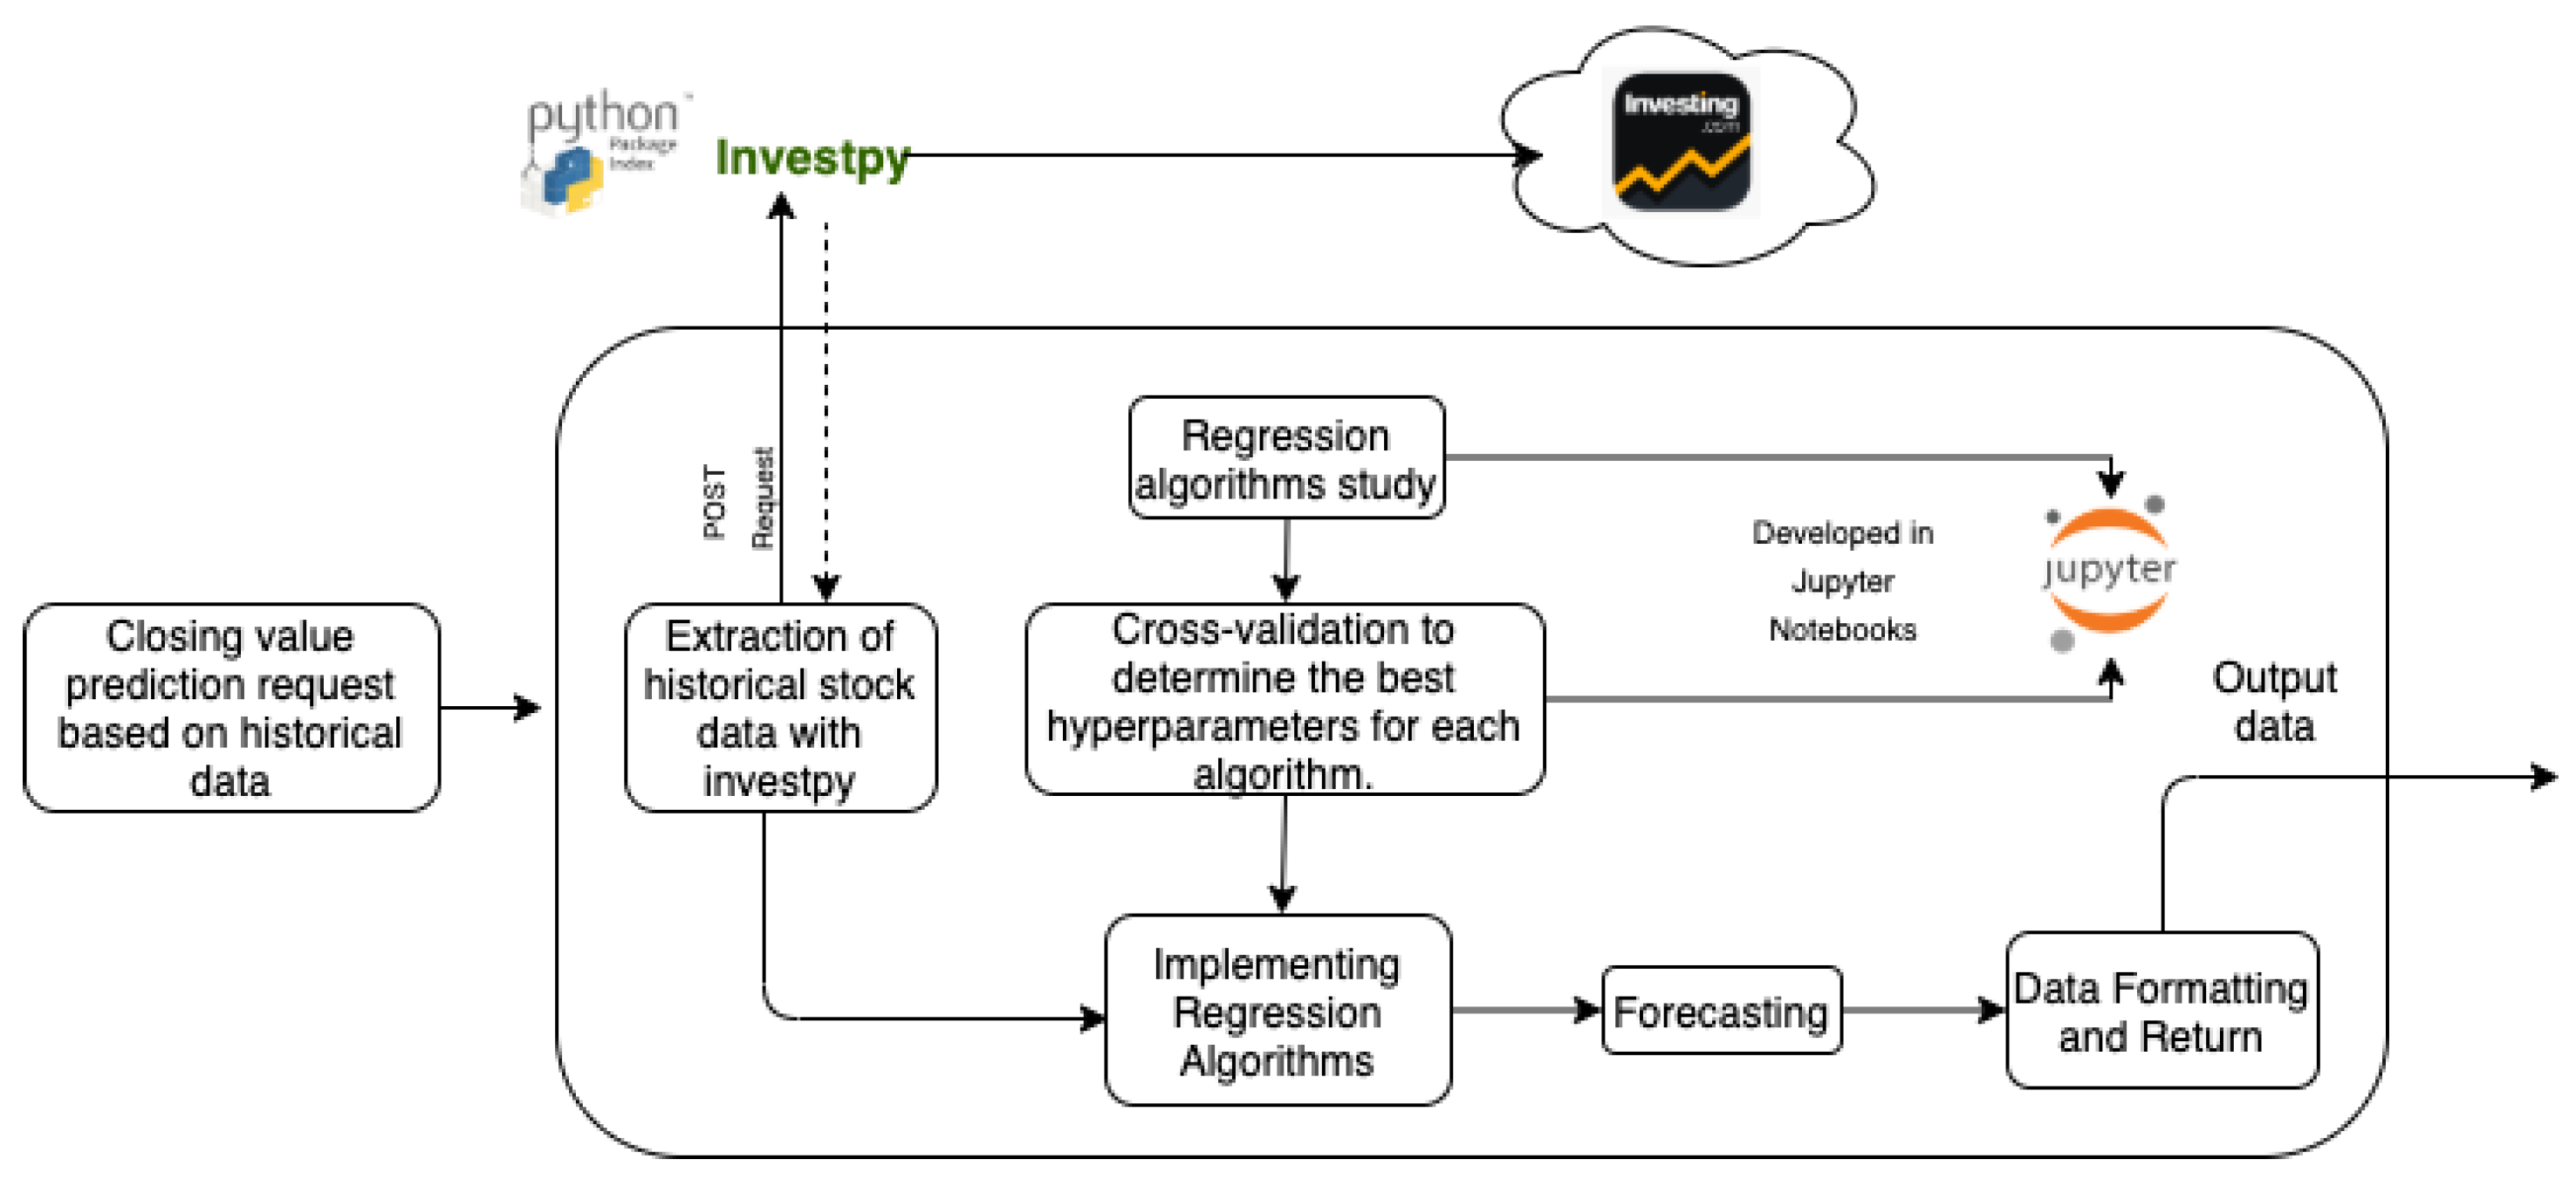
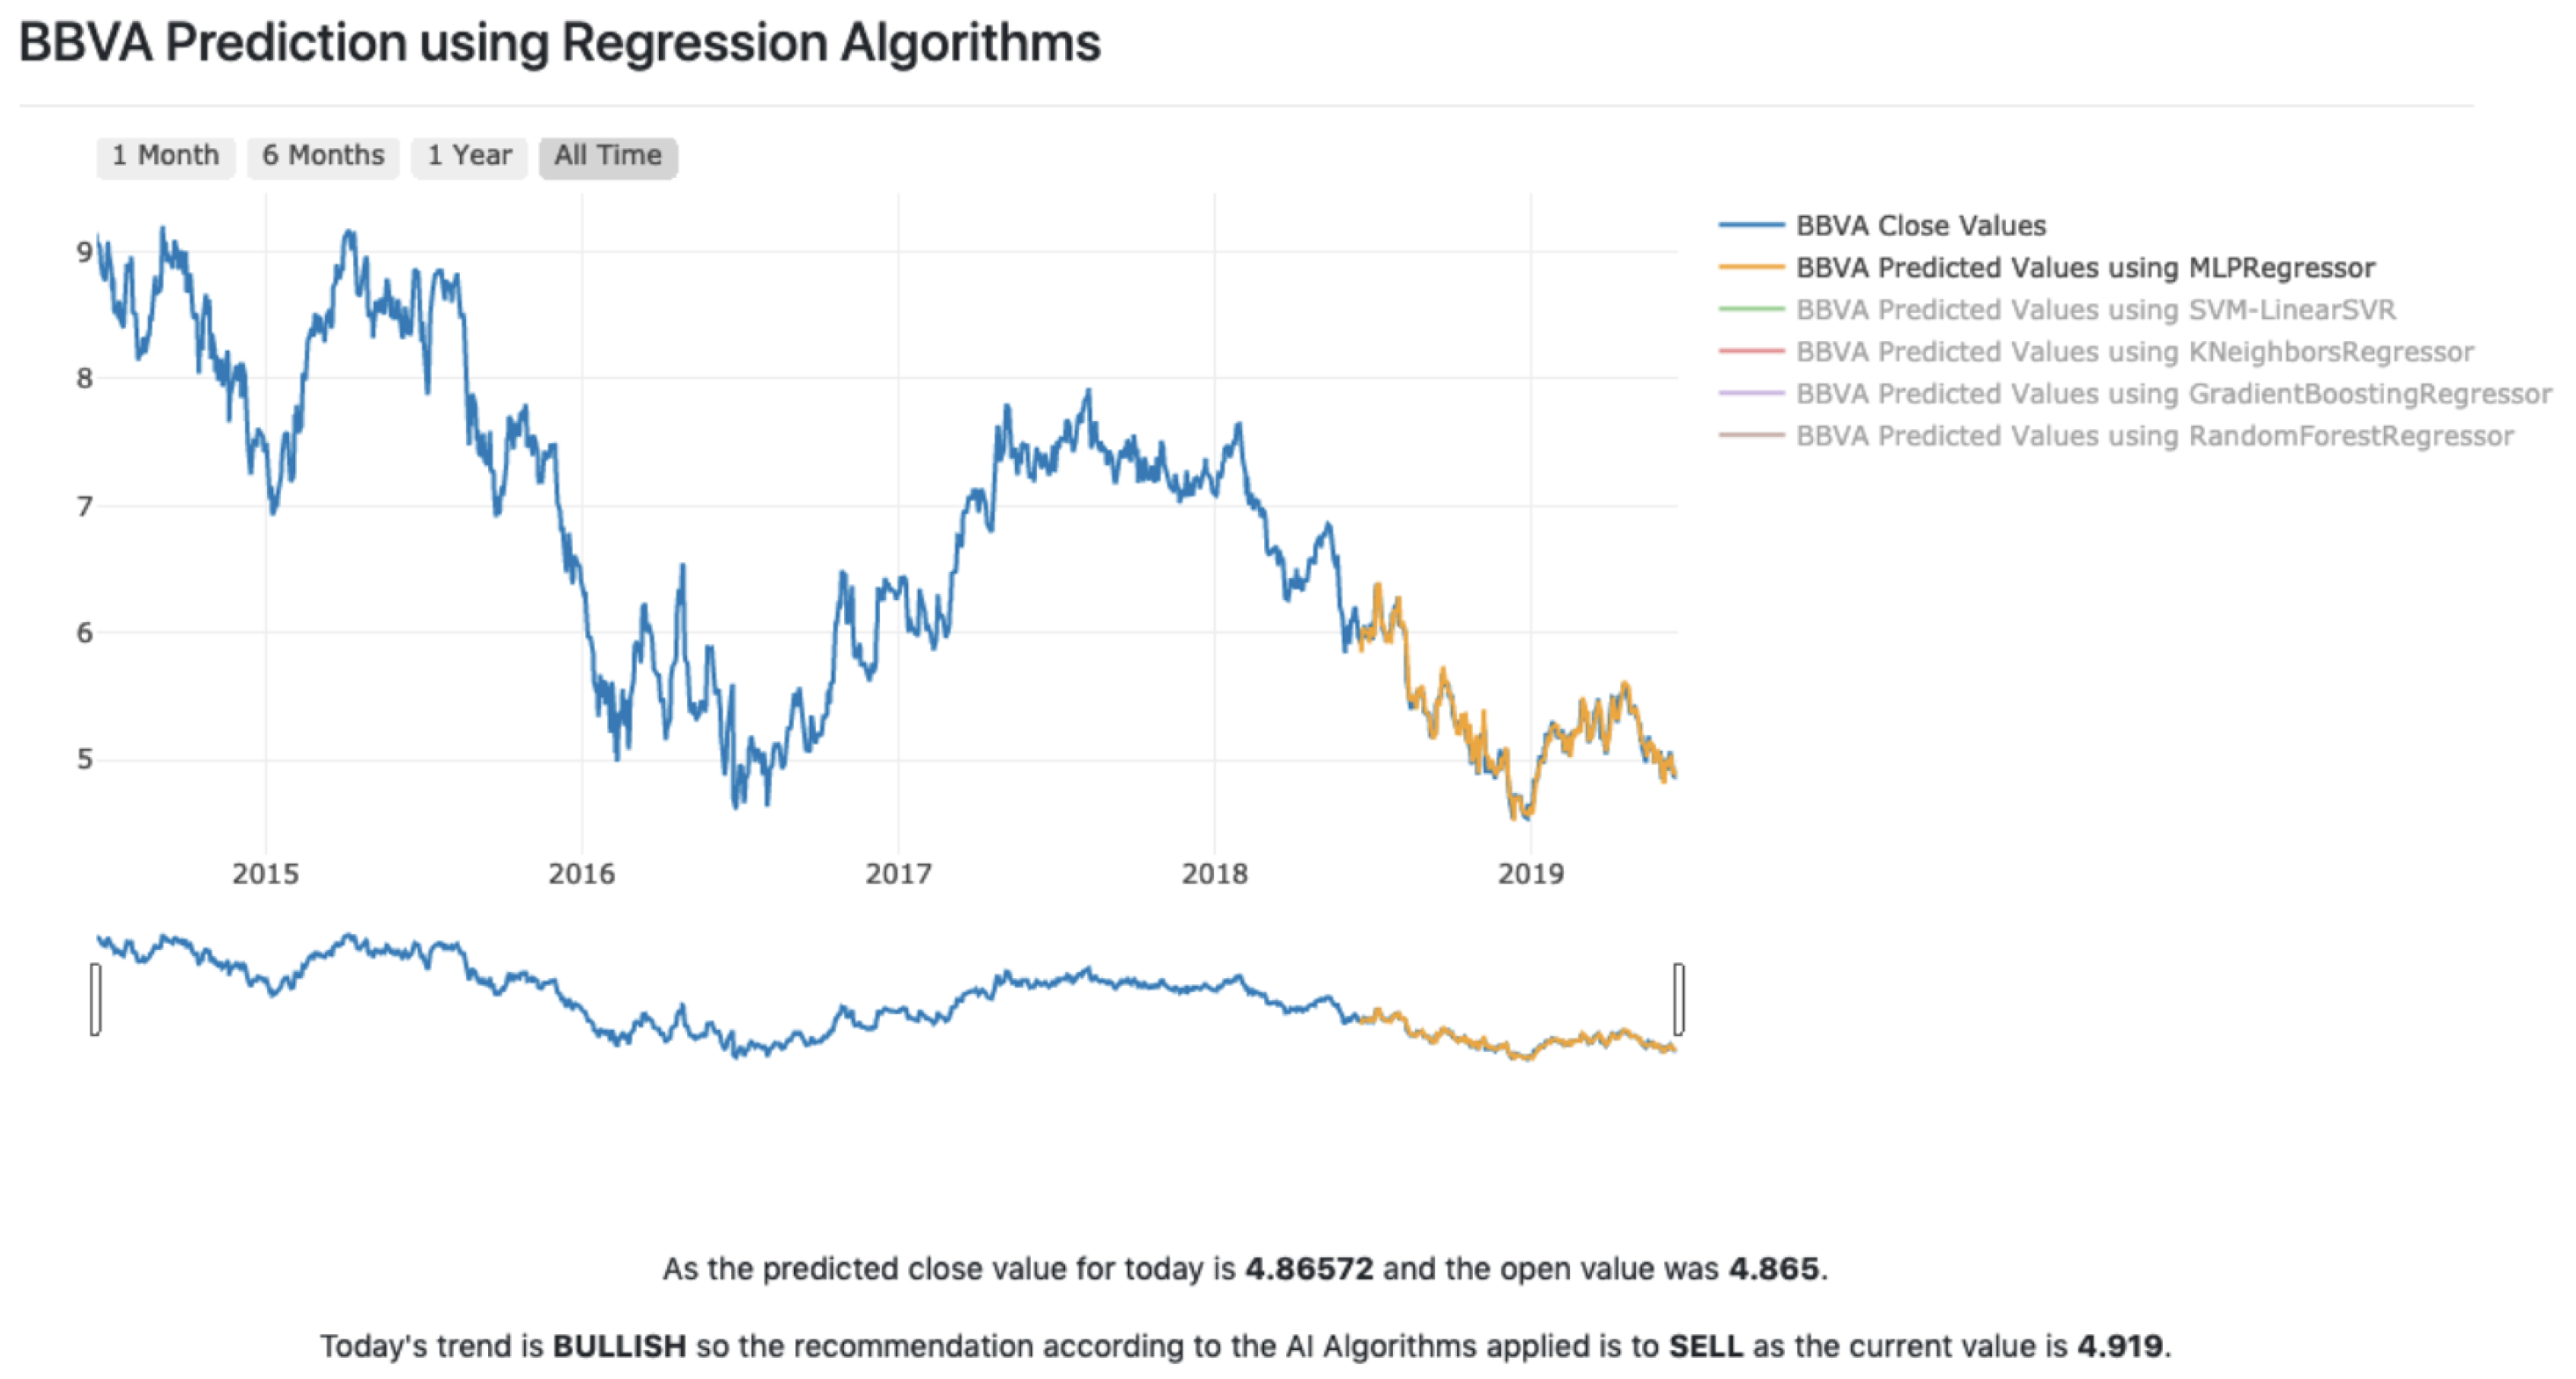
  • The forecasting system. The objective of this system is to predict the closing value of a share in the Spanish continuous market from its opening value on the same day. This minimizes the error of the prediction model as much as possible, which will be presumably based on Machine Learning regression algorithms. The forecasting system will be developed on the basis of the extracted historical data of the shares of the Spanish continuous market companies.
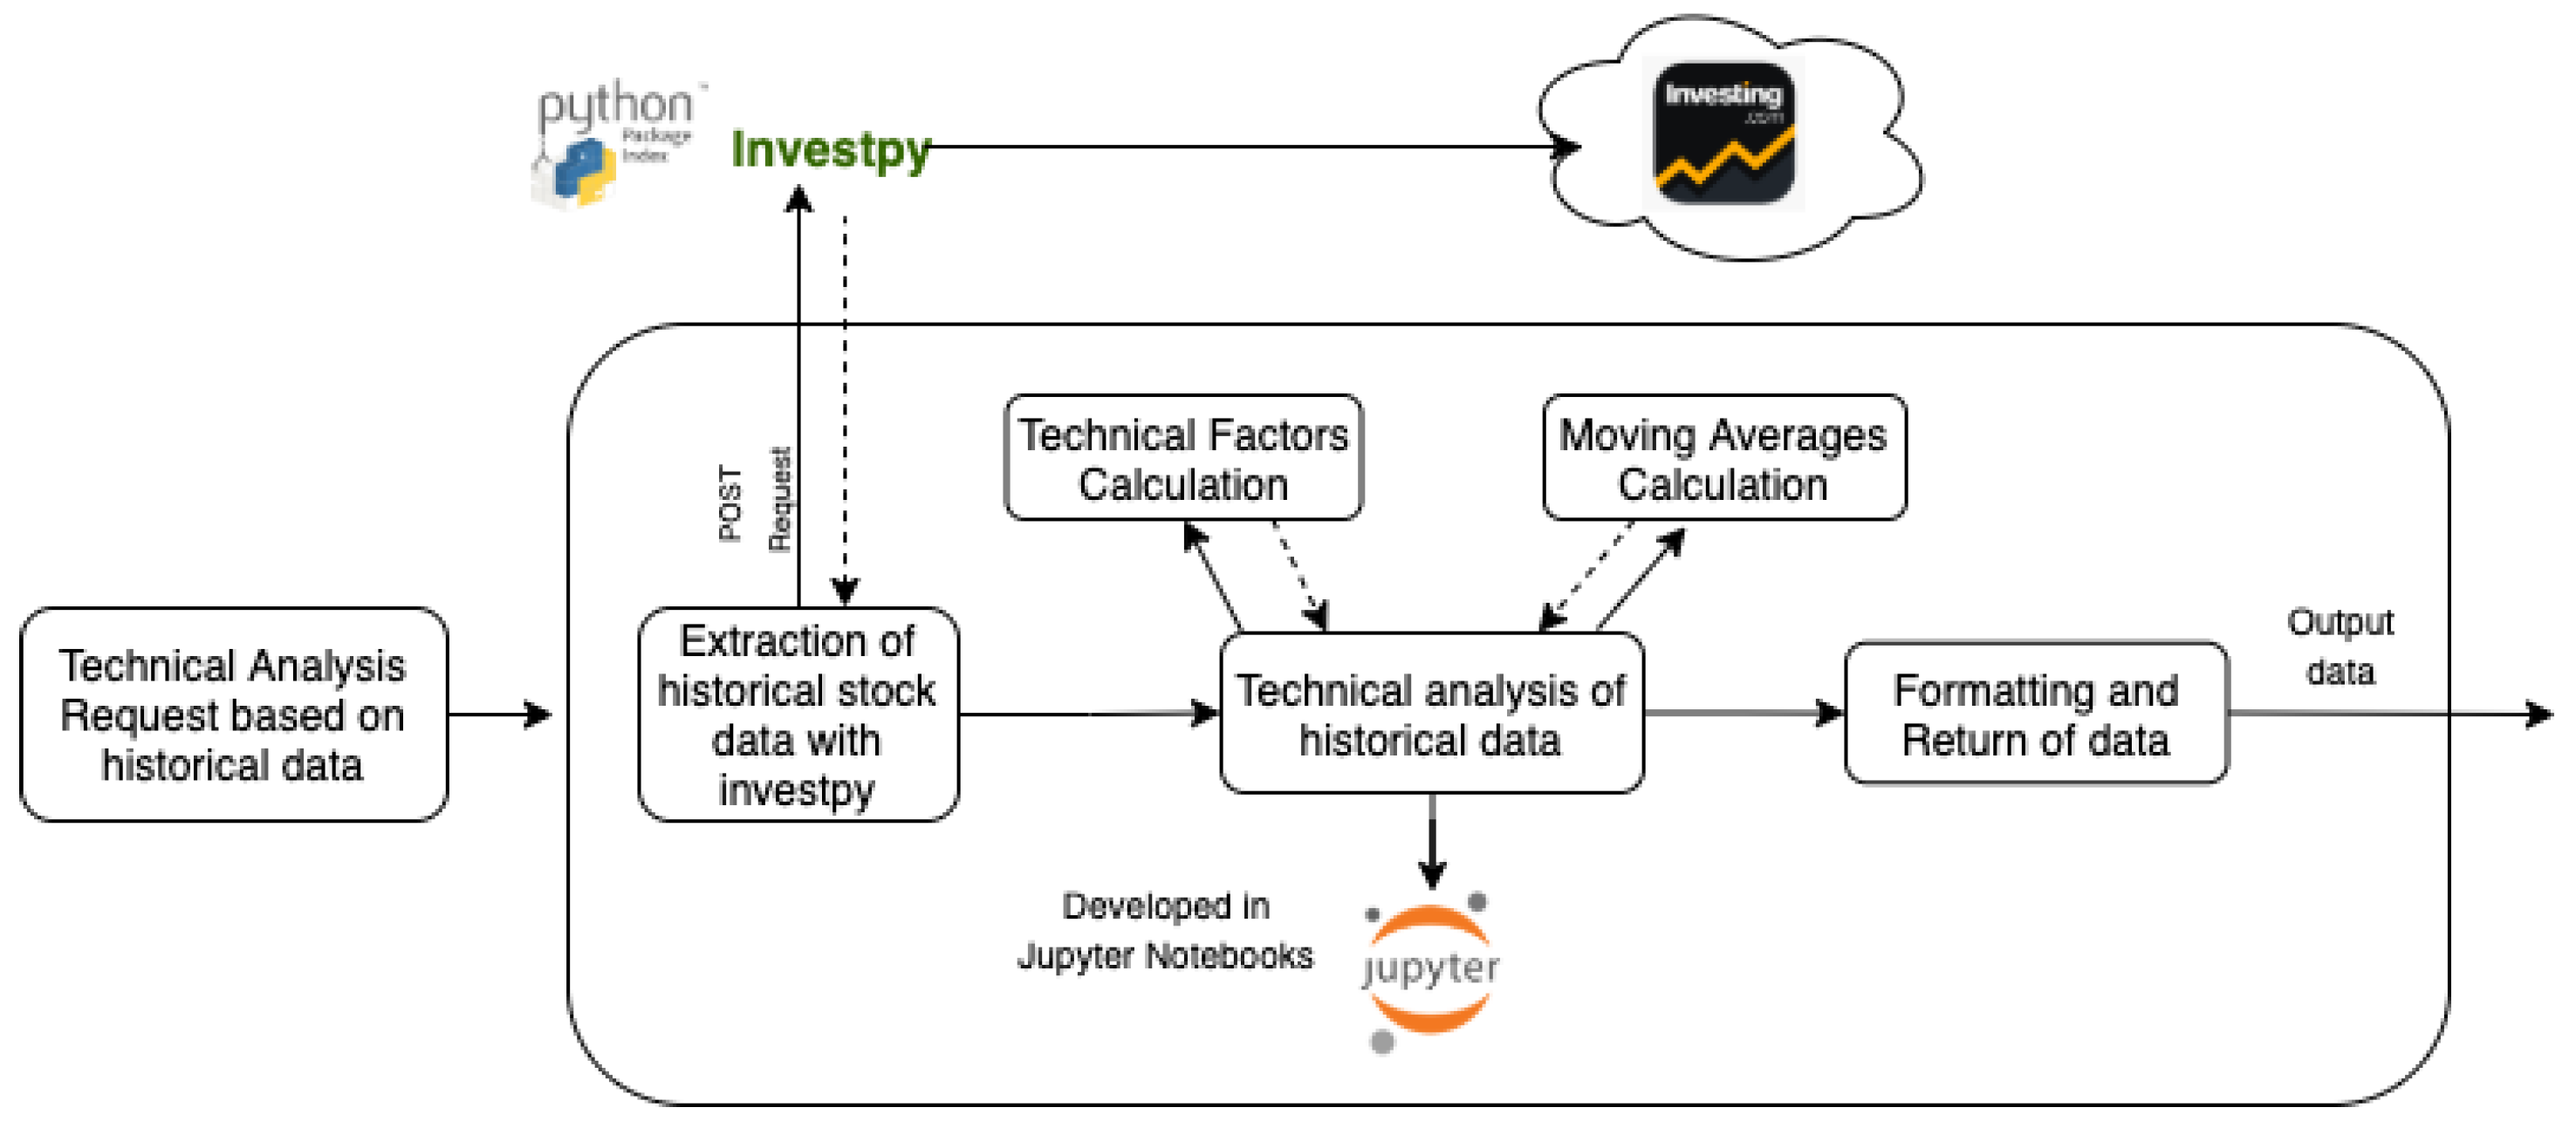
  • The technical analysis. On the basis of the premise that the forecasting system relies on a series of historical market opening values to predict its closing values, the addition of a system that is based on the calculation of technical analysis factors (widely used in economics, specifically in the field of investment) is proposed, in order to combine Artificial Intelligence with the human calculation of technical factors. This brings a distinctive value to the prediction system, which is based on the combination of a series of techniques to determine the recommendation that is to be made to the user.
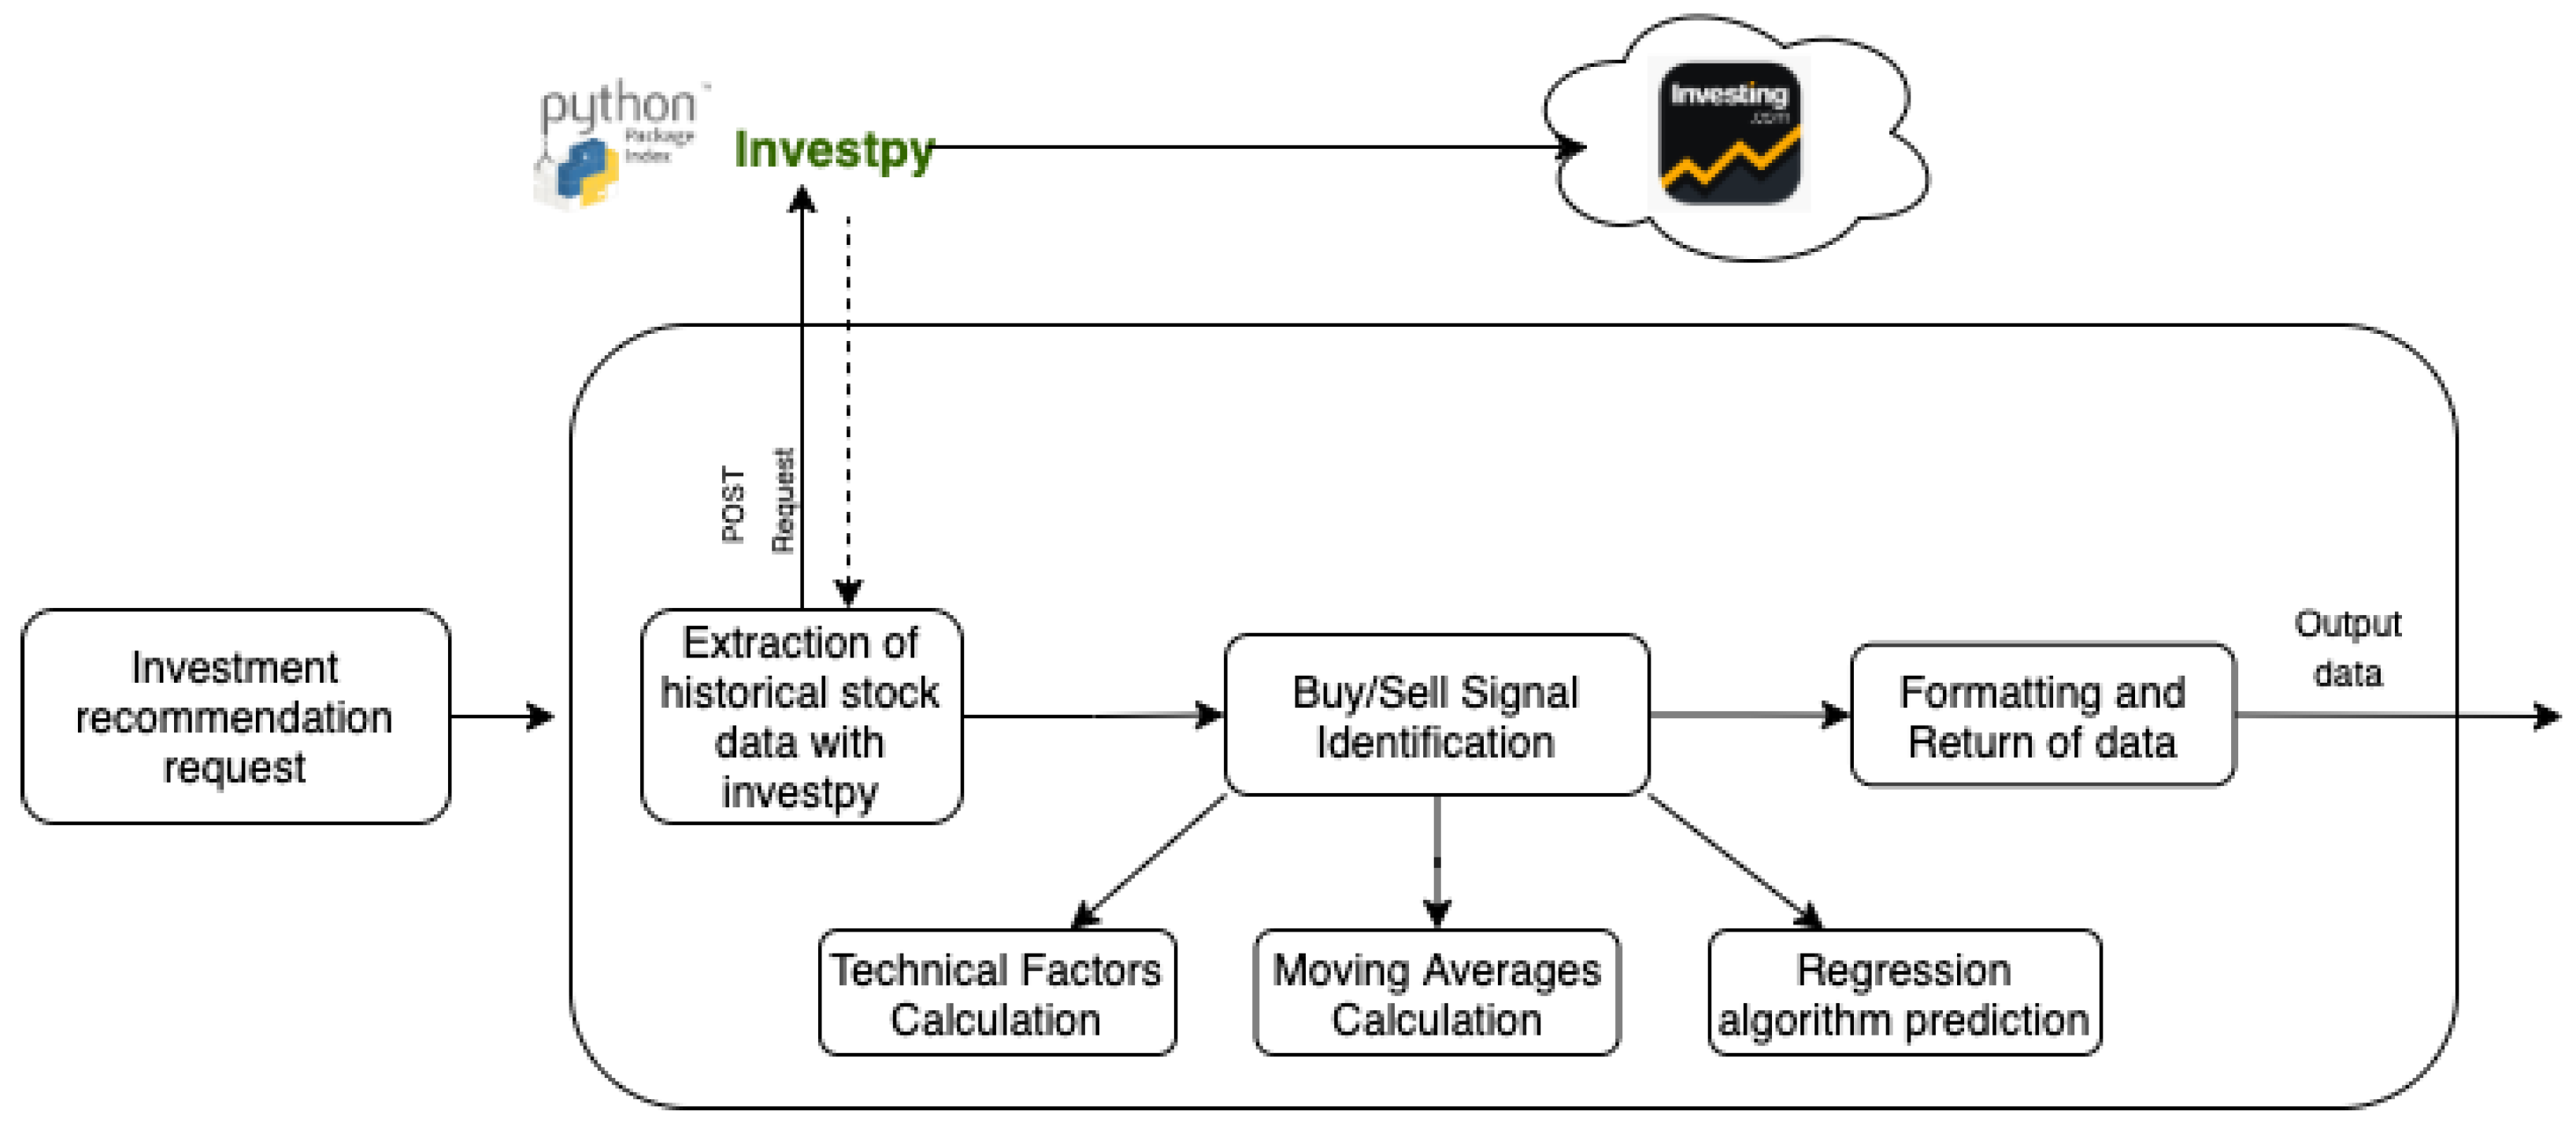
  • The recommendation system. It is proposed to create a recommender system, which, based on the values that result from the aforementioned objectives, is capable of recommending the decision to buy or sell a share in the Spanish continuous market to the user. Therefore, the recommender system is based on calculating the outputs of the rest of the modules and combining them in order to abstract a decision that benefits the user. Thus, the recommendation system is the most crucial and delicate phase of all the modules that make up the platform.
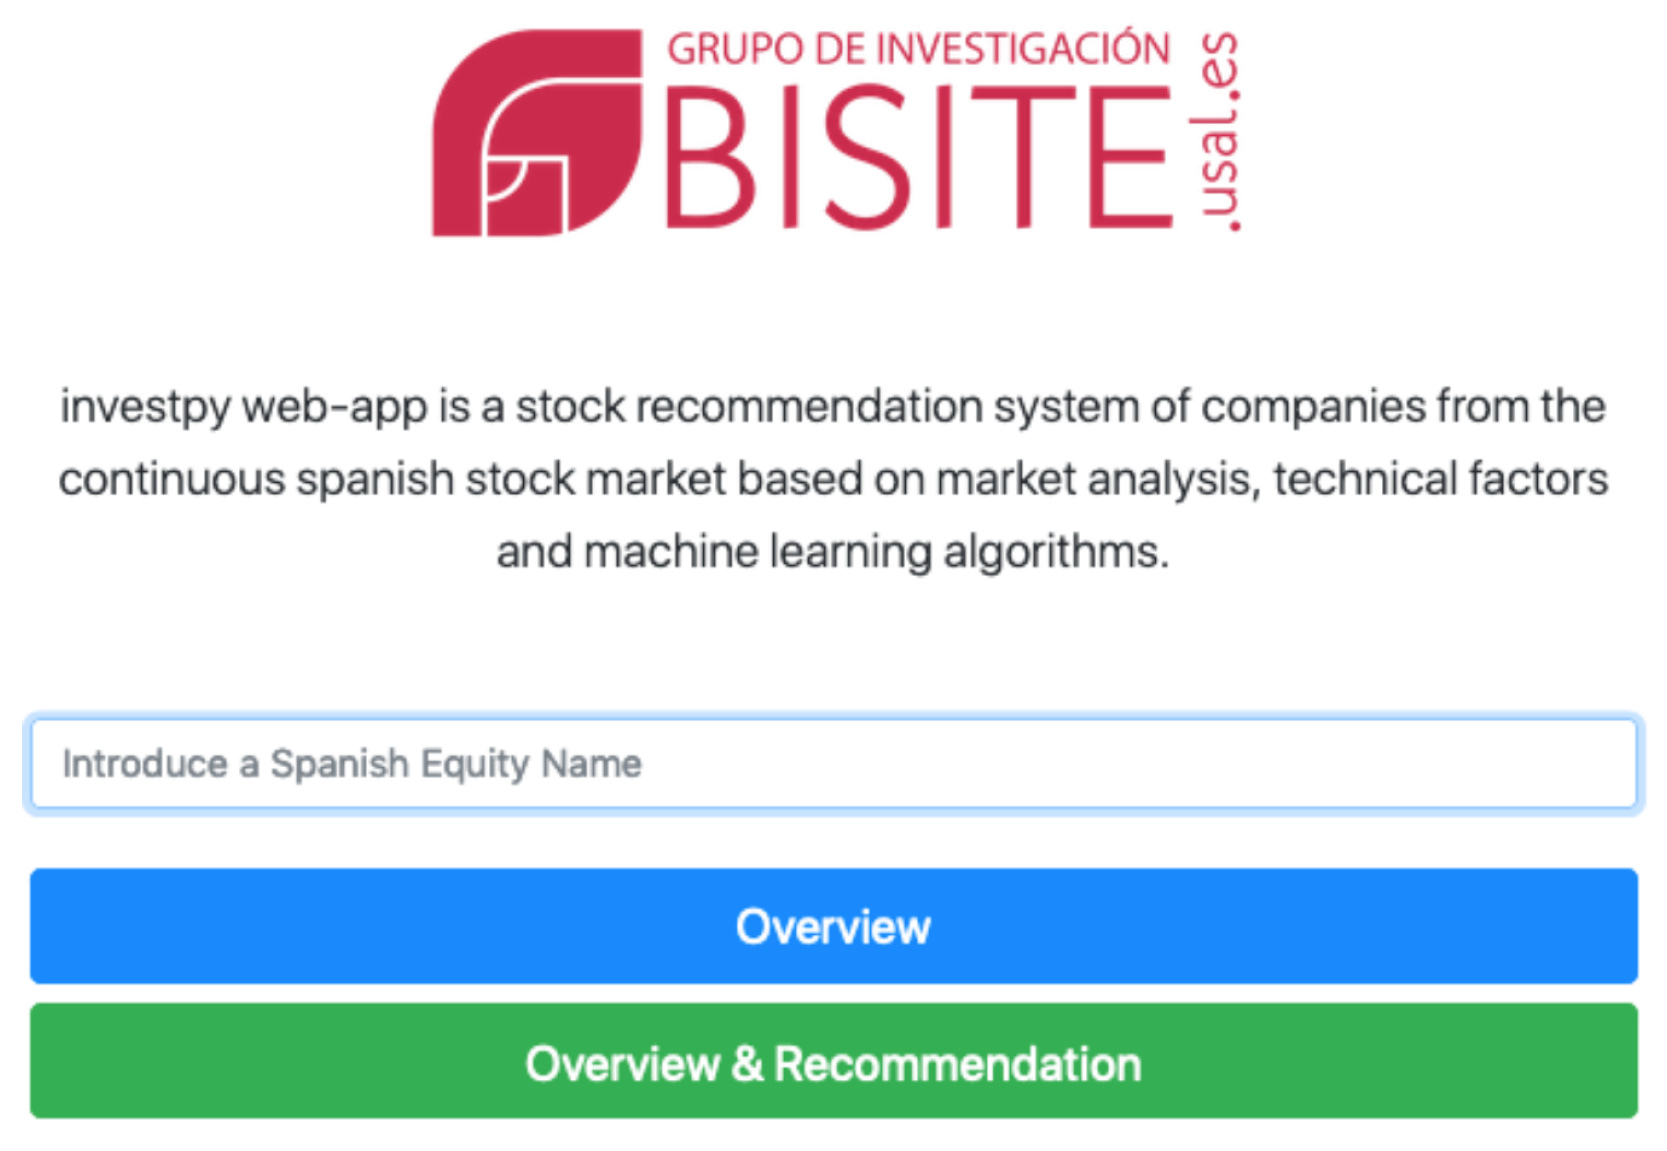
  • The visualization platform. In addition, we propose the creation of a platform that allows for the visualization of the information, recommendations, and predictions for each company in the Spanish continuous market that the end user wishes to consult. The visualization platform graphs the previously made calculations and predictions, so that the end user can consult how the platform operates.
The article is structured, as follows: Section 2 reviews the existing solutions for forecasting stock ratings, Section 3 considers the proposed system, including the data mining and analysis modules, the prediction system, the technical analysis, and the recommendation system. Section 4 outlines the results of the whole research process. Section 5 covers the discussion and the obtained results, as well as future research.

2. State of the Art

Throughout this section, the main contributions made in the field of stock prediction will be reviewed. The review begins with the study by Atsalakis, G.S. et al. in [1] who focused their study on stock forecasting through soft computing techniques. After classifying and processing the sample and applying the type of technique to the fuzzy set, the authors concluded that ANNs (Artificial Neural Networks) and neuro fuzzy models were valid for predicting stock market values. It should be noted that, despite being an exhaustive analysis, their research may be outdated as it was published in the period from 1992 to 2006. Another research that establishes ANNs as the best performing machine learning technique for stock market prediction is the research by Soni, S., in [4]. In the research it is compiled various studies applying machine learning and artificial intelligence techniques.
Beyond the research that proposes ANN as a method for stock prediction, during the review of the state of the art it was observed research that highlighted the need for historical stock market data after reviewing various machine learning techniques for stock prediction [5]. In [3] it was also highlighted that predicting stock market values is challenging due to the lack of certainty, perhaps in relation to the conclusions already drawn in the article discussed above. The authors attribute the lack of certainty to the unpredictability of a changing environment and provided a mixed approach that uses both machine learning algorithms and fundamental and technical analysis.
The research discussed above was the first mixed approach that was identified during the review of the state of the art. Once in this line and seeing that it was perhaps the starting point for the research proposed here, the research of [6] was found. On this occasion, the use of various techniques was focused on integrating collaborative and content-based filtering techniques, where the optimal investment recommendation was given by the investor’s preferences, trends, macroeconomic factors, etc. To conclude the review, the research conducted in [7] where a mixed approach is also presented, is analysed. The research concerns the use of a decision tree of technical indicators optimised by GA-SVM. The result is a recommender system capable of detecting stock price fluctuations and suggesting a decision to the investor.
Table 1 summarises the contributions considered in this research.

3. Proposed Model

Once the state of the art has been reviewed, throughout this section the proposal is presented, more specifically the software architecture that results in the forecasting system. Specifically, the following modules are described and analyzed: data extraction package, data analysis package, forecasting system module, technical analysis module, recommender system package and the visualization platform.are described.

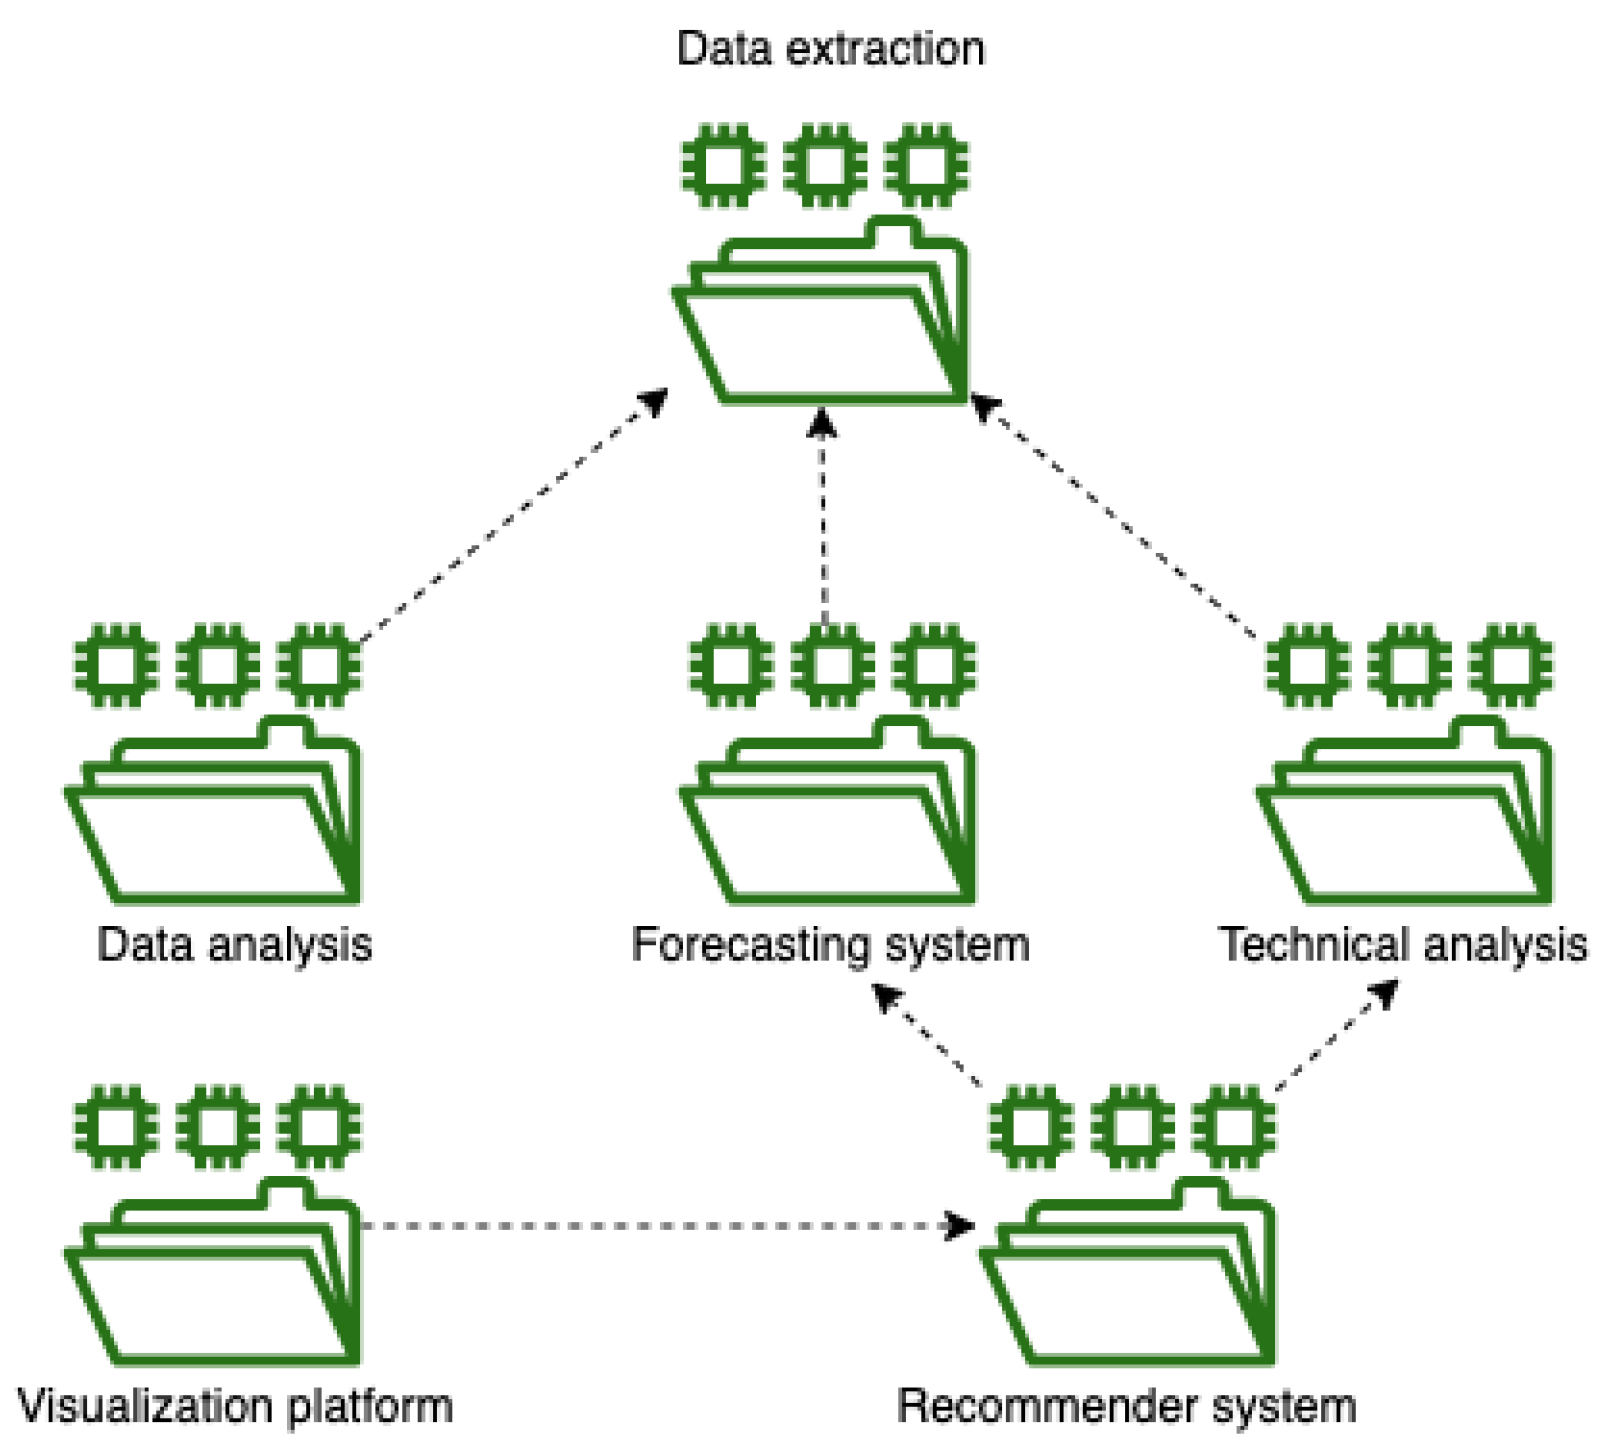
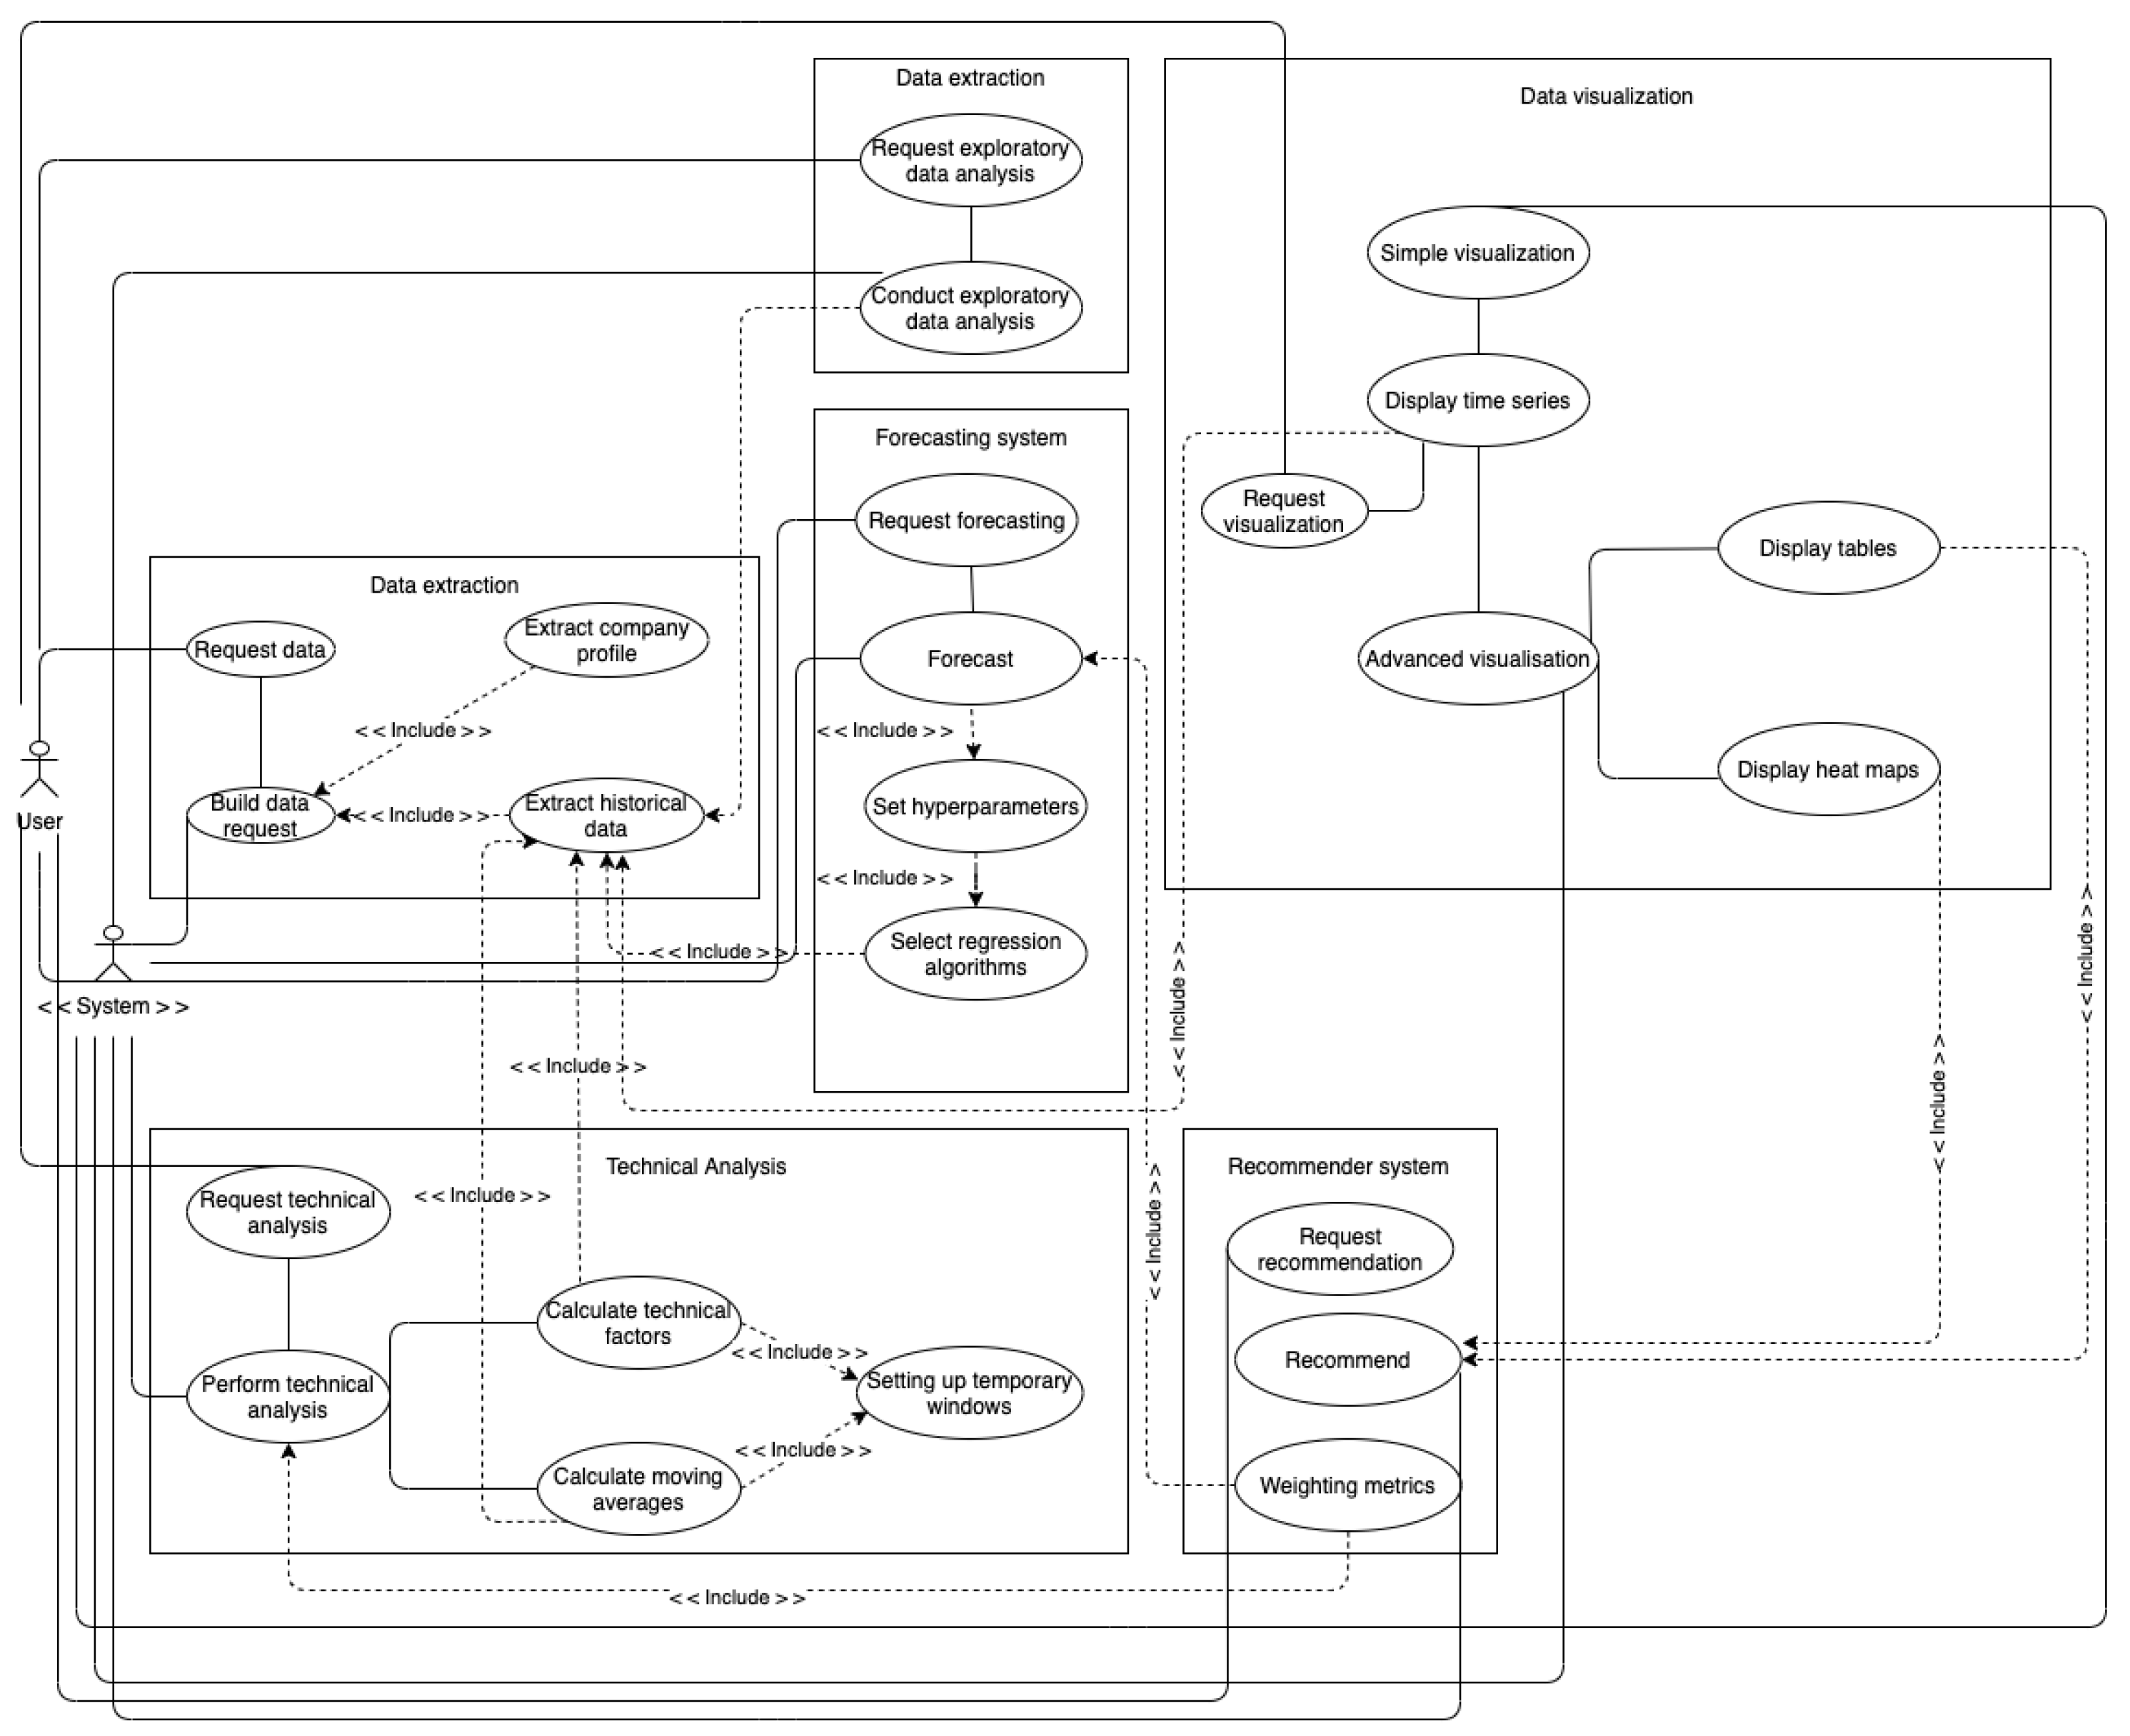
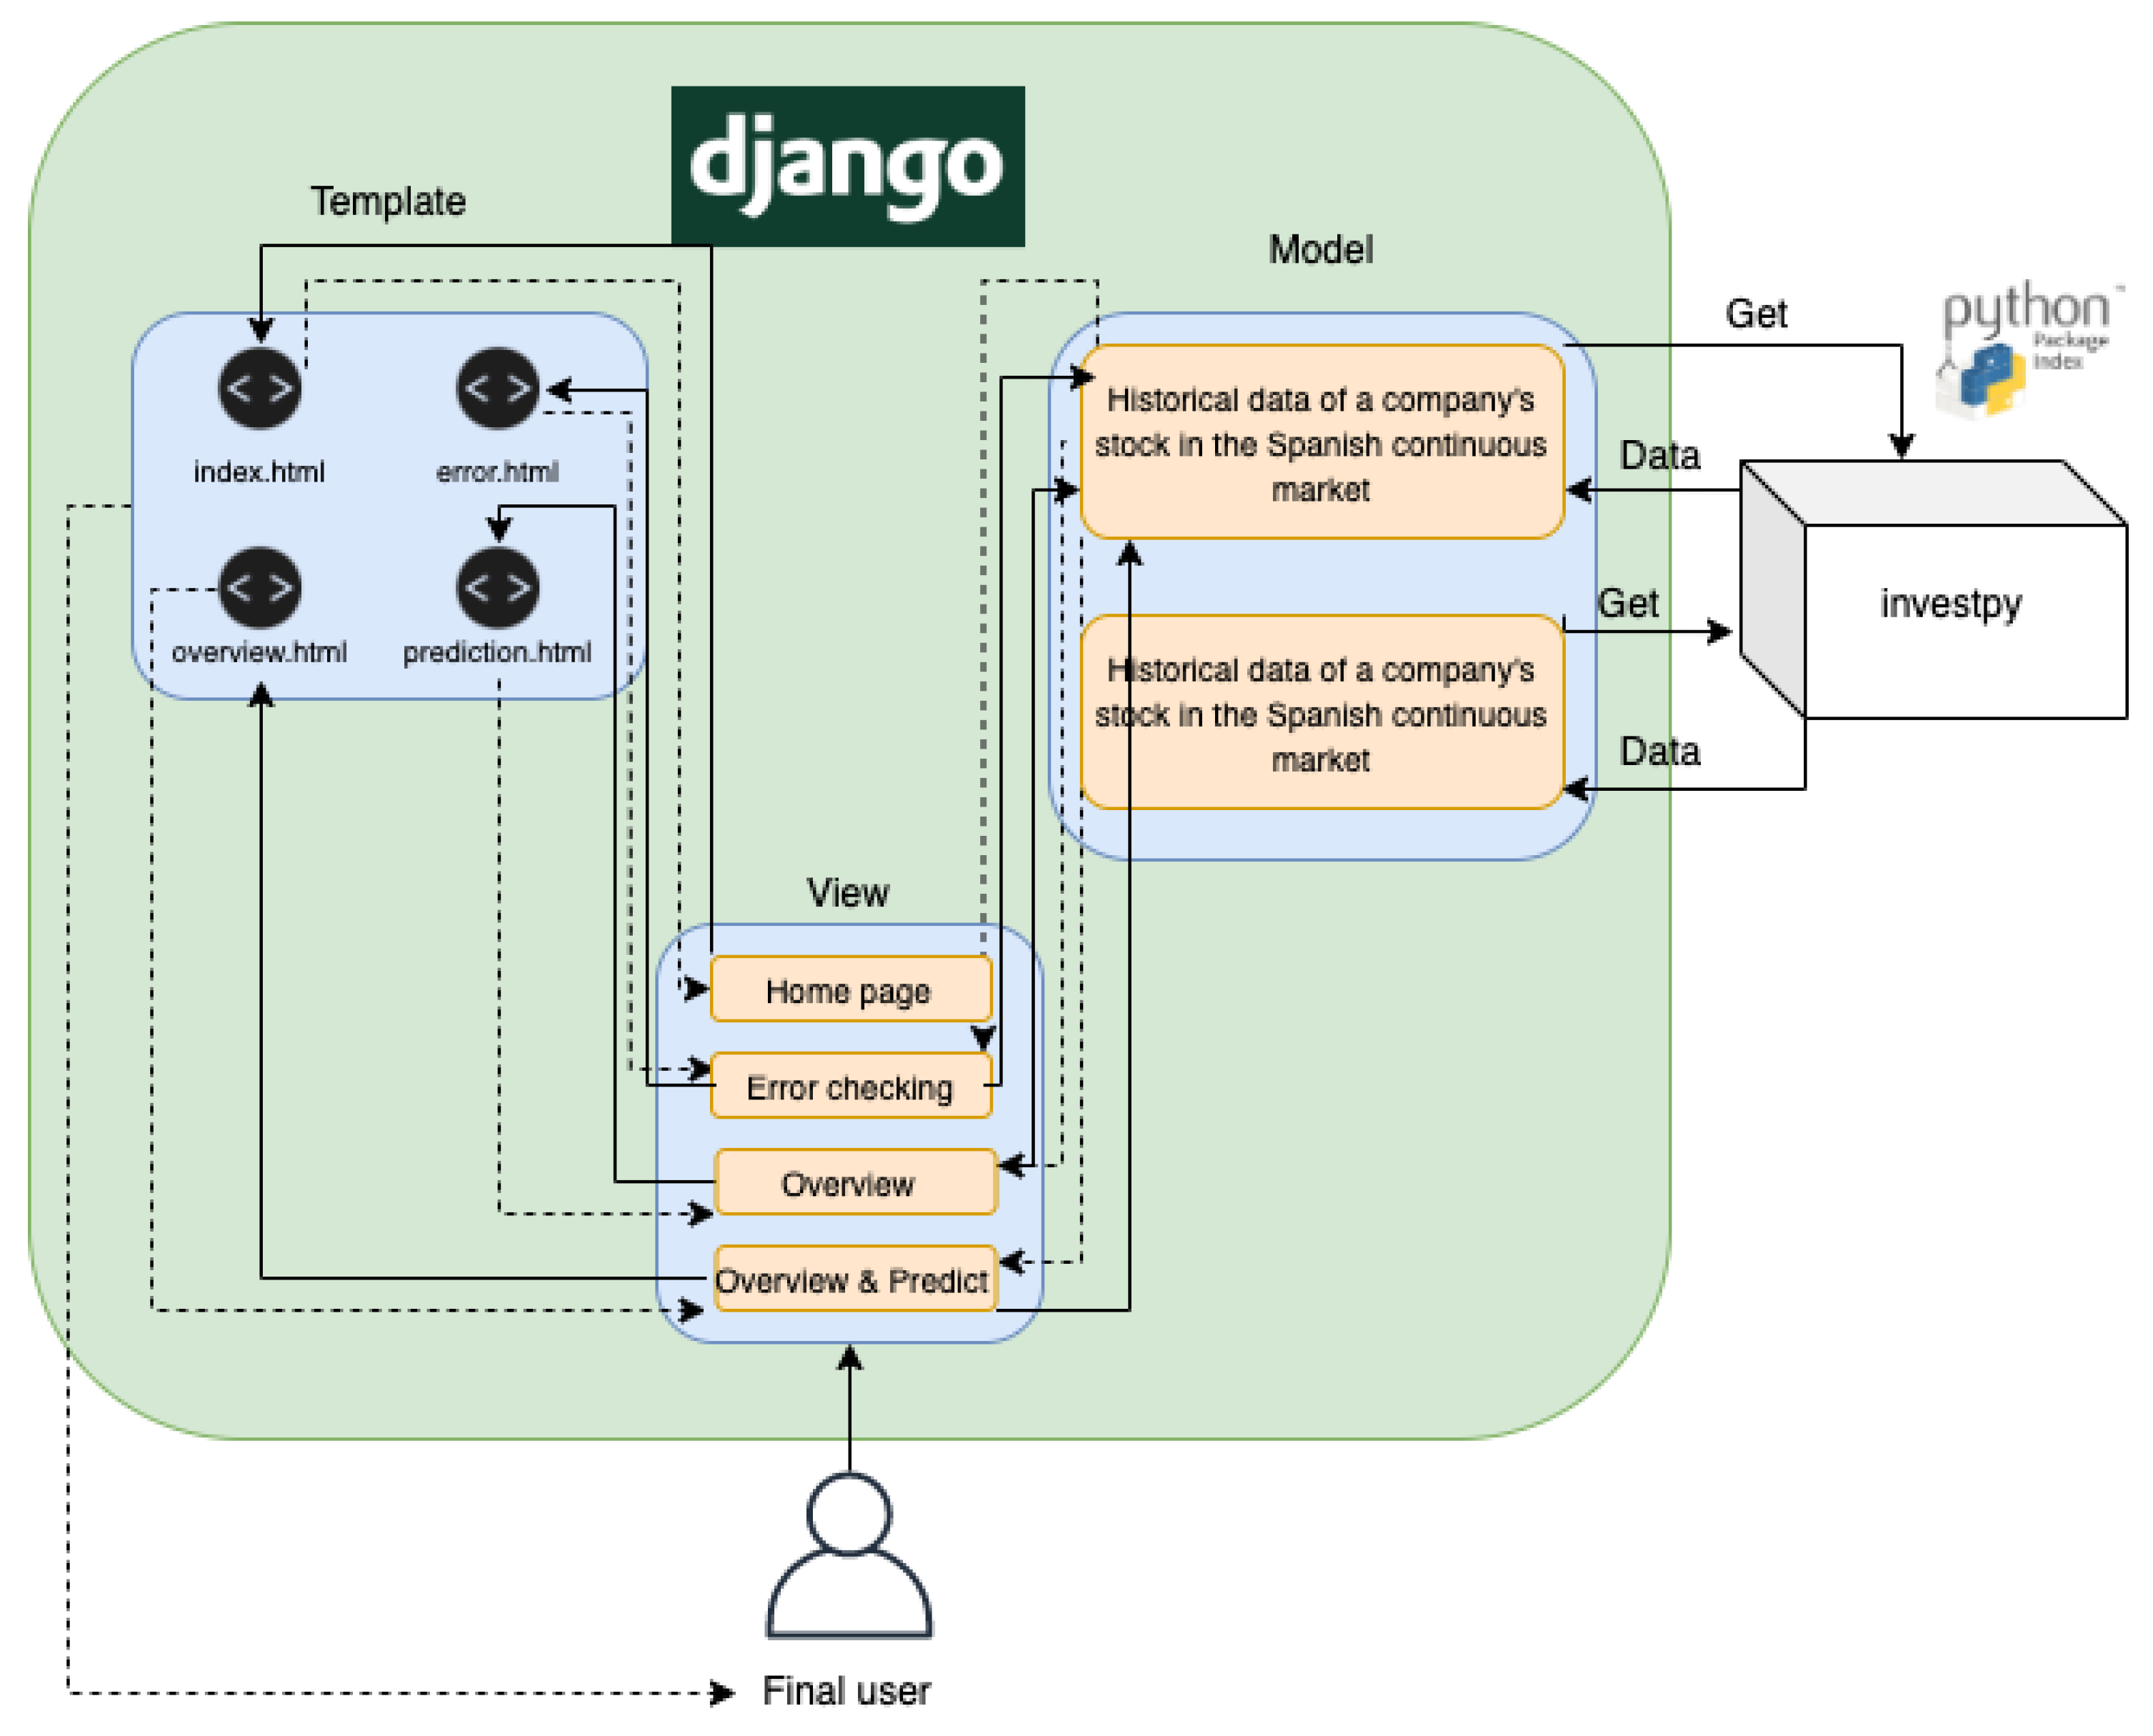
3.1. Software Architecture

This subsection presents the design specification of all the packages that form the software system and how they communicate and interrelate with each other. Figure 1 shows the dependencies between the packages that make up the proposed model, thus showing the different modules that make up the system and, consequently, the interrelationships and dependencies between them.
Figure 2 shows the relationships between the use cases and the relationship between the different actors (user and system) and the resulting system. This is intended to provide a clearer and more exemplified understanding of the design specification of each and every one of the modules.

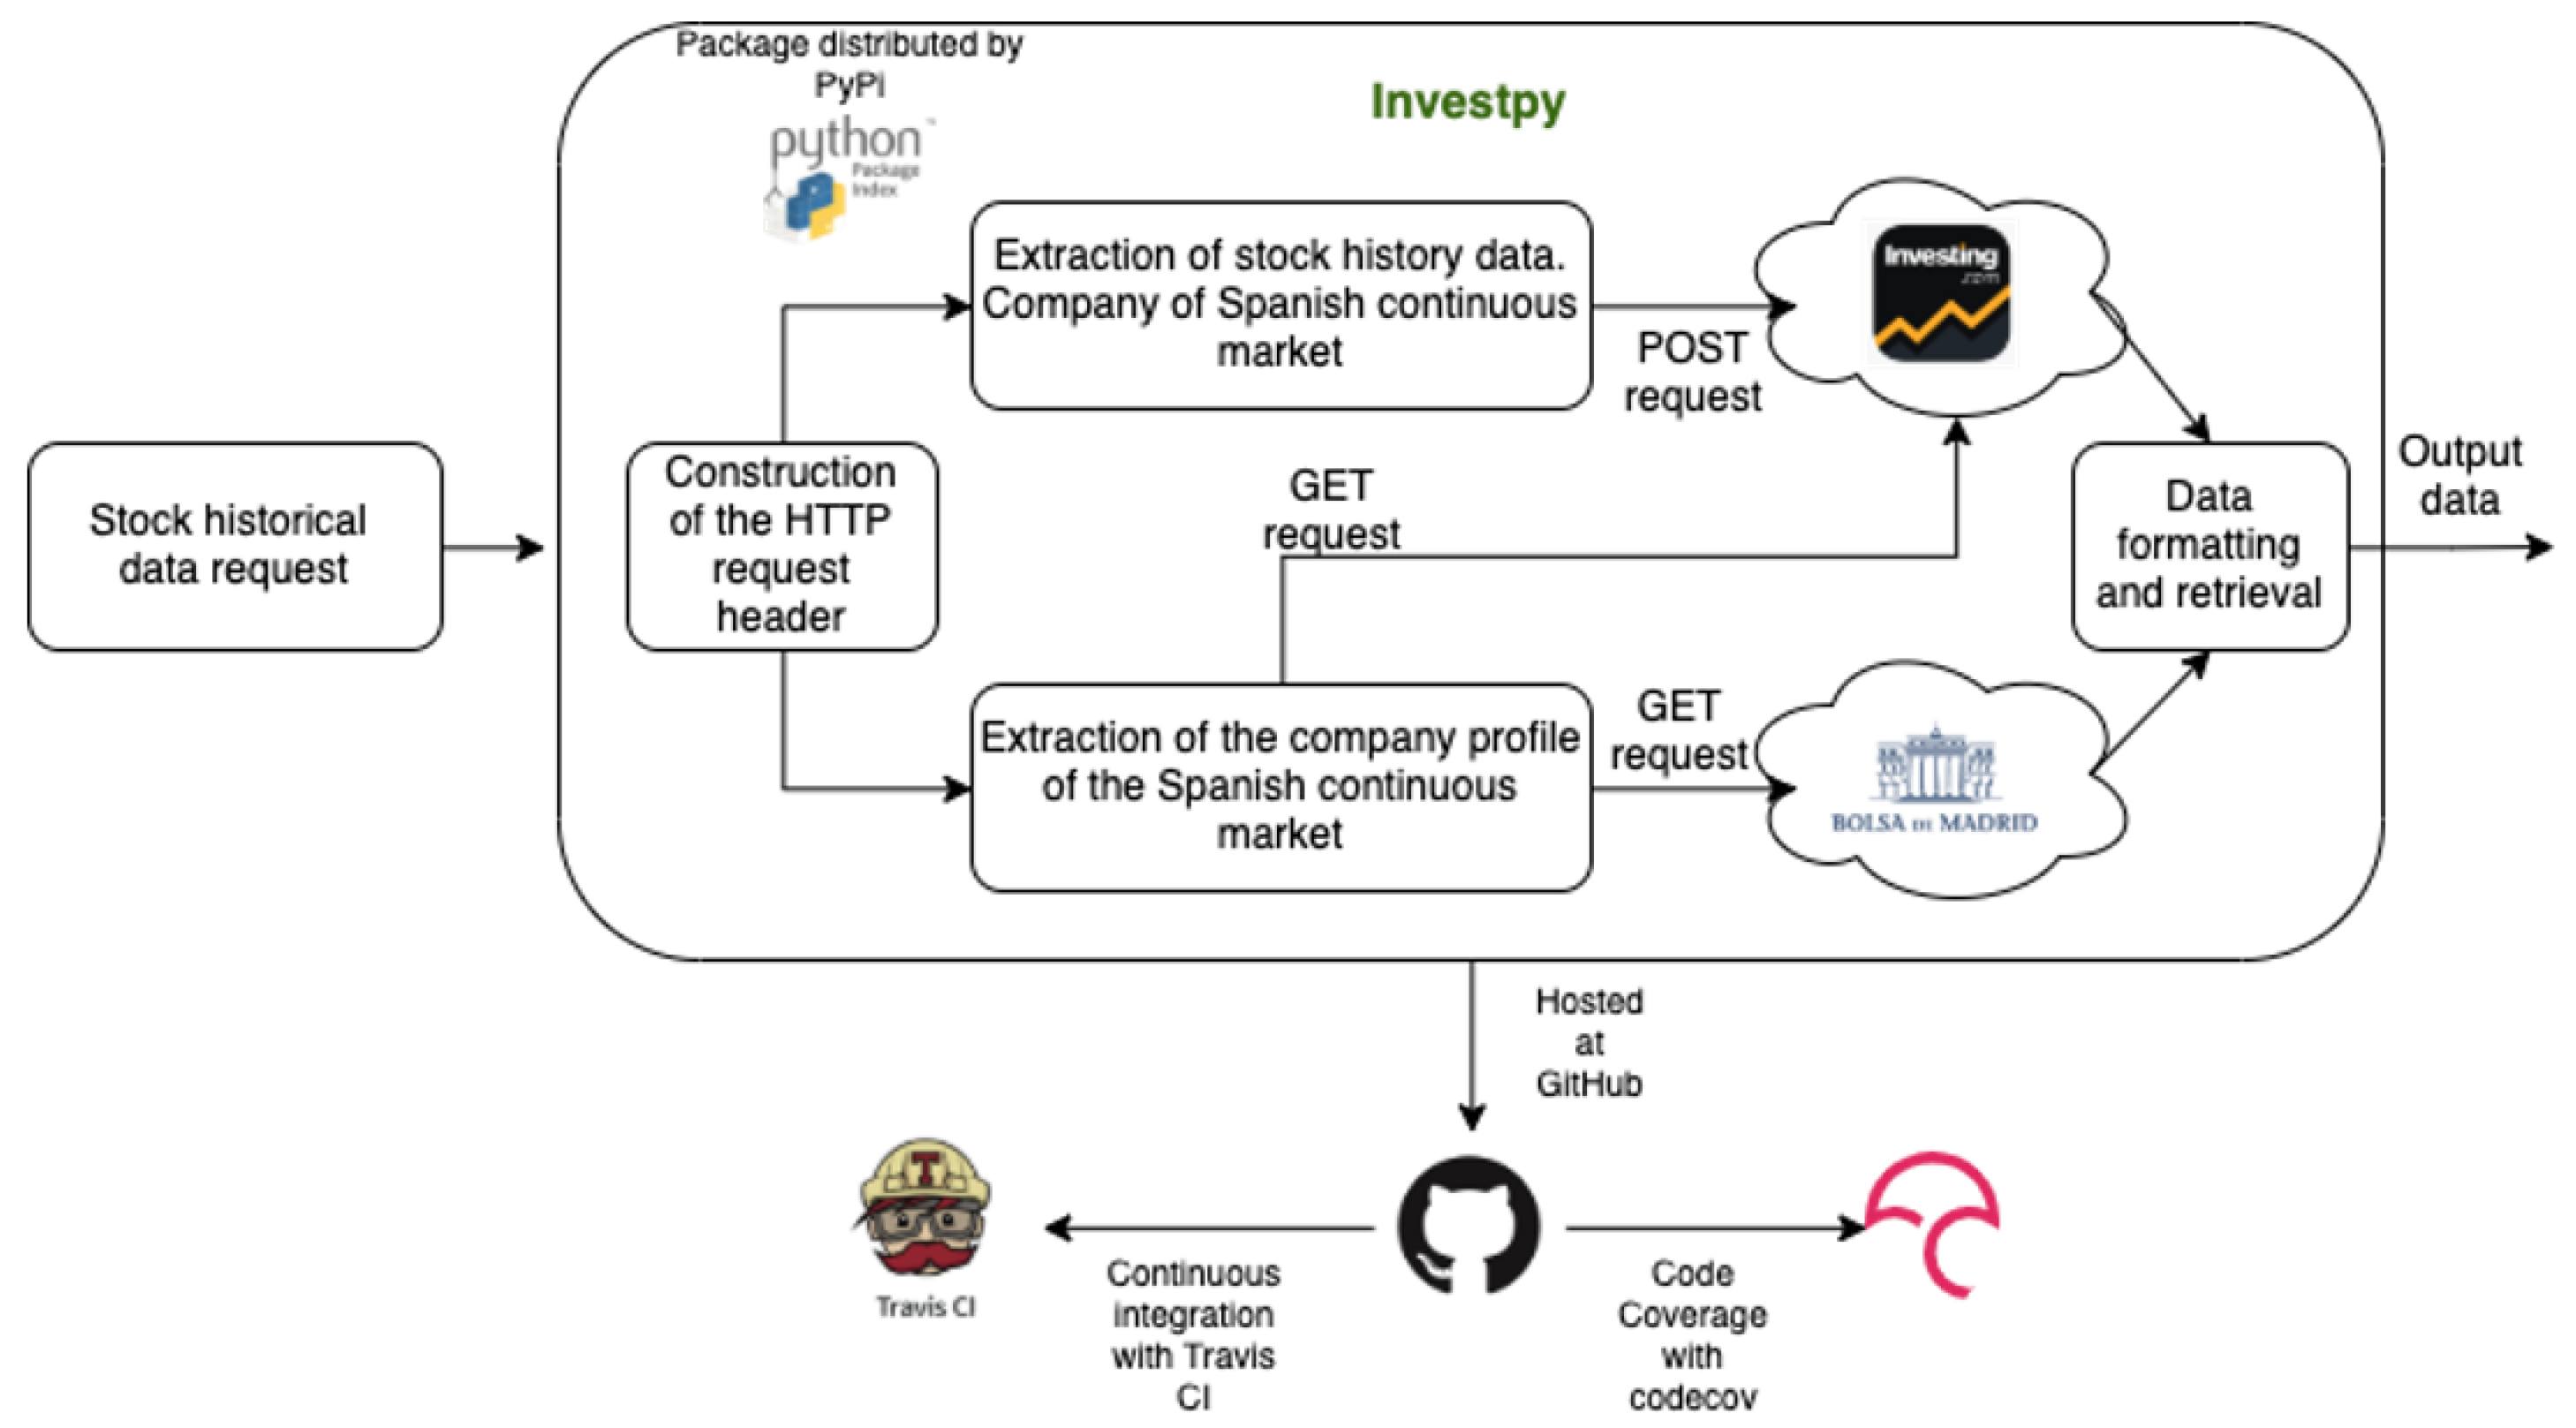
3.1.1. Data Extraction Package

The data extraction module works as follows: first, a user request is received through an API (Application Programming Interface) endpoint or through a request to a method in the package developed in Python for versions 3.x. Secondly, if the system has received that request, it will include in the header the name of the company and the date range (if the historical data has been requested) or it will only extract the name of the company (if the historical data has not been requested).
Figure 3, shows the Python package that has been created for data extraction from Investing.com (after prior authorisation from the company on 28 January 2019). It supports different versions and has been loaded into PyPI (Python Package Indexer). The second significant aspect is continuous integration. The package is monitored, also, unit tests and code coverage are checked (this functionality determines the number of lines of code, identifying unusable lines of code) through Travis CI. In addition, the developed Python package supports more banking products such as funds or ETFs (Exchange Traded Funds), enabling the future implementation of additional functionalities in the platform.
Once the HTML DOM Tree structure has been analyzed to determine which elements of the HTML are to be retrieved and how they can be identified, the development of the Web Scraper begins. Two main steps have been taken:
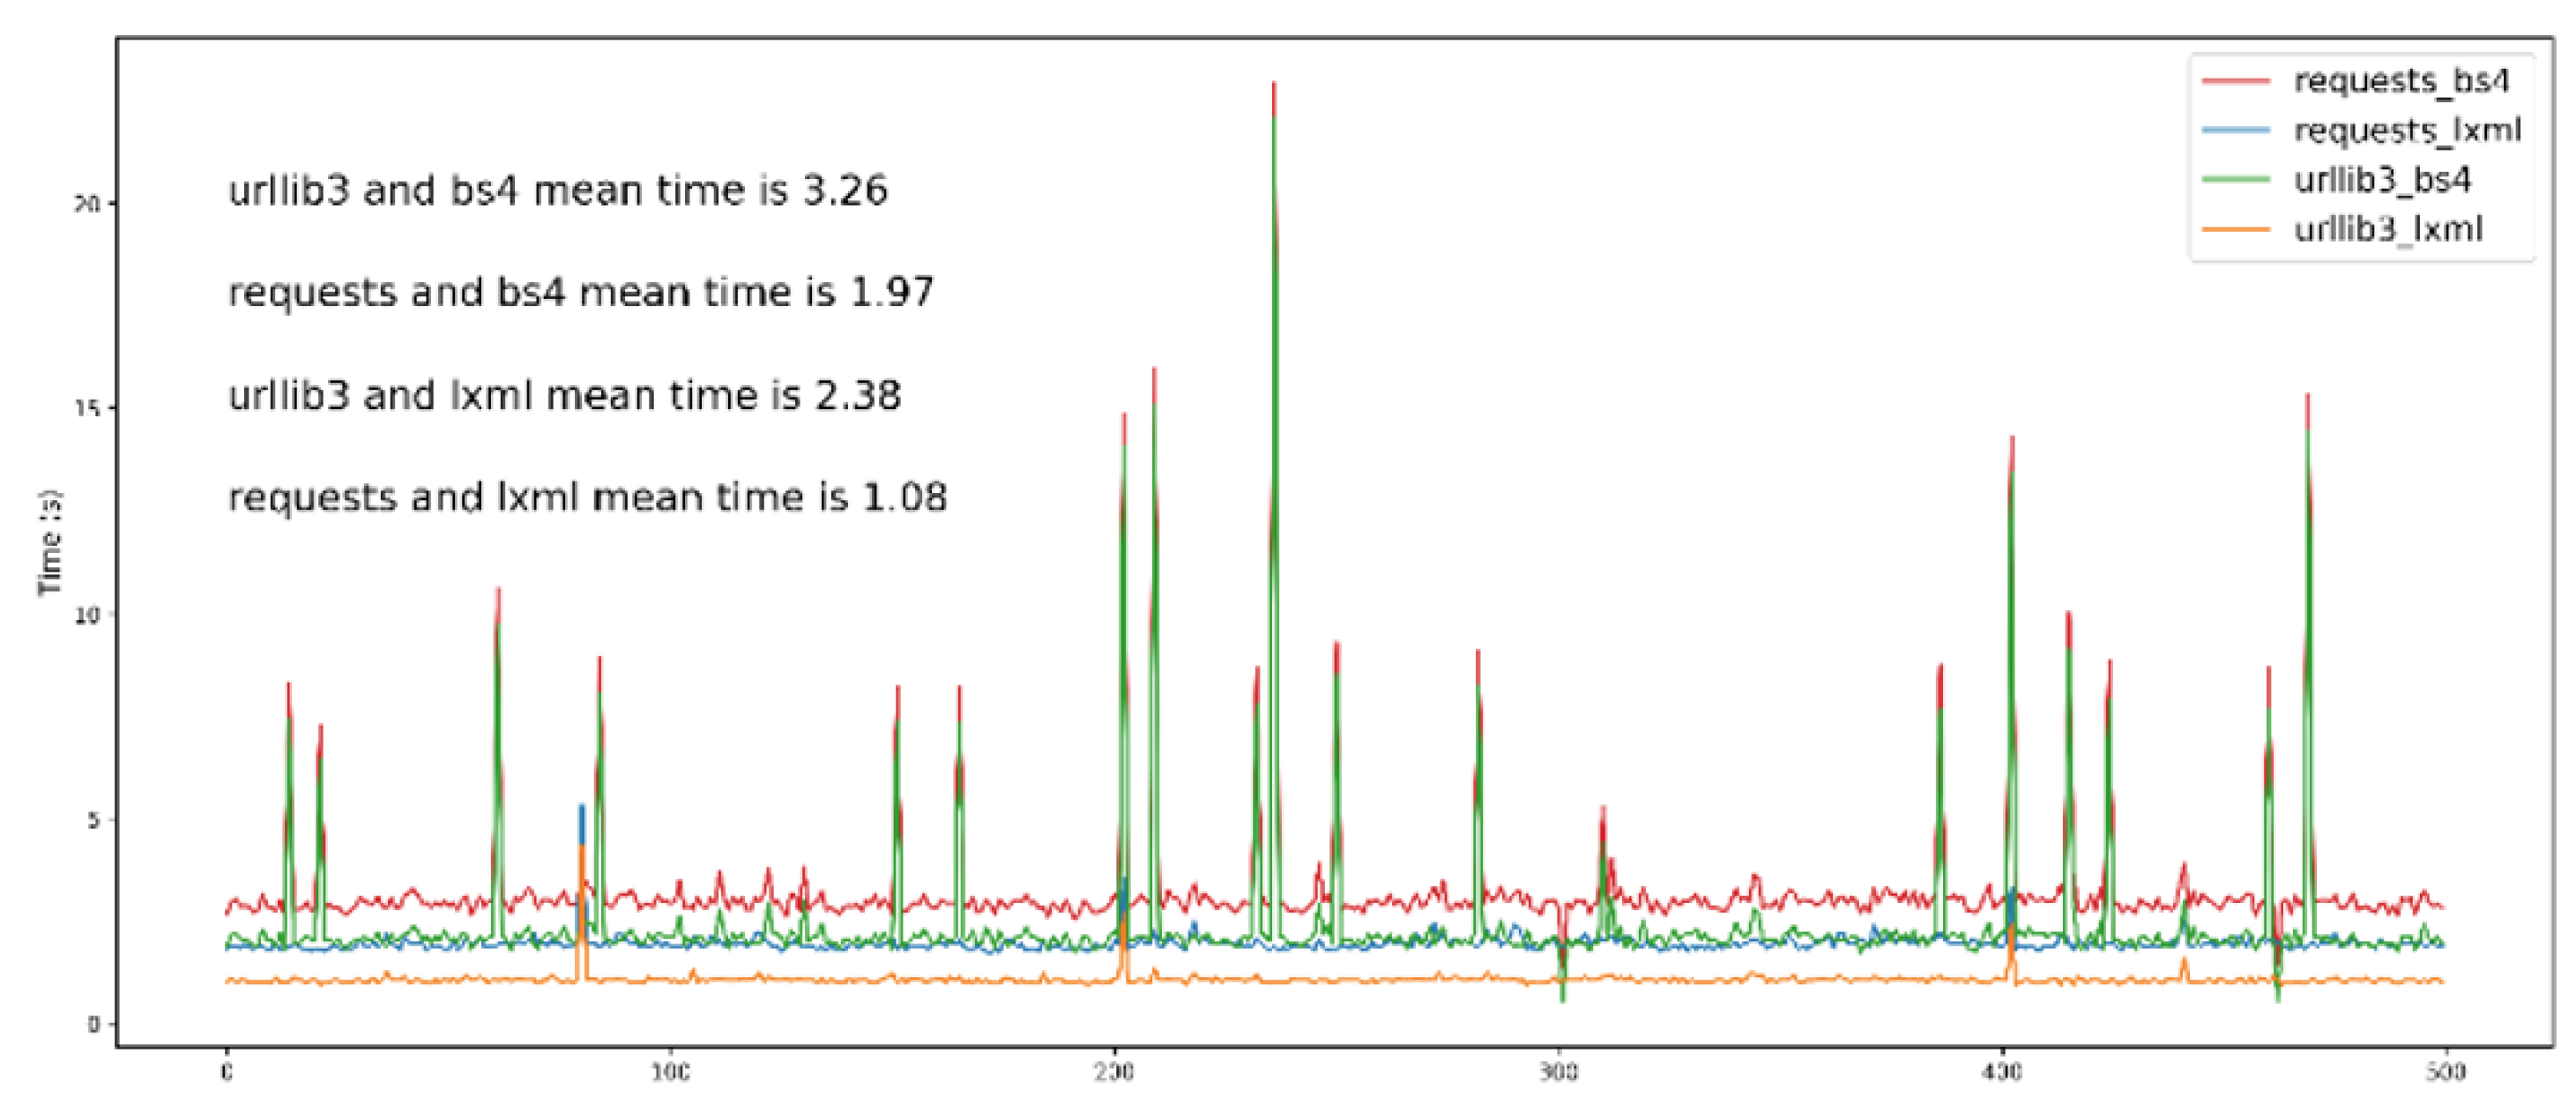
  • Web request: The HTML of the web have been retrieved and also requests of GET or POST type have been made; principally, urllib314 and requests15.
  • HTML parsing: consisted in recovering and formatting the data from the previously retrieved HTML. To parse and obtain the information from the HTML, two Python utilities have been employed, beautifulsoup416 and lxml17.
Figure 4 shows the graphic representation of the combination of possible Python package times for each of the different phases that are involved in Web Scraping. The combinations are shown in best to worst scaling, as follows: request-lxml, request-bs4, urllib3-lxml and urllib3-bs4. Therefore, to send the request to Investing.com and extract the HTML, either GET or POST type requests are optimal, while lxml is optimal for historical data extraction and parsing.
Finally, the resulting scripts give form to an extensible and open Python package, called investpy [8], intended for data extraction from investing.com. The package facilitates the extraction of data from various financial products, such as: stocks, funds, government bonds, ETFs, certificates, commodities, etc.

3.1.2. Data Analysis Package

Once the historical data for a stock has been extracted, the analysis of the data can be undertaken. All of the packages depend directly or indirectly on the data extraction package, as shown in Figure 1.
Exploratory data analysis is the set of graphical and descriptive tools used for the discovery of data behavior patterns and the establishment of hypotheses with as little structure as possible. Throughout this subsection, the design for the study of the structure of the data and the relationship between them is shown. A representation of how this module operates can be seen in Figure 5.

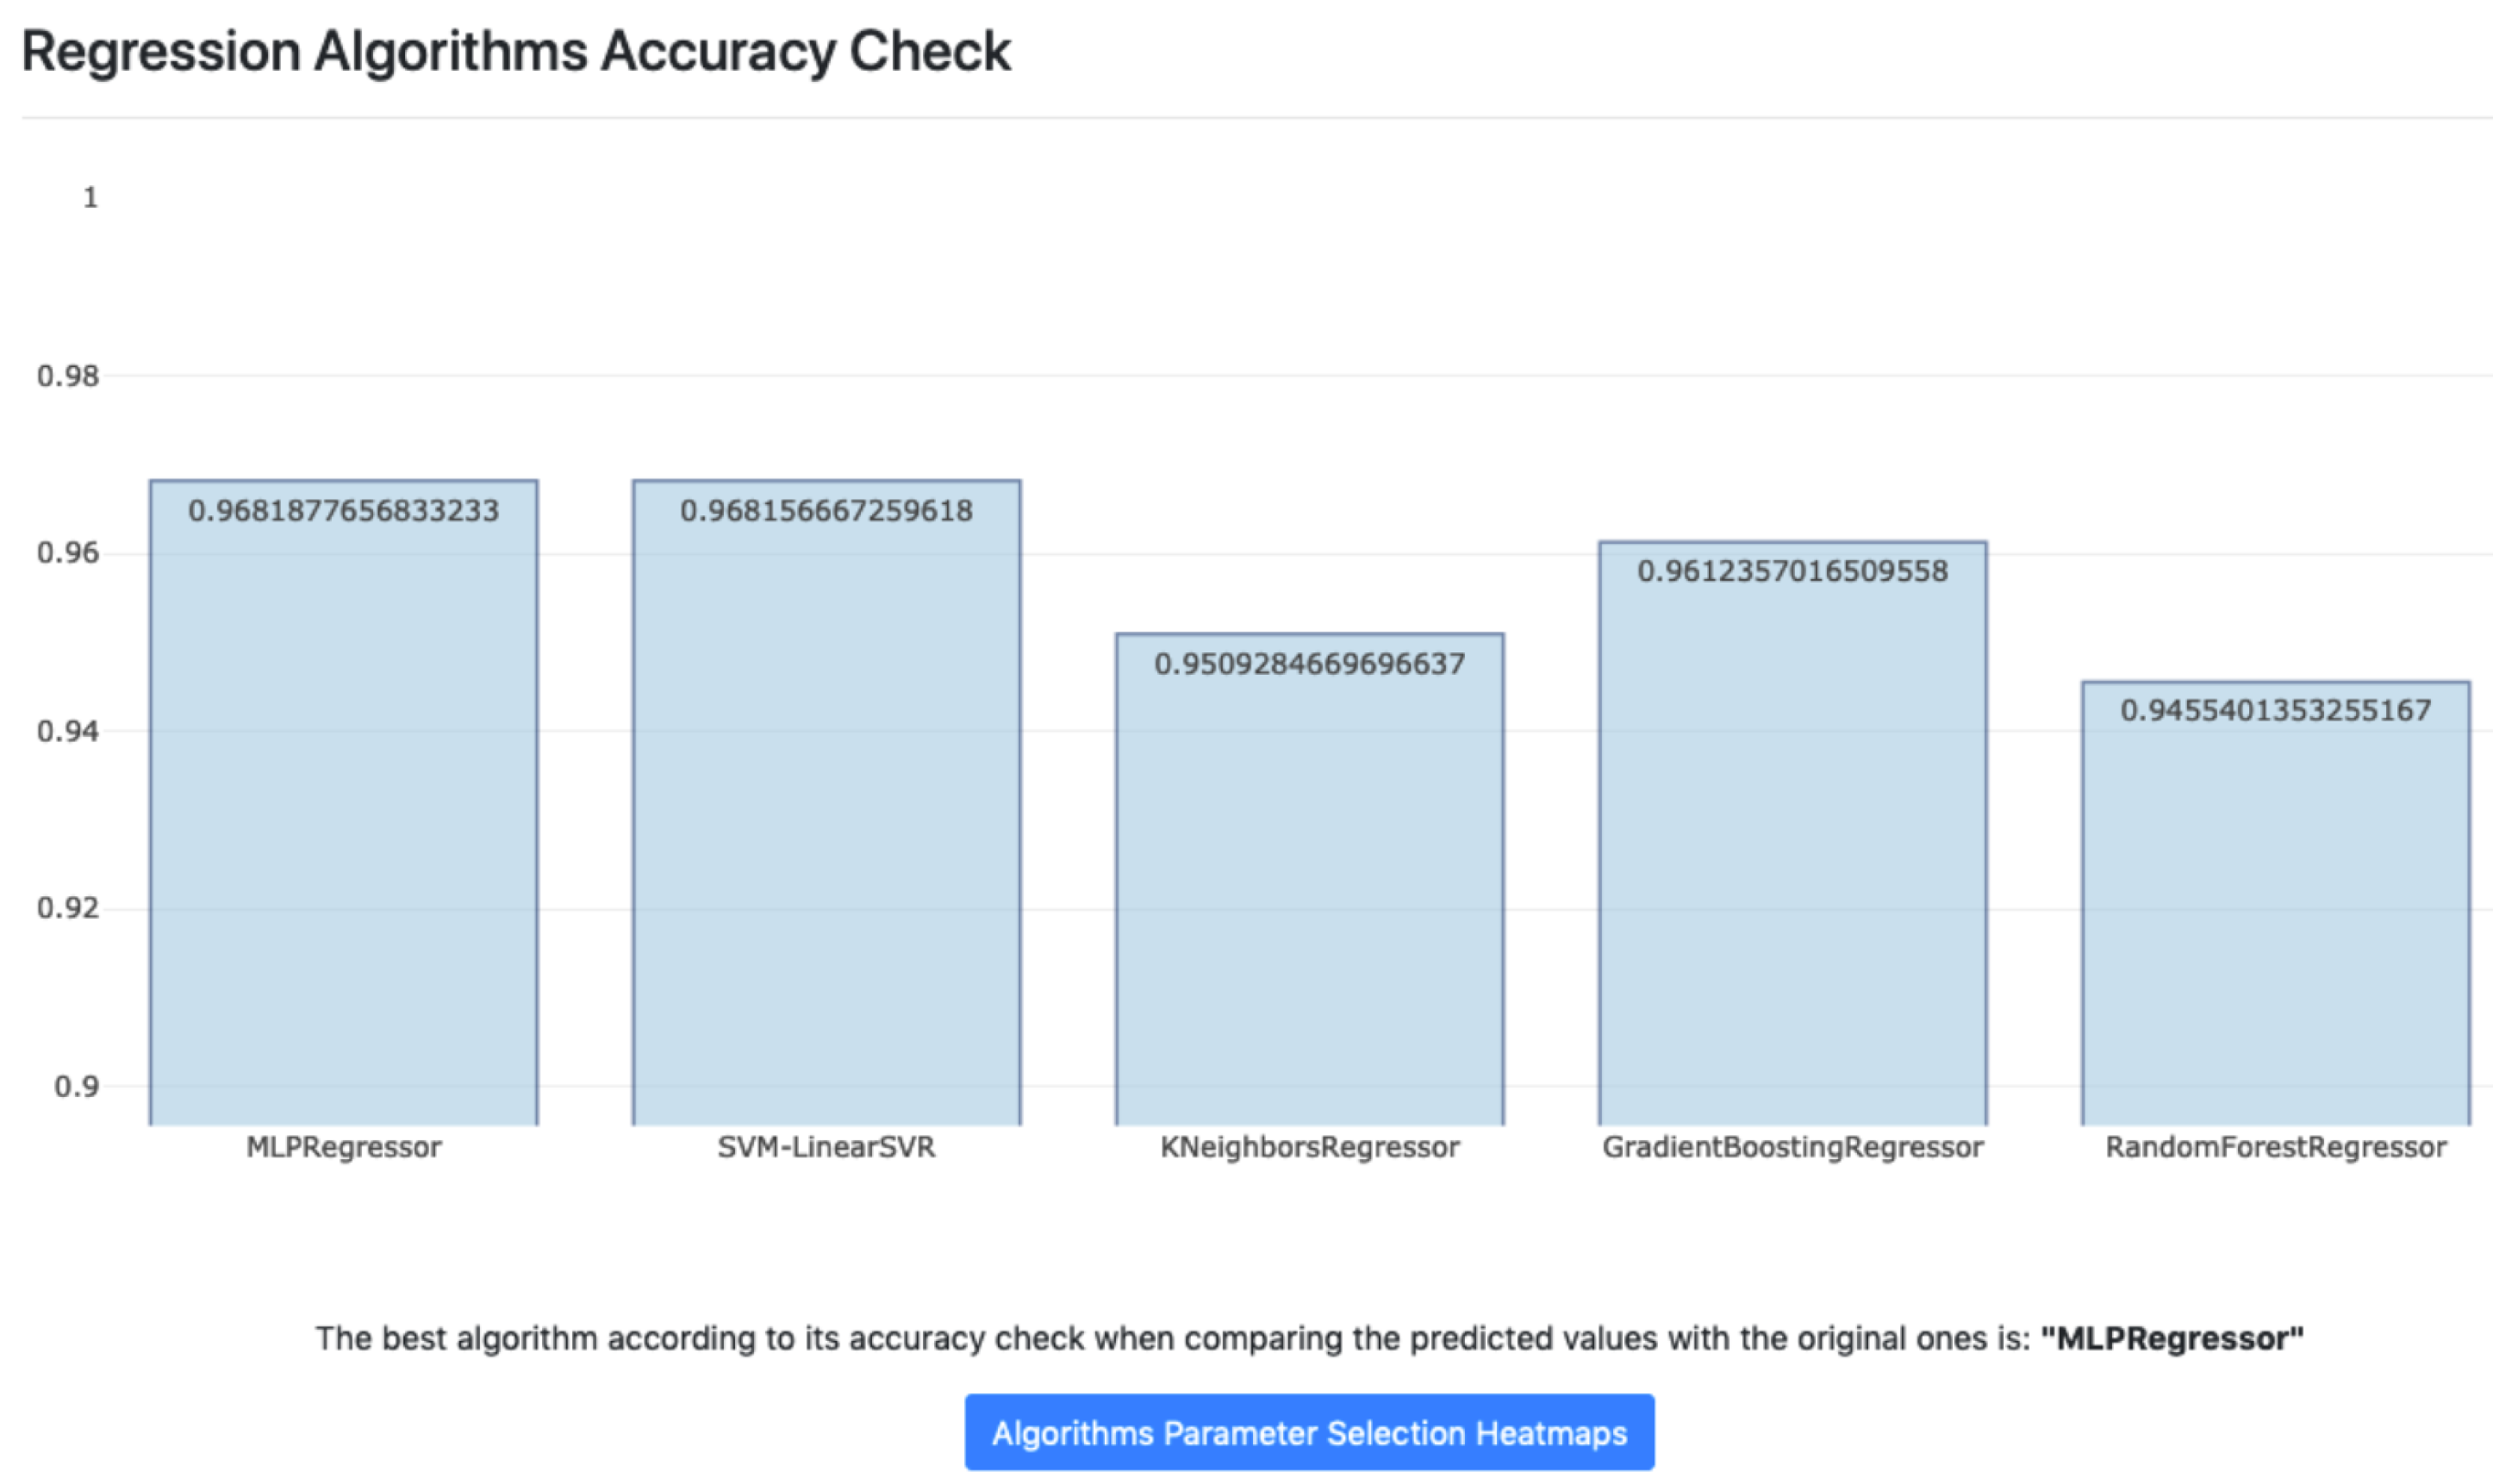
3.1.3. Forecasting System

After obtaining the historical data from the last five years of a Spanish continuous market company share through the previously created Python package [8], the Prediction System’s design specification is made, as shown in Figure 6.
To predict the future behavior of a stock, Machine Learning regression algorithms [4,9,10,11] are applied. The objective is to determine the closing price of the stock market, for this the set of opening values has been defined as the input variables and the set of closing values as the output variables, i.e. the closing values are the objective variable of the algorithm. Given the nature of the problem, regression algorithms must be applied. This is because when working with continuous data, regression algorithms can indicate the pattern in a given set of data. Consequently, these algorithms are applied in cases where the relationship between a scalar dependent variable or objective variable Y and one or more input variables X is to be modelled. The following section describes the algorithms that were used by the system to predict the last (unknown) closing value based on historical market data, from the last (known) opening value:
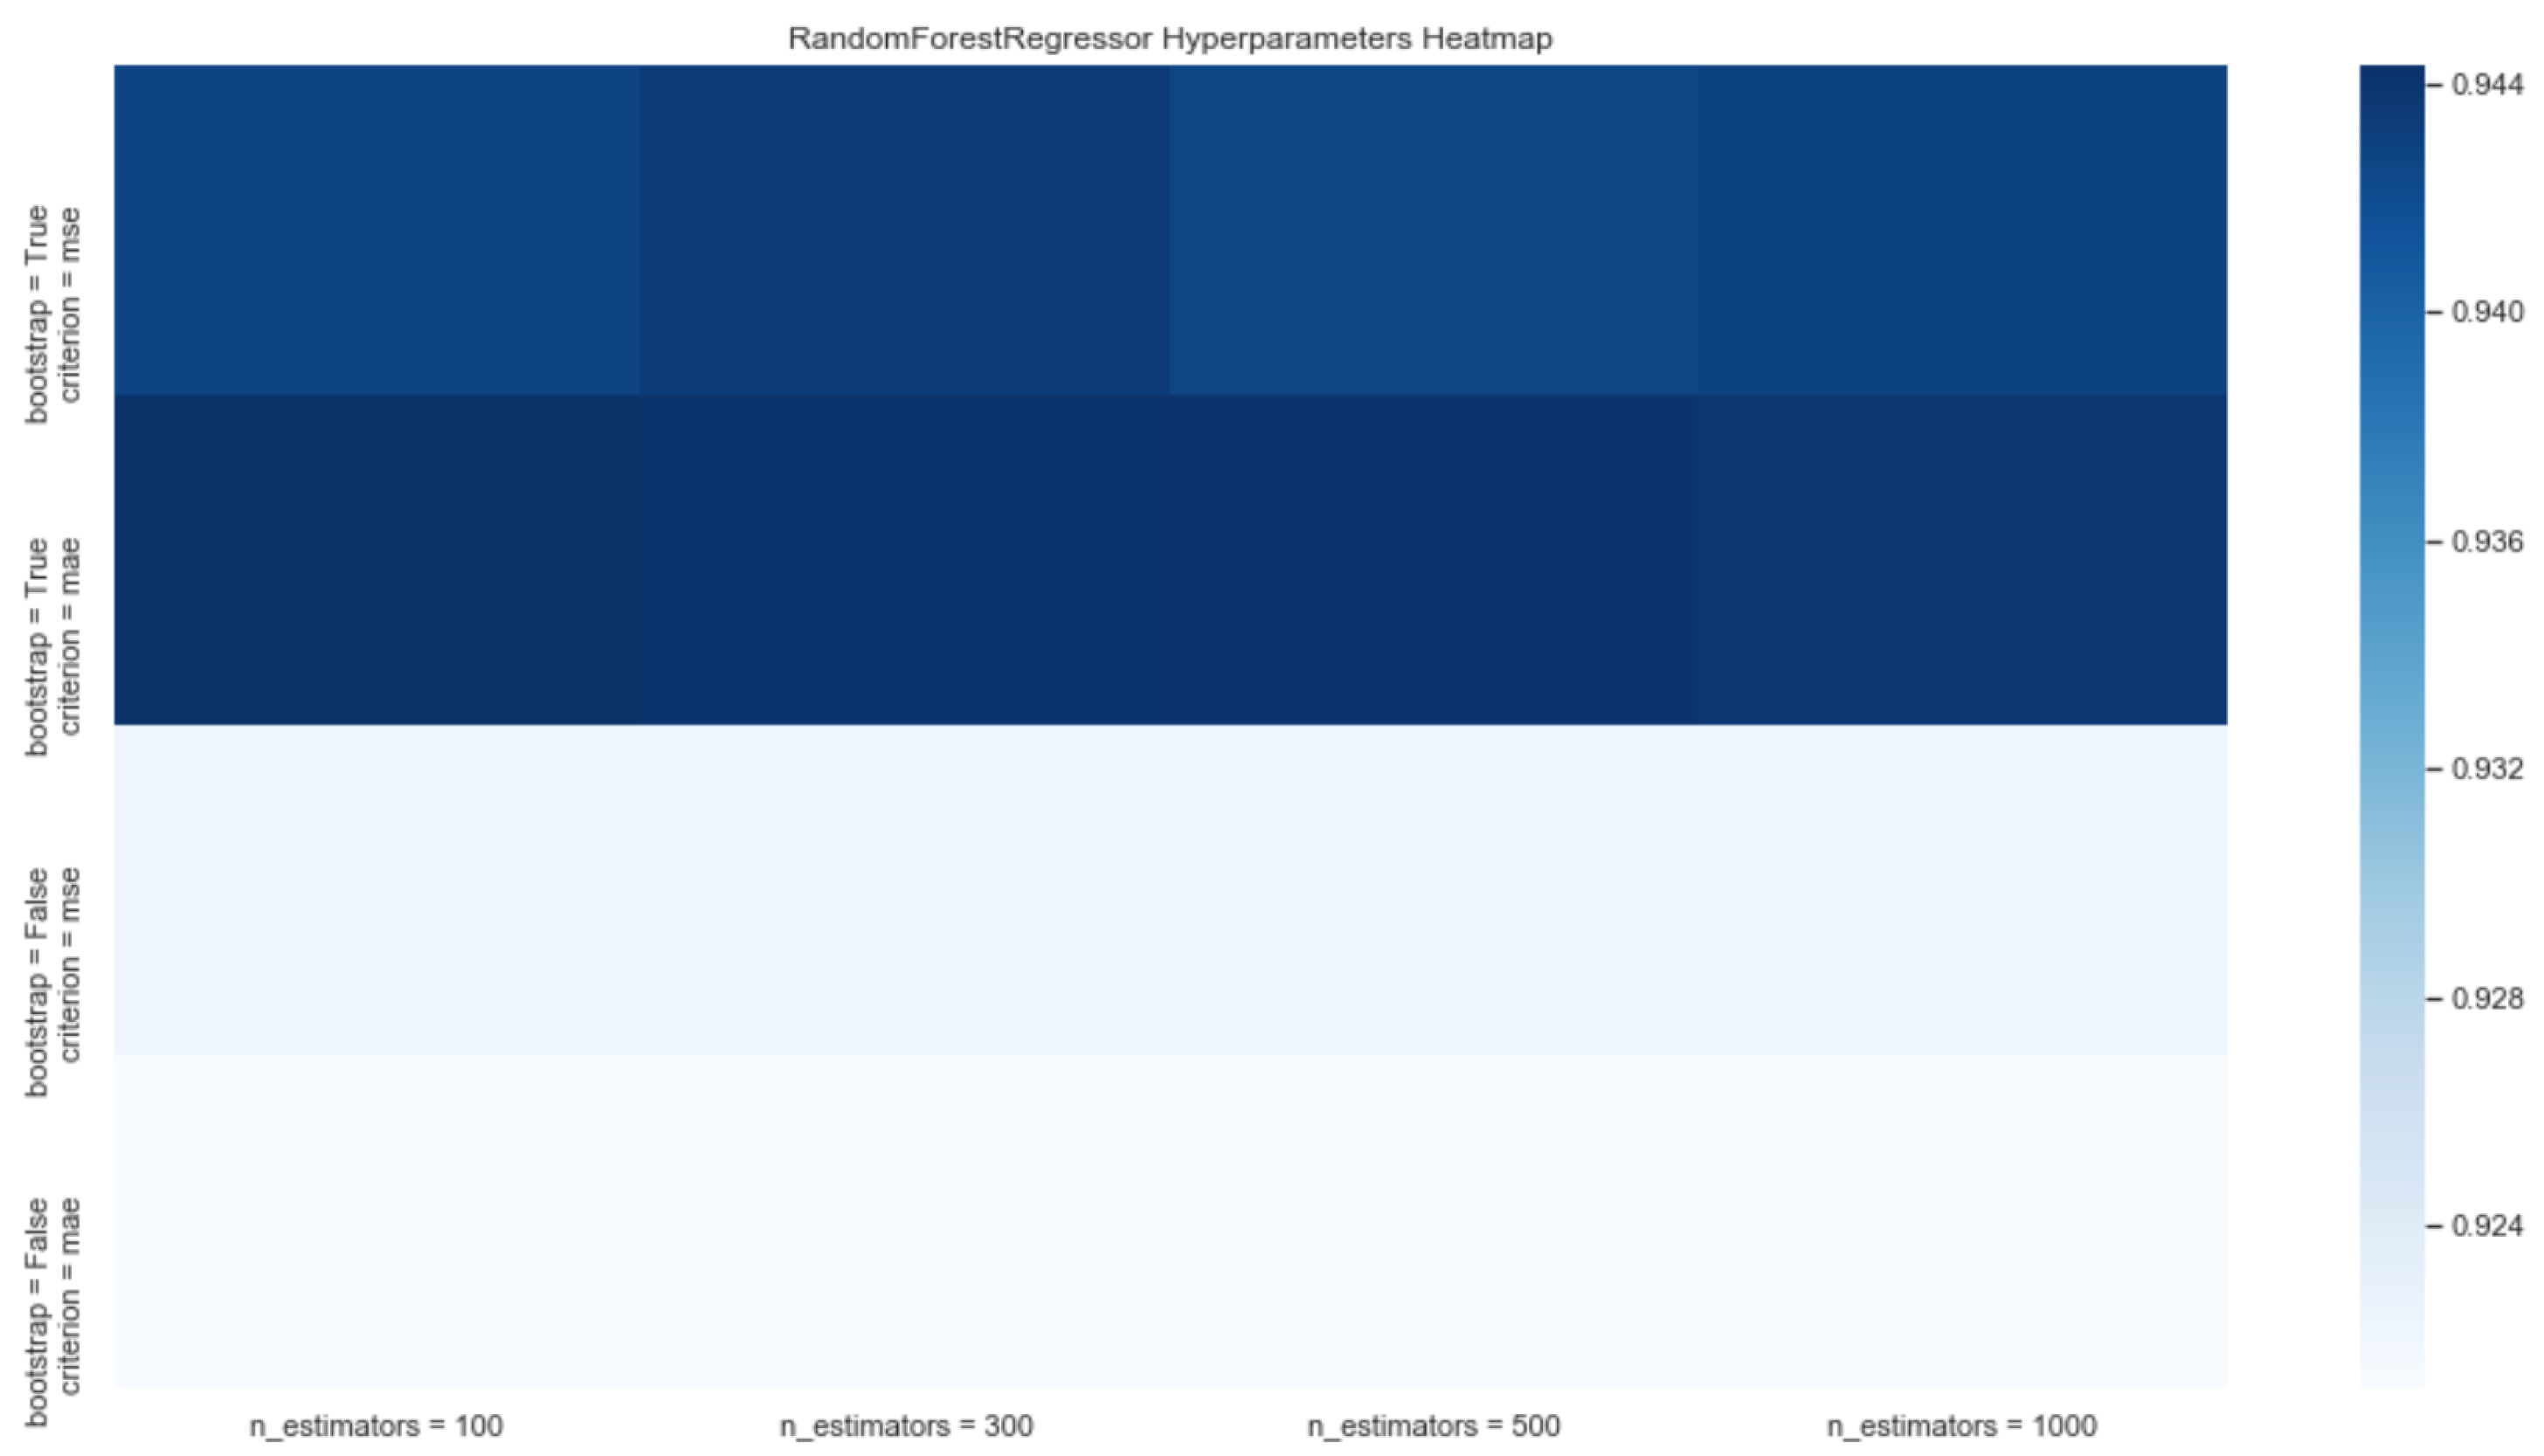
  • Random Forest Regressor: these algorithms are an automated learning method for classification, regression, and other tasks. A random forest is a meta-stimulus that fits a series of classification decision trees into various sub-samples of the data set and uses the means to improve productive accuracy and control over fit.
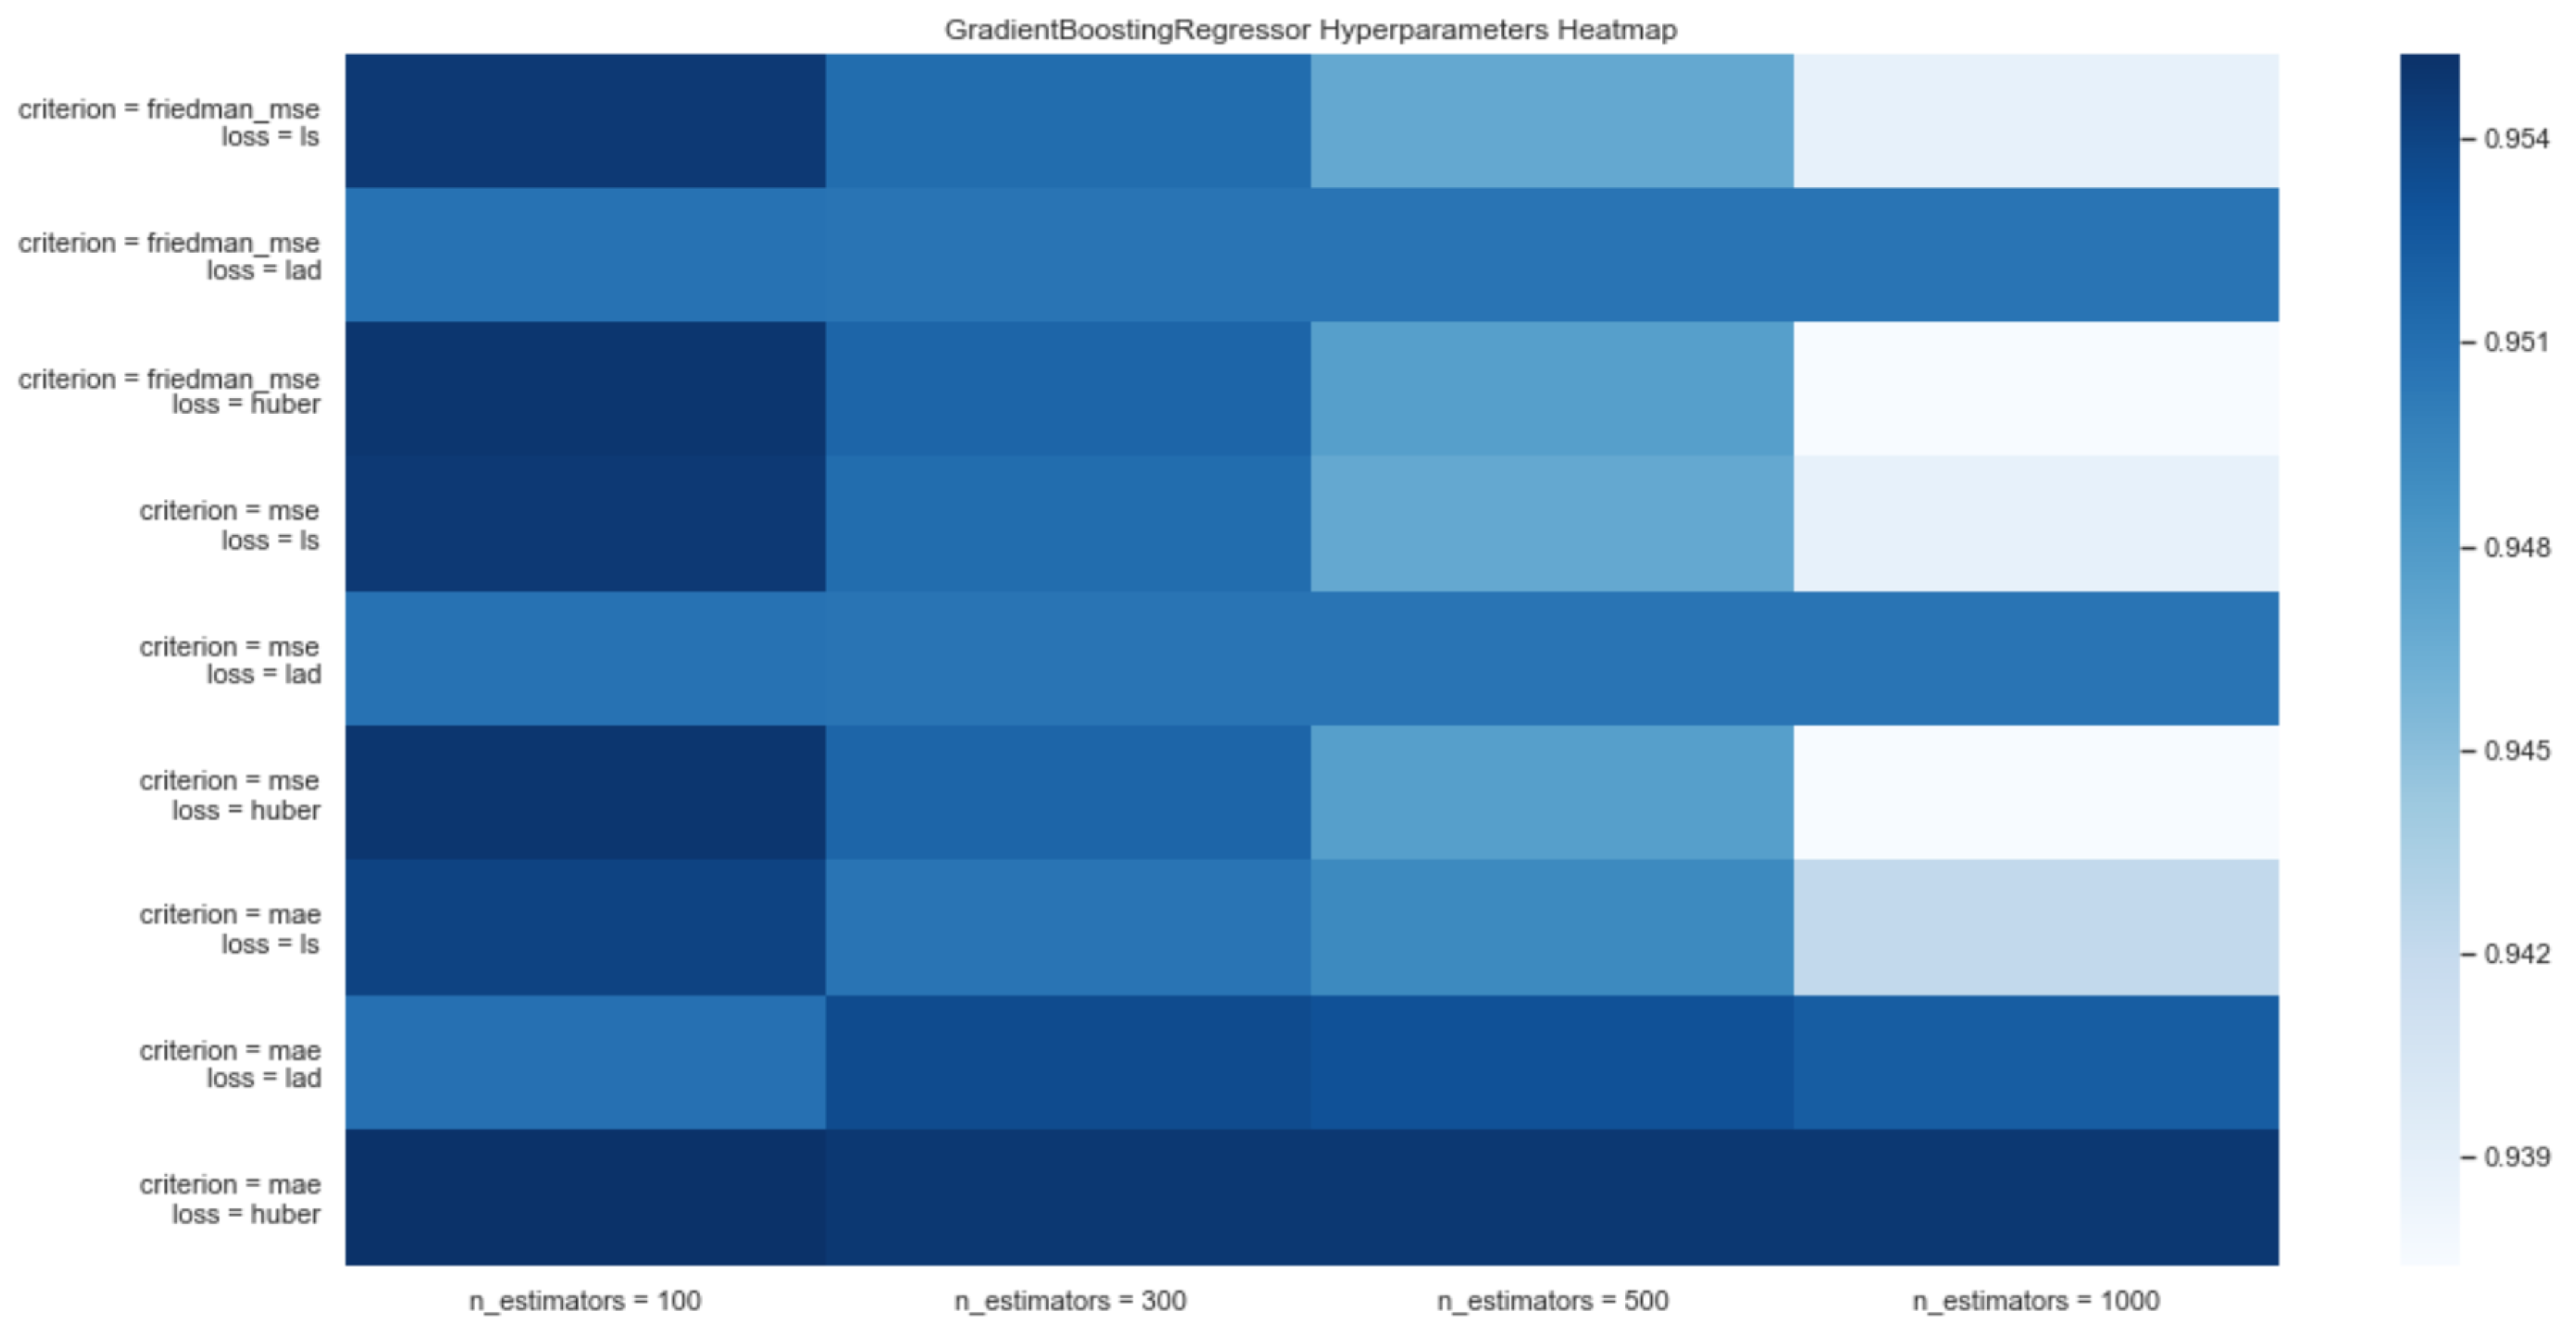
  • Gradient Boosting Regressor: it is an automated learning technique that builds the model in a scenic way, just like methods that are based on reinforcement. It generalizes models allowing for the optimization of an arbitrary and differentiable loss function.
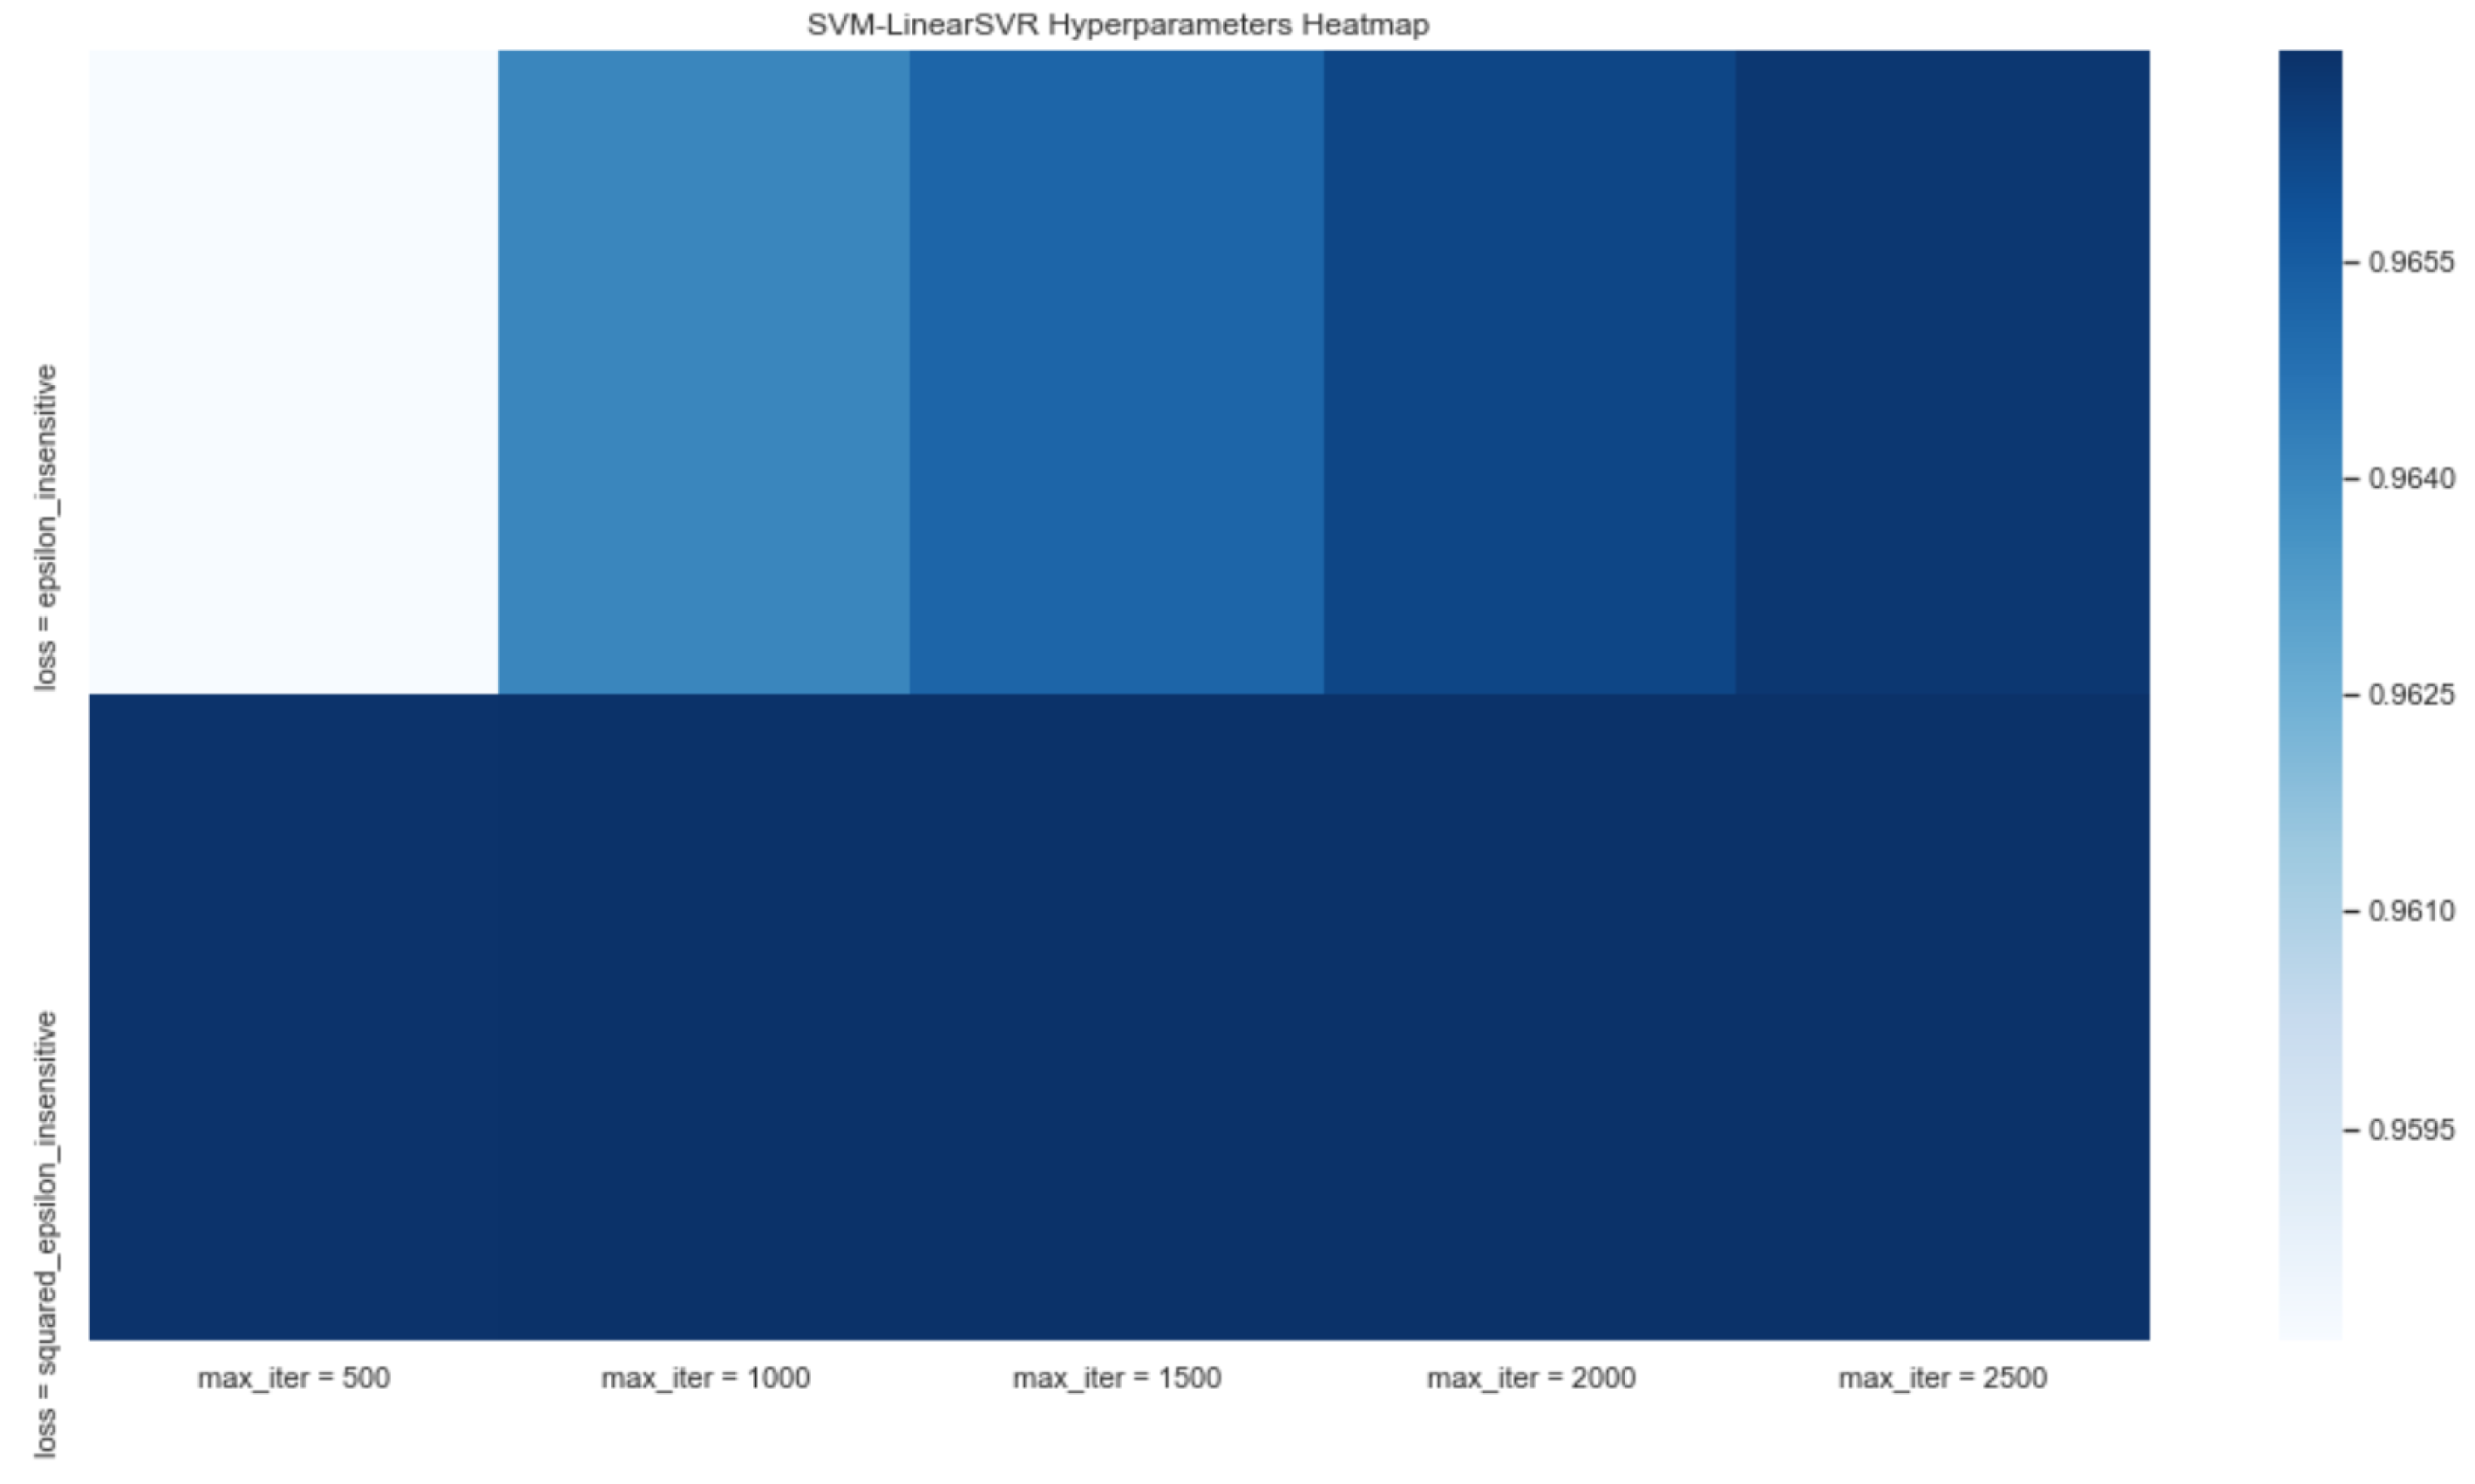
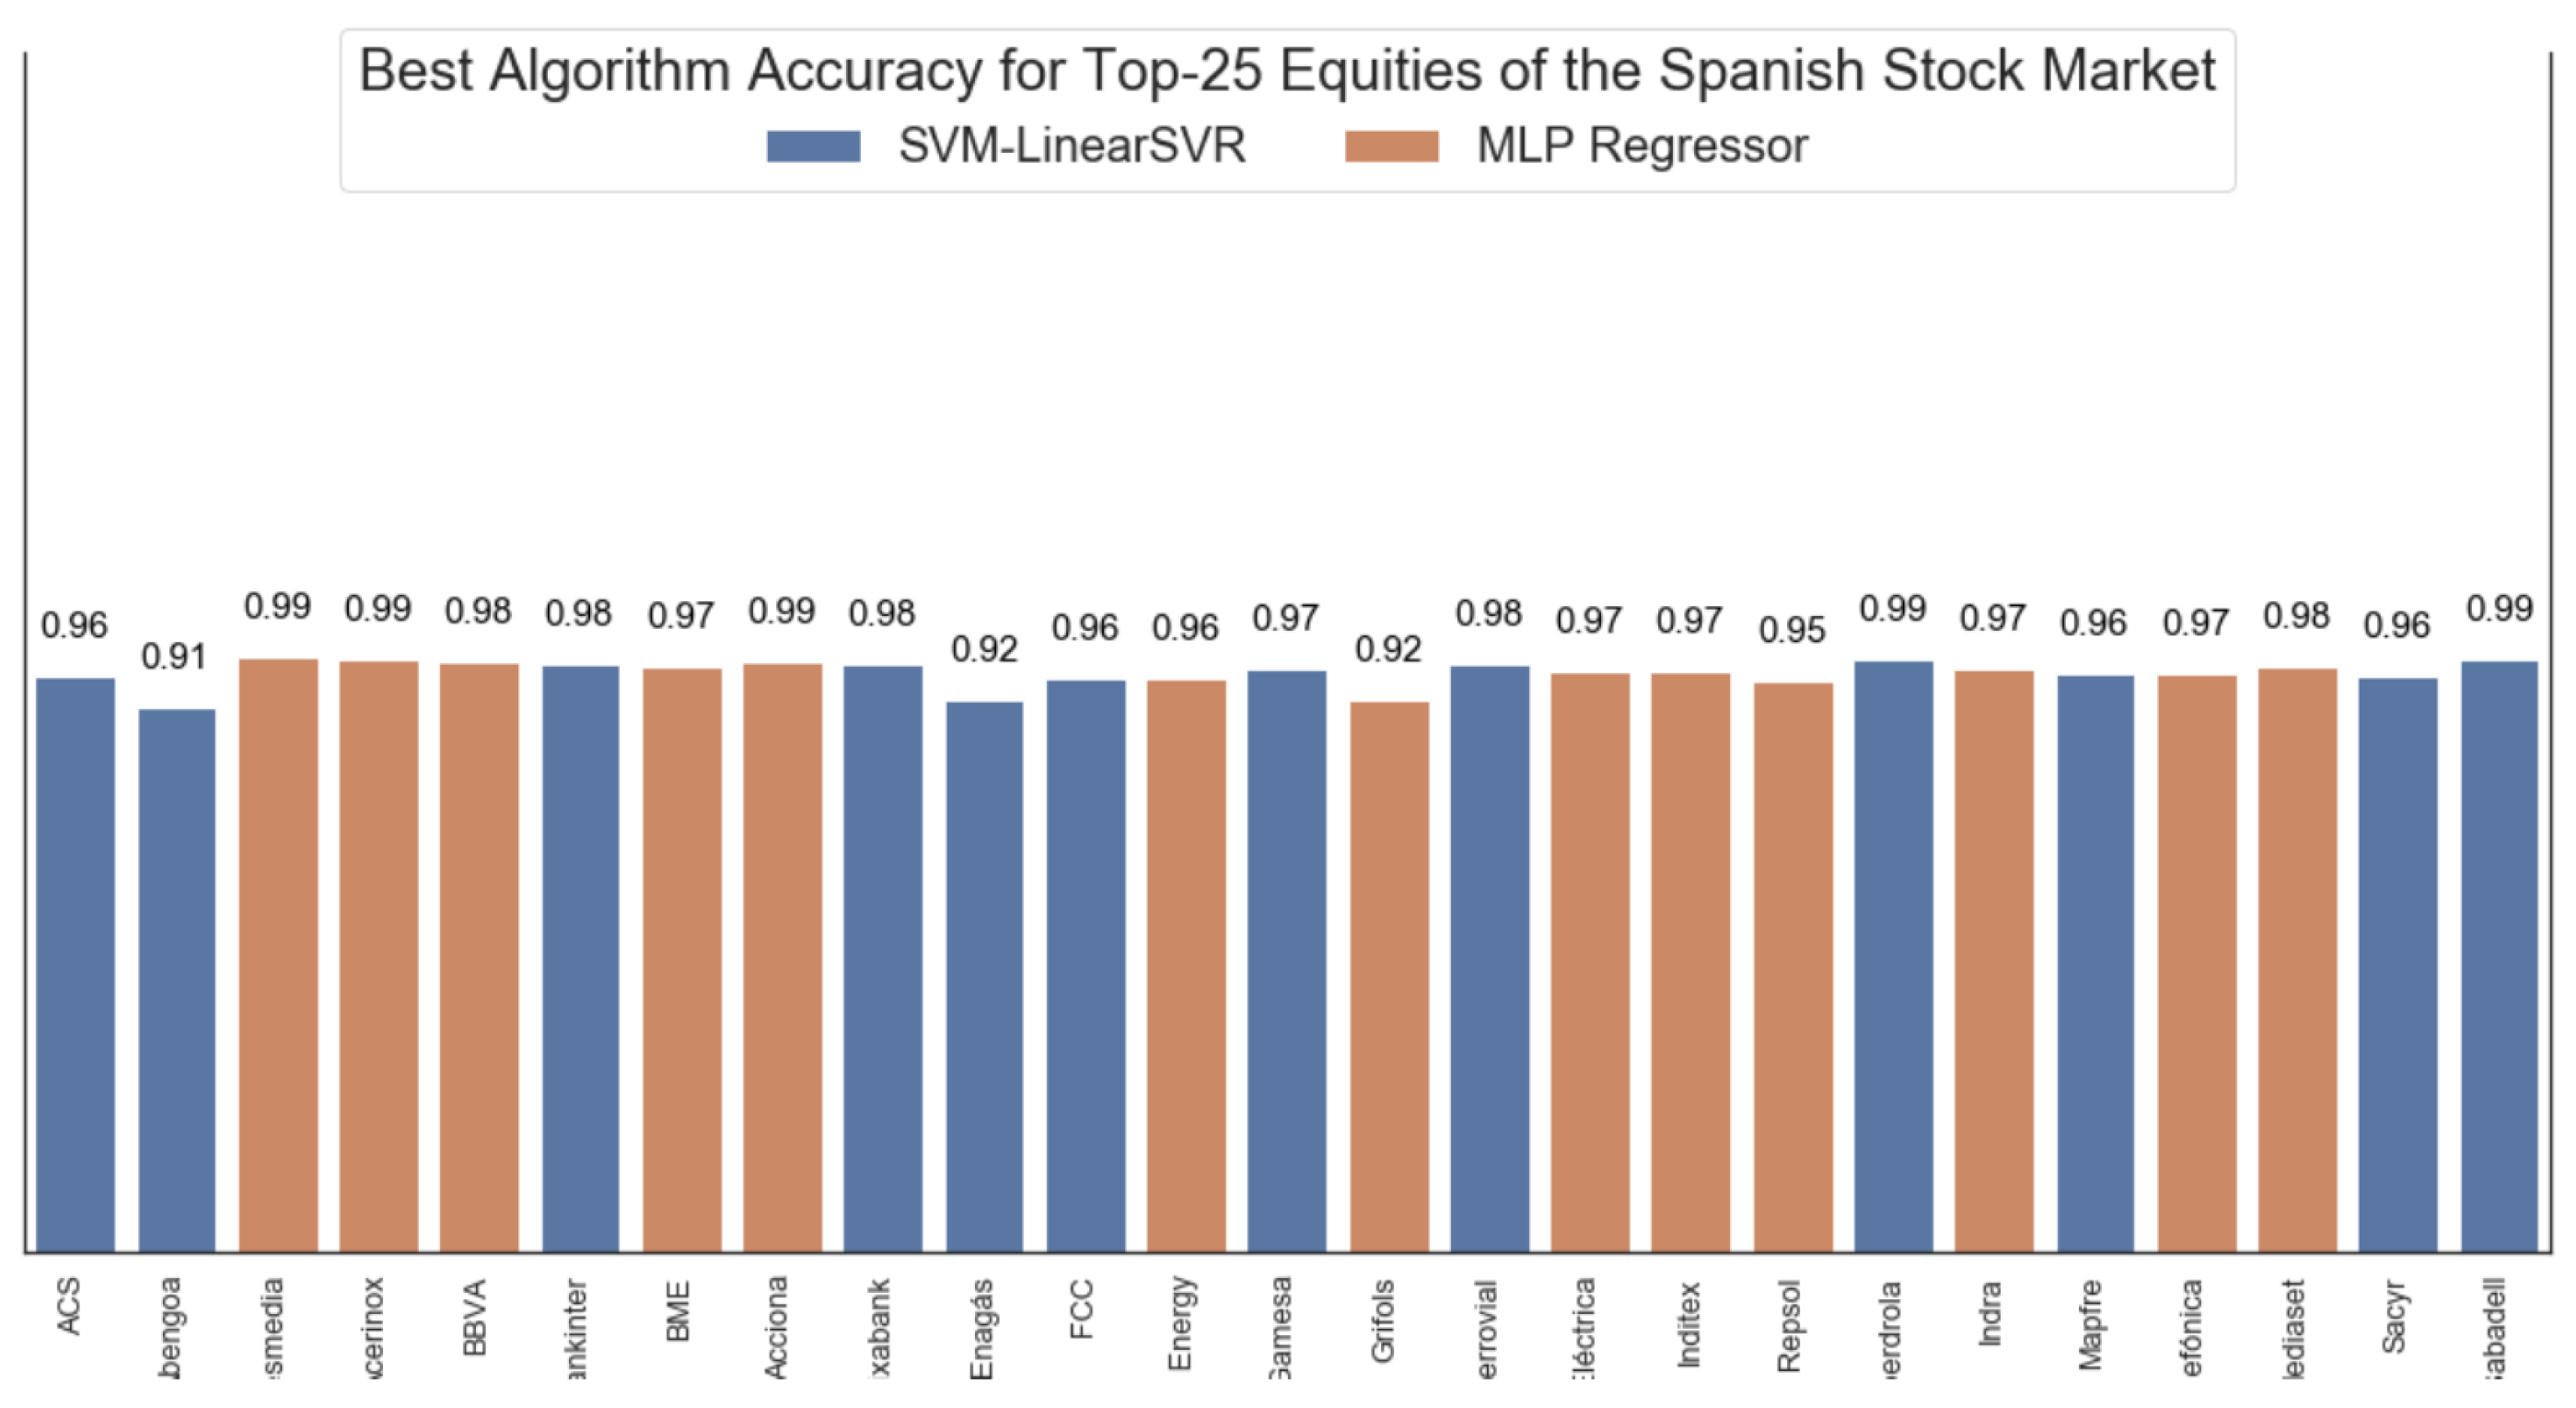
  • SVM-LinearSVR: learning models that analyze data for classification and regression analysis. An SVM training algorithm builds a model that assigns new examples to one or another category, which makes it a non-probabilistic binary linear classifier. In SVR we try to adjust the error within a certain threshold. In this case, it is similar to SVR with the kernel = linear parameter.
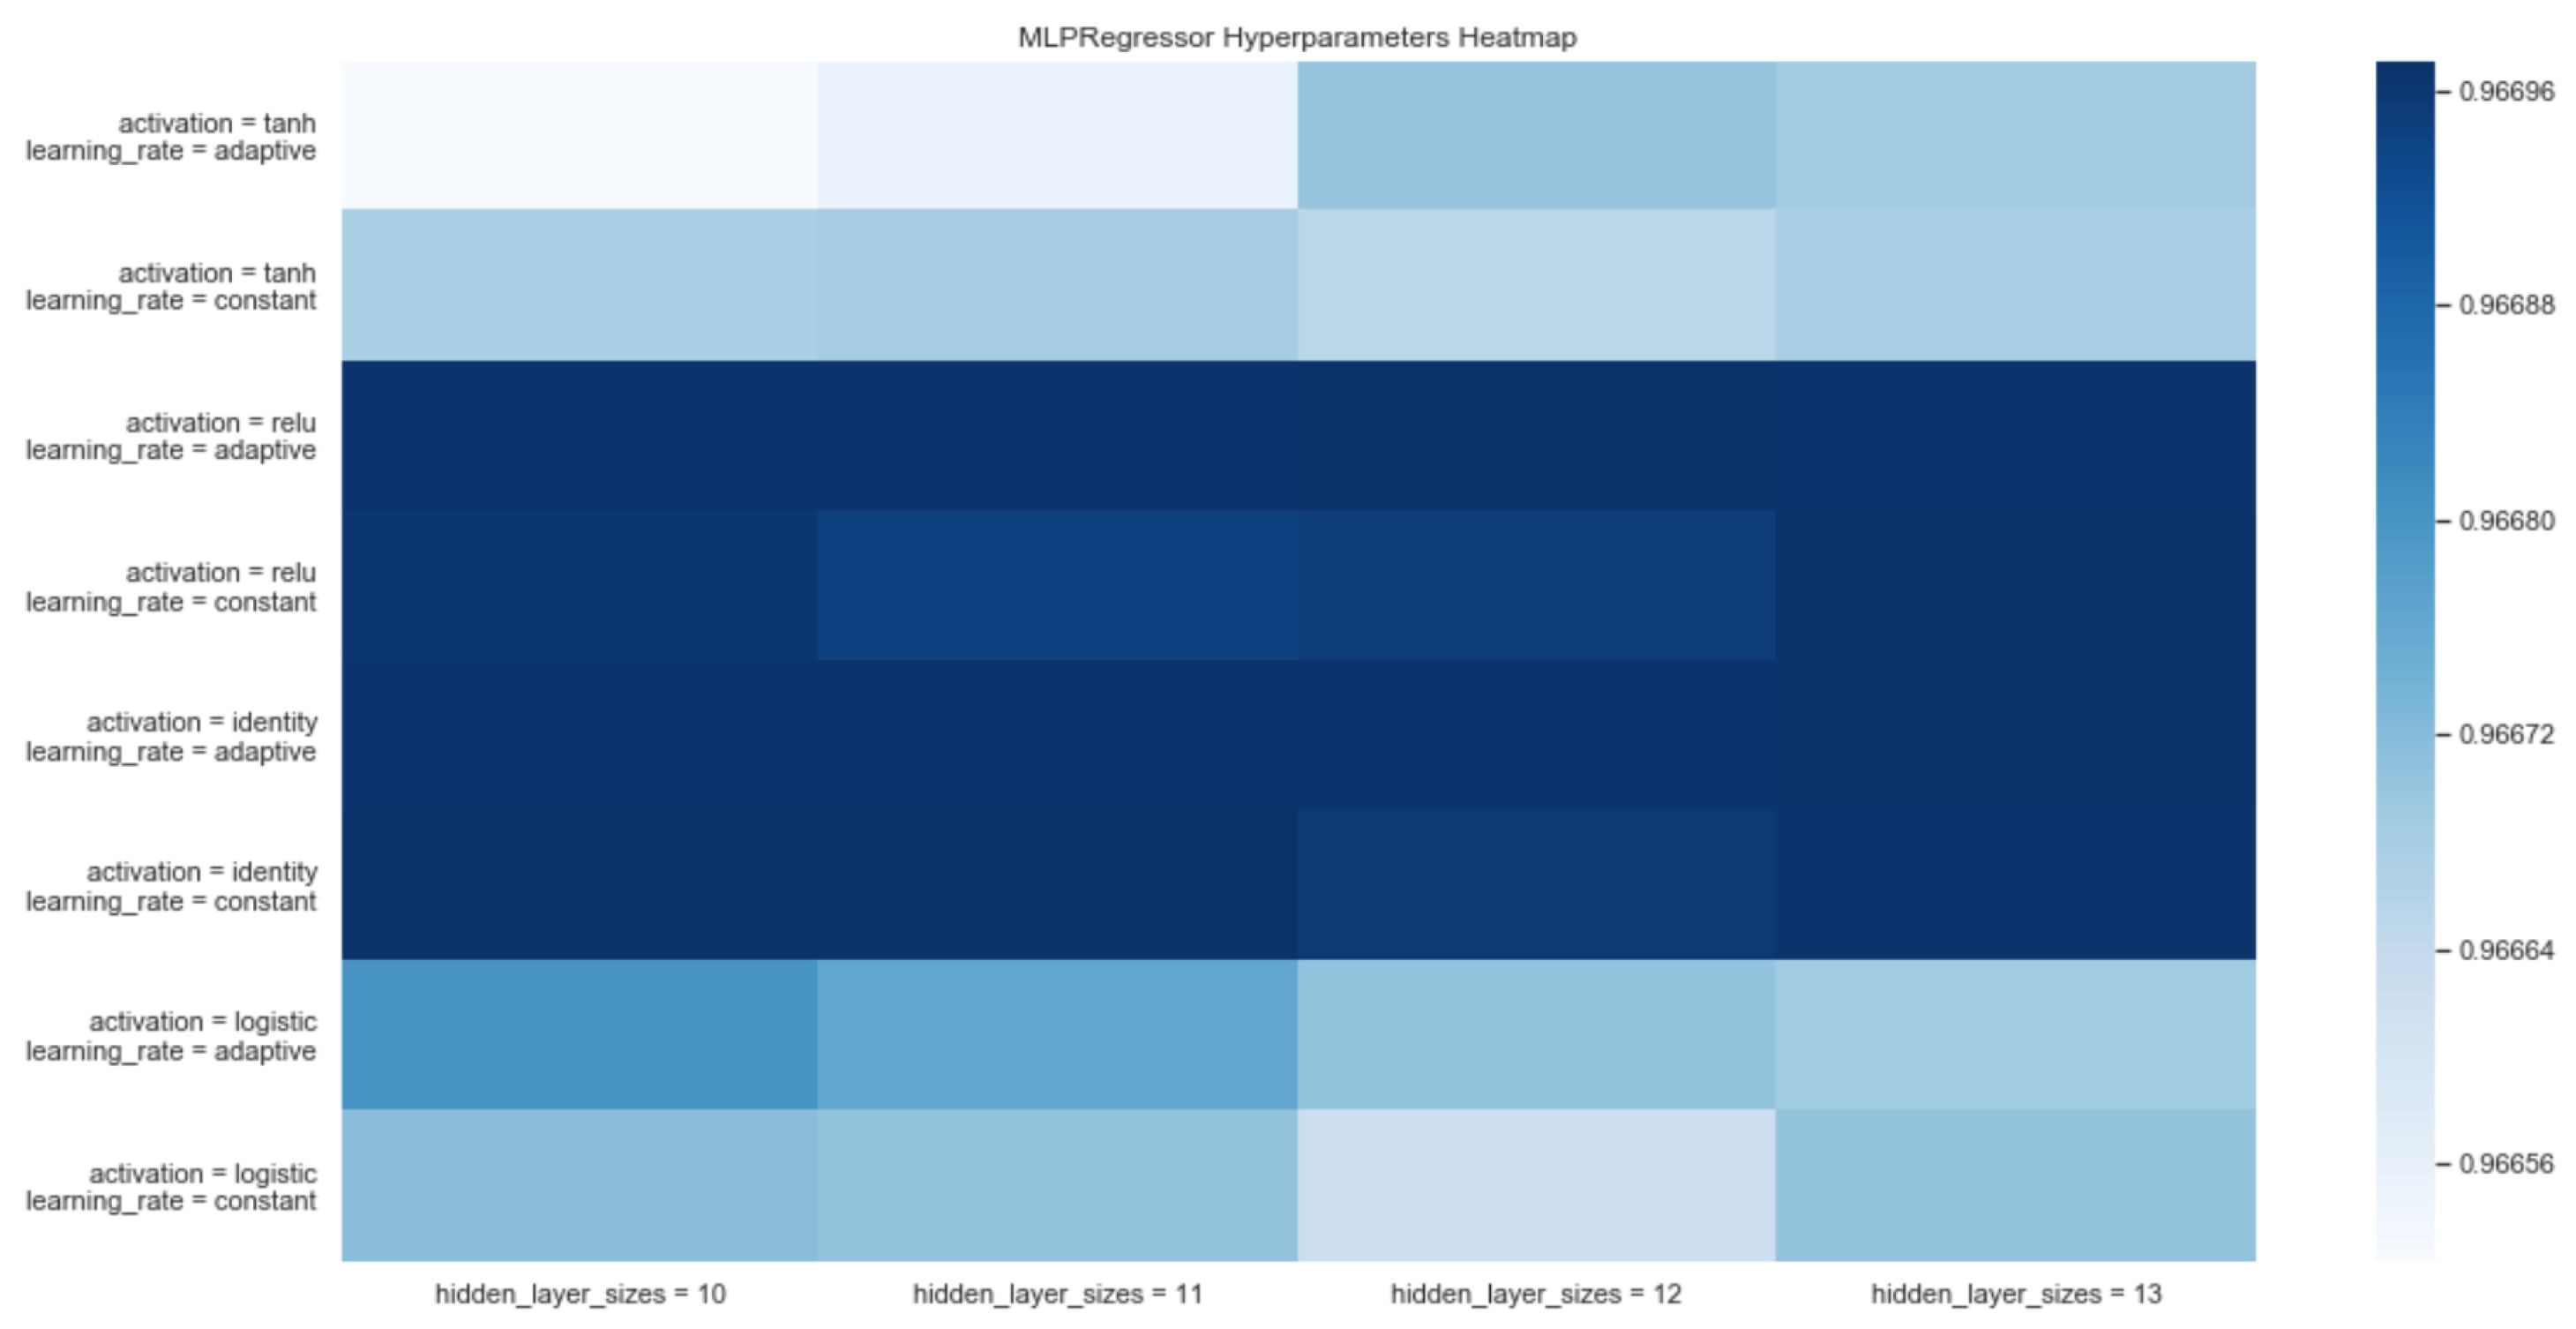
  • MLP Regressor: a kind of artificial feedback neural network. MLP uses a supervised learning technique, called backpropagation, for the construction of the network. In addition, its multiple layers and non-linear activation distinguish MLP from a linear perceptron. It also allows for distinguishing data that are not linearly separable.
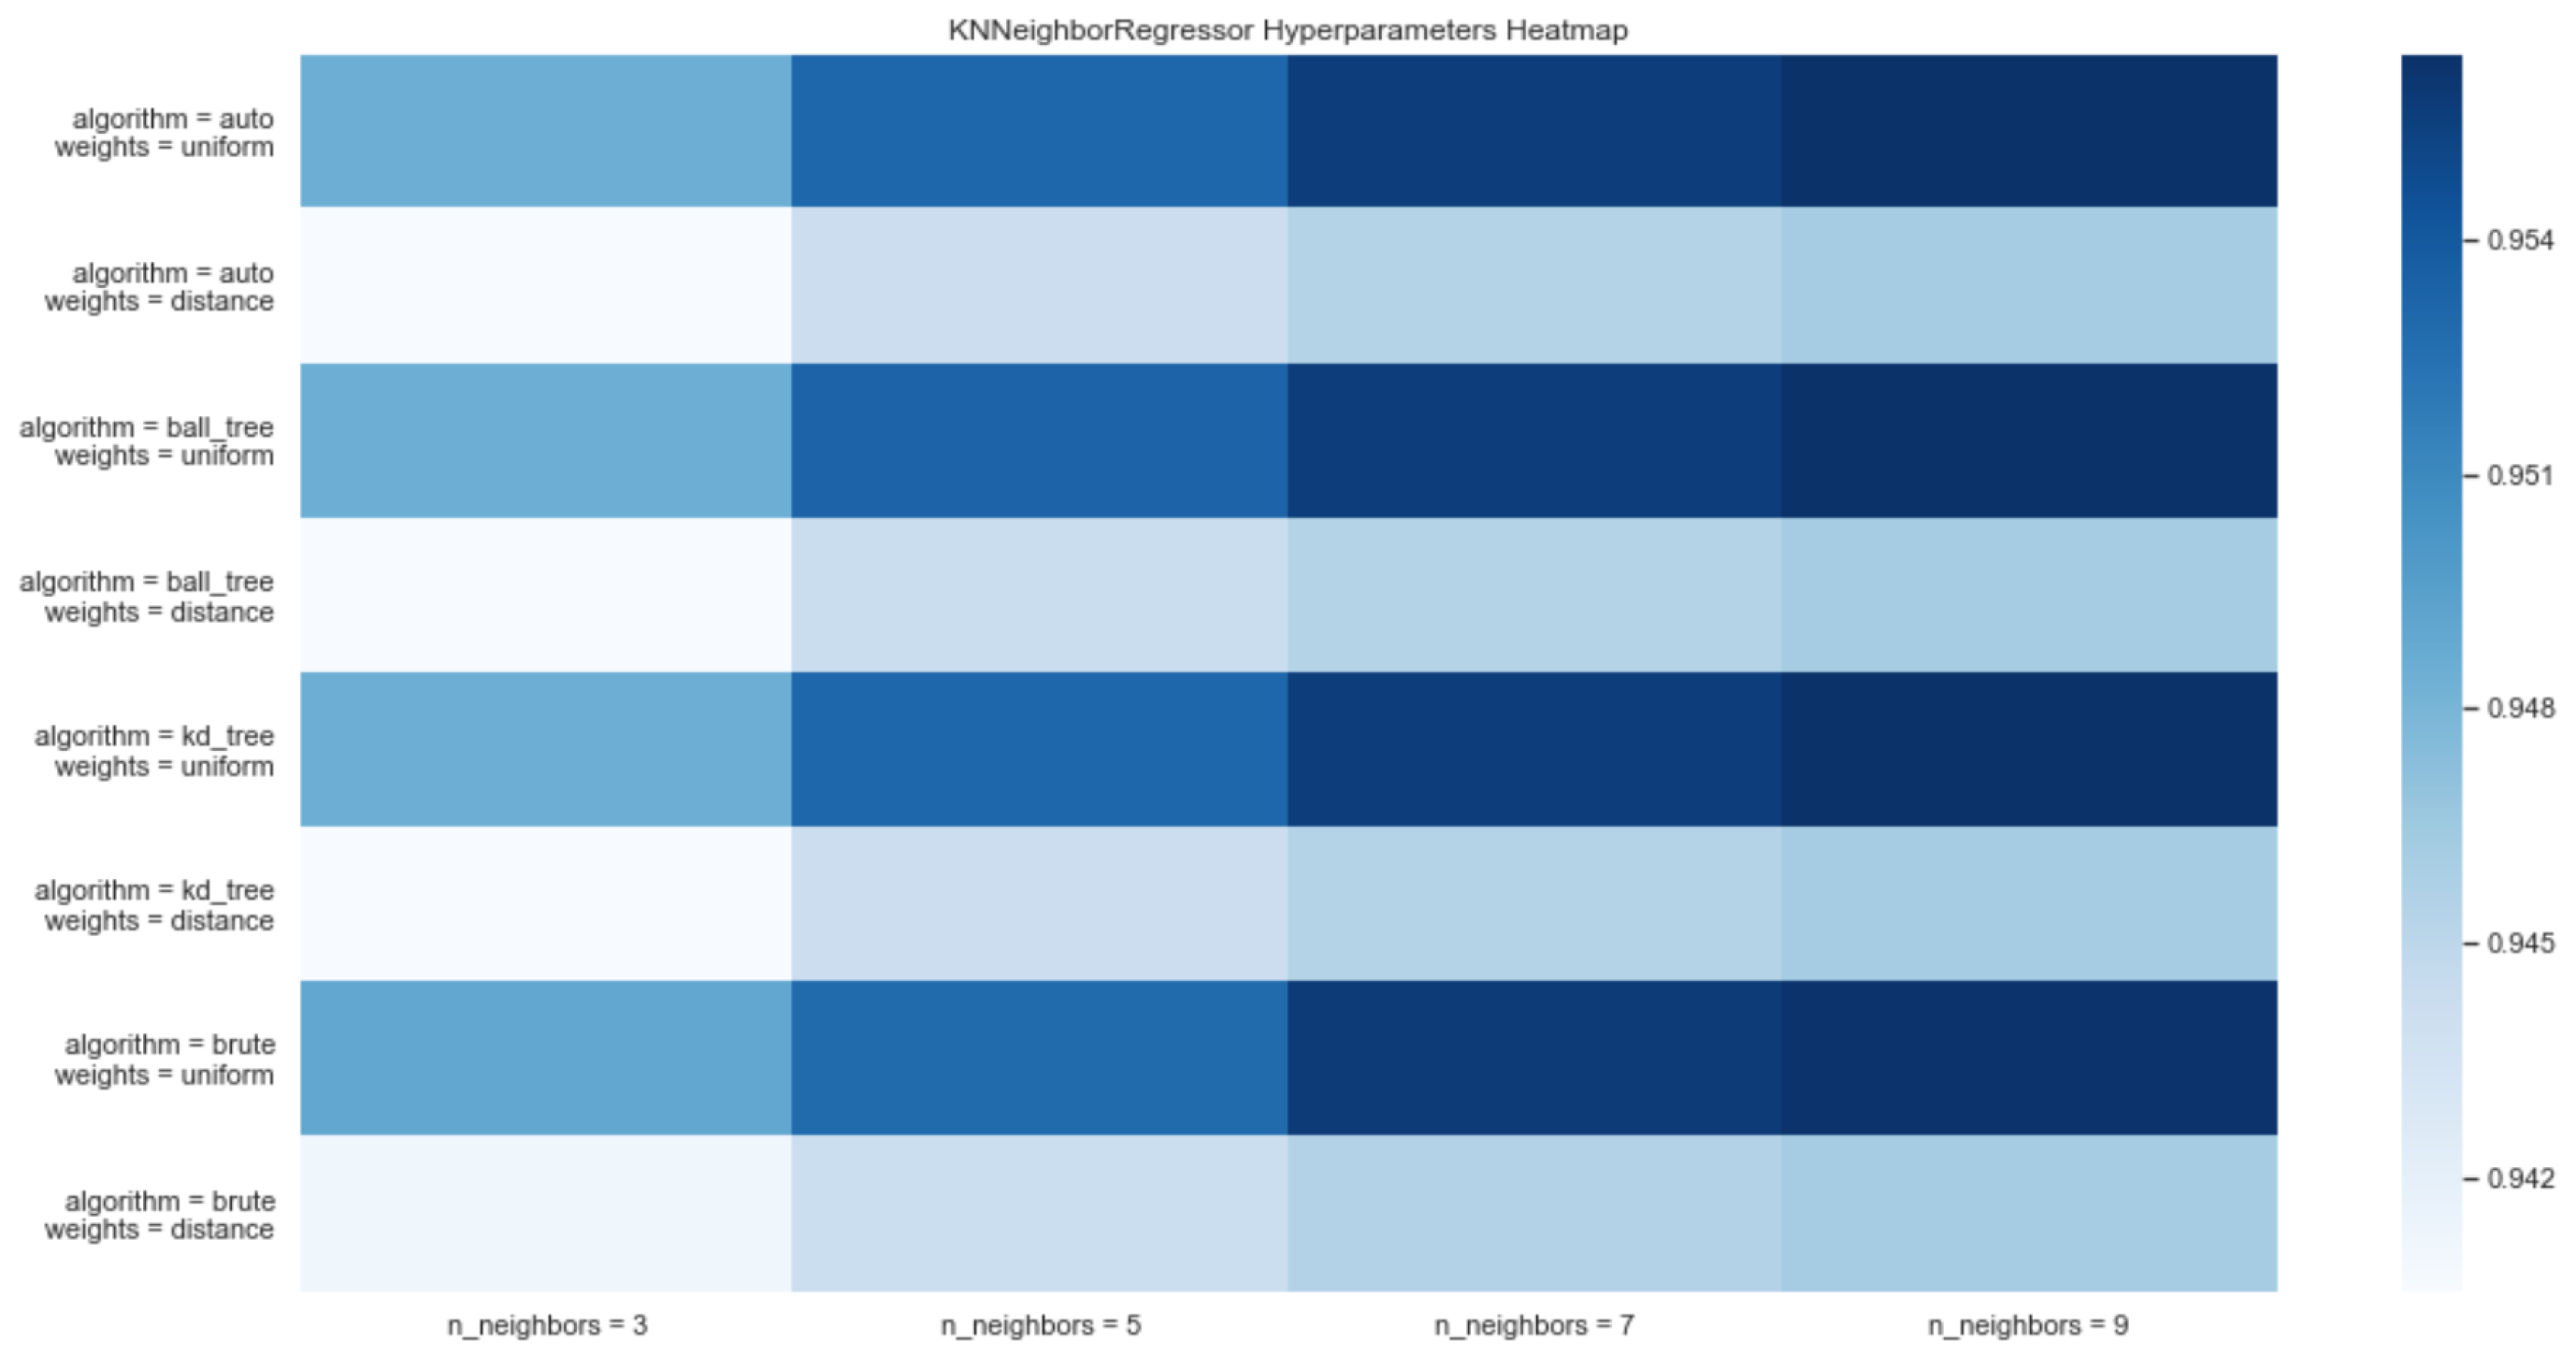
  • KNNeighbors Regressor: non-parametric method used for classification and regression

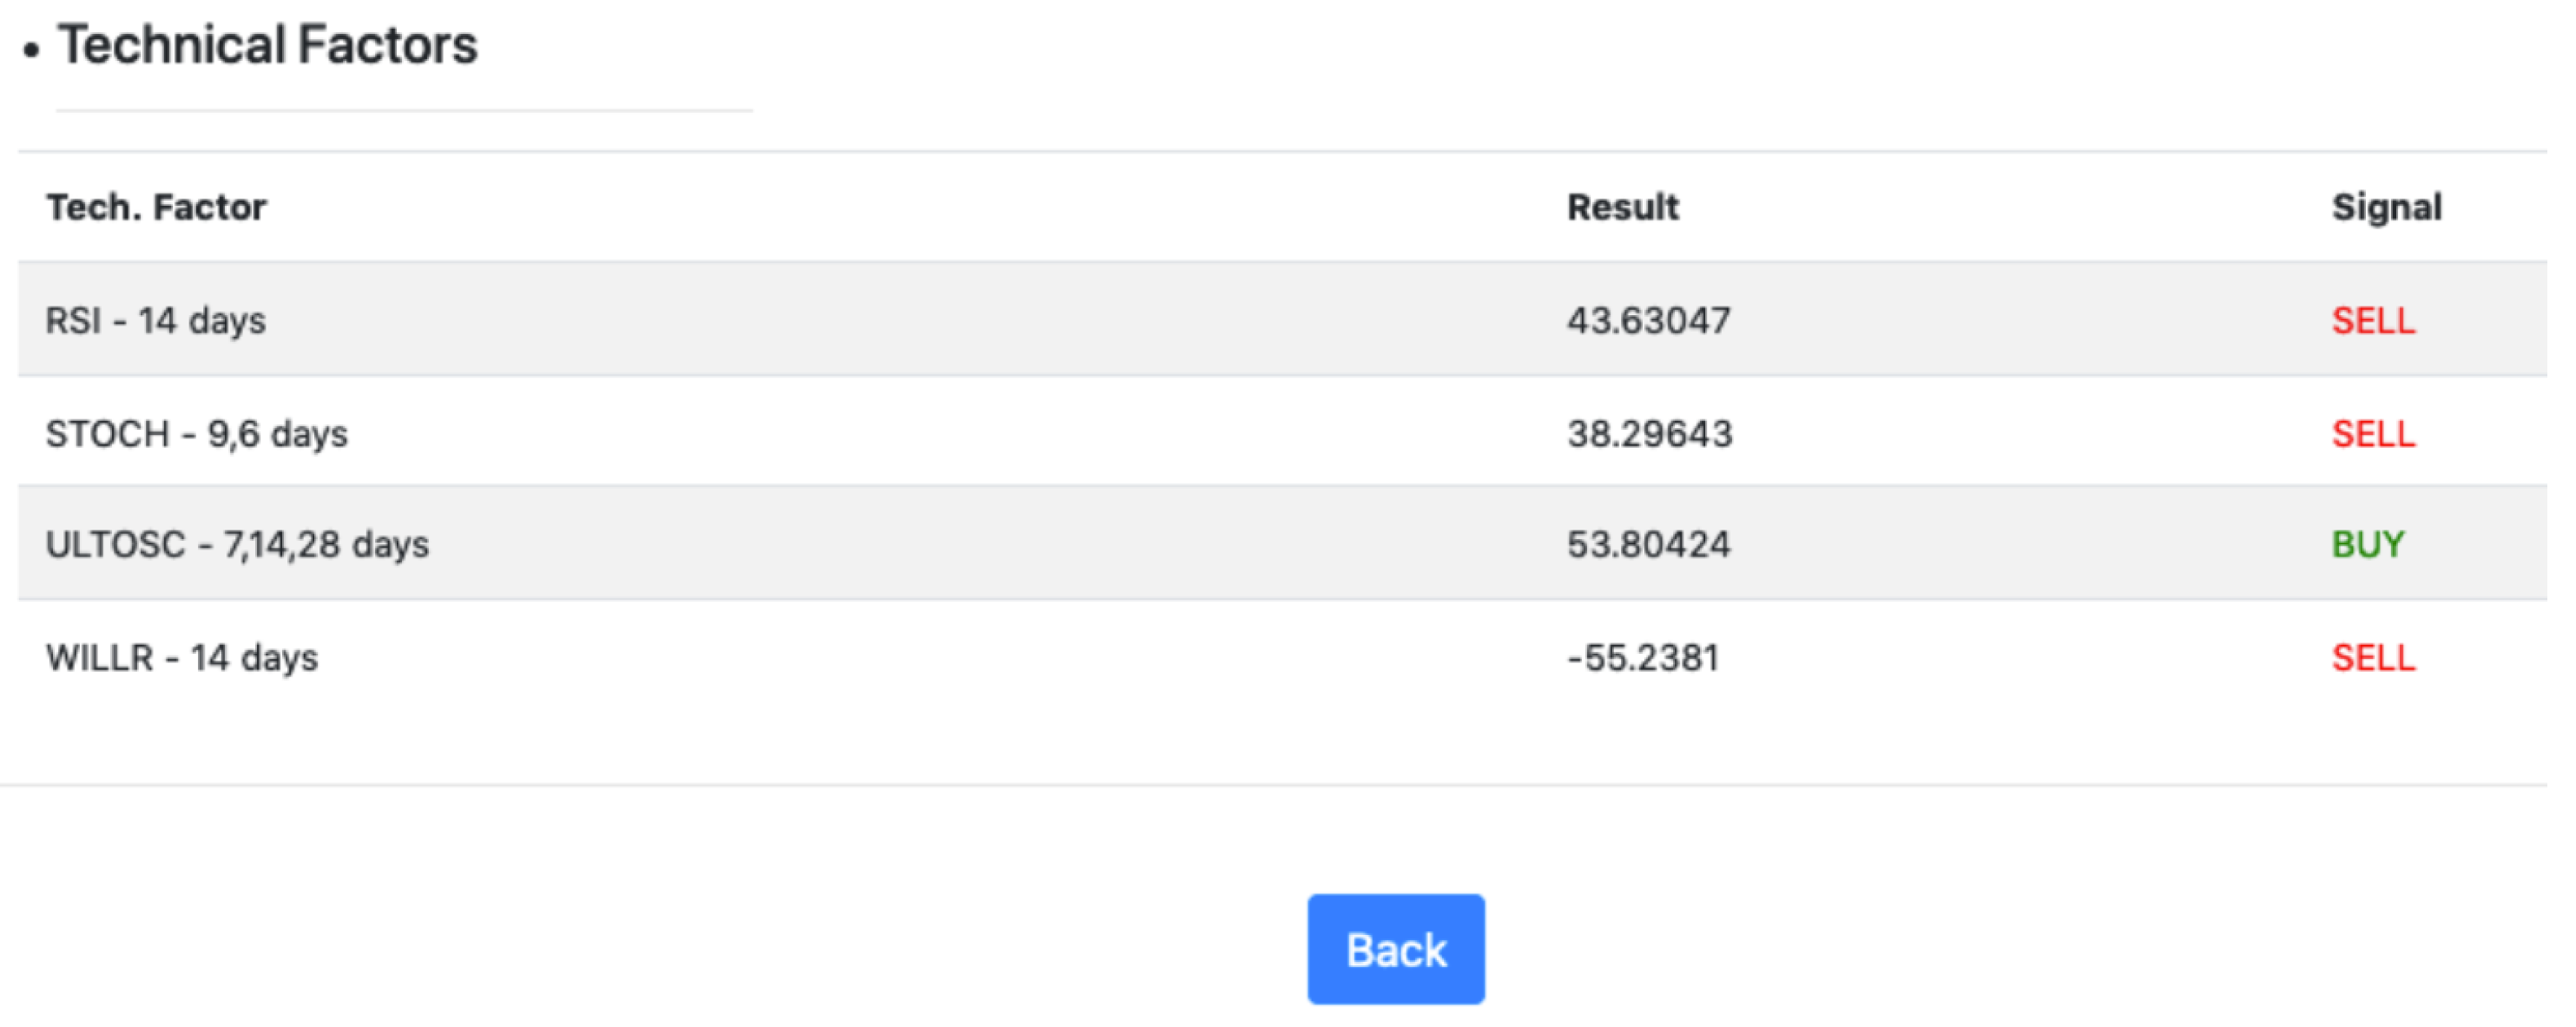
3.1.4. Technical Analysis

Based on the Spanish continuous market companies’ historical stock data, a technical analysis of the market is carried out, in this case combining Momentum Indicators and Moving Averages. This is done for several previously defined time windows for each of the different factors to be calculated based on the standard of the size of the time windows; Figure 7 describes its design specification.
To calculate the factors for the technical analysis, the TA-Lib library has been used through the wrapper written in Python with the same name. Pandas’ utilities have been used to calculate the moving averages. Technical Analysis is an analysis that is used to weigh and evaluate investments. It identifies opportunities to acquire or sell stocks based on market trends. Unlike fundamental analysis, which attempts to determine the exact price of a stock, technical analysis focuses on the detection of trends or patterns in market behavior for the identification of signals to buy or sell assets, along with various graphical representations that help to evaluate the safety or the risk of a stock [12]. This type of analysis can be used in any financial product as long as historical data are available. It is required to include both share prices and volume. Technical analysis is very often employed when a short-term analysis is required, thus, it can help to adequately address the problem presented in this research, where the closing value of a share in a day is predicted. The following indicators are considered in the analysis [13]:
  • Relative Strength Index (RSI): it is a Momentum Indicator (these indicators reflect the difference between the current closing price and the closing price of the previous N days), which measures the impact of frequent changes in the price of a stock, identifying the signs of overbuying or overselling. The representation of the RSI is shown on an oscillator, which is, a line whose value oscillates between two extremes, which, in this case, is between 0 and 100.
    RSI step   one = 100 100 1 + Average gain Average loss
  • Stochastic Oscillator (STOCH): it is a Momentum Indicator that compares the closing price of a stock on a given day with the range of closing values of that stock over a certain period of time, defined by the time window. It also allows to adjust the sensitivity of the oscillator either by adjusting the time window or by calculating the moving average of the STOCH result. Like RSI, it identifies the signals of over-bought or oversold stock within a range of 0 to 100 possible values.
    % K = 100 C L 14 H 14 L 14 × 100
    where C is the most recent closing price, L14 is the lowest price traded of the 14 previous trading sessions, H14 is the highest price traded during the same 14-day period, and %K is the current value of the stochastic indicator.
  • Ultimate Oscillator (ULTOSC): it is a Momentum Indicator used to measure the evolution of a stock over a series of time frames using a weighted average of three different windows or time frameworks. Therefore, it acquires a lower volatility and identifies fewer buy-sell signals than other oscillators that only depend on a single time frame. When the lines generated by ULTOSC diverge from the closing values of a stock, buy and sell signals are identified for it.
    UO = ( A 7 × 4 ) + ( A 14 × 2 ) + A 28 4 + 2 + 1 × 100
    where UO is the Ultimate Oscillator and A is the average. The average calculation follows the next formulas.
    A 7 = p = 1 7 BP p = 1 7 TR
    A 14 = p = 1 14 BP p = 1 14 TR
    A 28 = p = 1 28 BP p = 1 28 TR
    where BP is the Buying Pressure and PC is the Prior Close
    BP = Close Min ( Low , PC )
    where TR is the Ture Range
    TR = Max ( High , Prior Close ) Min ( Low , Prior Close )
    where TR is the Ture Range.
  • Williams %R (WILLR): also known as the Williams Percent Range, is a Momentum Indicator that fluctuates between −100 and 0 and measures and identifies levels of stock overbuying or overselling. WILLR is very similar to the STOCH in its use, as it is used for the same purpose. This indicator compares the closing value of a stock with the range between the maximum and minimum values within a given time frame.
    Williams % K = Highest High Close Highest High Lowest Low
    where the Highest High is the highest price in the look-back period, typically 14 days, Close is the most recent closing price, and Lowest Low is the lowest price in the look-back period, typically 14 days.
Moving averages are also used in Technical Analysis, as it also represents the Momentum or value change in a timeframe N. Hence, moving averages help to understand the market trend and, like Momentum Indicators, allow to identify buy and sell signals from the historical data of a stock in a previously mentioned timeframe N. In this research, we have applied the simple moving average (SMA) and the exponential moving average (EMA) for timeframes of 5, 10, 20, 50, 100, and 200 days, so there will be indicators in different periods.
  • Simple Moving Average (SMA): it is an arithmetic moving average. It is calculated by adding the recent closing values of an action for a window of size N and dividing that sum by the size of the window. Thus, when the size of the timeframe N is low, it responds quickly to changes in the value of the stock; if the size of the window N is high, it responds more slowly.
    SMA = A 1 + A 2 + . . . + A n n
    where A n the price of an asset at period n and n is the number of total periods.
  • Exponential Moving Average (EMA): also called Exponentially Weighted Moving Average, since it weights recent observations, i.e., closing prices of a stock closer to the current one. It can be said that EMAs respond better than SMAs to recent changes in a share’s price.
    EMA Today = V a l u e T o d a y × S m o o t h i n g 1 + D a y s + E M A Y e s t e r d a y × S m o o t h i n g 1 + D a y s
    where EMA is the exponential moving average. The smoothing factor is calculated, as follows:
    Smoothing = 2 n + 1
    where n represents the number of periods the EMA uses.
Because both the algorithmic predictions and the results of the technical factor and moving average calculations result in the next closing value of a stock, the recommendation is based on identifying buy and sell signals based on the comparison of the predicted value with the value that the stock has at the current time.

3.1.5. Recommender System

Based on the results that are obtained from the forecasting and technical analysis systems, the Recommendation System design specification proceeds, in which the obtained results are weighted to identify buy/sell signals in order to be able to make a recommendation. Figure 8 shows the functionality of the Recommender System and, consequently, the process of signal extraction and the dependencies/relationships between it and the rest of the modules on which it depends.
The package design proposes the creation of a neutral system, which, based on the analysis of buy/sell signals, determines the action to be taken for/with a stock. This is intended to eliminate the burden of subjectivity.
In addition to the calculation of moving averages and technical analysis ratios, an analysis using regression algorithms is also included, as can be seen in Figure 8. Regression algorithms are used when a prediction is to be made on a continuous dataset. This is the case with the historical time series data of a stock. The output of the algorithm is a quantity that can be measured in a flexible way, depending on the inputs that are passed to the algorithm. Sorting algorithms would be limited to a set of labels.
Linear regression can be defined as an approach to modelling the relationship between a dependent scalar variable y, and one or more explanatory variables, named x. Mathematically, it is expressed in the form that is presented in Equation (13).
y i = β 0 + β 1 x 1
where the variable to be predicted y i is distinguished, as well as the constant β 0 , the slope β 1 , and the input variable x i . In the current scenario, given that a stock’s historical data set is available, the explanatory variable x gives the market opening values, and the target variable y gives the market closing values. Thus, the model input is x and the expected output y, where y is the dependent variable and x the independent variable, so that the market opening value conditions the market closing value.
The machine learning algorithms that are used by the system to predict the last (unknown) closing value, based on historical market data, from the last (known) opening value are:
  • Random Forest Regressor
  • Gradient Boosting Regressor
  • SVM-LinearSVR
  • MLP Regressor
  • KNNeighbors Regressor
These algorithms are applied using sklearn library (Python library that compiles machine learning algorithms) by means of cross-validation (a technique that is used to evaluate the results of a statistical analysis and ensure that they are independent of the partition between train and test data). In this way, the best hyperparameters of the algorithms can be determined and, thus, the best combination can be identified.
The results have generated a series of heat maps have been generated. The accuracy of the algorithm is represented by the hue. Lighter shading corresponds to a worse result, so darker areas indicate that the resulting hyperparameter combination is better. However, sometimes it is not known which is the best combination because the shades are very similar. The results of these combinations for each action are stored in a JSON file that will be used later by the platform when applying the models of the action prediction system. In this way, the result of applying the cross-validation of the hyperparameters to all of the stocks in the Spanish continuous market is a data file with the best hyperparameters and they are shown in the respective heat maps, to justify the decision. This allows for a more accurate decision to be made, as the user can compare the effectiveness of some hyperparameters against others.
Figure 9, Figure 10, Figure 11, Figure 12 and Figure 13 present the heat maps resulting from the cross-validation of BBVA’s historical data from the last five years. These figures represent the accuracy of the model with each combination of hyperparameters for the algorithms: MLPRegressor, SVMLinearSVR, RandomForestRegressor, GradientBoostingRegressor, and KNNNeighborsRegressor.
Once the evaluation process and the cross-validation of the algorithms have been completed, a graph showing the best algorithm has been drawn up. The top-25 equities of the Spanish Continuous Stock Market have been chosen. Figure 14 shows that the algorithms that best fit the proposed problem are SVM-LinearSVR and MLP Regressor. Thus, these algorithms are the ones that have the highest accuracy after being trained and tested with an 80/20 split of the dataset.

4. Platform Visualization

Finally, after detailing each of the software modules created, the description of the visualization platform follows as a deduction of the integration of the most relevant aspects of the rest of the modules, so that the end user can interact with the platform.
Therefore, the visualization platform takes up the conclusions of the research carried out in the rest of the modules, so that only two options are given at user level for visualization, either an overview as a result of the exploratory analysis of the data, or the result of the underlying recommender system.
In this way, the different phases or tools that are used for the development of the platform architecture are detailed, based on the results of the study of the rest of the modules.
It is worth mentioning that the development of a visualization platform only aims to bring the results closer to the user, without being the central part of the proposed system.
The result is a platform that provides a user interface for both data visualization, analysis, prediction, and investment recommendation. It has been determined that the platform will be developed using Django, as shown in Figure 15. Django is a Python framework for creating web services, in this case it has been used to communicate the back-end with the front-end. The web application created combines the use of Python for data management and communication, and HTML, CSS, and JavaScript for the visualization of both the platform and the data.
The design pattern used, called MVC (Model-View-Controller), focuses on the division of the web project according to the functionalities of each of its parts. However, Django does not use the MVC pattern, but rather the MVT (Model-View-Template), which is an abstraction of the MVC model. It is worth mentioning that Django works with templates, not with views, being oriented to the development of web applications, as explained in [14], where the author not only teaches aspects of using of Django, but it also lists the different design patterns that can be followed in order to structure to follow the web application to be developed.
The platform’s objective is not only to be usable and intuitive, but also to enable any user, whether an expert or not in the stock market, to abstract their own conclusions from the data and evaluate the information analyzed by the system. The created platform completely depends on the Python package developed for data extraction: investpy. The web platform initially shows a screen where the overview option is given on one side and the overview and recommendation option on the other (Figure 16). The overview functionality covers the extraction and basic visualization of the data. The system retrieves the company profile and the historical data for the last five years of the stock. On the basis of those data, it produces a series of representations:
  • Time series: offers a graphic representation of the retrieved historical data, where the X and Y axes represent the value of the stock in euros, and the date on which the stock reached that value, respectively.
  • Candlestick chart: this representation shows the opening and closing values for each date and the difference between the maximum and minimum values for the same date.
  • Data table: represents the available values. They are called OHLC (Open-High-Low-Close).
The Overview & Recommendation functionality is the same as the user input check, in that it also extracts the company profile and historical data. However, this functionality also includes technical factors and moving averages with the consequent buy/sell recommendation. The generated graphs are visualized on the platform, among them are graphs that compare the different algorithms that the system has applied to make the prediction. This enables the user to identify those that have had a better precision. The platform presents the conclusions abstracted from the resulting values. It shows the buy/sell recommendation that is based on those values. The process of prediction and recommendation made by the system is transparent to the user.
The novelties that are presented by the module are the graphs generated, in which a comparison between the different algorithms applied by the system to make the prediction can be observed, thus being able to contrast which one has had the best accuracy (Figure 17).
Additionally, there is an option that allows the user to observe which algorithms have been applied, what they consist of, and which hyperparameters have been used based on the results in the form of a heat map of the cross validation carried out by the system.
Once the justification of the regression algorithms used in the platform by the system has been shown, the results of the different algorithms applied are displayed, where the “best” algorithm (the one with better precision than the rest) is the one that shows its results by default (Figure 18). Even so, the platform gives the option of displaying different time windows and visualising the results of all the algorithms. Finally, the platform displays a paragraph, in which it indicates the conclusions drawn from the study of the values resulting from the prediction and, therefore, shows the buy/sell recommendation based on these values.
Therefore, the platform displays the recommendations based on the results of the prediction, which it will combine with the results of the financial technical analysis, which includes the calculation of moving averages and technical factors. Finally, the system calculates the technical factors, called Momentum Indicators, which indicate the market trend based on calculations taking different time windows (Figure 19).
In this way, the system not only makes the recommendation, but it also supports this recommendation and each of the predictions and calculations that give rise to it, with the data used throughout the process. Therefore, the prediction and recommendation process carried out by the system is transparent to the user at a technical level, so that the user is aware of what has happened in each of the stages of the process, being able to trust that the prediction has not been altered for the benefit of third parties, for example.

5. Discussion and Results

The conducted research provides an initial approach to data analysis and the combined use of Machine Learning algorithms and techniques, with traditional market analysis. Their use enables the proposed platform to arrive at conclusions regarding future market behavior. Thus, it can be concluded that, when Machine Learning algorithms are trained with a sufficiently large amount of data, it is possible to successfully predict the closing value on the basis of the current opening value of the market. Thus, after identifying buy and sell signals, it has been possible to create a system that recommends the user to buy, hold, or sell a stock at a certain time of day, according to the prediction obtained by the regression algorithms.
Although the recommender system operates well and meets the initial objectives of this study, system extensions will be considered in future research. The breadth of the platform in terms of functionalities was the most significant complication that arose during the research, therefore it was decided to approach it with a modular architecture. Thanks to the modular, highly scalable design it is possible to provide the system with more functionalities; the combination of Natural Language Processing (NLP) techniques could be used in an opinion mining process, the recommender system will be able to abstract the future market trend based on the sentiment analysis. In addition, the use of NLP techniques is also proposed for the classification of companies into sectors based on their company profiles, thus being able to group companies into sectors based on the description that each company in the Spanish continuous market proposes. Therefore, additional functionality must be added to the Python package that was created for the extraction of the Investing data, called investpy. The enhancement will consist of retrieving all the data provided freely by Investing.com. Additionally, a study of the algorithms applied to other markets should be carried out, as the proposed system is oriented towards a very specific market; the Spanish continuous market. It will be necessary to carry out a study to determine the best algorithms for the stock markets of each of the countries to be incorporated. It is considered to be viable given that all historical stock data previously go through a GridSearchCV, which consists in cross validating the optimal hyperparameters to be used by an algorithm from a specific dataset. In addition, further research is considered on event identifications that can be used to better choose the operation performed (buy/sell) and the social characteristics of the different communities [15,16].

Author Contributions

Conceptualization, E.H.-N., J.P.-D. and P.C.; Funding acquisition, E.H.-N.; Investigation, E.H.-N., J.P.-D. and P.C.; Methodology, S.R.-G. and J.M.C.; Software, P.C.; Supervision, S.R.-G. and J.M.C.; Writing—original draft, E.H.-N. All authors have read and agreed to the published version of the manuscript.

Funding

This research was partially Supported by the project “Computación cuántica, virtualización de red, edge computing y registro distribuido para la inteligencia artificial del futuro”, Reference: CCTT3/20/SA/0001, financed by Institute for Business Competitiveness of Castilla y León, and the European Regional Development Fund (FEDER). The research of Elena Hernández-Nieves is funded by Ministry of Education of the Junta de Castilla y León and the European Social Fund grant number EDU/556/2019.

Conflicts of Interest

The authors declare no conflict of interest.

References

  1. Atsalakis, G.S.; Valavanis, K.P. Surveying stock market forecasting techniques–Part II: Soft computing methods. Expert Syst. Appl. 2009, 36, 5932–5941. [Google Scholar] [CrossRef]
  2. Nicoletti, B.; Nicoletti, W.; Weis. Future of FinTech; Palgrave Studies in Financial Services Technology: Rome, Italy, 2017. [Google Scholar]
  3. Patel, J.; Shah, S.; Thakkar, P.; Kotecha, K. Predicting stock and stock price index movement using trend deterministic data preparation and machine learning techniques. Expert Syst. Appl. 2015, 42, 259–268. [Google Scholar] [CrossRef]
  4. Soni, S. Applications of ANNs in stock market prediction: A survey. Int. J. Comput. Sci. Eng. Technol. 2011, 2, 71–83. [Google Scholar]
  5. Yoo, P.D.; Kim, M.H.; Jan, T. Machine learning techniques and use of event information for stock market prediction: A survey and evaluation. In Proceedings of the International Conference on Computational Intelligence for Modelling, Control and Automation and International Conference on Intelligent Agents, Web Technologies and Internet Commerce (CIMCA-IAWTIC’06), Vienna, Austria, 28–30 November 2005; Volume 2, pp. 835–841. [Google Scholar]
  6. Taghavi, M.; Bakhtiyari, K.; Scavino, E. Agent-based computational investing recommender system. In Proceedings of the 7th ACM Conference on Recommender Systems, Hong Kong, China, 12–16 October 2013; pp. 455–458. [Google Scholar]
  7. Nair, B.B.; Mohandas, V. An intelligent recommender system for stock trading. Intell. Decis. Technol. 2015, 9, 243–269. [Google Scholar] [CrossRef]
  8. Del Canto, A. Investpy—Financial Data Extraction from Investing.com with Python. Available online: https://github.com/alvarobartt/investpy (accessed on 4 April 2020).
  9. Arora, N. Financial analysis: Stock market prediction using deep learning algorithms. In Proceedings of the International Conference on Sustainable Computing in Science, Technology and Management (SUSCOM), Amity University Rajasthan, Jaipur, India, 26–28 February 2019. [Google Scholar]
  10. Khaidem, L.; Saha, S.; Dey, S.R. Predicting the direction of stock market prices using random forest. arXiv 2016, arXiv:1605.00003. [Google Scholar]
  11. Pimprikar, R.; Ramachadran, S.; Senthilkumar, K. Use of machine learning algorithms and twitter sentiment analysis for stock market prediction. Int. J. Pure. Appl. Math. 2017, 115, 521–526. [Google Scholar]
  12. Edwards, R.D.; Magee, J.; Bassetti, W.C. Technical Analysis of Stock Trends; Routledge, Taylor & Francis Group: New York, NY, USA, 2018. [Google Scholar]
  13. Dash, R.; Dash, P.K. A hybrid stock trading framework integrating technical analysis with machine learning techniques. J. Financ. Data Sci. 2016, 2, 42–57. [Google Scholar] [CrossRef] [Green Version]
  14. Ravindran, A. Django Design Patterns and Best Practices; Packt Publishing Ltd.: Birmingham, UK, 2015. [Google Scholar]
  15. Di Girolamo, R.; Esposito, C.; Moscato, V.; Sperlí, G. Evolutionary game theoretical on-line event detection over tweet streams. Knowl. Based Syst. 2021, 211, 106563. [Google Scholar] [CrossRef]
  16. Mercorio, F.; Mezzanzanica, M.; Moscato, V.; Picariello, A.; Sperli, G. DICO: A graph-db framework for community detection on big scholarly data. IEEE Trans. Emerg. Top. Comput. 2019. [Google Scholar] [CrossRef]
Figure 1. Software system package diagram.
Electronics 10 00859 g001
Figure 2. Related Use Case Packages.
Electronics 10 00859 g002
Figure 3. Data extraction Package Design Specification.
Electronics 10 00859 g003
Figure 4. Best web scraping combination.
Electronics 10 00859 g004
Figure 5. Data Analysis Package Design Specification.
Electronics 10 00859 g005
Figure 6. Forecasting System Package Design Specification.
Electronics 10 00859 g006
Figure 7. Technical Analysis Package Design Specification.
Electronics 10 00859 g007
Figure 8. Recommender System Package Design Specification.
Electronics 10 00859 g008
Figure 9. MLPRegressor Hyperparameter Heat Map.
Electronics 10 00859 g009
Figure 10. SVM-LinearSVR Hyperparameter Heat Map.
Electronics 10 00859 g010
Figure 11. RandomForestRegressor Hyperparameter Heat Map.
Electronics 10 00859 g011
Figure 12. GradientBoostingRegressor Hyperparameter Heat Map.
Electronics 10 00859 g012
Figure 13. KNNeighborsRegressor Hyperparameter Heat Map.
Electronics 10 00859 g013
Figure 14. Best algortihm accuaracy for top-25 equities of the Spanish Continuous Stock Market.
Electronics 10 00859 g014
Figure 15. Django Design Architecture.
Electronics 10 00859 g015
Figure 16. Main view of the web platform.
Electronics 10 00859 g016
Figure 17. Prediction using regression algorithms.
Electronics 10 00859 g017
Figure 18. Regression Algorithms Accuracy Check.
Electronics 10 00859 g018
Figure 19. Buy/sell recommendations.
Electronics 10 00859 g019
Table 1. State of the art of AI applied to Stock investment recommendations.
ReferencesApproaches
[1]Stock forecasting through soft computing techniques. The authors concluded that ANNs and neuro fuzzy models were valid for predicting stock market values
[4]compiled various studies applying machine learning and artificial intelligence techniques
[5]Highlighted the need for historical stock market data after reviewing various machine learning techniques for stock prediction.
[3]The author provided a mixed approach that uses both machine learning algorithms and fundamental and technical analysis.
[6]The authors proposal mixed collaborative and content-based filtering techniques.
[7]The research concerns the use of a decision tree of technical indicators optimised by GA-SVM.
Publisher’s Note: MDPI stays neutral with regard to jurisdictional claims in published maps and institutional affiliations.

