1. Introduction
A person’s movement is considered a practical form of behavior associated with human activity and oriented toward a goal. Movement is an expression of changes in the position the entire body or body segments in space. The displacement movement of a subject is achieved via the complex cyclical activities of locomotion: walking and running.
Human locomotion is a mechanical process performed by a biological system, which through motor movements allows the body to move in the desired direction. This action is goal-oriented and involves information processing, and is a mechanical process of stepping performed by the human cognitive system. The term “step” refers to the periodic cycle of leg movements to move the body in a given direction. The term “posture” means a succession of geometric positions of the articulated segments of the human body at a given time. Some examples of poses are the supportive posture on one leg, support on both legs, and standing posture at rest. Definitions of walking regimes using intentions are as follows: the intention to leave a place, i.e., initiation of travel; the choice to maintain the same speed, i.e., constant movement; the intention to move faster, or accelerated walking control; the intention to move slower, or decelerated walking control; and the intention to stop, or initiation of stopping. In humans, the posture while walking can provide essential data through nonverbal communication. Psychological studies have also demonstrated the effects of body posture on emotions [
1]. The normal gait is represented by smoothness of function without any sign of impairment or impact on body parts. The average walking cycle is considered to have two phases: a stance phase, when the foot is in contact with the ground, and a swing phase, when the foot is moving forward in the air [
2]. Each person has a unique gait signature. Furthermore, various modes of walking are peculiar to certain diseases, and these modes are important diagnostic clues. The range of movements in the lower extremities assists in recognizing specific conditions and helps chiropractic doctors to determine postural changes resulting from an unnatural gait. Interestingly, the foot must change from a flexible structure at the beginning of the stance to a rigid lever at the push-off.
The phases of a human gait cycle are divided into seven or eight sub-phases after [
3,
4,
5]. The support phases are characterized by the presence of the foot on the ground and the balance phase, or the lack of contact with the ground (the foot is in the air). The second phase has the following subsequent sub-phases: the beginning balance, the middle balance, and the end of the balance. An example of several sub-phases of the human gait is determined by specific events (
Figure 1) and characterizes the human gait cycle. This is considered the rotation of the lower and upper part of a leg compared to the horizontal axes. In phase I, the outstretched leg moves backward before rising from the ground. In phases II and III, the two parts of the leg move in different directions.
In phase IV, the two parts of the leg begin to move in the same direction. In phase V, the foot touches the ground, and both sides are stretched forward. In all of these phases, the foot depicts different stages of walking, i.e., flexed when lifting, then returning to the ground.
This paper describes a system for identifying the phases of foot movements while walking using inertial measurement units (IMUs) and a resistive flex sensor (RFS). The aim was to recognize the subject based on their gait, in relation to future work for gait recovery. The paper is structured in eight sections. The current stage of the research is presented in
Section 2. Relevant background knowledge concerning the models used in this study is provided in
Section 3. The system description and target group presentation used in the experimental part of the project are detailed in
Section 4. The methods and results obtained in data processing are presented in
Section 5. The feature extraction methods of the data sensors are described in
Section 6. The discussions about the results and conclusion are detailed in
Section 7 and
Section 8.
2. Related Work
A large number of studies have been conducted on human locomotion. Different approaches have been used. The processing of temporal patterns and kinematics has been the most common type of study. The methods used to research gait analysis are presented by Wen Y. et al. [
6]. This paper compares knee kinematics based on different marker sets on the tibia, computed by segmental optimization (SO) and multi-body optimization (MBO) algorithms, to assess the effect of marker locations on the forms.
A multitude of kinematic measures using different marker sets among sites participating in a collaborative study is necessary for determining the reliability of multi-site gait analysis research. The MBO method is applied to the different marker sets when three-dimensional gait analysis data are shared and interpreted among sites for clinical decision-making. The marker sets of the conventional gait model (CGM) based on the Newington Children’s Hospital model [
7] and Helen Hayes model [
8] are adopted for clinical gait analyses [
9], in which markers placed on the anatomical location are studied accurately [
10]. The markers are replaced with sensors that give additional information about the movement. One such sensor is the RFS, which is used to measure bending or flexing. In particular, the RFS has been placed in shoes and communication data sent to a computer via Wi-Fi to detect dance movements [
11]. RFSs have been demonstrated as being useful in systems dedicated to tracking human movements, both in upper and lower limbs, and in the head and torso [
12].
A mobile phone is equipped with many sensors, such as accelerometers, magnetometers, inclinometers, and thermometers. Various open-source applications can be installed to read and compute the sensor data acquired [
13,
14]. A modern phone has many uses in addition to calling, such as listening to music. The phone can be used to monitor the elderly or disabled. Mobile phones also have built-in IMUs, which are used in various applications for identification of hand movements during writing [
15] and subject recognition using gait movement [
16,
17]. In the current study, the collected data were sent in real-time via Bluetooth or the Internet to a computer or saved in the phone’s memory. The software application used in the project for data acquisition was Physics Toolbox, an open-source development environment for Android. This program incorporates toolboxes for the following sensors: linear accelerometer, magnetometer, inclinometer, gyroscope, GPS, and tone generator. Data are displayed and saved in csv format in the phone and can be sent to Google Drive (i.e., the cloud). The record functions can choose one or more of the above sensors to collect data at the same time. In this study, the software saved the data of the IMU sensors to record the leg movement during the gait. The proposed system uses the sensors commonly found in a mobile phone, which is a device owned and used by most people. Data can be purchased in the cloud for processing and classification, and the results can be viewed directly on the phone or computer. Thus, medical staff can use the system to remotely correct the gait of subjects. Because the classification algorithms used are based on machine learning, the system can be adapted for various applications. The analysis of the patient’s posture is useful for all branches of medicine, because posture is an overall indicator of health. The postural analysis system is a means of reaching a correct diagnosis and preventing various postural deficiencies (kyphosis, scoliosis, and hyperlordosis). The proposed system can be used in the analysis of posture while walking, assisting analysis both in terms of remote diagnosis methods and the use of this system at home and outside medical clinics.
3. Signal Filtering and Features Extraction Method
The data acquired from the sensors were filtered using the
Savitzky–
Golay (SG) filter. This filter was chosen because is a digital filter that helps smooth a set of digital data points. This filter has the advantage of maintaining the signal tendency and increasing the accuracy without changing its shape. Smoothing is done by convolution, via mounting successive subsets of adjacent data points with a low degree polynomial by the method of least linear squares. Equation (1) defines the general filter equation, according to Savitzky and Golay [
18]. The particular behavior of the filter is influenced by choosing appropriate filter coefficients.
Note:
—coefficient according to the expression;
—independent variable;
—observed value;
—convolution coefficients (number of data points used for the smoothing);
—standardization factor.
The extraction of the signal characteristics consists of identifying the shape of the signals using kurtosis and skewness.
The asymmetry coefficient (skewness) expresses the degree of asymmetry of a distribution [
19]. The theoretical normal distribution is determined, in the sample, by Equation (2):
where the definition is based on the 3rd order centered moment (
CAS).
If was positive asymmetry, the distribution tail is more extended to the right, in series the small values predominate (average > median);
If is a negative asymmetry, the tail of the distribution is longer to the left, in series the large values predominate (average < median);
If , it is a perfectly symmetrical series;
If differs significantly from the normal distribution, data transformation is recommended (the values of the variable are logarithmic, thus obtaining an approximately normal distribution).
The coefficient of vaulting or flattening (kurtosis) is a measure of the scattering of each observation around a central value (
CBA) [
19]. It is determined, in the sample, by Equation (4):
where the definition is based on the moment cantered on the 4th order.
If is a leptokurtic distribution, the values of the variable are concentrated around the indicators of the central tendency;
If is a platykurtic distribution, the values of the variable are dispersed around the indicators of the central tendency;
If is a mesokurtic distribution, it is the normal distribution.
3.1. Linear and Non-Linear Discriminant Analysis
One of the classification methods used to test the described system is the analysis of data with a linear and square discriminant function, known as discriminant analysis [
20]. Discriminant analysis is a classification method using different classes based on different Gaussian distributions.
A classifier is a system that calculates K discriminant functions fi(x), 1 ≤ I ≤ K and selects the class corresponding to the maximum discriminant function. Decision areas separate the region’s classes. The classification procedure by discriminant analysis must find one or more mathematical rules or discriminant functions. The sets of linear combinations of relevant quantitative variables differentiate classes from each other.
Classification is performed by parametric or non-parametric methods. It generates discriminant linear or square functions. For the first type of discriminant function, the covariance matrices within the class are assumed to be equal. For the second type, they are assumed to be unequal. When the distribution in each group is not assumed to have a specific distribution, non-parametric methods are used to choose the classification criterion. In the classification that uses discriminant analysis, the problem is to find the linear or nonlinear discriminant function. The coefficients of the discriminant functions, after their type is chosen, are adjusted through the learning process considering all possible input cases.
If the discriminant functions are linear, the decision surfaces are hyperplanes. The decision hyperplane contains the middle of the segment connecting the centers of gravity of the groups and is perpendicular to the difference vector between the class patterns.
3.2. Classification and Clustering
In the classification task (definition), a set of labeled points is known and used to classify some unlabeled points [
21,
22].
The classification method is used to build classification models from input data, knowing the output classes. The classification techniques used to identify the gait subject signature are decision tree classifiers, rule-based classifiers, nearest neighbor classification (KNN), support vector machines (SVM), and naive Bayes classifiers. They are also used to solve a classification problem [
23,
24,
25]. For each of these classification techniques, a learning algorithm is adopted to identify a model that best fits the relationship between the set of attributes and the class label of the input data. The objective of the adaptive algorithm is to design a predictive model that accurately predicts the class of unknown data. The decision tree classifier is a classification technique based on a question about the attribute of a test record [
26]. KNN [
27] is a method based on the distance between the nearest neighbors, in addition to their number, and is used as a reference for the next initialization. SVM [
28] is an area method that separates data class plans. Naive Bayes classifiers track multiple Gaussian distributions to make additional independent assumptions [
29].
The classification techniques presented above were applied to the data collected and processed to determine if they can correctly identify a subject based on the leg movement during their gait.
The signal feature extraction proprieties are achieved before the classification [
30]:
Peak analysis: identification of dominant frequencies;
Pulse and transition metrics: deriving signal characteristics;
Spectral measurements: such as signal power and mean frequency.
4. System and Experiment Description
The presented system is designed for gait monitoring using IMU sensors of cell phones and RFSs of an Arduino. The input consists of three parameters based on roll angles of the IMU sensors from mobile phones and angles of the RFS.
The IoT system is composed of two mobile phones placed on the back of the left femur at an equal distance from the knee and the RFS placed on the foot (
Figure 2). The data from the phone sensors are loaded via the phone to Google cloud and recovered on the server (laptop).
The tests are performed using different subject characteristics, such as height, age, sex, and weight. The open-source Physics Toolbox software for Android is used to acquire data with the mobile phones. This application allows the acquisition in real time of the angle data from the IMU phone sensors in three axes: pitch, azimuth, and roll (
Figure 3). The data are saved on the phone in csv format and on the phone cloud. The RFS sends data via the Arduino Mega board to the computer using the LabVIEW interface. The RFS data are recorded in .csv format for processing. The resolution of data converted from analog to digital is 10 bits. The RFS data are directly converted in degrees in Arduino code. The two mobile phones are used to monitor the upper and lower part of the leg movement.
Only the roll of the IMUs sensors is used in the processing data. The RFS gives information about the contact angle of the heel with the ground. All of the signals are filtered before analysis. Filtering eliminates high- and low-frequency interference while maintaining useful signal content. The subjects of the target group walked with the acquisition system placed on the left leg, at their physiological speed on a flat surface, with regular shoes, known as “comfortable walking.” The leg movement during walking was monitored using the degree of inclination of the left foot during the three-point walk. All data were filtered before the processing stage. Each subject walked 180 m in the established place in rectangular form (
Figure 4).
The subjects repeated the test two times. The target group involved six volunteers, three women, two men, and a child (notes S1–S6). The main general characteristics that influence the gait postures of the subjects are presented in
Table 1. The position of the phone was calculated as the ratio between the size of the foot and the distance from the knee to the location of the device. This ratio is represented as a percentage (%).
5. Data Processing
In the first stage of data pre-processing, a filtering of the signals, was achieved using two types of filters: a low pass filter and SG (
Figure 5). The filter that best approximated the initial signal was SG. All purchased signals will be filtered with SG. After filtering, the peak-to-peak signals were identified to find a gait characteristic for each subject.
Figure 6 shows the detected peaks of the RFS data for all of the subjects used in the experiment. The peaks are observable (marked) in the signals when the test subject changed the gait direction. The surface used was flat. We can observe that, because the amplitude of the signal is different for each subject, the leg movement depends on the height and leg length.
The signals, after filtering, were windowed in 100 samples for feature extraction. After the filtering signal, it was synchronized using the three independent systems by identifying the first peak of each set of data and defining this point as the beginning of the experiment [
31]. The frequency band, for the normal gait, is in the 0.5 Hz–3 Hz band. The block diagram of the data analysis steps is presented in
Figure 7. The signal features of sensor signals were used to train the model for subject recognition.
6. Feature Extraction and Classification Results
6.1. Feature Extraction and Analysis
The shapes of signals were analyzed and compared before feature extraction. The signal shape of the lower mobile phone placed on the leg during the gait is presented in
Figure 8. A periodicity of gait and equal amplitudes can be observed for the two critical phases of the leg balance. The angles measured with the two phones are different from the horizontal axis. Although the upper leg achieves a positive angle, the lower leg achieves a negative angle (
Figure 9). The peaks detected show the kurtosis and skewness functions (integrated into MATLAB™) and allow us to evaluate the changes in the data passing through the SG filter. The kurtosis function indicates by a coefficient without a unit, showing how the values of the data are distributed compared with a normal distribution. The more the value deviates from 0, the less the distribution follows an ordinary law.
The values obtained show that the distributions of the filtered values are closer to the normal distribution. The skewness coefficient indicates the symmetry of the data set.
We perform the first statistical analysis of the skewness and kurtosis parameters of all the filtered signals. Using an Excel file (
Table 2), these values were compared according to each characteristic of the subject. The subjects have a distinct gait behavior that can be observed in
Table 3.
When the subject’s left foot was in contact with the ground, a single peak was counted over two steps. Initially, we changed the min-width and MinProminence parameters, but the peak detection was not located at the highest peaks but the widest. Therefore, we decided to focus only on the MinProminence parameter. The step number and the walking frequency were computed for each subject (
Table 3). The frequency varied as a function of the subject. The step numbers for the same distance traveled depends on the heights and the leg dimensions.
A step is considered the distance between two detected peaks.
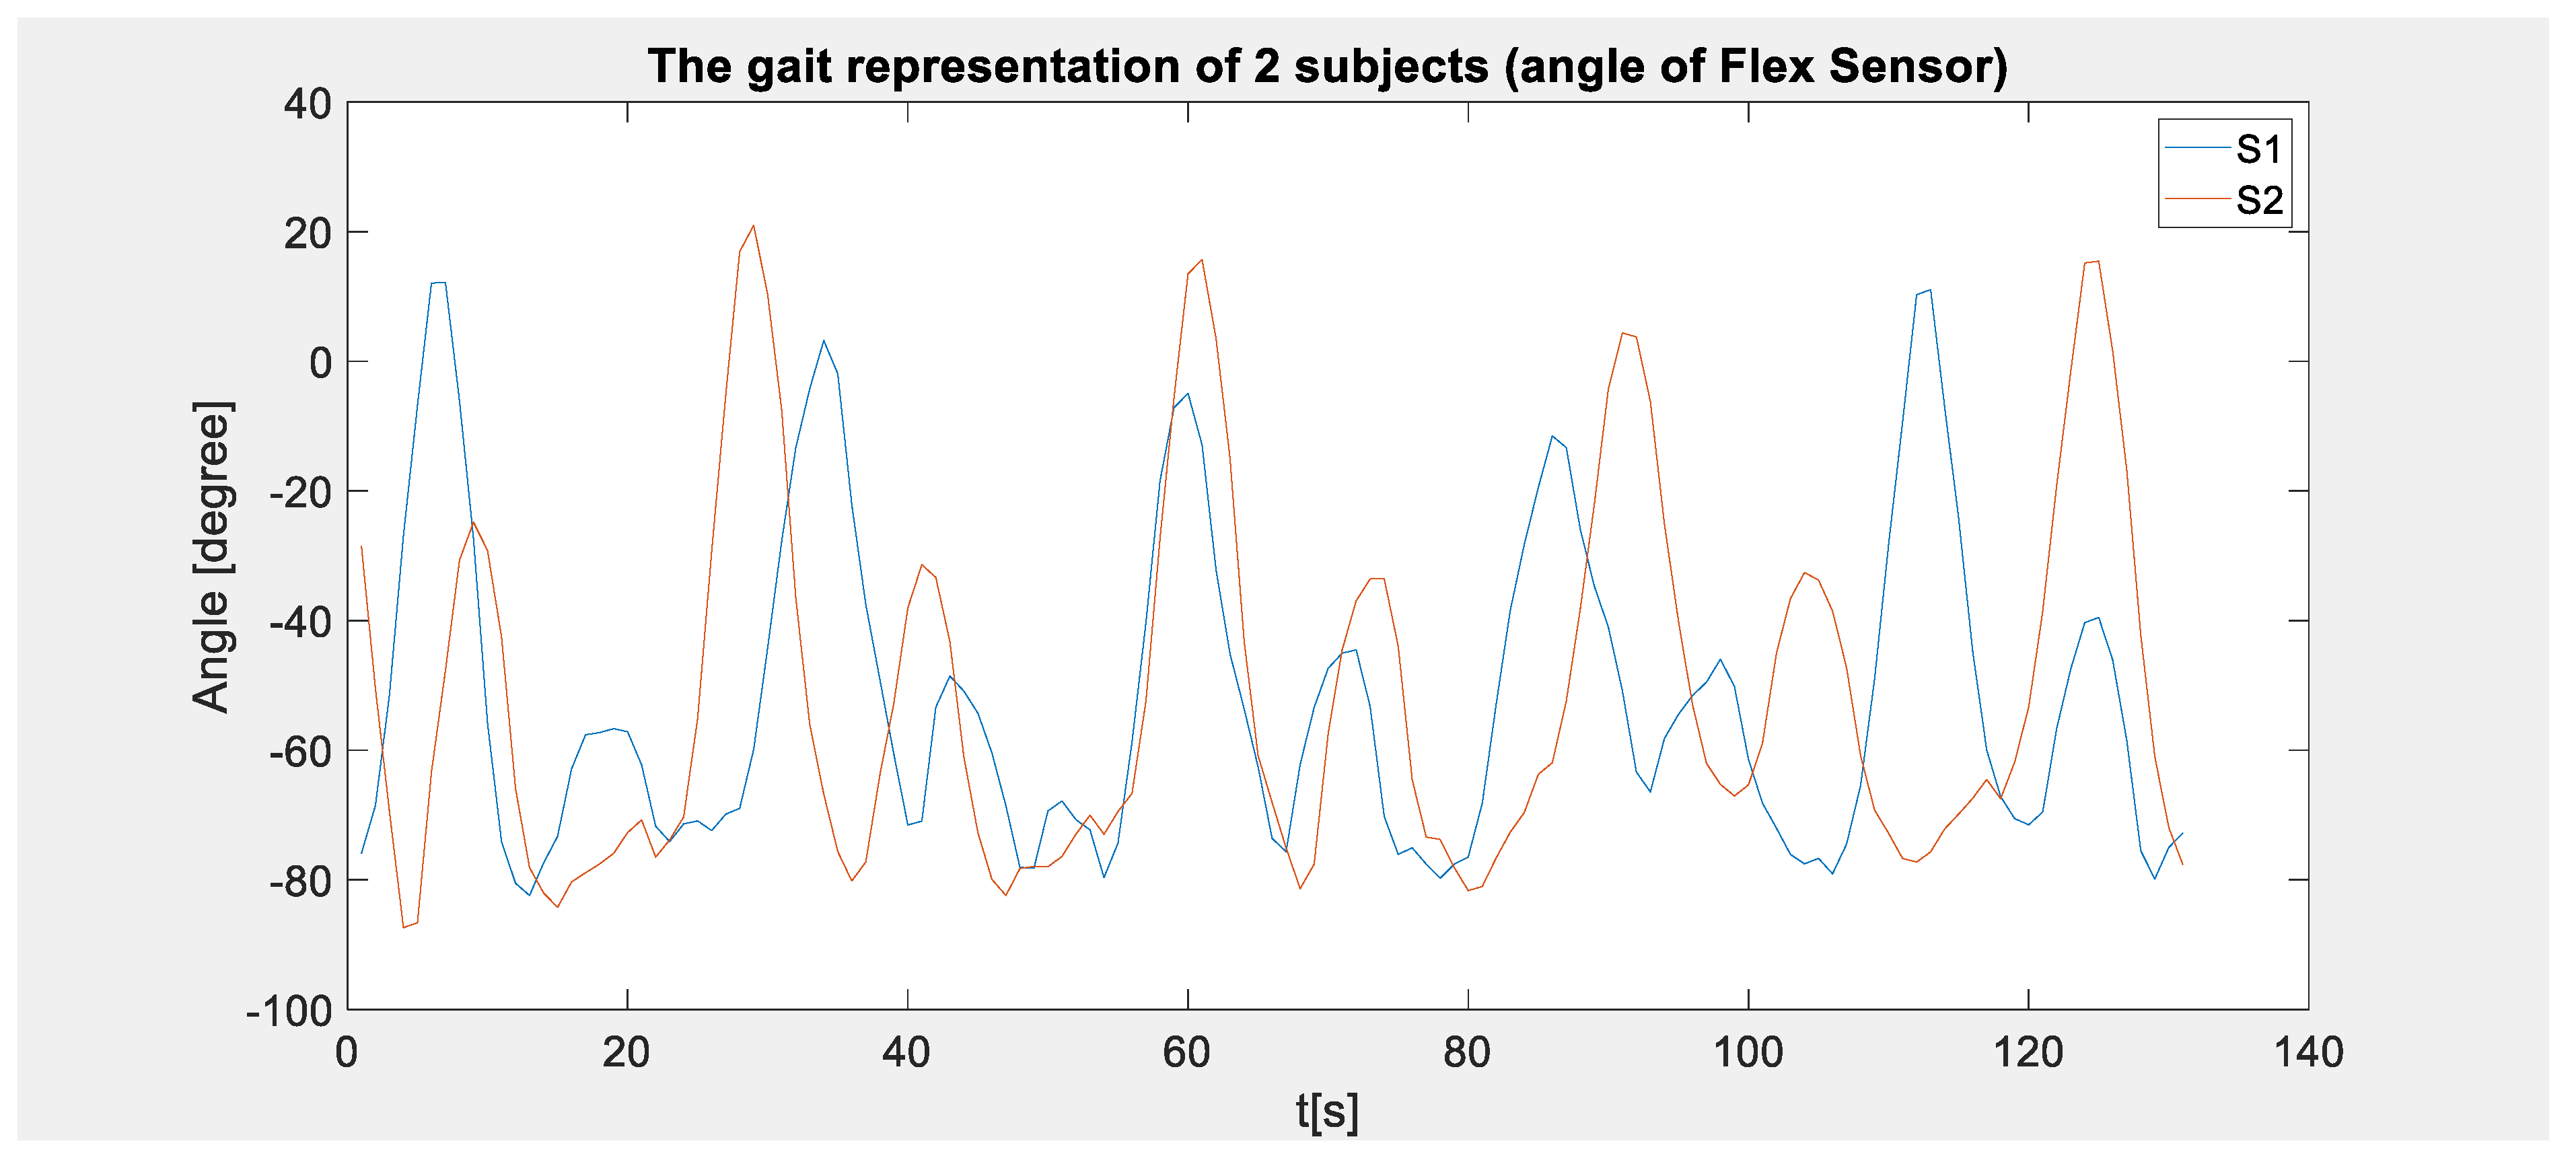
Figure 10 shows the signals collected from a child (S1) and a woman (S2). The amplitudes of the movements and the distances between the peaks were different, helping us make the first classification of gait according to the height of the subjects. The step period of time was 55−80 s for S1 and 15−45 s for S2. The gait began with the big peak and finished after the small peak. The step was initiated with the heel on the ground and finished with the same heel on the ground.
The distances between the peaks for three subjects (S1, S2, S3) are presented in a histogram. In this case, the height of the subject is essential (in
Figure 11, the three subjects are women). Continuing the analysis of the data collected with the two phones from the same issue, we can observe that the distance between the peaks is the same (
Figure 12). The data collected with the three sensors led us to the same observations presented above.
Figure 12 presents the time interval between two peaks. This feature was computed for the same subject using two phone signals. The time interval between steps depends on the size of the subject.
Following this classification, an attempt was made to extract additional detailed signal characteristics. The results were used as input parameters in a classification system using various algorithms. The signal was divided into windows of 100 samples that yielded nine characteristics of the subject. Using the algorithms for feature extraction from MATLAB™, the nine input parameters presented below were obtained. Each line represents the result of the feature extracted from 100 samples. The number of samples collected is important. For each subject there were over 7000 samples/sensor and per test. The signal features used as inputs in the classification system were zero mean (Mean1R1), standard variation (StdR1), skewness (SKSkewnessR1), kurtosis (KurtosisR1), root mean square (RMSR1), mean (Mean2R1), maxima (MaxR1), and covariance and power band (spectAR1 and pR1). The data processed were the features from the RFS signals. A total of 729 datapoints were used for training and 981 for testing. These numbers represent the signal features extracted after the preprocessing step.
6.2. Classification of Signal Features
Using the classification methods presented in
Section 3, we classified the features extracted from the signals, considering the classes of the subject (S1–S6). In this case, using the supervising classification technique, the subjects can be recognized by their gait style.
The first classification was achieved using only the peak distance of signals as an input parameter for three subjects (S1, S3, S5;
Table 4). The subjects were a child, a woman, and a man, labeled 1, 2, and 3, respectively. Using a decision tree algorithm and KNN, the results were 90.9% for the tree and 90.7% for KNN, representing adequate identification of the subject as a function of the step characteristic.
The results classification was more significant at 90%, so we can observe that the step distance is a personal characteristic. A tall subject can have a small step or a shorter subject can have a large step.
Table 4 presents the results of RFS feature classification using a number of algorithms. This classification is used for three subjects, namely, a child, a woman, and a man (S1, S3, and S5, respectively), to check for differences between them.
The KNN classification algorithm was tested using only five features (zero mean (Mean1R1), root mean square (RMSR1), covariance, and power band (spectAR1 and pR1)) for RFS of the same subjects. The results presented show that the sensors placed on the shoe provided information about the step signature with a precision greater than 90%. The RFS angle provided information about the subject’s gait-leg movement during the walk. Thus, the system can be improved with smaller and independent devices.
7. Discussion
The results of the analysis presented above are encouraging for subject signature identification using gait. The RFS provides information about the angle contact achieved by the foot with the ground. The classification algorithm used with different functions presented accuracy as high as 90% in the training and testing steps. The KNN technique was used in classification and provided a good response to the group correlation.
Table 4 presents the results of the training KNN algorithm for the three sensor features described in
Section 3. The accuracy of the IMU is smaller than that of the RFS. The sensor of the mobile phone on the upper part of the leg is AuL (Application upper Leg), and that on the lower part is AlL (Application lower Leg). The limitations of the system are due to the mobile phone dimensions.
The sensors placed behind the leg were not used in the subject characteristic gait because the angle of leg movement is not constant throughout the gait.
The average result of classification was 93.8% using the described RFS data features. The classification result of the gait using the mobile phone was 58.88% for the upper part of the leg and 72.38% for the lower part (
Table 5). The output of sensors placed on a person highly depends on where on the body the sensor is located. The results were generally better when using data from the sensor worn on the foot. Data collection using a mobile phone is unwieldy due to its size and weight, which influences the walking style. Thus, the mobile phone system can be replaced with smaller sensors so as not to influence the gait.
The next prototype of the proposed system will use IoT technology to allow medical staff to supervise the subject remotely. Wearable sensors for balance and gait assessments are implemented in movement disorder clinics to produce a vast amount of information for assisting diagnosis, and monitoring people with gait disorders and gait rehabilitees. The IoT system can be improved with small sensors that can be included in clothes. The sensors proposed are RFS, IMUs (MPU6050), and muscle sensors (
Figure 13). The Myoware muscle sensor is a sensor that records muscle contractions in the area where it is located. The sensors are connected to an Arduino MKR WiFi 1010 board. The battery pack is connected to the MKR WiFi 1010 and is used to power the system. These provide system independency. Using an account on the Arduino IoT Cloud, the data are recorded in real time to the cloud. The on-board NINA-W10 module provides the WiFi communication. The collected sensor data are used to create ML (Machine Learning) datasets.
The proposed method will be improved with non-wearable sensor-based systems, such as vision-based detection methods that can detect the human skeleton [
32,
33,
34,
35,
36]. Our solution enables real-time data monitoring. The data will be processed using Python open-source software. This solution replaces direct contact between the subject and medical person for diagnosis and assessment of the gait.
8. Conclusions
This study aimed to design a system for identification of a person based on their gait style. The system can identify incorrect or correct postures. The human pose can also provide important information through nonverbal communication. The stance gives information about the subject signature. This system can be used for gait recovery. Although most patients desire to rehabilitate their locomotion, the energy cost of crutches is high and, in general, the recovery process is successful for those who are not overweight and in good physical condition. As with other recovery goals, walking training is influenced by the patient’s physical development, age, gender, medical history, and, perhaps most importantly, motivation. Regardless of their condition, patients are encouraged to stand to prevent contracts that may develop in the lower limbs; prevent the development of osteoporosis in the long bones, thereby reducing the risk of pathological bone fractures; stimulate circulation; reduce spasticity; and improve renal function. The purpose of all gait recovery devices is to increase the independence of patients by controlling the gait, transmitting body weight, and providing support. In general, the higher the degree of disability, the more complex the walking device that is needed.
In the experimental section, we identified subjects’ gaits using two mobile phones and an RFS sensor. In the study, the target group were children, men, and women of different height and ages. We measured the gait difference between these three subject types to observe the difference between the style steps. After the data analysis, we obtained a difference in the leg movement and leg contact with the ground, which are the characteristics of each person concerning gait signature. The complete results were obtained from the RFS, which provided information about the angle of the foot with the ground during the gait. Using the classification algorithm, accuracy over 92% was obtained from the RFS, and the sensor placed on the lower part of the leg yielded results over 72%. The results of the analysis presented above are highly encouraging for subject signature identification using the gait. Using the features extracted from the accelerometers placed on the upper and lower parts of the leg, we aim to identify subjects using machine learning algorithms.
The current study demonstrated classification using machine learning models and traditional logistic regression for the human gait dataset. The limitation of leg movement is due to the dimensions of the mobile phone, which influence the data acquired. In conjunction with an additional validation system, a data-driven approach using machine learning techniques may provide a more efficient diagnostic and prognostic tool that can aid physicians’ decision-making processes.
Author Contributions
Conceptualization, M.H., O.G., A.G.A.; methodology, M.H., and A.G.A..; software, A.G.A. and M.H.; formal analysis, M.H. and O.G..; investigations M.H., O.G., A.G.A.; resources, M.H.; data analysis M.H., O.G., A.G.A., D.G., K.S. Writing—original draft preparation, M.H., and A.G.A.; writing—review and editing, M.H., O.G., A.G.A., D.G. and K.S.; supervision, O.G. All authors have read and agreed to the published version of the manuscript.
Funding
This research received no external funding.
Data Availability Statement
The data set used in this retrospective database study was collected as part of routine patient care after the patient’s consent.
Conflicts of Interest
The authors declare no conflict of interest.
References
- Davis, R.B.; Ounpuu, S.; DeLuca, P.A. Analysis of Gait. Biomedical Engineering Fundamentals. In The Biomedical Engineering Handbook, 3rd ed.; Printed in the United States of America; Taylor & Francis: Abingdon, UK, 2006; pp. 52–55. [Google Scholar]
- Xu, C.; He, J.; Zhang, X.; Wang, C.; Duan, S. Template-Matching-Based Detection of Freezing of Gait Using Wearable Sensors. In Proceedings of the 2017 International Conference on Identification, Information and Knowledge in the Internet of Things, Qufu, China, 19–21 October 2017; Elsevier: Amsterdam, The Netherlands, 2018; Volume 129, pp. 1–27. [Google Scholar]
- Thorstensson, A.; Nilsson, J.; Carlson, H.; Zomlefer, M.R. Trunk Movements in Human Locomotion. Acta Physiol. Scand. 1984, 121, 9–22. [Google Scholar] [CrossRef] [PubMed]
- Thorstensson, A. How is the Normal Locomotor Program Modified to Produce Backward Walking? Exp. Brain Res. 1986, 61, 664–668. [Google Scholar] [CrossRef] [PubMed]
- Nilsson, J.; Thorstensson, A.; Halbertsma, J. Changes in Leg Movements and Muscle Activity with Speed of Locomotion and Mode of Progression in Humans. Acta Physiol. Scand. 1985, 123, 457–475. [Google Scholar] [CrossRef] [PubMed]
- Wen, Y.; Huang, H.; Yu, Y.; Zhang, S.; Yang, J.; Ao, Y.; Xia, S. Effect of Tibia Marker Placement on Knee Joint Kinematic Analysis. Gait Posture 2018, 60, 99–103. [Google Scholar] [CrossRef] [PubMed]
- Davis, R.B.; Õunpuu, S.; Tyburski, D.; Gage, J.R. A Gait Analysis Data Collection and Reduction Technique. Hum. Mov. Sci. 1991, 10, 575–587. [Google Scholar] [CrossRef]
- Kadaba, M.P.; Ramakrishnan, H.K.; Wootten, M.E. Measurement of Lower Extremity Kinematics during Level Walking. J. Orthop. Res. 1990, 8, 383–392. [Google Scholar] [CrossRef] [PubMed]
- Pinzone, O.; Baker, R.; Schwartz, M.H. The Comparison of Normative Reference Data from Different Gait Analysis Services. Gait Posture 2014, 39, S41–S42. [Google Scholar] [CrossRef] [Green Version]
- Gorton, G.E.; Hebert, D.A.; Gannotti, M.E. Assessment of the Kinematic Variability among 12 Motion Analysis Laboratories. Gait Posture 2009, 29, 398–402. [Google Scholar] [CrossRef] [PubMed]
- Topper, D.; Swendsen, P.V. Wireless Dance Control: Pair and Wisear. In Proceedings of the 2005 Conference on New Interfaces for Musical Expression, Vancouver, BC, Canada, 26–28 May 2005; pp. 76–79. [Google Scholar]
- Saggio, G.; Riillo, F.; Sbernini, L.; Quitadamo, L.R. Resistive Flex Sensors: A Survey. Smart Mater. Struct. 2015, 25, 013001. [Google Scholar] [CrossRef]
- Cui, Y.; Zhang, Y.; Huang, Y.; Wang, Z.; Fu, H. Novel WiFi/MEMS Integrated Indoor Navigation System Based on Two-Stage EKF. Micromachines 2019, 10, 198. [Google Scholar] [CrossRef] [PubMed] [Green Version]
- Larnder, C.I. A Purely Geometrical Method of Determining the Location of a Smartphone Accelerometer. Phys. Educ. 2019, 58. [Google Scholar] [CrossRef]
- Hnatiuc, M.; Iov, C.; Savin, B. Emotion Identification Using Writing System. In Proceedings of the 2018 IEEE 24th International Symposium for Design and Technology in Electronic Packaging (SIITME), Iasi, Romania, 3 January 2019; pp. 9–12. [Google Scholar]
- Hnatiuc, M.; Paun, M.; Lafeuille, A. Subject Identification Using Walking Posture. In Proceedings of the 2019 International Conference on Speech Technology and Human-Computer Dialogue (SpeD), Timisoara, Romania, 10–12 October 2019. [Google Scholar]
- Hnatiuc, M.; Paun, M.; Dussart, J. Path Recognition Using Mobile Phone. In Proceedings of the 2019 International Conference on Speech Technology and Human-Computer Dialogue (SpeD), Timisoara, Romania, 10–12 October 2019. [Google Scholar]
- Schafer, R.W. What Is a Savitzky-Golay Filter? [Lecture Notes]. IEEE Signal Process. Mag. 2011, 28, 111–117. [Google Scholar] [CrossRef]
- Nancy, E. Añez-Tandang, Statistical Description of Data, Chapter 14. Available online: https://www.ucl.ac.uk/~rmjbale/Stat/recipies.pdf (accessed on 1 April 2021).
- Johnson, R.; Wichern, D.W. Applied Multivariate Statistical Analysis; Pearson Prentice Hall, Ed.; Pearson Prentice Hall: Hoboken, NJ, USA, 2007; ISBN 0-13-187715-1. [Google Scholar]
- Geman, O.; Zamfir, C. Nonlinear Dynamics Parameters and K-Means Clustering Algorithm Used in DBS Treatments Analysis Results. In Proceedings of the 6th European Conference on Intelligent Systems and Technologies, Iasi, Romania, 7 October 2010; Volume 10, pp. 7–9. [Google Scholar]
- Ionescu, V.; Hnatiuc, M. Fetal Heart Rate Detection and Monitoring from Noninvasive Abdominal ECG Recordings. In Proceedings of the 2015 E-Health and Bioengineering Conference (EHB), Iasi, Romania, 19–21 November 2015; pp. 1–4. [Google Scholar]
- Geman, O.; Turcu, C. Partitioning Methods Used in DBS Treatments Analysis Results. In Proceedings of the 2011 International Joint Conference on Neural Networks, San Jose, CA, USA, 31 July 2011–5 August 2011; pp. 1788–1793. [Google Scholar]
- Hnatiuc, M. The Algorithms of the Body Signature Identification. In Fuzzy Systems Book; Azar, A.T., Ed.; InTech: Cairo, Egypt, 2010. [Google Scholar]
- VanderPlas, J. Python Data Science Handbook; O’Reilly Media: Newton, MA, USA, 2017. [Google Scholar]
- Du, W.; Zang, Z. Building Decision Tree Classifier on Private Date. 2002. Available online: https://dl.acm.org/doi/proceedings/10.5555/850782 (accessed on 1 February 2021).
- Hastie, T.; Tibshirani, R. Discriminant Adaptive Nearest Neighbor Classification and Regression. Available online: https://proceedings.neurips.cc/paper/1995/file/fe709c654eac84d5239d1a12a4f71877-Paper.pdf (accessed on 1 October 2014).
- Awad, M.; Khanna, R. Support Vector Machines for Classification. Effic. Learn. Mach. 2015, 39–66. [Google Scholar] [CrossRef] [Green Version]
- Berrar, D. Bayes’ Theorem and Naive Bayes Classifier. In Encyclopedia of Bioinformatics and Computational Biology; Elsevier: Amsterdam, The Netherlands, 2016; Volume 1, pp. 403–412. [Google Scholar]
- Hnatiuc, M.; Belconde, A.; Kratz, F. Location of a Person Using Sensors’ Network. In Proceedings of the Artiped 2010, Publicat in Advanced Technologies for Enhancing Quality of Life (AT-EQUAL), Iasi, Romania, 15–19 July 2010; pp. 301–305. [Google Scholar]
- Coviello, G.; Avitabile, G. Multiple Synchronized Inertial Measurement Unit Sensor Boards Platform for Activity Monitoring. IEEE Sens. J. 2020, 20, 8771–8777. [Google Scholar] [CrossRef]
- Costin, H.; Geman, O. Tremor and Gait Screening and Rehabilitation System for Patients with Neurodegenerative Disorders. In Automatic Control and Computer Science; Iasi, Romania, 2013; Volume 59, Available online: http://www.ace.tuiasi.ro/users/103/043-056_3_Geman_.pdf (accessed on 1 February 2021).
- Galna, B.; Barry, G.; Jackson, D.; Mhiripiri, D.; Olivier, P.; Rochester, L. Accuracy of the Microsoft Kinect Sensor for Measuring Movement in People with Parkinson’s Disease. Gait Posture 2014, 39, 1062–1068. [Google Scholar] [CrossRef] [PubMed] [Green Version]
- Brezulianu, A.; Geman, O.; Zbancioc, M.D.; Hagan, M.; Aghion, C.; Hemanth, D.J.; Son, L.H. IoT Based Heart Activity Monitoring Using Inductive Sensors. Sensors 2019, 19, 3284. [Google Scholar] [CrossRef] [PubMed] [Green Version]
- Hagan, M.; Geman, O. A Wearable System for Tremor Monitoring and Analysis. Proc. Rom. Acad. Ser. A 2016, 17, 90–98. [Google Scholar]
- Bhagya, S.M.; Samarakoon, P.; Sirithunge, H.P.C.; Muthugala, M.A.V.J.; Muthugala, J.; Buddhika, A.G.; Jayasekara, P. Proxemics and Approach Evaluation by Service Robot Based on User Behavior in Domestic Environment. In Proceedings of the 2018 IEEE/RSJ International Conference on Intelligent Robots and Systems (IROS), Madrid, Spain, 1–5 October 2018; pp. 8192–8199. [Google Scholar]
Figure 1.
Phases of the left leg during the gait for one step considering the leg contact with the ground: 1—upper part of the leg; 2—lower part of the leg.
Figure 1.
Phases of the left leg during the gait for one step considering the leg contact with the ground: 1—upper part of the leg; 2—lower part of the leg.
Figure 2.
Block diagram of the gait monitoring system.
Figure 2.
Block diagram of the gait monitoring system.
Figure 3.
The data collected with the mobile phone in Physics Toolbox.
Figure 3.
The data collected with the mobile phone in Physics Toolbox.
Figure 4.
Picture of the sensors used in the experiment. The Physics Toolbox interface is presented in the second picture.
Figure 4.
Picture of the sensors used in the experiment. The Physics Toolbox interface is presented in the second picture.
Figure 5.
Real signal (red) and filtered signal with low pass filter (blue) and SG (green).
Figure 5.
Real signal (red) and filtered signal with low pass filter (blue) and SG (green).
Figure 6.
Signals acquired from all subjects using filtered resistive flex sensor (RFS).
Figure 6.
Signals acquired from all subjects using filtered resistive flex sensor (RFS).
Figure 7.
Data processing steps.
Figure 7.
Data processing steps.
Figure 8.
Gaiting signal of the lower phone shape during the experiment (180 m). Subject S2 (neutral step, constant gait).
Figure 8.
Gaiting signal of the lower phone shape during the experiment (180 m). Subject S2 (neutral step, constant gait).
Figure 9.
Gaiting regimes are: lower part of leg movement for different speed (a), heel movement for different gait speed (b), upper part of leg movement for different speed (c).
Figure 9.
Gaiting regimes are: lower part of leg movement for different speed (a), heel movement for different gait speed (b), upper part of leg movement for different speed (c).
Figure 10.
Gait signal of two subjects (S1 and S2); the difference between the amplitude and peak distance are presented.
Figure 10.
Gait signal of two subjects (S1 and S2); the difference between the amplitude and peak distance are presented.
Figure 11.
Histogram for the peak distance results of three subjects (S1, red; S2, blue; S3, yellow).
Figure 11.
Histogram for the peak distance results of three subjects (S1, red; S2, blue; S3, yellow).
Figure 12.
Peak distance interval histogram for two phones used in the gait experiment for the same subject. In blue is represented the peak distance for upper part of the leg movement and in brown is represented the peak distance for the lower part of the leg movement.
Figure 12.
Peak distance interval histogram for two phones used in the gait experiment for the same subject. In blue is represented the peak distance for upper part of the leg movement and in brown is represented the peak distance for the lower part of the leg movement.
Figure 13.
The IoT proposed system.
Figure 13.
The IoT proposed system.
Table 1.
Subject characteristics.
Table 1.
Subject characteristics.
| Subject | Leg Length (cm) | Phone Position to the Thigh (%) | Foot Size (cm) | Phone Position of the Leg (%) | Weight (kg) | Size of the Subject (cm) | Gender |
|---|
| S1 | 35 | 0.271 | 28 | 0.4107 | 23 | 125 | F |
| S2 | 53 | 0.188 | 35 | 0.4736 | 69 | 165 | F |
| S3 | 53 | 0.198 | 35 | 0.457 | 69 | 170 | F |
| S4 | 44 | 0.2 | 35 | 0.37 | 50 | 166 | F |
| S5 | 50 | 0.210 | 44 | 0.340 | 65 | 174 | M |
| S6 | 52 | 0.211 | 41 | 0.315 | 65 | 172 | M |
Table 2.
Table of skewness and kurtosis coefficients of the RFS data according to the characteristics of the subject.
Table 2.
Table of skewness and kurtosis coefficients of the RFS data according to the characteristics of the subject.
| Subject | Thigh Size (cm) | Average Skewness on a Step | Average Kurtosis on a Step |
|---|
| S1 | 35 | 1032 | 2849 |
| S2 | 53 | 1345 | 3503 |
| S3 | 53 | 1125 | 3011 |
| S4 | 44 | 1177 | 3391 |
| S5 | 50 | 0284 | 2690 |
| S6 | 53 | 1240 | 3466 |
Table 3.
Number of peaks and walking frequency computed for each subject using RFS data.
Table 3.
Number of peaks and walking frequency computed for each subject using RFS data.
| Subject No. | Characteristic Frequencies between Two Steps of the Left Leg (in Hz) | Number of Steps |
|---|
| S1 | 10,318–10,533 | 354 |
| S2 | 8640 | 291 |
| S3 | 8882–9551 | 286 |
| S4 | 12,043–12,027 | 290 |
| S5 | 10,713 | 266 |
| S6 | 9214 | 254 |
Table 4.
Accuracy results after the feature classification for three subjects S1, S2, and S5, using RFS data.
Table 4.
Accuracy results after the feature classification for three subjects S1, S2, and S5, using RFS data.
| | Discriminant Analysis |
| | Linear | Optimizable |
| TrainF | 92.6% | 92.6% |
| TestF | 91.7% | 93.6% |
| | Decision Tree |
| | Fine | Medium | Coarse | Optimizable |
| TrainF | 88.9% | 88.9% | 88.9% | 88.9% |
| TestF | 94.5% | 94.5% | 94.5% | 94.5% |
| | Naive Bayes Classification |
| | Gaussian | Kernel | Optimizable |
| TrainF | 90.1% | 90.1% | 90.1% |
| TestF | 89.9% | 92.7% | 92.7% |
| | Support Vector Machine (SVM) |
| | Linear | Quadratic | Cubic | Medium Gaussian | Optimizable |
| TrainF | 92.6% | 95.1% | 93.8% | 91.4% | 96.3% |
| TestF | 94.5% | 94.5% | 94.5% | 91.7% | 97.2% |
| | Nearest Neighbor Classification (KNN) |
| | Fine | Medium | Cosine | Cubic | Optimizable |
| TrainF | 96.3% | 86.4% | 86.4% | 86.4% | 96.3% |
| TestF | 94.5% | 90.8% | 89.9% | 90.8% | 96.3% |
Table 5.
Data results after KNN processing. Gait prediction based on sensor data and smartphone usage.
Table 5.
Data results after KNN processing. Gait prediction based on sensor data and smartphone usage.
| Sensor | Fine KNN | Medium KNN | Cubic KNN | Cosine KNN |
|---|
| AIL | 54.2% | 69.0% | 69.0% | 43.3% |
| AuL | 72.2% | 72.9% | 71.5% | 72.9% |
| RFS | 95.4% | 93.6% | 93.6% | 92.7% |
| Publisher’s Note: MDPI stays neutral with regard to jurisdictional claims in published maps and institutional affiliations. |
© 2021 by the authors. Licensee MDPI, Basel, Switzerland. This article is an open access article distributed under the terms and conditions of the Creative Commons Attribution (CC BY) license (https://creativecommons.org/licenses/by/4.0/).


