1. Introduction
Metropolitan areas suffer as a consequence of a car-centric city layout. Roads are frequently congested [
1], air quality decreases [
2], and valuable space for active mobility is restricted [
3]. Thus, city planners aim to incentivize as many travelers as possible to use rail and public transit. As travelers minimize their own transportation cost—comprised of travel time and fare—[
4], it is paramount to understand the impact of the different factors of the cost function. The travel time depends on the scheduled transit time and delays. While the scheduled transit time is usually comparatively low, delays can severely impact both the actual and the perceived travel time [
5]. Nowadays, public transit competes with rising MoD services [
6], such as ride-hailing and carsharing, since vehicle ownership is lower in metropolitan than in rural areas ([
7], p. 35). While delays also occur in MoD systems, they do not propagate as severely as in public transit, due to missed connecting trains, and they are perceived less severe by travelers [
8]. Thus, surveys indicate that users switch to road-based individual transportation if delays increase or public transit is unavailable [
9], resulting in additional demand. This additional demand (i) increases road congestion and (ii) results in additional planning effort for MoD operators. They must react by moving vehicles to locations with increased demand (rebalancing, dispatching), and they may have to increase their fleet size to accommodate those peak demands. Otherwise, the unserved demand increases, which results in lost sales on a short horizon [
10], and they may also influence customer satisfaction and retention on a longer horizon [
11]. The changing demand patterns during the COVID-19 pandemic pose an additional challenge, but they also permit us to study the system under a different demand profile.
This paper studies the influence of public transit delays on the demand of MoD services. As such, it helps MoD operators to increase the quality of service by improving their demand predictions and, consequentially, their operational strategies (e.g., [
12]), and gives public transit authorities first insights into how their delays impact road traffic, and eventually congestion. A better understanding of the influence of public transit delays—and, thus, the quality of service of public transit—eventually helps to carry over a demand prediction tool that was developed in one location to another (as [
13] attempt for bikesharing services).
This work is the first data-driven approach for establishing the correlation between public transit delays and demand for carsharing and taxi services. From the data, we establish a lower bound of how much taxi and carsharing substitute public transit by measuring the number of additional taxi and carsharing trips for increasing delays, both over a period of 10 months and exemplarily for closures of the main tracks, and both for individual stations and the entire city center.
This suggests that
a lower delay and/or higher coverage of the public transit system can result in a smaller necessary fleet (by up to 2.2% and up to 0.5% of the total fleet size, respectively), and most likely result in fewer traffic; and,
carsharing and taxi operators can improve their demand prediction performance by including information on planned public transit closures.
In the following, we first review related work in
Section 2, and describe the data collection process and general statistics in the data presented in
Section 3.
Section 4 analyzes the data to establish how demand MoD-systems and public transit delays are connected.
Section 5 discusses the results and concludes the paper.
2. Related Work
This work is related to two different streams of literature: demand prediction for carsharing and taxi services, as well as substitution and complementarity between different modes of shared and public transit.
Ref. [
14] review different works focusing on demand prediction for carsharing. They conclude that research still lacks in-depth knowledge about the intricacies of demand processes. Ref. [
15] investigate how taxi, Uber, and Lyft demand increases during severe rain in New York City, as well as the price elasticity of Uber and Lyft during those periods. They find that the total number of rides increases, but the number of taxi rides is only weakly correlated with rain, which suggests that the additional demand is due to Uber and Lyft’s pricing strategy. The impact of weather on demand is clearer than the influence of public transit delays, since rain can be modeled as a Boolean variable, while the demand increase may depend on the extent of the delay. Ref. [
16] study how events influence taxi demand in New York City using online information (web mining demand hot spots from social media). They find that the frequency that events were mentioned has a significant impact on the taxi demand. However, the influence of events differs from the influence of public transit delays, as events only affect the origin of a trip, not origin-destination pairs, and since events are known earlier than delays. Ref. [
17] show that this event information can improve the performance of demand predictors. Thus, we cannot directly adapt models for measuring the influence of weather or events to the influence of delays. Ref. [
18] show that socio-demographic features have an impact on carsharing demand in Munich and Berlin (Germany), ref. [
19] study the impact of these factors on New York City taxi demand, and ref. [
20] investigate the impact of socio-demographic factors on ride-hailing demand in California. All three studies find that socio-demographics can explain parts of the demand variances. However, socio-demographics usually do not change within the observation period, unlike public transit delays. Therefore, we must develop a new methodology to measure the impact of a cardinal variable that varies during the observation period, but it has strong correlation with some of the previously studied variables.
Ref. [
19] also explore the influence of demographic and socioeconomic factors on the taxi passenger demand in New York. The results clearly indicate that a relationship between public transit accessibility and taxi demand exists. Taxi trips in this study occur more often if public transit is more accessible. The authors note that a finding of whether this relationship is competitive or complementary could not be determined from their results. Additionally, they do not consider if and how taxi demand varies, depending on the temporal availability of public transit. Ref. [
21] study the demand patterns for taxi and Uber on a coarse-grained level. They find that similar external factors impact the demand for taxi and Uber. Ref. [
22] state that users of free-floating carsharing are more likely to have a public transit subscription than the control group which suggests complementarity. Ref. [
23] consider the spatio-temporal availability of public transit, but do not extend their analysis beyond examples during an outage at a central location. Naturally, such a dependency implies that if the required time for one of the transit modes increases, the demand for this mode should decrease. Ref. [
23] gives some examples that support that public transit outages increase the demand for alternative transportation modes in the city of Vancouver, but do not extend this to a city-wide experiment over a longer period of time. Ref. [
24] observe that, for the most common carsharing trips (origin-destination pairs) in Madrid, traveling by car is only slightly faster than public transit, but significantly more expensive, which suggests a customer preference for traveling by car, but they do not investigate whether the number of trips increases even further if public transit becomes less available (due to outages or delays). For early carsharing adopters, ref. [
25] find that, on average, over seven European and North American cities, 40% of carsharing trips could have been performed more quickly by public transit, which suggests that carsharing, in fact, substitutes public transit. However, they do not include delays or outages, as well as the waiting time for the next train. Several studies indicate that, on the customer side, there is a notable difference in the perceived and real waiting time—especially in the case of unestimated delays. Ref. [
26] found that passengers who did not have knowledge about the actual schedule perceived waiting times significantly longer than passengers with knowledge. Ref. [
27] confirm that users already more frequently decide against using public transit for an entire trip if only a single trip segment is sub-optimal (e.g., long waiting times, slow transit). Ref. [
28] study the modal choice of travelers in Taiwan using a general estimation equation, and find that intermodal transportation accessibility has a positive influence of public transit ridership at those stations where available. However, ref. [
28] do not study the influence of the public transit operator’s availability and punctuality on ridership (and alternative choices).
This paper is the first to analyze the influence of public transit delays and outages on MoD demand in a data-driven fashion (as compared to simulation- and survey-based research), both on a city level and more granular per public transit station (when compared to single occasions). This provides substantial additional insights, but it also requires a new methodology.
3. Reference Datasets
This study uses three different datasets for the city of Munich in the period from May 2019 to March 2020: downtime and delays for public transit, vehicle movement data of a major carsharing provider (only until December 2019), and taxi customer trip data of a local taxi agency. The data are discretized and filtered.
3.1. Public Transit Data
We query current departures (scheduled and actual departure time) of all suburban railway (S-Bahn) and underground (U-Bahn) lines at all stops in 5 min. intervals to obtain an understanding about delays and outages in the public transit system. The delay can then be calculated as the difference between the scheduled and actual departure time. Both of the times are only given in minutes, thus delays are only reported if they are at least 60 s, and delays are rounded down to the next integer. For our analysis, longer delays are more relevant, reducing the impact if rounding down. Throughout this paper, we indicate how we handle integrality. For each station i and time frame t, we report both the average delay and maximum delay of all departures. Outages are derived from comparing the number of departures in a given interval to comparable intervals on other days (maximum over all weeks). Additionally, we collected information regarding track closures during the analysis period from public authorities.
Table 1 lists the basic statistics on the data set and the delays. Even in the short observation period of
months, the number of departures is in the order of 12 M (This number includes all departures of the same train and, thus, may seem to be excessively high at first). Thus, the impact of those instances with a very high delay is negligible. The mean delays (in minutes) are low (slightly above or below 1 min.), and the majority of departures is not delayed (contrary to what customers perceive).
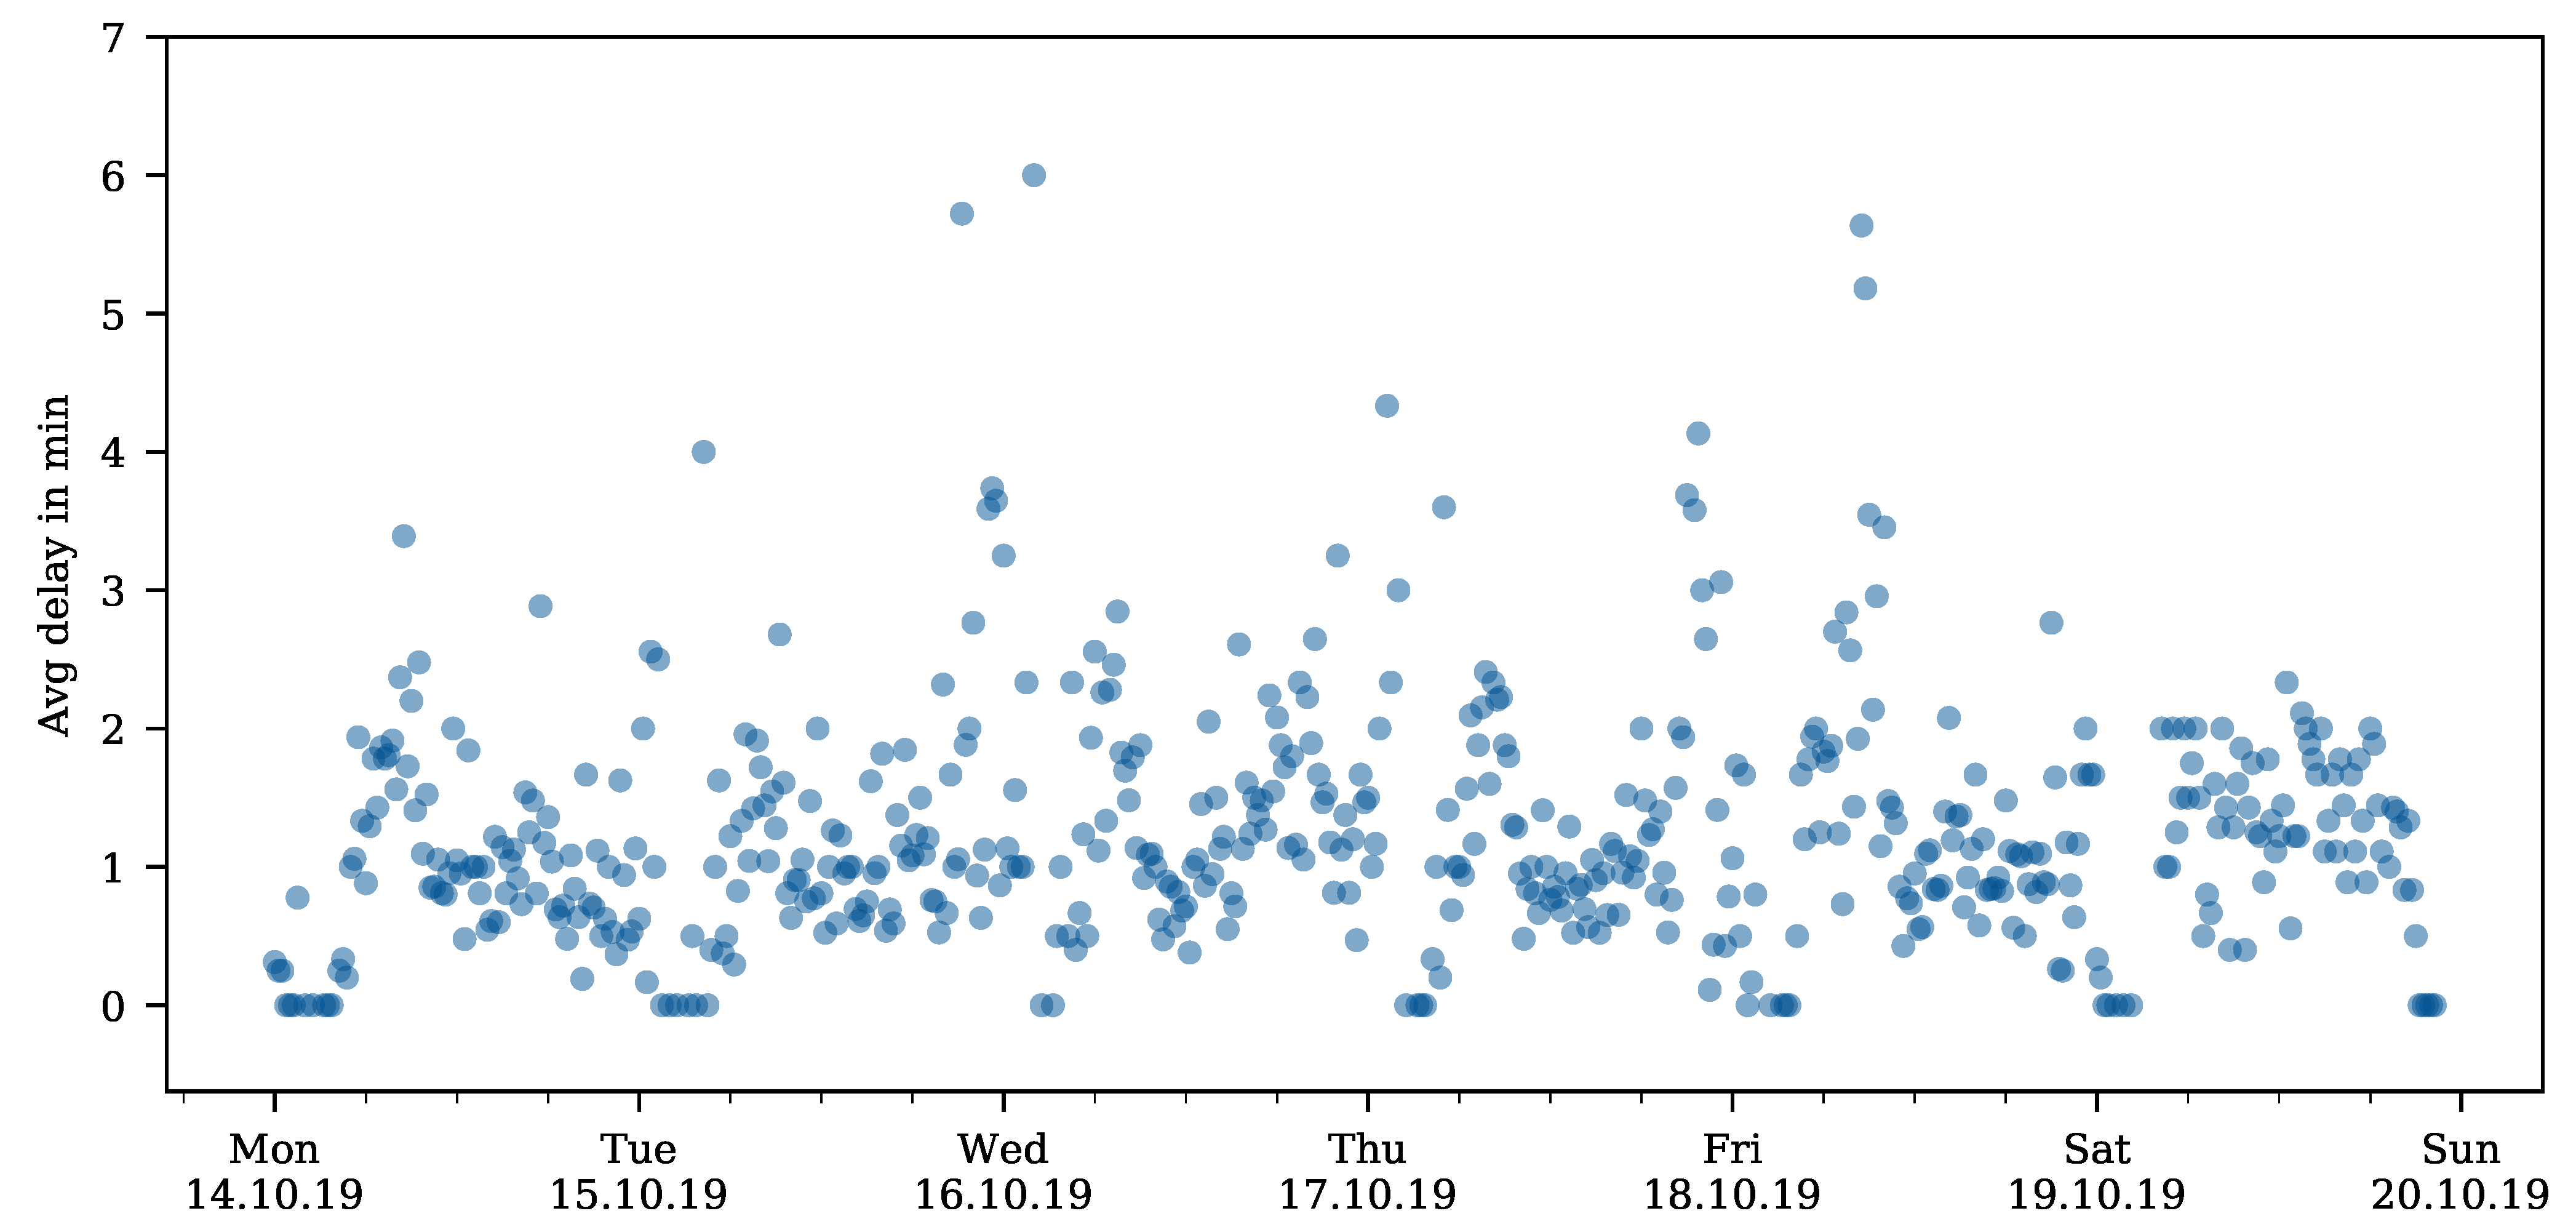
Figure 1 depicts the average of delays (suburban railway and underground) during an example week (week 42/2019, 14–20 October) at station Marienplatz. During rush hour, most of the lines are slightly delayed, and the morning rush hour incurs more severe delays than the evening rush hour. Major delays (>6 min.) occur infrequently, and on a more random pattern.
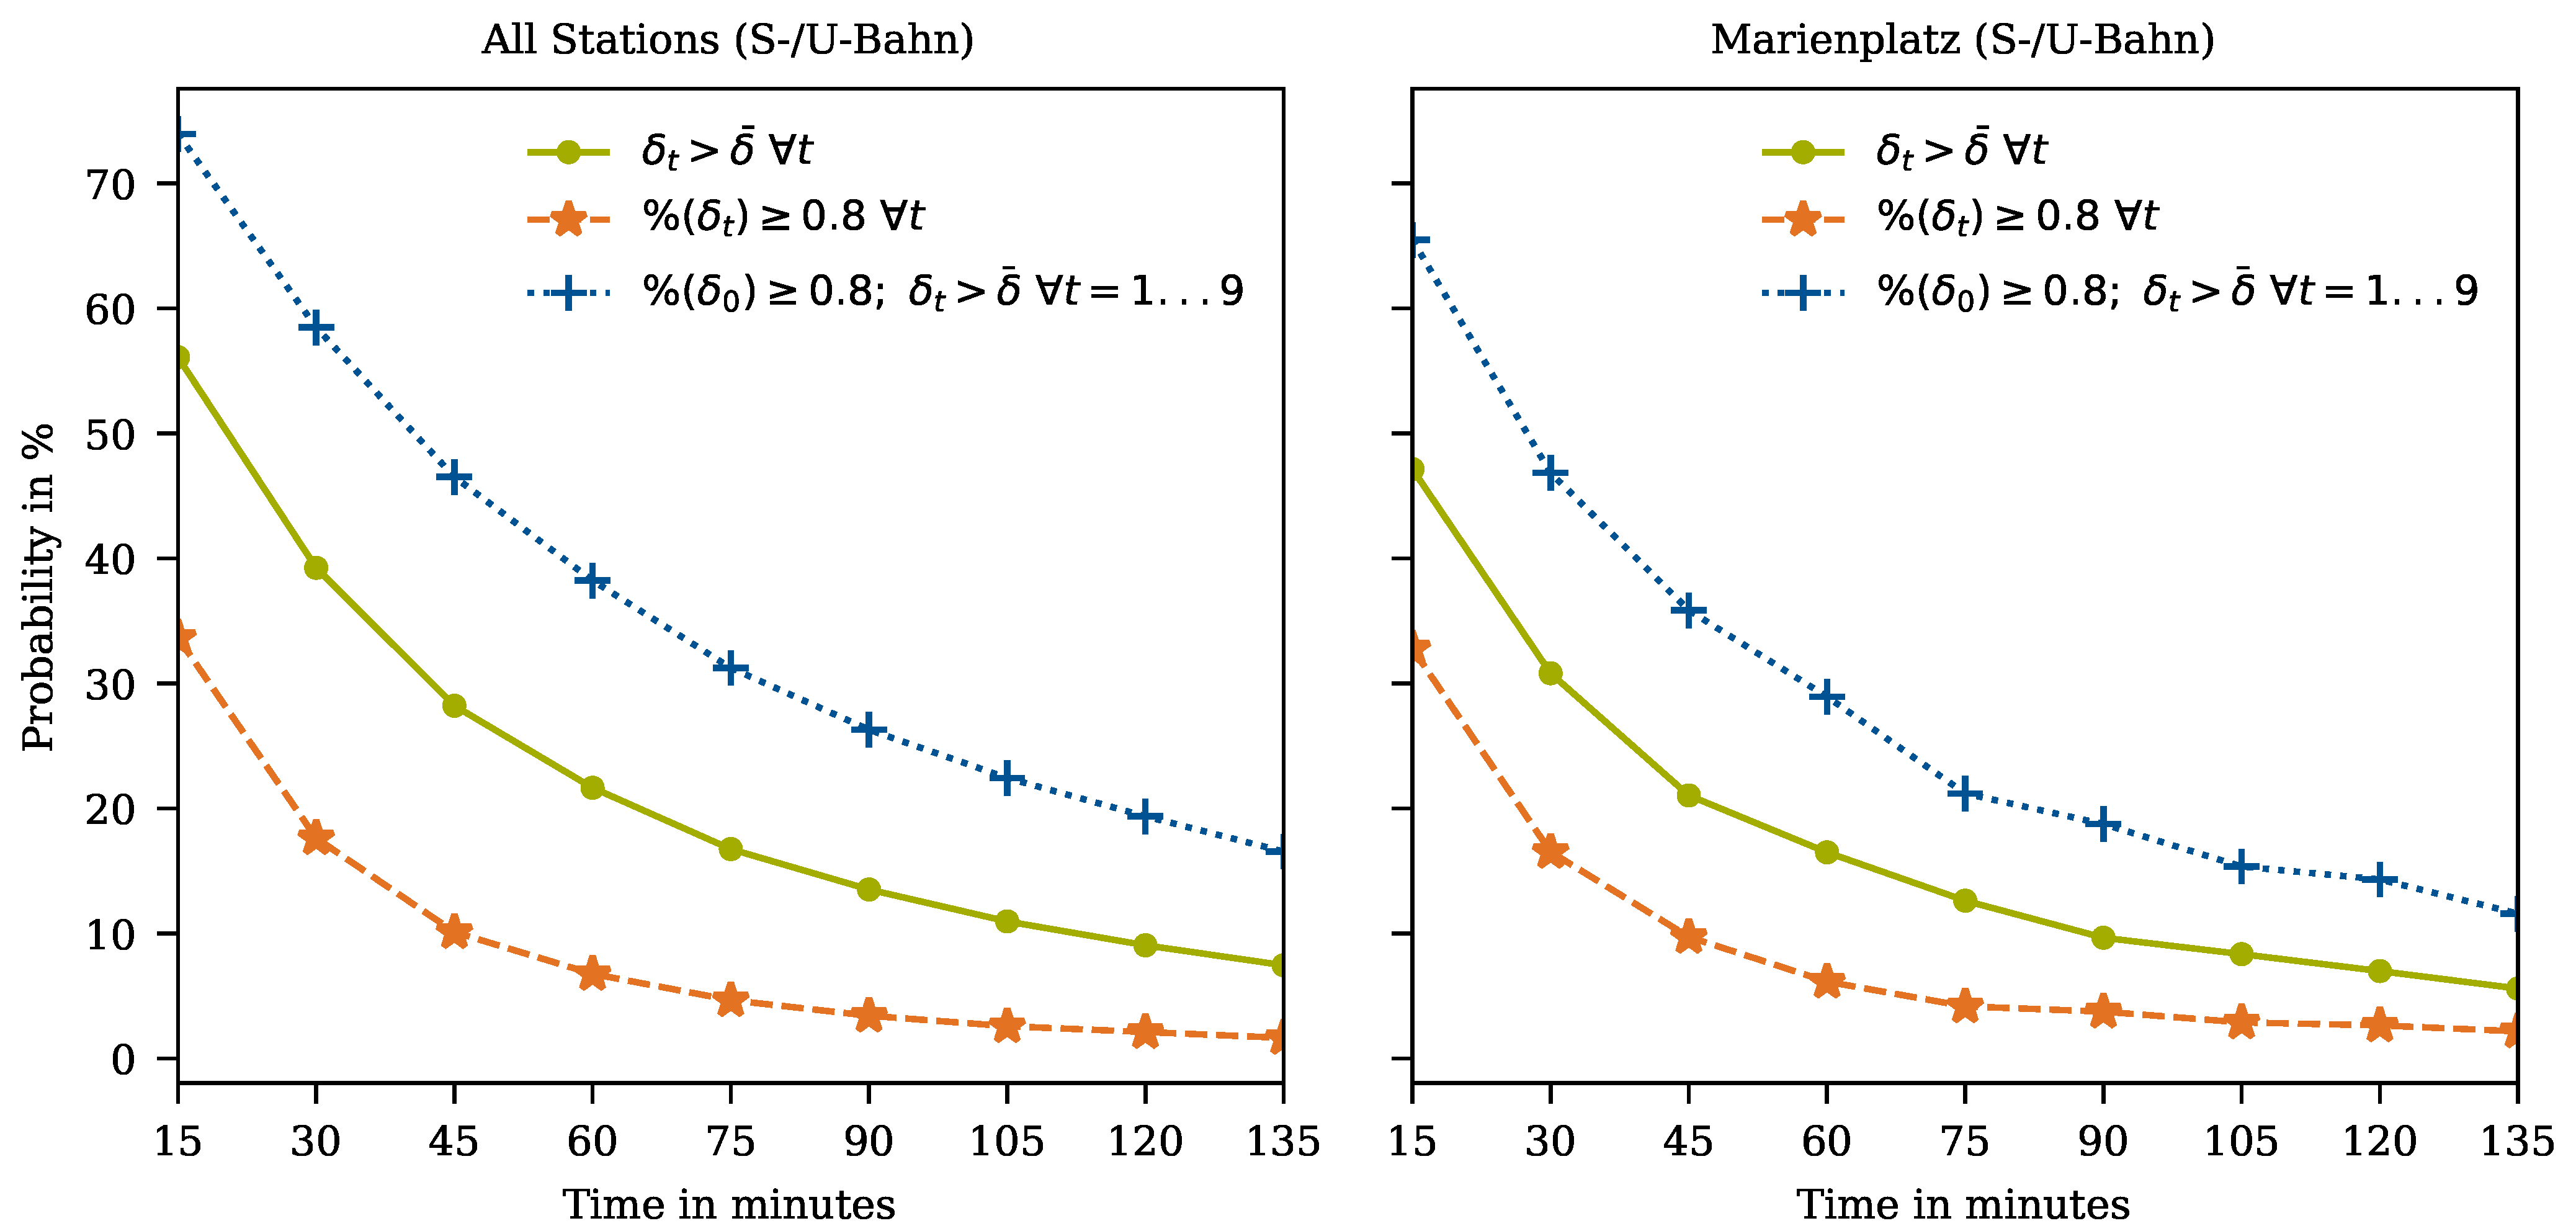
If an above average delay occurs at some point in time
t, there is a high probability (>55%) that there will also be an above average delay at time
min. If the delay at time
t is in the 80th percentile (
, where
is the percentile function that assigns the delay percentile among comparable time frames (
) at station
i), above average delays occur even more frequently, and delays persist longer.
Figure 2 depicts the delay persistency, i.e., the probability that a delay occurs at the same station a given time interval after another delay.
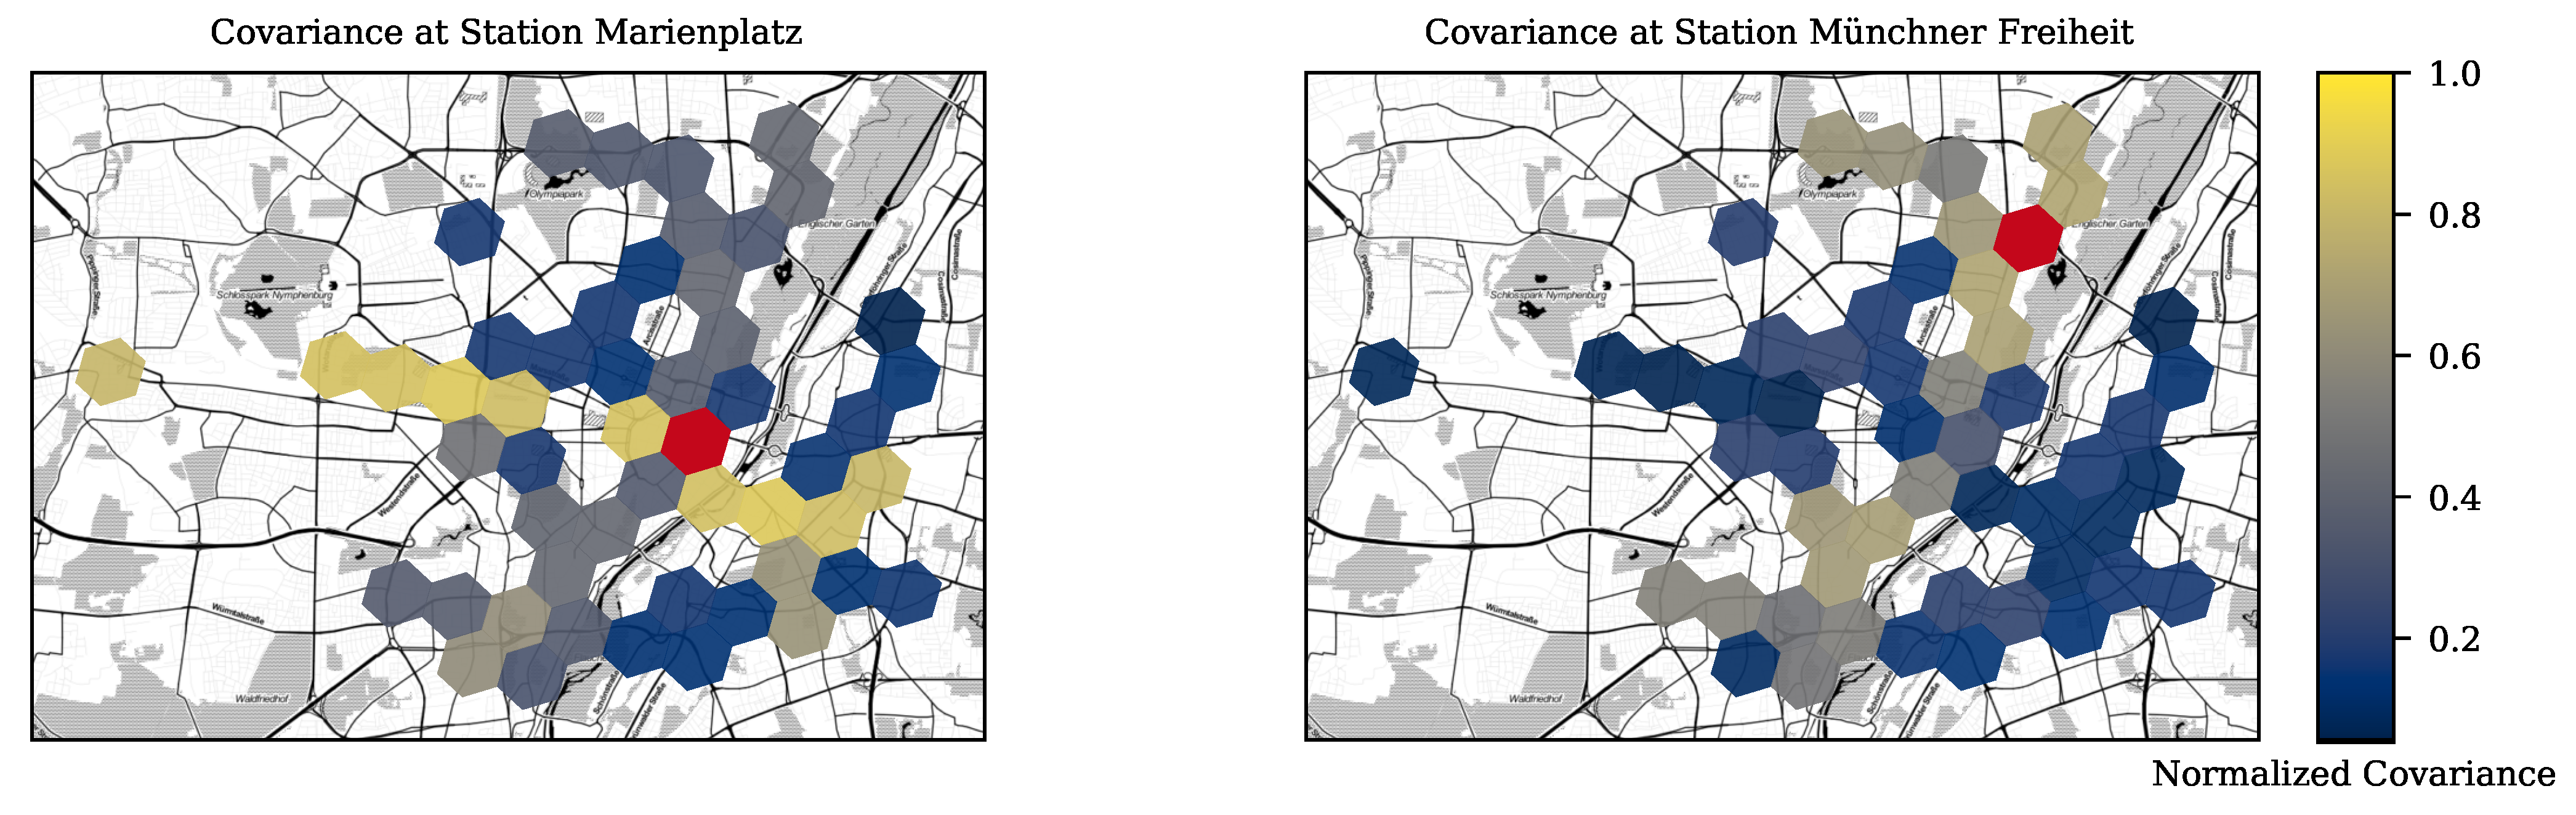
When comparing the entire Munich city center to Marienplatz, it, at first, seems surprising that the central location with a very dense time table and high utilization has a lower delay persistency, but Marienplatz also has four tracks while most stations only have two tracks. Delays propagate almost independently on different tracks. This delay propagation is visible from
Figure 3.
It shows the probability that an above average delay at Marienplatz (left) or Münchner Freiheit (right) correlates with an above average delays at other stations. Yellow shading refers to a high covariance, blue shading to a low covariance. Clearly, stations along the same line have a higher probability of delays and, at Marienplatz, this mainly affects the East-West connection (S-Bahn), not so much the North-South connection (U-Bahn). The covariance between the selected station and stations along other lines is low, and the remaining covariance can be due to external influences, customers transferring lines, or intersecting lines. From the strong spatial and temporal differences in delays, we conclude that our spatial and temporal resolution is reasonable.
3.2. Carsharing Data
Carsharing data for one of the largest Munich free-floating carsharing operators has been collected while using webscraping techniques since April 2018. The scraping ended mid-January 2020 when the API was discontinued. Every 5 min., the current location of all available vehicles (not rented or reserved by customers, or blocked by the operator) was recorded. Because of the data collection method, outages appear, and the data are cleared accordingly.
Movements of vehicles are created by recording the last location of the vehicle before becoming “invisible” and the first location after re-appearing in the data stream. The data collection method does not allow for us to differentiate between customer trips and rebalancing operations, but there should be significantly less rebalancing operations than customer trips, and the literature reports that rebalancing mainly occurs during the night [
29]. We remove time windows during the night, as described later.
The data set contains >1.5 M trips. Roughly 20% of all data points are missing due to outages in the data collection. The reasons for outages include power outages, network connection loss, or, otherwise, discontinued service on the collection server, unavailability of the API, and service downtime of the carsharing service provider. On average, 131 trips occurred per hour, with a maximum of 653 trips during an one-hour interval, and the number of trips highly depends on the time of day and weekday.
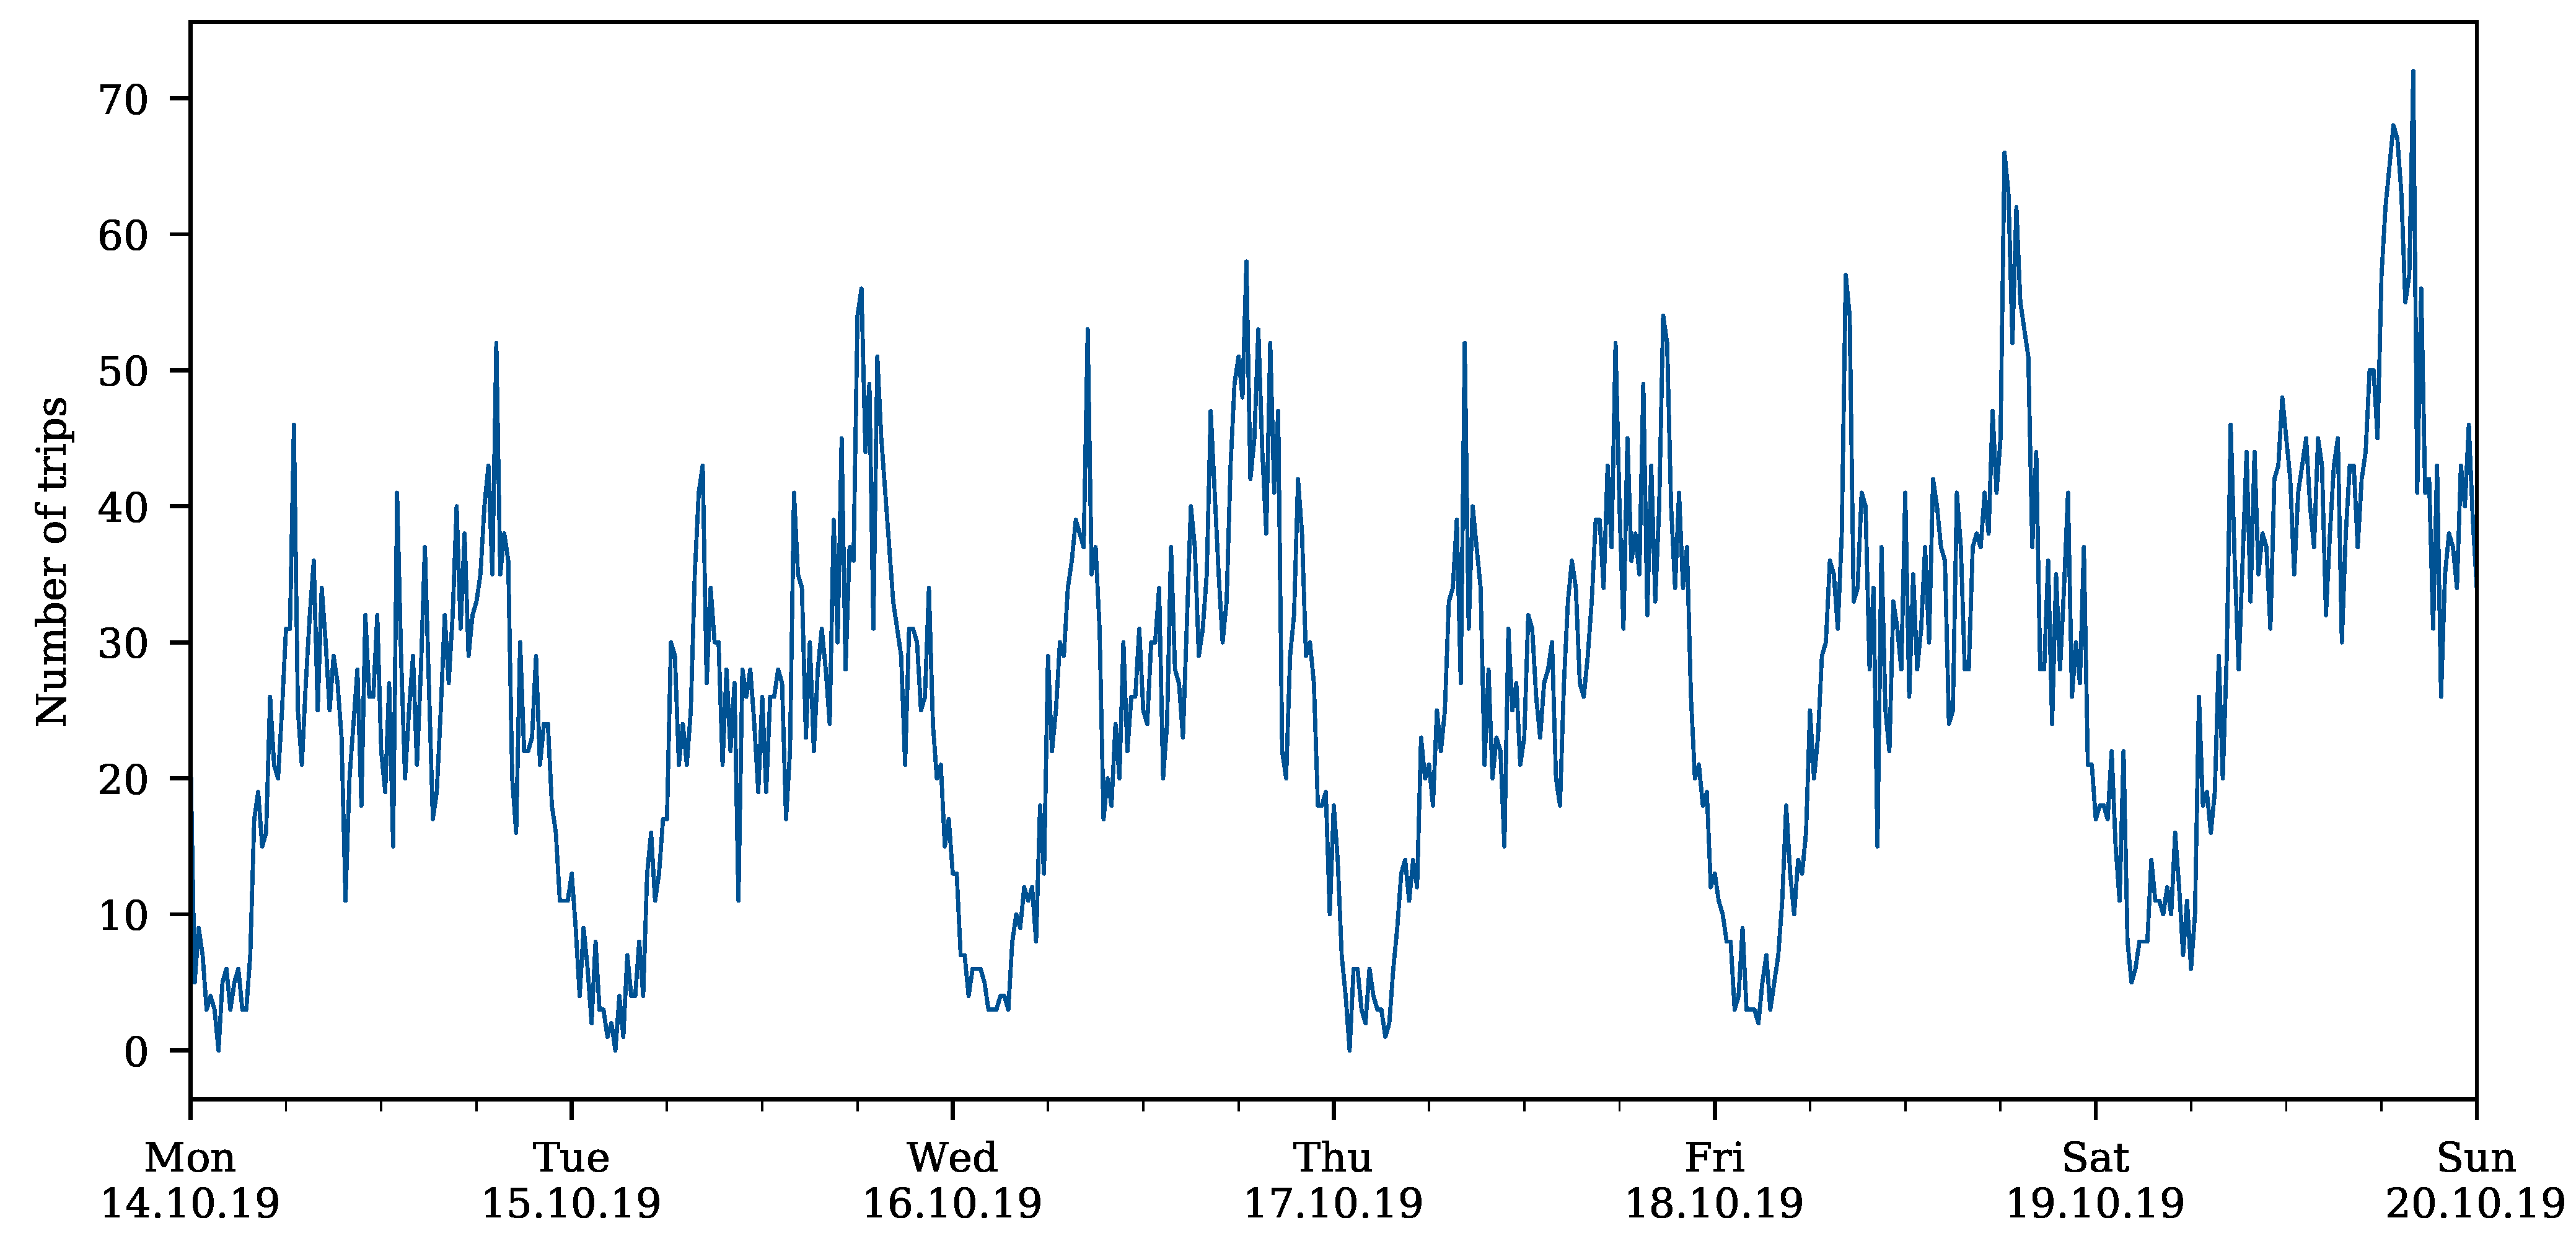
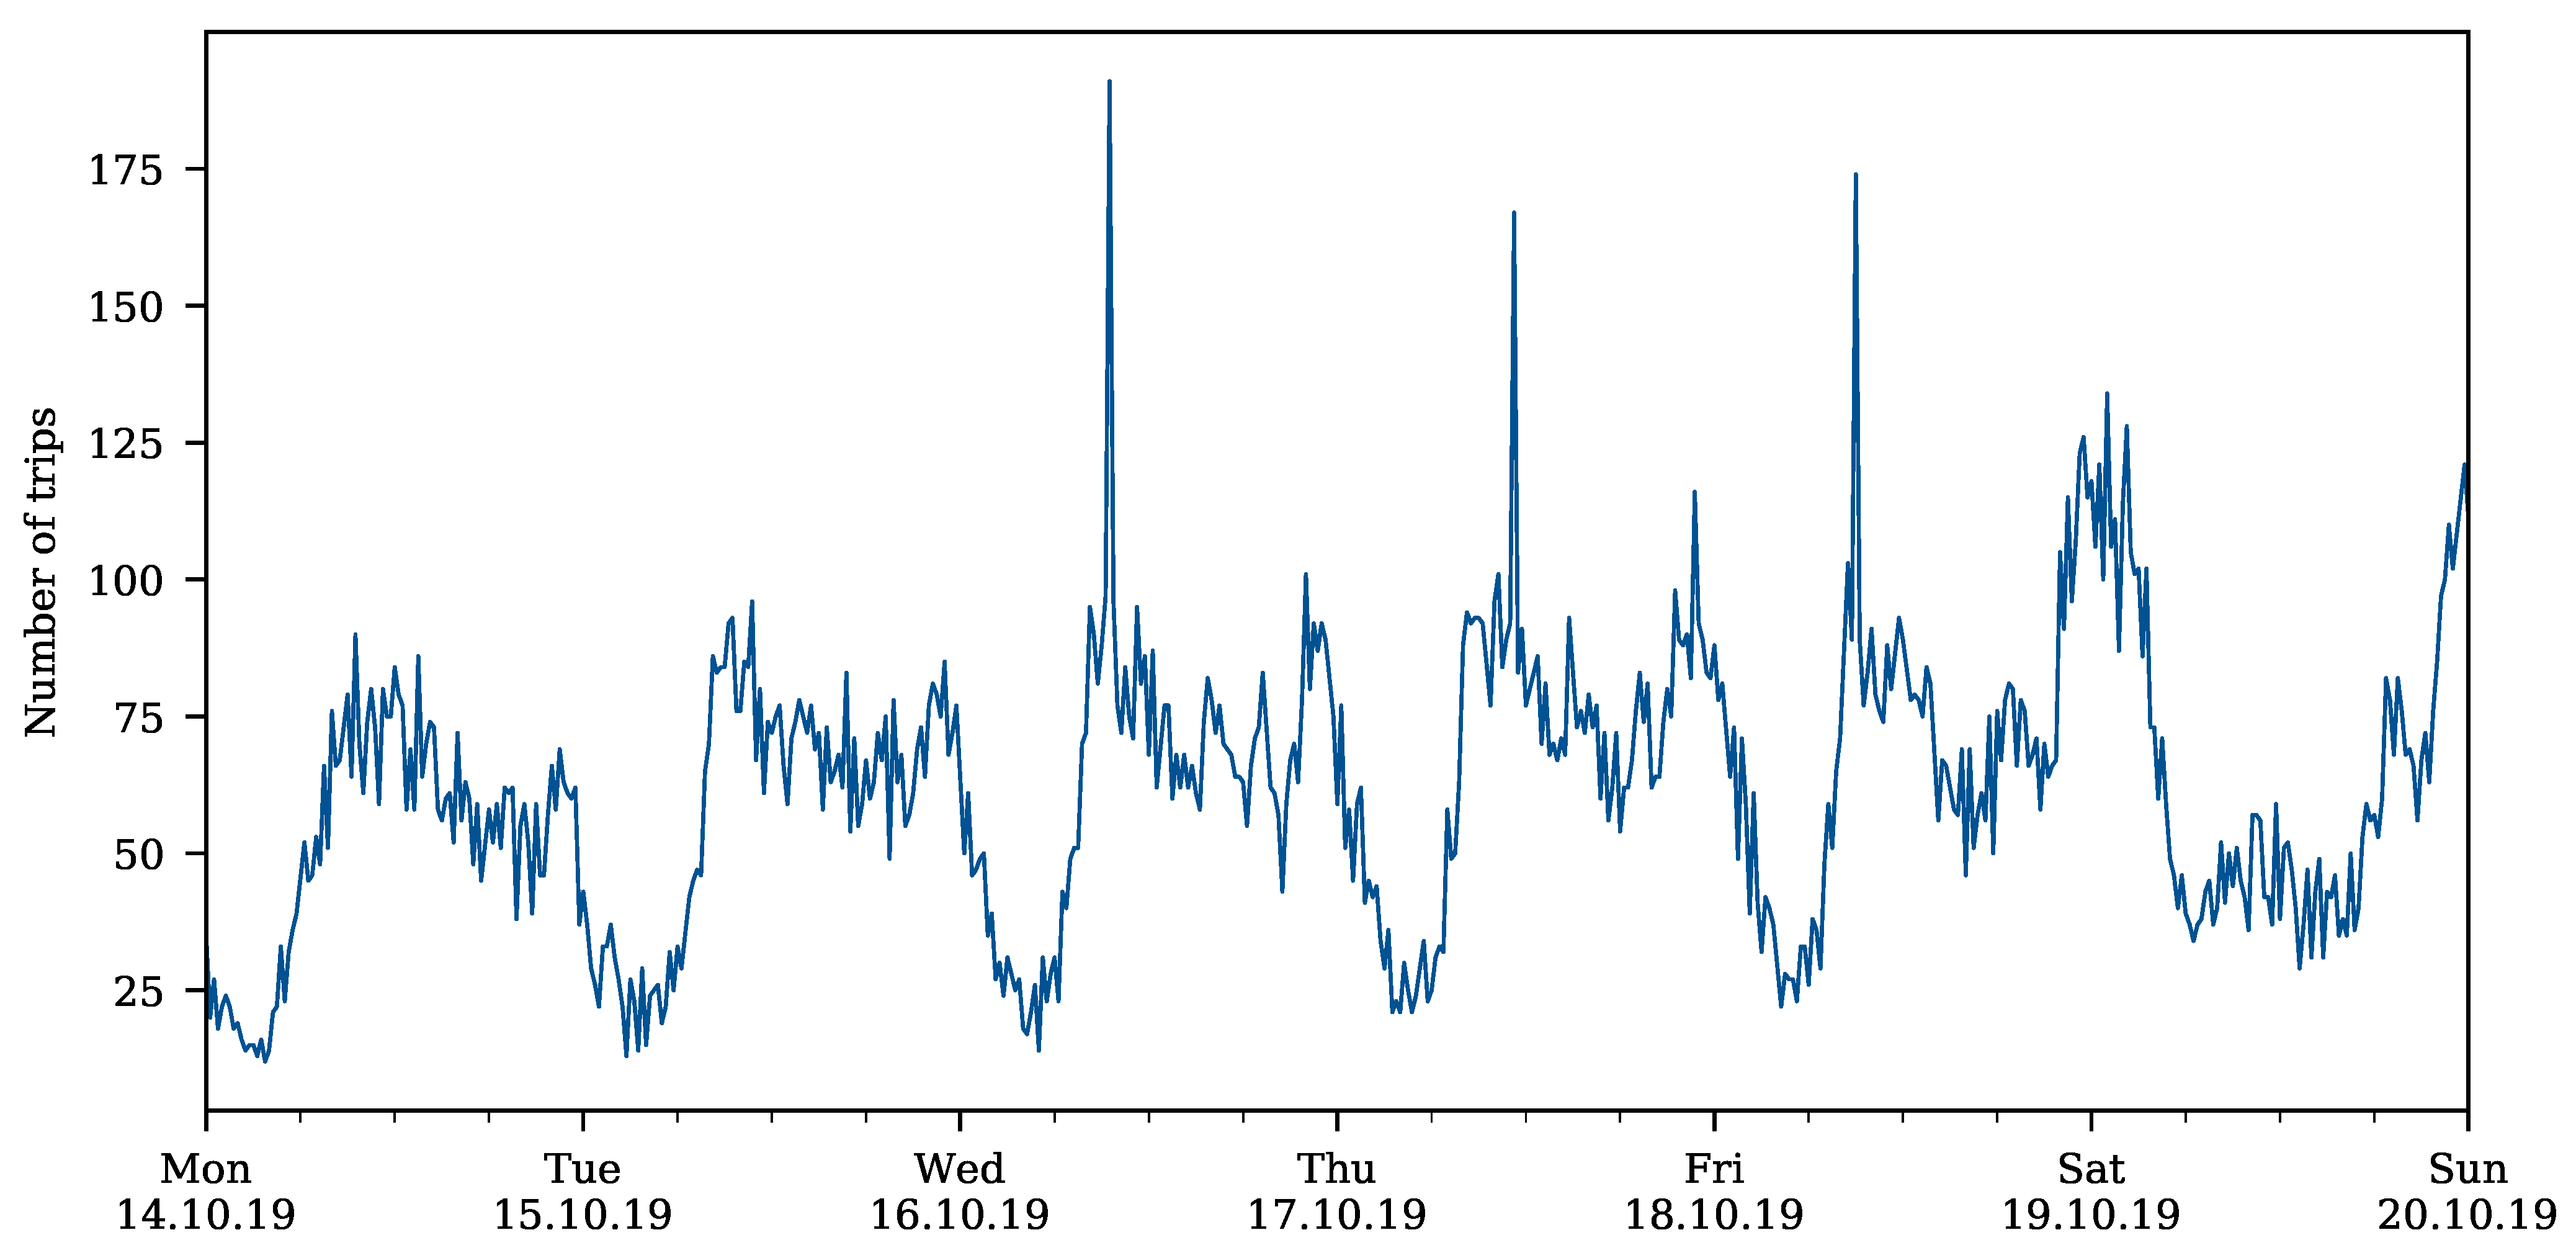
Figure 4 shows an example weekly pattern for week 42/2019 (14–20 October).
Demand is aggregated in one-hour intervals and it is reported at the beginning of the interval. The demand follows a daily pattern with more demand during the evening rush hour than the morning rush hour, and slightly decreasing demand during the course of the week.
3.3. Taxi Data
This study makes use of floating car data from a local taxi agency to derive the passenger demand for taxi services in Munich. A fleet of 550 taxis served ≈10 M customer trips between 2015 and 2020. The data are being continuously retrieved from the fleet management interface, which is usually used for dispatching by the local taxi agency [
30]. The data are directly provided by the dispatching agency with full information about trip start, trip end, and driven route.
The data set contains >3.8 M trips in the observation period between April 2018 and March 2020. On average, 252 trips are recorded per hour (at most, 740 trips per hour).
Figure 5 shows an example weekly pattern for week 42/2019 (14–20 October).
The demand pattern follows the same high level trend as carsharing demand, but the highest demand peaks occur on the weekend rather than at the beginning of the week. The morning peak is more pronounced, and the daily afternoon demand peaks occur slightly later in the day than in the carsharing system.
3.4. Data Discretization and Filtering
For comparability, we discretize the area in hexagons with an edge length and radius of 461 m using Uber’s Hierarchical Spatial Index H3 [
31]. Imposing a maximum walking distance of 461 m is in alignment with literature [
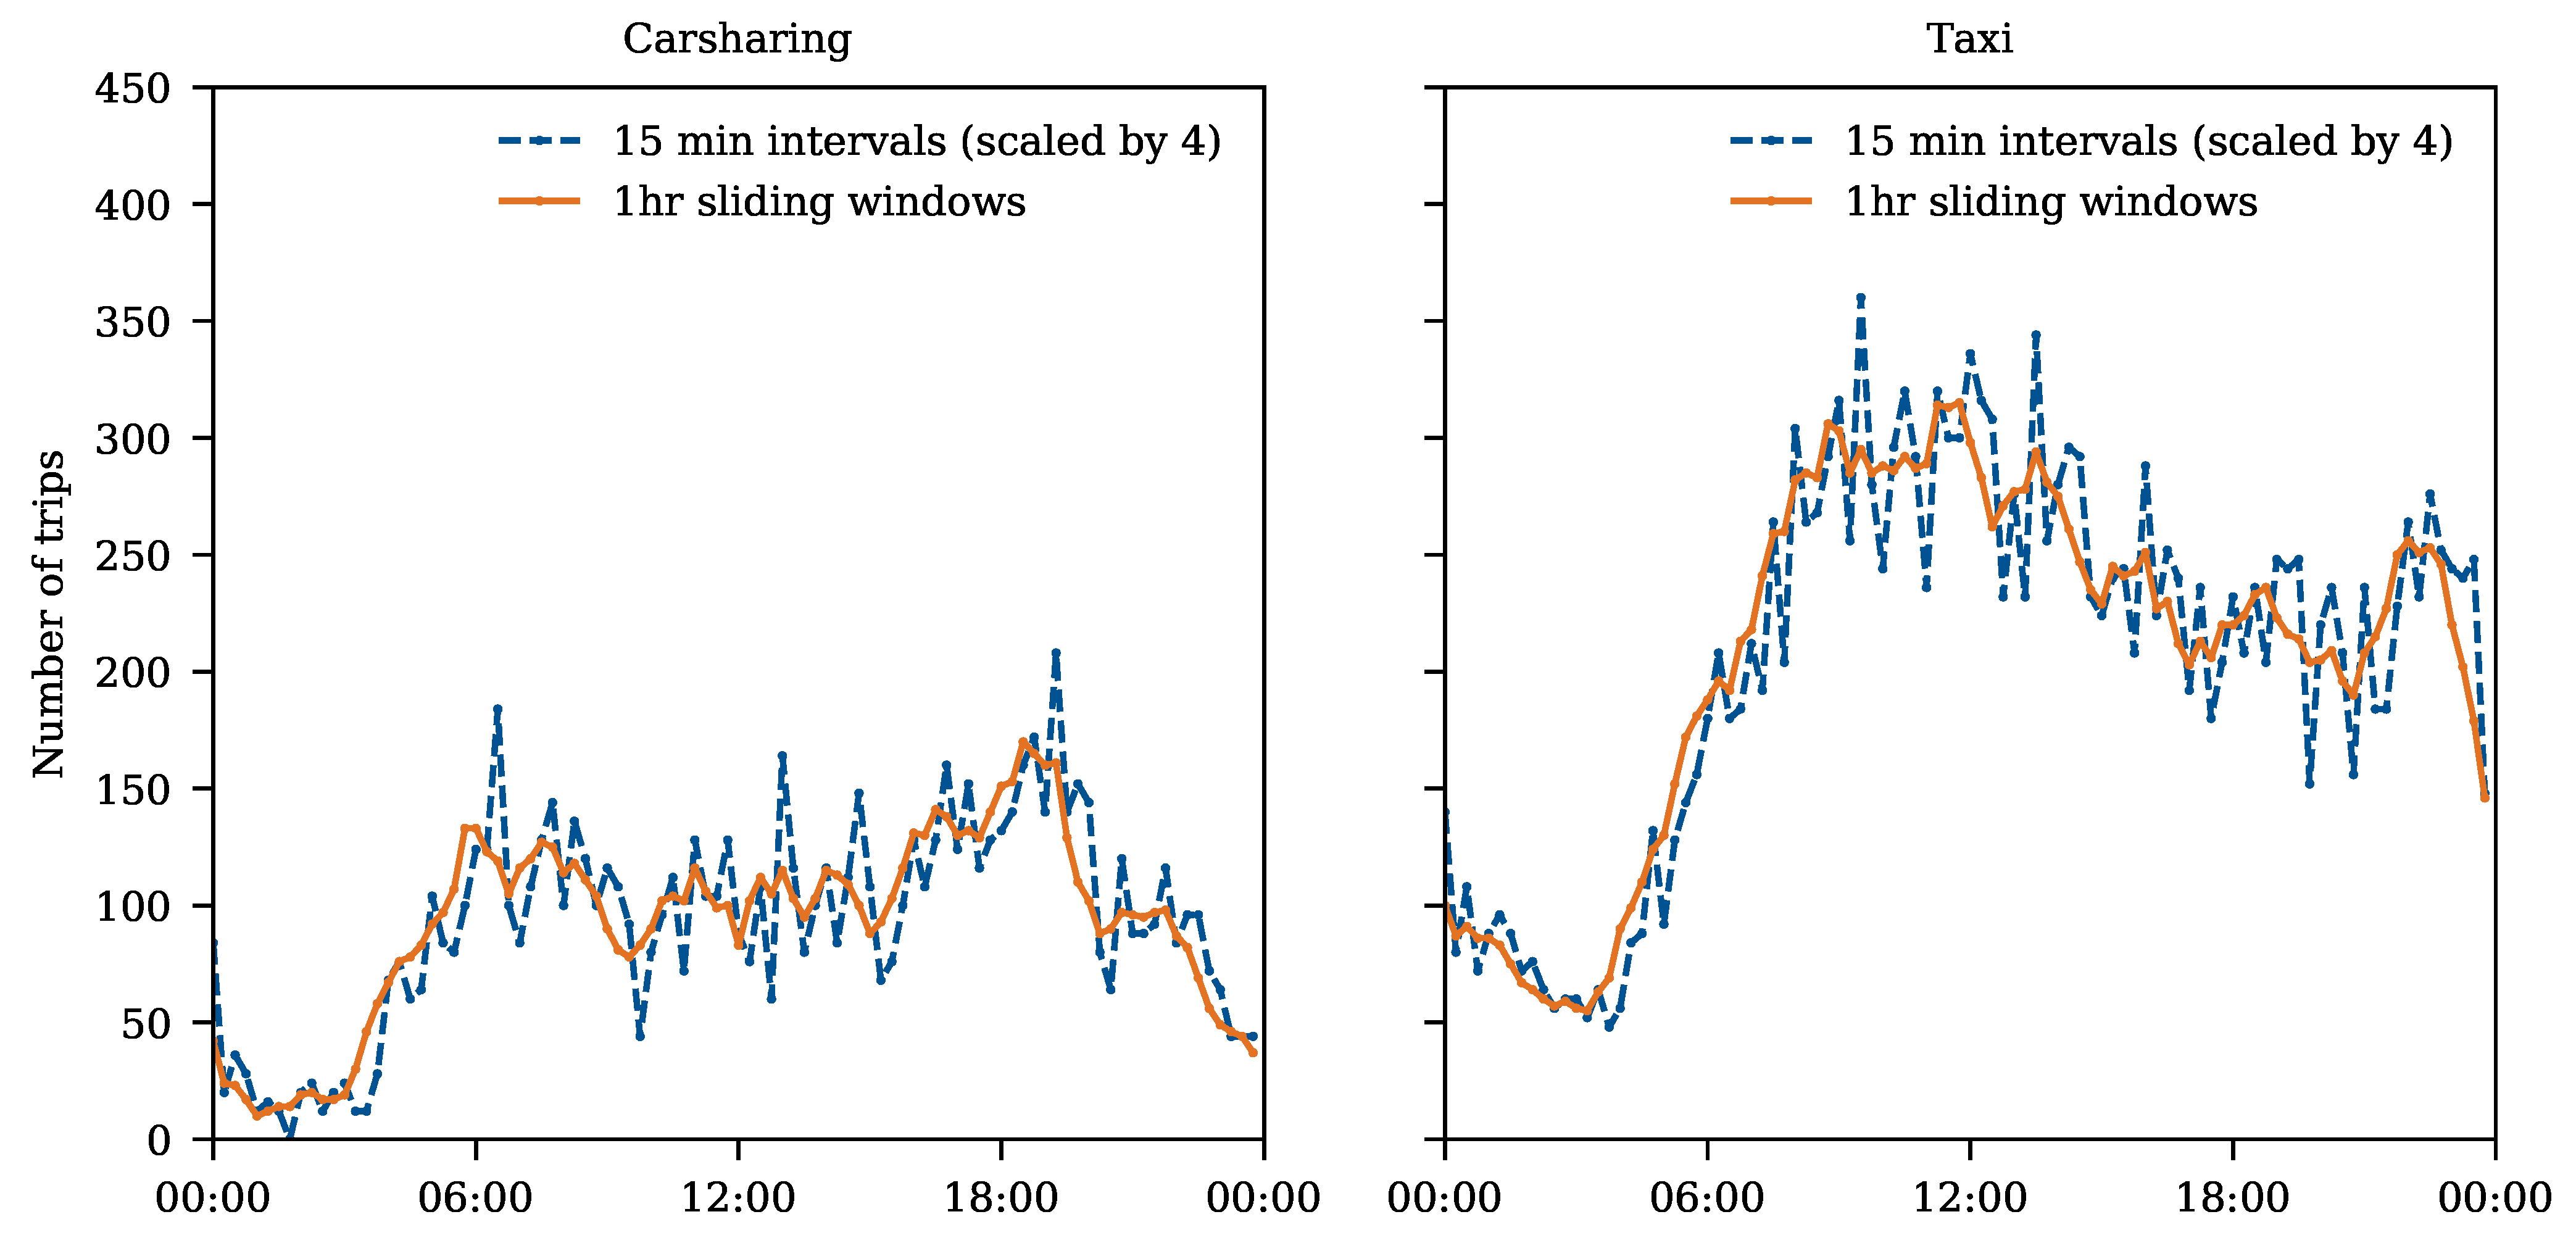
32]. Temporally, we discretize the carsharing and taxi data into one-hour intervals on a rolling scheme, creating data points every 15 min. Every data point then contains the total number of trips—the demand
—occurring in the 60 min. after a delay. One hour is a reasonable time frame for potential impacts and in line with delay persistency (
Figure 2). This (i) increases the amount of available data points and, therefore, reduces random variances of our results compared to one-hour intervals without rolling time windows and (ii) smoothes the demand pattern as compared to 15-min. intervals, as one can see in
Figure 6 for the carsharing and taxi demand.
Because public transit delays persist for some time and, as these delays take time to manifest in the taxi demand, using sliding time windows is also advantageous to be able to record longer-time impacts on the demand.
Obviously, carsharing and taxi demand can only be evaluated against public transit delays if the public transit service is scheduled to run. Further, an influence can only be measured to a statistically significant level if the average number of carsharing and taxi trips is sufficiently high. This does not exclude temporary outages, but it does exclude nights, as public transit is not operating between 1:30–4:30 AM, and the number of departures decreases substantially during the late evening. We exclude the time frame 10:00 PM–5:00 AM, to be safe against startup and end-of-horizon effects, and the low demand during the night. Omitting this longer period of time also makes it more probable that vehicle movements in carsharing are customer trips, rather than vehicle rebalancing (since vehicle rebalancing in carsharing systems mainly occurs during the night [
29]). Subsequently, 13.0% of all public transit departures, 14.6% of all carsharing trips, and 31.6% of all taxi trips are omitted.
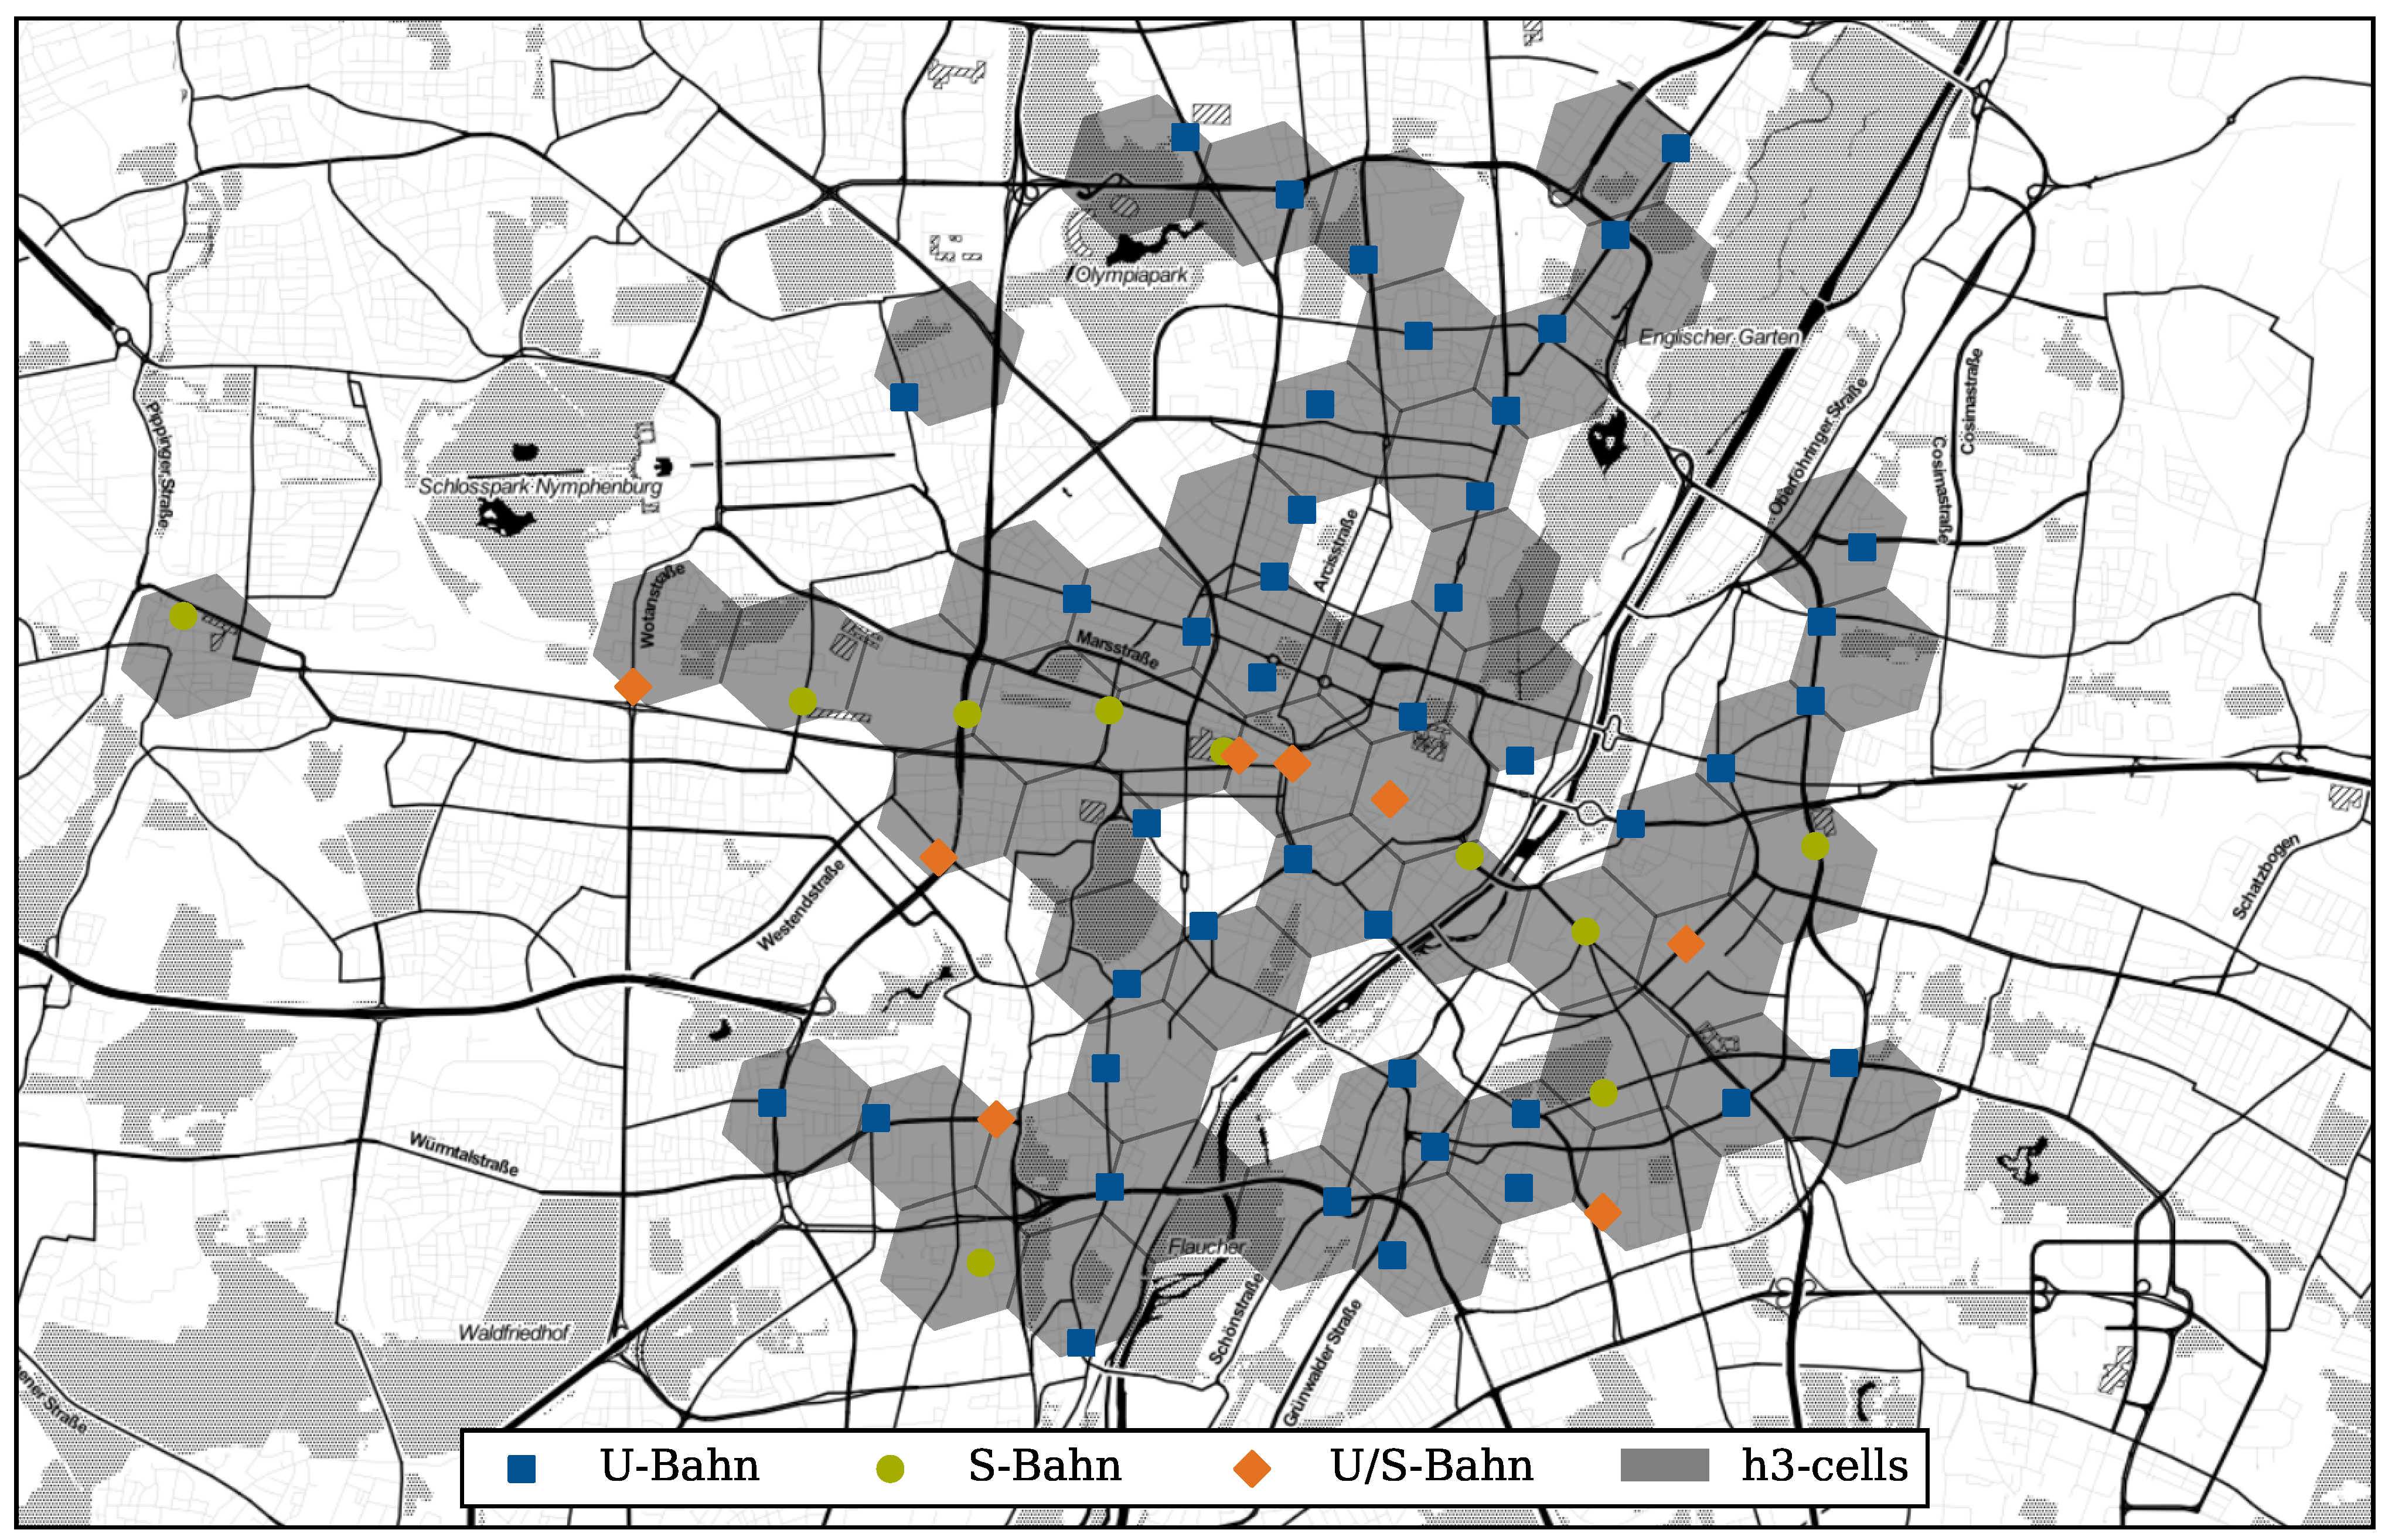
Additionally, to be able to measure the effect of public transit on carsharing and taxi demand, we exclude those hexagons without a public transit stop (suburban railway or underground) and those outside the Munich city highway “Mittlerer Ring” (except for Pasing station which is the west-most end of the suburban railway main tracks). Thus, we consider demand in the 53 hexagons that are depicted in
Figure 7 with blue squares for U-Bahn stations, green dots for S-Bahn stations, and orange rhombuses for stations with both U-Bahn and S-Bahn connections.
3.5. Censored Demand
Demand for MoD is subject to censoring [
33,
34]: if no vehicle is available, one cannot record demand, and a straight-forward model tends towards underestimating demand. Outages of the carsharing service might correlate with public transit disruptions. Thus, none of the approaches that have been suggested in literature can be applied, since we measure increased delay which also impacts the demand censoring. Instead, we split the data set in those data points with and without censored demand (assuming that censoring can apply only if supply is 0). This occurs more frequently in remote locations with low demand. For the high demand location Marienplatz, censoring might have occurred in up to 24% of all data points. Such censored demand only occurs for the carsharing service, but not the taxi service, as taxi street-hailing is less common in Munich [
35], and as Munich has a significant oversupply in taxis [
36].
4. Analysis
Using the previously described data sets, we analyze how public transit delays influence demand for MoD services. In particular, we give a high level relation, calculate the fraction of demand variation that can be explained by public transit delays, analyze the varying demand patterns during outages, the probability of having no vehicles available depending on delays and outages, and the demand changes during the COVID-19 pandemic. We use this analysis to estimate the additional demand, traffic, and necessary increase in the fleet size due to delays and outages.
All of the numerical analyses are implemented in Python 3 with (among others) Numpy, Scikit Learn, and Gurobi. The experiments are performed on an Ubuntu server.
4.1. High Level Relation
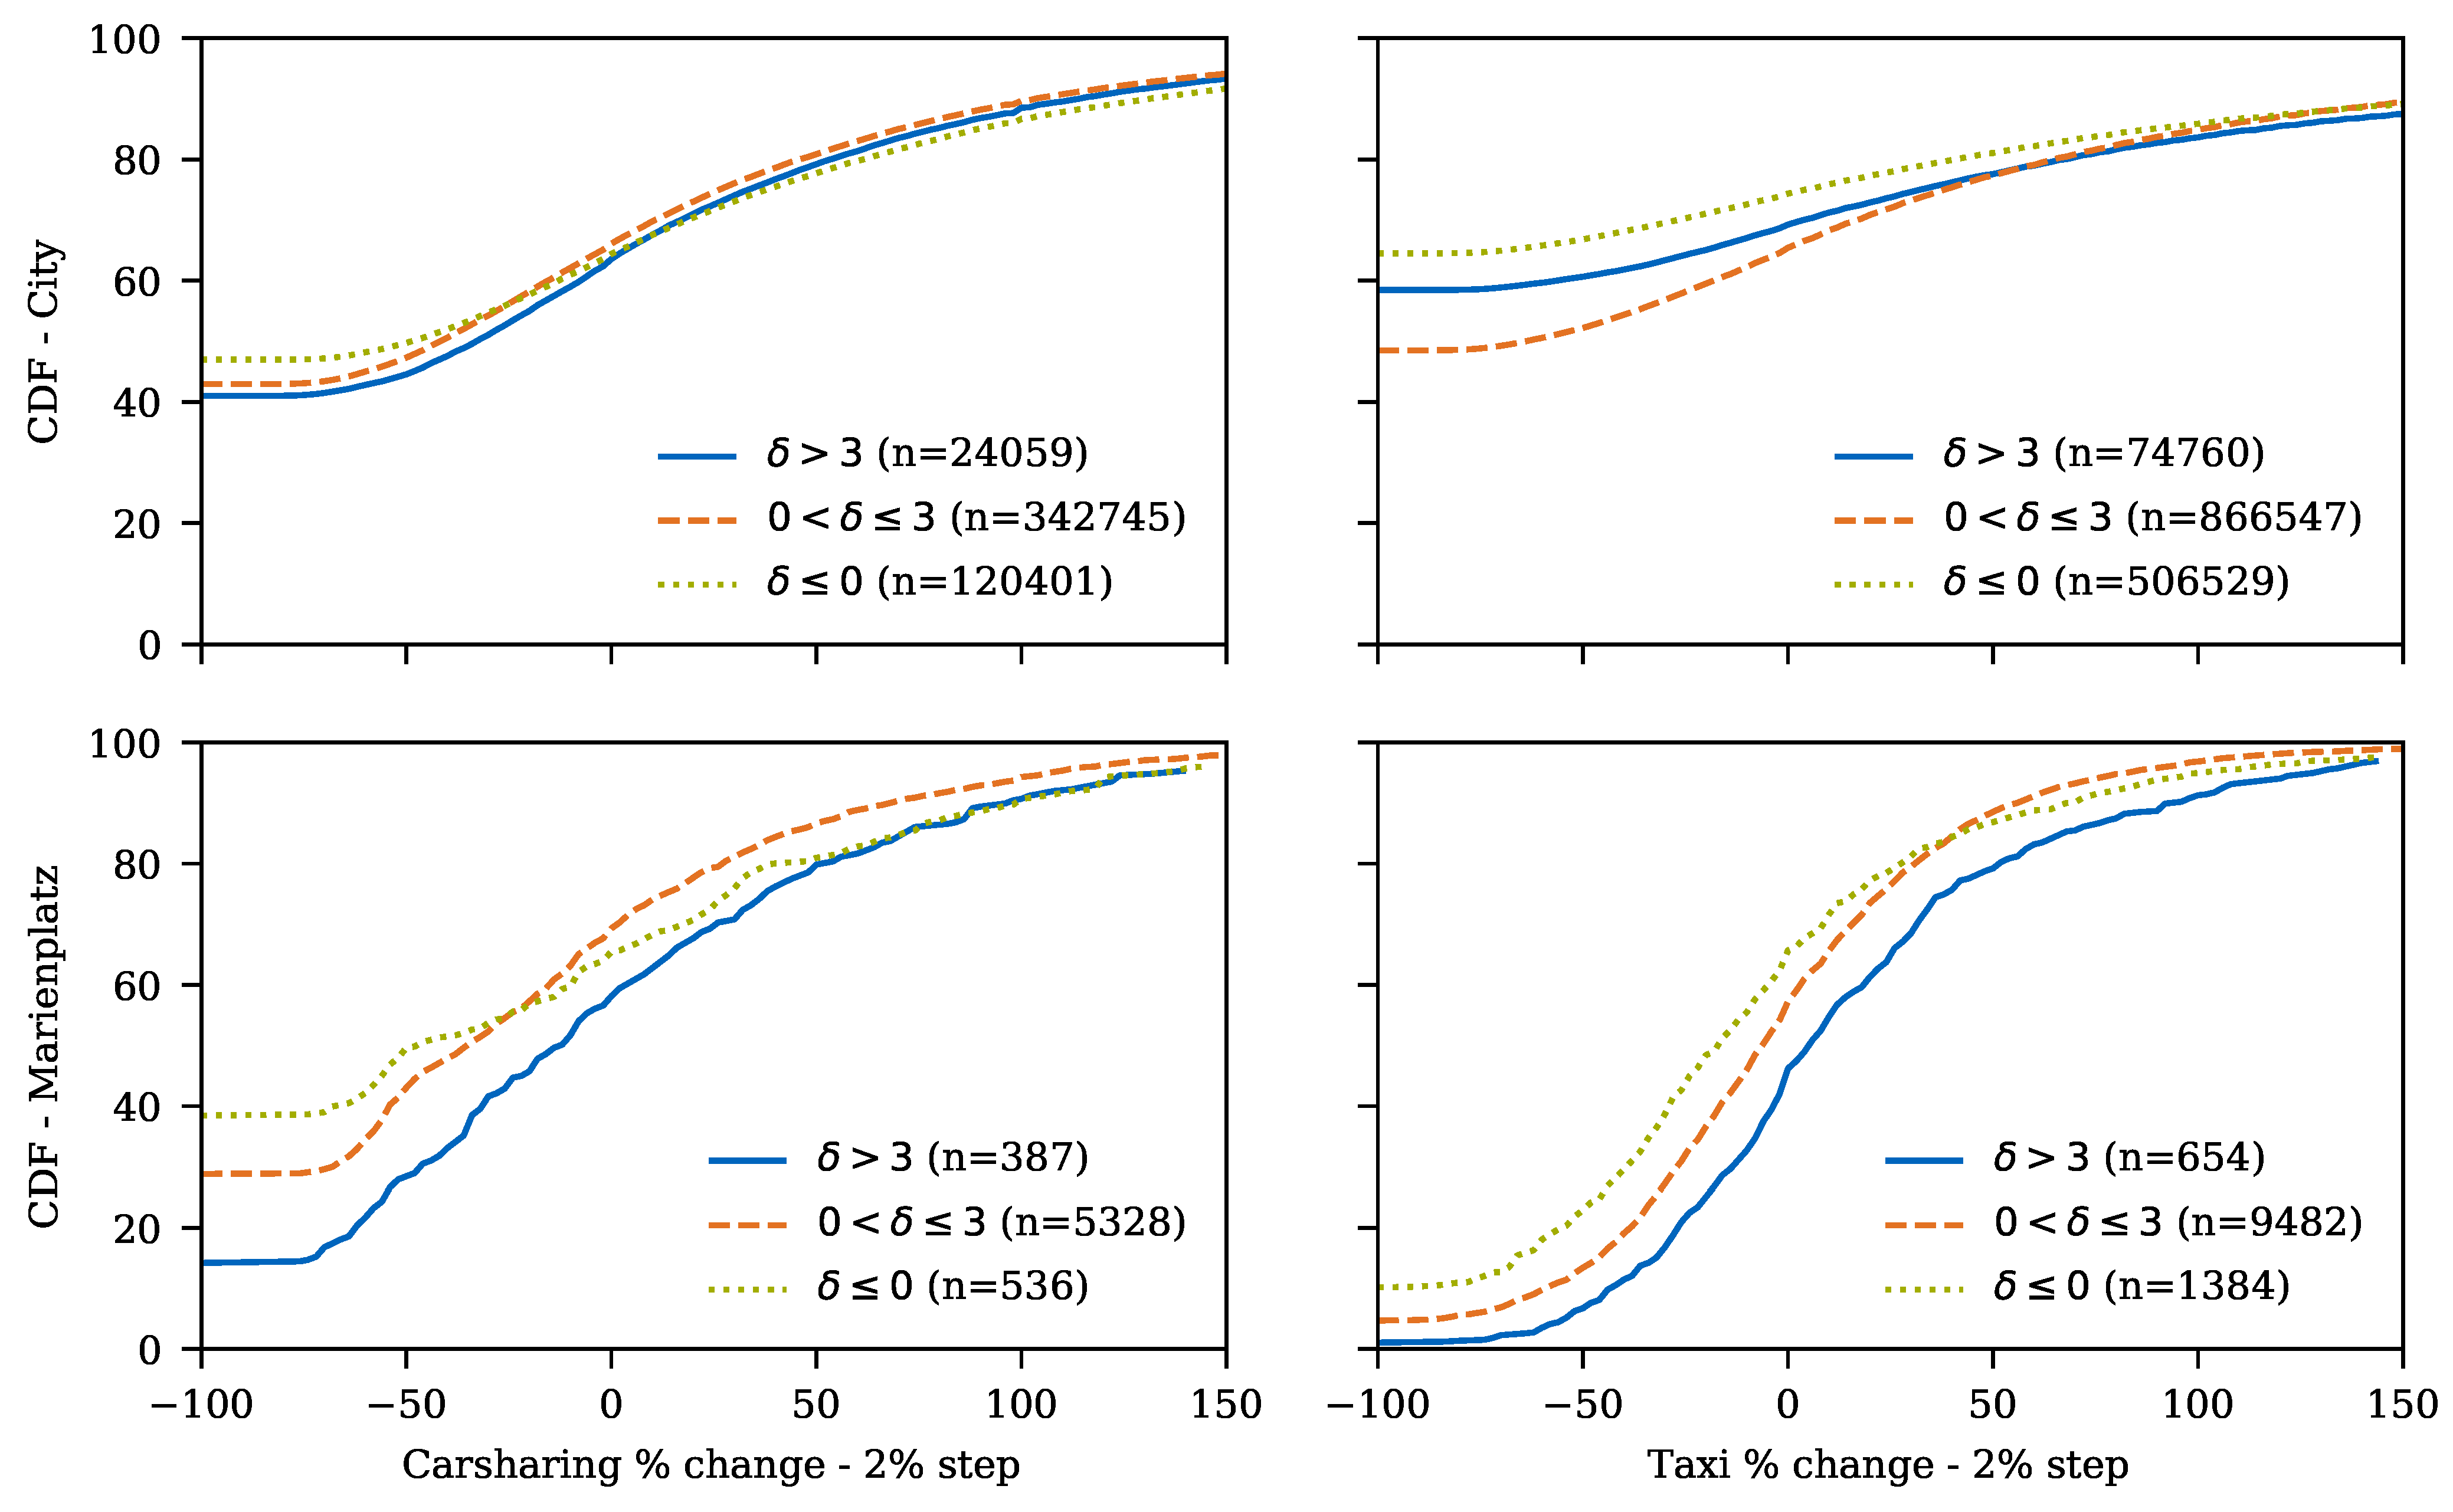
Station-timeframe tuples with high delays (mean delay min.) more frequently result in high taxi and carsharing demand than tuples with lower maximum delays. Tuples are clustered by the observed demand relative to the mean for this station-timeframe tuple (in 2% bins), and the observed maximum delay (no delay, up to 3 min. delay, and higher delays).
Figure 8 reports the relative frequency for each tuple by means of a cumulative distribution function (CDF). It is obvious that the higher the delay, the more frequent high demand instances appear. While this indicates some dependency, it does not yet show how delays and demand correlate.
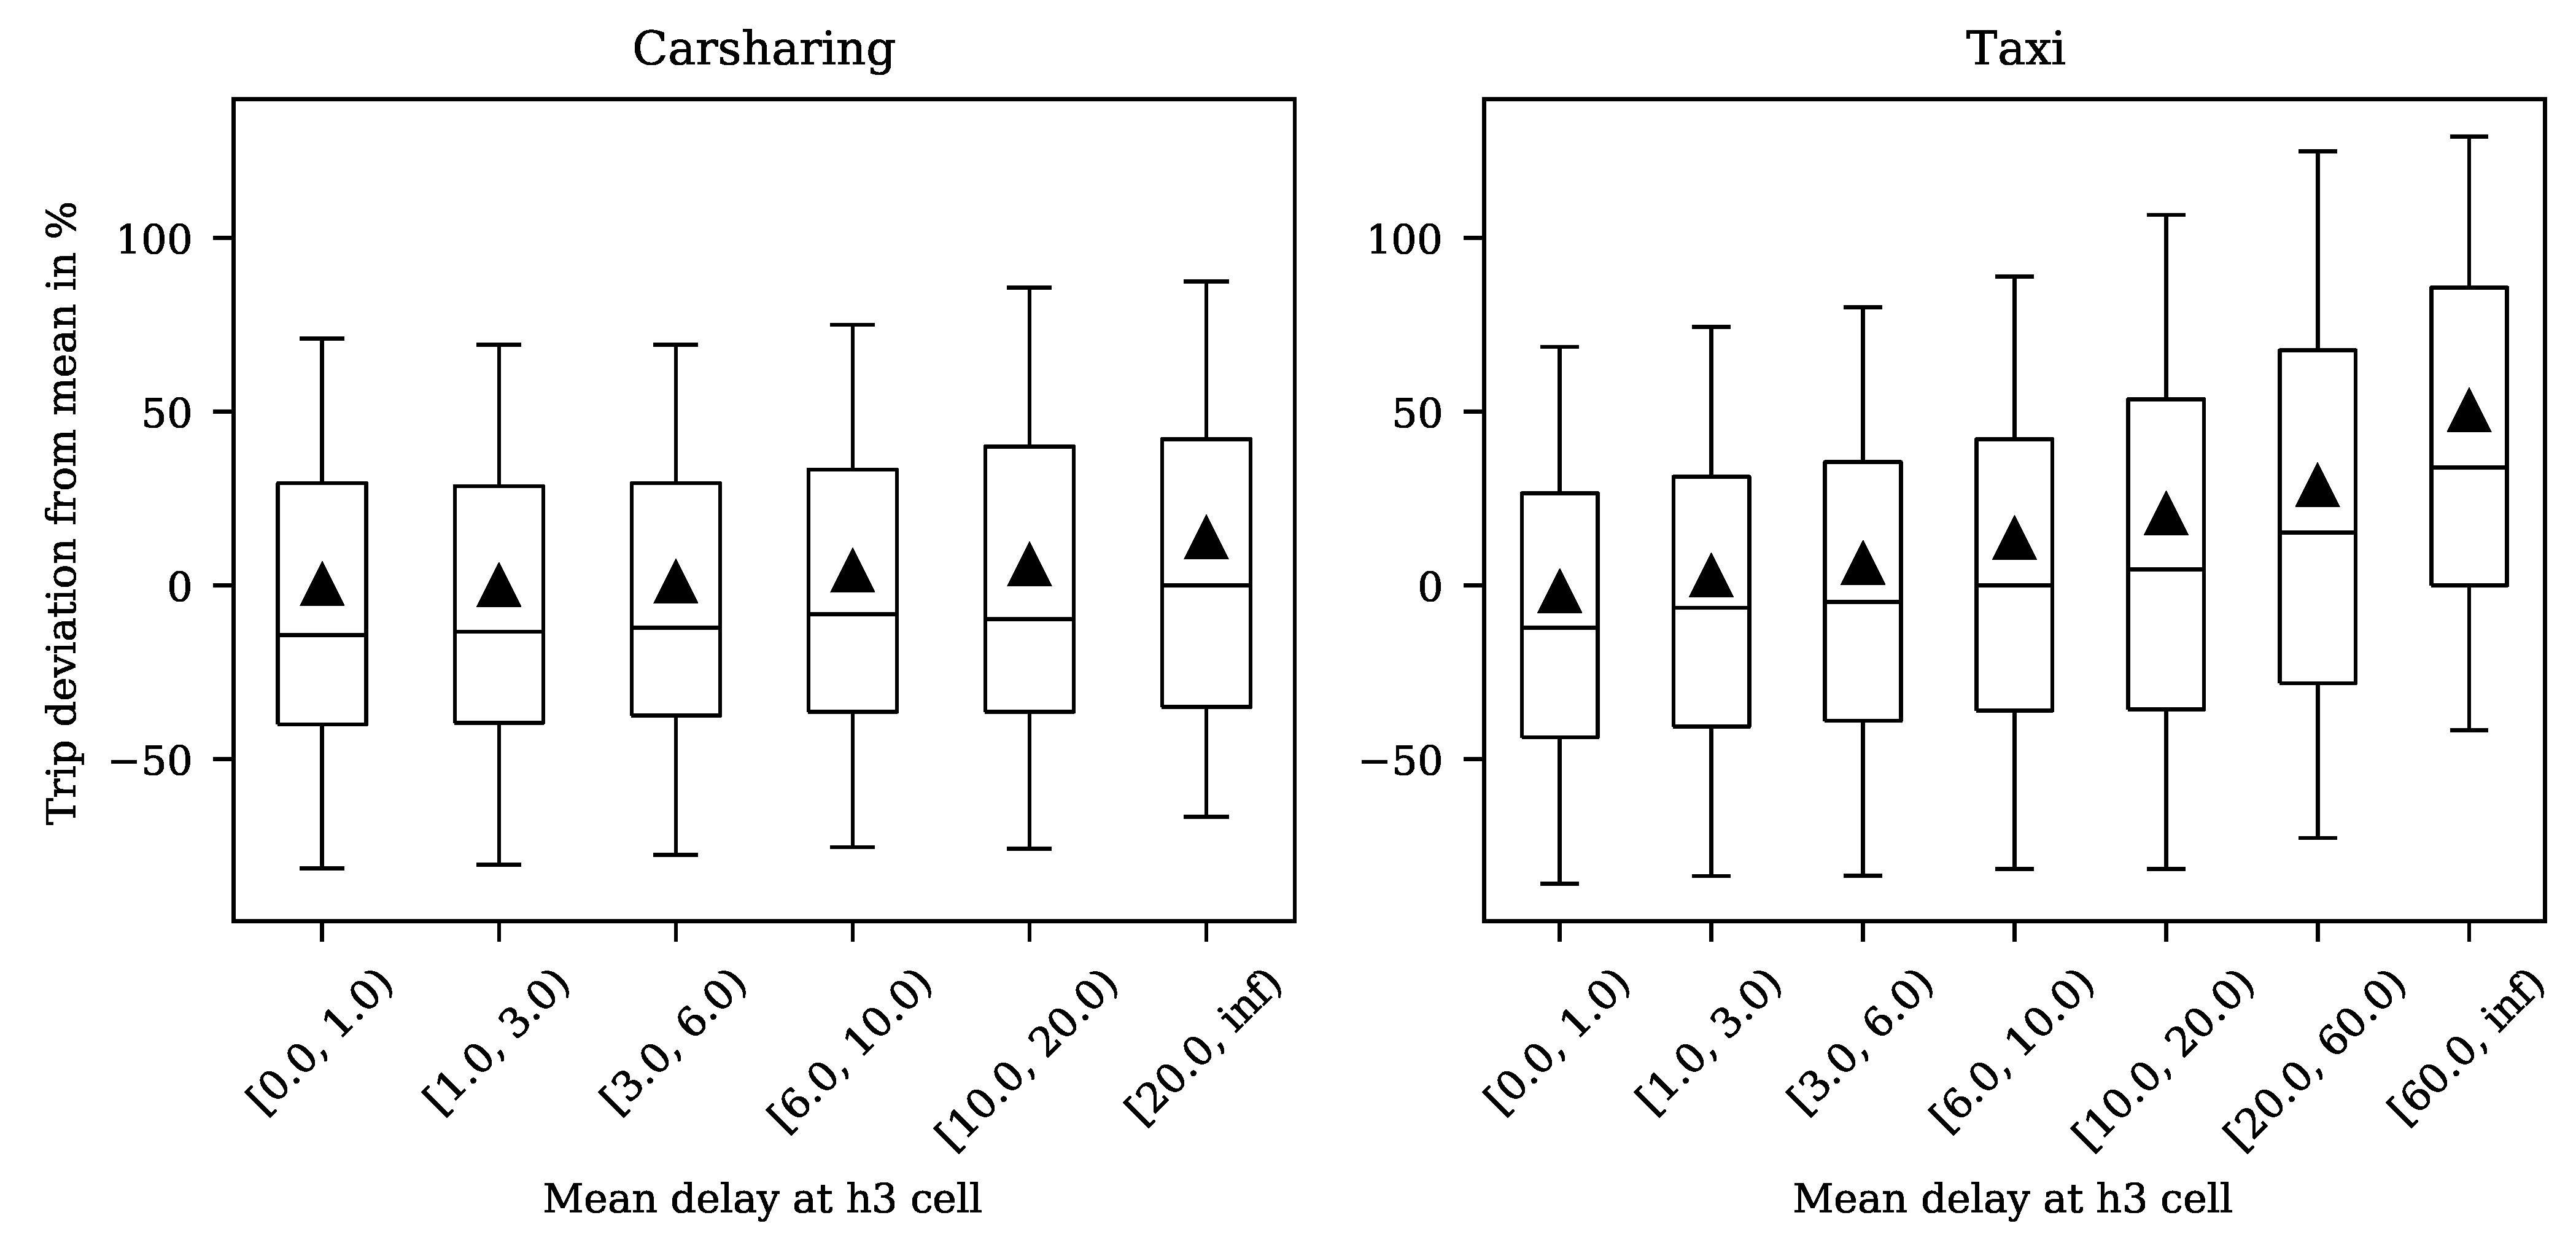
To this end, we further observe that any increase in public transit delays entails an increase of the demand for taxi and carsharing services. We group the data points by delay (in intervals: [0, 1), [1, 3), [3, 6), [6, 10), [10, 20), [20, 60), [60,
∞), with the last two being aggregated for carsharing due to a low number of data points). The lower number of high delay data points is a consequence of filtering potentially censored demand points in the carsharing data.
Figure 9 depicts the boxplots of trip deviations from mean for carsharing and taxi. For ease of exposition, the boxplots do not contain outliers. The trip deviation from mean increases from 0.0% to 13.5% for carsharing, and −2.1% to 50.0% for taxi.
Thus, it is clear that MoD demand and public transit delay are correlated, even though other external factors (time of day, station, weather, events) also exert a strong influence.
4.2. Explained Demand Variance Due to Delays
We showed that the demand for MoD increases if delays occur. However, delays are not the only factor that can explain variances in the MoD demand, and some randomness is intrinsic to the system. In order to measure the explanatory power of delays on MoD demand, we assume that demand at a station during a given timeframe can be predicted using the mean value as a baseline, and measure how much the variance decreases when correcting the trip counts for the delay. Therefore, we filter the dataset for observations in which a mean delay ≥3 is observed. Thus, we define a lookup function , which returns the mean percentage trip deviation for each delay bin.
The data points are transformed into the deviation dev
from mean
for location
i and timeframe
t.
resulting in the “basic” data set
S, and potentially corrected by
resulting in the “corrected” data set
.
Each set of data points
S and
can be represented as a density function. The histograms for the density functions can be found in
Figure 10.
We individually compute the variance in each data set as
where
and
refer to the average over all
and
, respectively. The relative decrease in variance from the basic to corrected data set (
S to
) corresponds to the fraction of demand variation that can be explained by delays in the public transit network.
Thus, we can explain 4.1% of the variance by delays for carsharing and 18.8% for taxi. Consequentially, demand prediction accuracy can be improved by considering the delays during periods of high delay. At first, explaining 4.1% of carsharing demand may not seem much, but, when considering the abundant number of influencing factors (weather, events, ...), uncertainties of human behavior, the fact that delays do not vary too much, and spatial differences in the explanatory power, explaining 4.1% is already significantly improving the situation of MoD operators in a business with low profit margins. The explanatory power of delays on taxi demand variation is significantly higher. Technically, this is a consequence of larger maximum correction factors returned by the function
, as readily visible from
Figure 9. It appears as if users rather switch to taxi than to carsharing if delays occur. This suggests that carsharing customers, on average, have a lower valuation of time than taxi customers, which is backed by general intuition. It does not necessarily mean that the user groups of taxi and public transit are overlapping more than the user groups of carsharing and public transit, but might rather point towards a lower willingness to wait among taxi users.
4.3. Changing Demand Patterns in Presence of Known Outages
While one might assume that MoD demand increases during an outage (and such a correlation has been reported by [
23]), we cannot support this assumption based on our data. In Munich, the total demand does not significantly change on days with outages.
This might be due to the fact that outages are commonly known before, and travelers, therefore, either forgo trips, or use private vehicles or bikes. This indicates that, while taxi and carsharing are an alternative to public transit if the delay was unexpected, customers tend to use a different mode of transportation or omit trips if the delay was known before.
Instead, demand patterns (given by trip origins) change. For every day in the observation period, we compare the relative taxi demand per origin-destination pair to the previous year by means of a Wasserstein distance. The Wasserstein distance (also known as the Earth mover’s distance) refers to the "work necessary" to transform one distribution into another. We compare the difference between two vectors
and
, where
refers to the relative demand distribution in the previous year for some timeframe
t
and analogous for
(because outages occur for a longer period of time, and since random demand imbalances can occur within the day with Integer demands, we aggregate timeframes
t to a daily level). To increase comparability, we compare any day in the current year to the closest day in the previous year, which is the same weekday (e.g., Monday 4 November 2019 to Monday 5 November 2018), and omit days that were a public holiday in either year. The Wasserstein distance per timeframe
t is then calculated by solving the following linear program of a transportation problem
where the decision variables
refer to the amount of demand that is "shifted", and
refers to the Euclidean distance between locations
i and
j (representing the "difference" between demand patterns, i.e., the transportation cost).
There are 21 days on which the main line of the S-Bahn was closed in one direction at one station, and 10 instances where the main line was closed in both directions. While taxi data are available for all days in the observation period, carsharing data are only available on 20 and six of these days, respectively.
We test whether the Wasserstein distances increase (or decrease) during outages when comparing an instance with an outage 2019 and no outage 2018 using a two-tailed Welch’s
t-test.
Table 2 lists the results for carsharing and taxi. Carsharing demand patterns significantly (
) differ in presence of delays, given by a significantly increasing Wasserstein distance, for one-directional and two-directional closures, both independently and jointly. For taxi demand patterns, the null hypothesis (mean Wasserstein distances do not differ, travel patterns are similar) cannot be rejected for uni-directional closures (In this case, the mean Wasserstein distance even decreased insignificantly.) and all closures. Wasserstein distances for taxi demand patterns significantly increase (at a significance level of 10%) when the main track was closed in both directions. Thus, we conclude that demand patterns change in the presence of outages, and MoD operators should include this information in demand prediction at the local level.
4.4. Decrease of Demand along Lines during COVID-19
During the recent COVID-19 pandemic, demand decreased significantly (average number of taxi trips from 9 March to 3 May 2020 decreased by a factor of 3.5 as compared to the previous year; this decrease is significant at
using a Welch’s
t-test). Reduced mobility is one of the key levers to reduce the spread of a pandemic, as [
37] show for Italy. Surprisingly, the relative demand along public transportation lines also decreased (15.9% of all trips vs. 20.8%). This result is significant according to a Welch’s
t-test at all commonly used significance levels (see the results in
Table 3).
When combined with the decreasing delays during this period (see
Table 4), this provides anecdotal evidence that the increased punctuality made it unnecessary to choose alternative modes of transportation.
4.5. Potential for Fleet Size Reduction
Public authorities can reduce congestion in the road network as well as the necessary fleet size of MoD operators by improving the punctuality of the public transit system, since a higher delay of the public transit service entails higher demand for MoD.
If all the delays were 0, the average demand for taxi would decrease by 2.2%, and the average demand for carsharing would decrease by 0.5%, as given by the shift to the left-most bin in in
Figure 9. If all delays were reduced by 50%, the average demand for taxi would decrease by 1.6%, and the average demand for carsharing would decrease by 0.5%. These values are computed by artificially reducing the average delay for each time interval at each location, and correcting the observed demand according to the corresponding carsharing/taxi trip deviation.
These demand reductions can serve as an upper bound for potential fleet size reductions. The actual fleet size reduction may be less due to risk pooling in the presence of stochastic demand. It stands to reason that the number of trips in privately owned cars also reduces, even though the exact values might differ. This indicates that road-congestion might be alleviated by reducing delays of the public transit operator, and making it more reliable.
5. Discussion and Conclusions
In this paper, we study the effect of public transit delays on MoD operators, i.e., carsharing and taxi. If customers judge trips based on some combination of travel time and travel cost, demand for the "outside option" (e.g., MoD) will increase if the travel time for public transit increases. We conduct large-scale experiments using carsharing and taxi trip data and public transit departure data for 10 months in Munich, Germany.
Demand for MoD increases if public transit delays increase. The mean demand for carsharing varies by up to 13.5% and the mean taxi demand varies by up to 52.1%, depending on the extent of the delay.
4.1% of carsharing and 18.8% of taxi demand variance can be explained if public transit is delayed. Thus, it seems as if carsharing customers valued travel time less than taxi customers. Because public transit delay is only one of many influencing factors (besides weather, events, and others), the explanatory power is high.
If the public transit operator were delayed less, the necessary carsharing and taxi fleet could be reduced by up to 0.5% and 2.2%, respectively. Even if delays did not vanish entirely, the number of taxi and carsharing trips could decrease substantially. Thus, public authorities might improve the public transit with the goal of reducing the congestion in their road network. Improvements of the public transit operator to alleviate congestion exceeds all approaches (e.g., [
38]) for regulations of MoD discussed in existing literature, and poses an interesting line for future research.
Customers adapt their travel patterns if the public transit service is not operating. Unlike existing literature, we do not find that demand increases during outages. Most likely, a substantial number of travelers decide to delay their trip until the end of the outage, as outages are known upfront. Among the remaining travelers, origin-destination pairs change significantly, given by an increasing Wasserstein distance when comparing the origin–destination distribution to the previous year.
A few comments are in order: we only measure correlation, but no cause–effect relationship. It could also be possible that an increase in carsharing and taxi usage increases the delay for public transit. However, from an application point of view, this is unrealistic for rail traffic, and even the maximum number of carsharing vehicles and taxis should not incur significant delays for road-based public transit (bus, rail replacement services). Additionally, both public transit delays and carsharing/taxi demand might be dependent on an external influence that we did not correct for. While we cannot prove that no external source caused the correlation, a causal relation is the most likely explanation. Further, we must mention that the measured effect is minimal. This is because the S-Bahn has very similar and rather low delays on most instances. It is possible that some passengers choose MoD, rather than public transit already due to the current mean delay. Our method cannot capture this and, therefore, only returns a lower bound on the influence of public transit delays on MoD demand. Because the data set only permits integer delays and since delays are subject to external influences, the effects remain minimal. More precise data would permit a more extensive analysis. However, this approach is important, since it allows third parties, such as policy makers or new market entrants, in order to measure the effect with data they have available, or can easily collect. The evidence that carsharing and taxi can help in increasing accessibility is rather anecdotal. Insights can be strengthened in future research if data are available prior and posterior to opening new lines in the public transit system. In future work, our results can be used to approximate a customer choice function in a data-driven fashion.
Author Contributions
Conceptualization, L.M. and M.W.; methodology, L.M. and M.W.; software, L.M., M.W. and X.L.; validation, L.M., M.W. and X.L.; investigation, L.M., M.W. and X.L.; resources, M.W.; data curation, L.M., M.W. and X.L.; writing—original draft preparation, L.M. and M.W.; writing—review and editing, L.M. and M.W.; visualization, M.W. and X.L.; supervision, L.M.; project administration, L.M. and M.W. All authors have read and agreed to the published version of the manuscript.
Funding
The work of Layla Martin and Xinyu Li was supported by Deutsche Forschungsgemeinschaft as part of the Research Training Group 2201 (Advanced Optimization in a Networked Economy). The work of Xinyu Li was partially supported by the German Academic Exchange Service. The work of Michael Wittmann was independently funded by the Chair of Automotive Technology.
Acknowledgments
The authors would like to thank IsarFunk Taxizentrale GmbH & Co. KG for providing real world taxi data.
Conflicts of Interest
The authors declare no conflict of interest.
References
- INRIX. INRIX Verkehrsstudie: Stau Verursacht Kosten in Milliardenhöhe; INRIX: Kirkland, WA, USA, 2020; Available online: https://inrix.com/press-releases/2019-traffic-scorecard-german/ (accessed on 5 November 2020).
- Banister, D. Cities, mobility and climate change. J. Transp. Geogr. 2011, 19, 1538–1546. [Google Scholar] [CrossRef]
- Strong Towns. We Should Be Building Cities for People, Not Cars. 2018. Available online: https://www.strongtowns.org/journal/2018/7/2/we-should-be-building-cities-for-people-not-cars (accessed on 28 February 2020).
- Liu, Y.; Bansal, P.; Daziano, R.; Samaranayake, S. A framework to integrate mode choice in the design of mobility-on-demand systems. Transp. Res. Part C Emerg. Technol. 2019, 105, 648–665. [Google Scholar] [CrossRef] [Green Version]
- Hess, D.; Brown, J.; Shoup, D. Waiting for the Bus. J. Public Transp. 2004, 7, 67–84. [Google Scholar] [CrossRef] [Green Version]
- Le Vine, S.; Lee-Gosselin, M.; Sivakumar, A.; Polak, J. A new approach to predict the market and impacts of round-trip and point-to-point carsharing systems: Case study of London. Transp. Res. Part D Transp. Environ. 2014, 32, 218–229. [Google Scholar] [CrossRef]
- Nobis, C.; Kuhnimhof, T. Mobilität in Deutschland—MiD Ergebnisbericht; Technical Report; Infas, DLR, IVT and Infas 360: Bonn, Berlin, 2018. [Google Scholar]
- Van Exel, N.J.A.; Rietveld, P. Perceptions of public transport travel time and their effect on choice-sets among car drivers. J. Transp. Land Use 2010, 2, 75–86. [Google Scholar] [CrossRef]
- Rayle, L.; Dai, D.; Chan, N.; Cervero, R.; Shaheen, S. Just a better taxi? A survey-based comparison of taxis, transit, and ridesourcing services in San Francisco. Transp. Policy 2016, 45, 168–178. [Google Scholar] [CrossRef] [Green Version]
- Albiński, S.; Fontaine, P.; Minner, S. Performance analysis of a hybrid bike sharing system: A service-level-based approach under censored demand observations. Transp. Res. Part E Logist. Transp. Rev. 2018, 116, 59–69. [Google Scholar] [CrossRef]
- Basciftci, B.; Ahmed, S.; Shen, S. Distributionally robust facility location problem under decision-dependent stochastic demand. Eur. J. Oper. Res. 2020. [Google Scholar] [CrossRef]
- Salazar, M.; Lanzetti, N.; Rossi, F.; Schiffer, M.; Pavone, M. Intermodal autonomous mobility-on-demand. IEEE Trans. Intell. Transp. Syst. 2020, 21, 3946–3960. [Google Scholar] [CrossRef]
- Guidon, S.; Reck, D.J.; Axhausen, K. Expanding a(n) (electric) bicycle-sharing system to a new city: Prediction of demand with spatial regression and random forests. J. Transp. Geogr. 2020, 84, 102692. [Google Scholar] [CrossRef] [Green Version]
- Vosooghi, R.; Puchinger, J.; Jankovic, M.; Sirin, G. A critical analysis of travel demand estimation for new one-way carsharing systems. In Proceedings of the 2017 IEEE 20th International Conference on Intelligent Transportation Systems (ITSC), Yokohama, Japan, 16–19 October 2017; pp. 199–205. [Google Scholar]
- Brodeur, A.; Nield, K. An empirical analysis of taxi, Lyft and Uber rides: Evidence from weather shocks in NYC. J. Econ. Behav. Organ. 2018, 152, 1–16. [Google Scholar] [CrossRef]
- Markou, I.; Kaiser, K.; Pereira, F.C. Predicting taxi demand hotspots using automated Internet Search Queries. Transp. Res. Part C Emerg. Technol. 2019, 102, 73–86. [Google Scholar] [CrossRef]
- Markou, I.; Rodrigues, F.; Pereira, F.C. Real-Time Taxi Demand Prediction using data from the web. In Proceedings of the IEEE 2018 21st International Conference on Intelligent Transportation Systems (ITSC), Maui, HI, USA, 4–7 November 2018; pp. 1664–1671. [Google Scholar]
- Schmöller, S.; Weikl, S.; Müller, J.; Bogenberger, K. Empirical analysis of free-floating carsharing usage: The Munich and Berlin case. Transp. Res. Part C Emerg. Technol. 2015, 56, 34–51. [Google Scholar] [CrossRef]
- Yang, C.; Gonzales, E.J. Modeling taxi trip demand by time of day in New York City. Transp. Res. Rec. 2014, 2429, 110–120. [Google Scholar] [CrossRef] [Green Version]
- Alemi, F.; Circella, G.; Mokhtarian, P.; Handy, S. What drives the use of ridehailing in California? Ordered probit models of the usage frequency of Uber and Lyft. Transp. Res. Part C Emerg. Technol. 2019, 102, 233–248. [Google Scholar] [CrossRef]
- Correa, D.; Xie, K.; Ozbay, K. Exploring the taxi and Uber demand in New York City: An empirical analysis and spatial modeling. In Proceedings of the 96th Annual Meeting of the Transportation Research Board, Washington, DC, USA, 8–12 January 2017. [Google Scholar]
- Kopp, J.; Gerike, R.; Axhausen, K.W. Do sharing people behave differently? An empirical evaluation of the distinctive mobility patterns of free-floating car-sharing members. Transportation 2015, 42, 449–469. [Google Scholar] [CrossRef]
- Tyndall, J. Free-floating carsharing and extemporaneous public transit substitution. Res. Transp. Econ. 2019, 74, 21–27. [Google Scholar] [CrossRef]
- Ampudia-Renuncio, M.; Guirao, B.; Molina-Sánchez, R.; de Álvarez, C.E. Understanding the spatial distribution of free-floating carsharing in cities: Analysis of the new Madrid experience through a web-based platform. Cities 2020, 98, 102593. [Google Scholar] [CrossRef]
- Sprei, F.; Habibi, S.; Englund, C.; Pettersson, S.; Voronov, A.; Wedlin, J. Free-floating car-sharing electrification and mode displacement: Travel time and usage patterns from 12 cities in Europe and the United States. Transp. Res. Part D Transp. Environ. 2019, 71, 127–140. [Google Scholar] [CrossRef]
- Hall, R.W. Passenger waiting time and information acquisition using automatic vehicle location for verification. Transp. Plan. Technol. 2001, 24, 249–269. [Google Scholar] [CrossRef]
- Vande Walle, S.; Steenberghen, T. Space and time related determinants of public transport use in trip chains. Transp. Res. Part A Policy Pract. 2006, 40, 151–162. [Google Scholar] [CrossRef]
- He, Y.; Zhao, Y.; Tsui, K.L. Modeling and Analyzing Impact Factors of Metro Station Ridership: An Approach Based on a General Estimating Equation. IEEE Intell. Transp. Syst. Mag. 2020, 12, 195–207. [Google Scholar] [CrossRef]
- Weikl, S.; Bogenberger, K. A practice-ready relocation model for free-floating carsharing systems with electric vehicles—Mesoscopic approach and field trial results. Transp. Res. Part C Emerg. Technol. 2015, 57, 206–223. [Google Scholar] [CrossRef]
- Jäger, B.; Wittmann, M.; Lienkamp, M. Analyzing and modeling a City’s spatiotemporal taxi supply and demand: A case study for Munich. J. Traffic Logist. Eng. 2016, 4. [Google Scholar] [CrossRef]
- Uber Engineering. H3—A Hexagonal Hierarchical Geospatial Indexing System. 2020. Available online: https://h3geo.org/ (accessed on 28 February 2020).
- Jorge, D.; Correia, G. Carsharing systems demand estimation and defined operations: A literature review. Eur. J. Transp. Infrastruct. Res. 2013, 13. [Google Scholar] [CrossRef]
- Afian, A.; Odoni, A.; Rus, D. Inferring unmet demand from taxi probe data. In Proceedings of the 2015 IEEE 18th International Conference on Intelligent Transportation Systems, Las Palmas de Gran Canaria, Spain, 15–18 September 2015; pp. 861–868. [Google Scholar]
- Negahban, A. Simulation-based estimation of the real demand in bike-sharing systems in the presence of censoring. Eur. J. Oper. Res. 2019, 277, 317–332. [Google Scholar] [CrossRef]
- Deutscher Taxi- und Mietwagenverband e.V. BZP Geschäftsbericht 2017/2018; Technical Report; Deutscher Taxi- und Mietwagenverband e.V.: Frankfurt am Main, Germany, 2020. [Google Scholar]
- Wittmann, M.; Neuner, L.; Lienkamp, M. A Predictive Fleet Management Strategy for On-Demand Mobility Services: A Case Study in Munich. Electronics 2020, 9, 1021. [Google Scholar] [CrossRef]
- La Gatta, V.; Moscato, V.; Postiglione, M.; Sperli, G. An Epidemiological Neural network exploiting Dynamic Graph Structured Data applied to the COVID-19 outbreak. IEEE Trans. Big Data 2020. [Google Scholar] [CrossRef]
- Yan, X.; Levine, J.; Zhao, X. Integrating ridesourcing services with public transit: An evaluation of traveler responses combining revealed and stated preference data. Transp. Res. Part C Emerg. Technol. 2019, 105, 683–696. [Google Scholar] [CrossRef]
| Publisher’s Note: MDPI stays neutral with regard to jurisdictional claims in published maps and institutional affiliations. |
© 2021 by the authors. Licensee MDPI, Basel, Switzerland. This article is an open access article distributed under the terms and conditions of the Creative Commons Attribution (CC BY) license (http://creativecommons.org/licenses/by/4.0/).


