Article

Experimental Evaluation of Malware Family Classification Methods from Sequential Information of TLS-Encrypted Traffic

1
Cyber Security Major, Division of Applied Mathematical Sciences, Korea University Sejong Campus, Sejong 30019, Korea
2
Department of Cyber Security, Graduate School, Korea University, Sejong 30019, Korea
*
Author to whom correspondence should be addressed.
Electronics 2021, 10(24), 3180; https://doi.org/10.3390/electronics10243180
Submission received: 28 November 2021 / Revised: 14 December 2021 / Accepted: 17 December 2021 / Published: 20 December 2021
(This article belongs to the Special Issue Advances on Networks and Cyber Security)

Abstract

:
In parallel with the rapid adoption of transport layer security (TLS), malware has utilized the encrypted communication channel provided by TLS to hinder detection from network traffic. To this end, recent research efforts are directed toward malware detection and malware family classification for TLS-encrypted traffic. However, amongst their feature sets, the proposals to utilize the sequential information of each TLS session has not been properly evaluated, especially in the context of malware family classification. In this context, we propose a systematic framework to evaluate the state-of-the-art malware family classification methods for TLS-encrypted traffic in a controlled environment and discuss the advantages and limitations of the methods comprehensively. In particular, our experimental results for the 10 representations and classifier combinations show that the graph-based representation for the sequential information achieves better performance regardless of the evaluated classification algorithms. With our framework and findings, researchers can design better machine learning based classifiers.

1. Introduction

While the secure sockets layer (SSL), an encryption protocol designed for web applications, has been used with the broad adoption of the internet in the 1990s, the adoption of SSL and its successor transport layer security (TLS) was less than half of the web traffic until the mid 2010s [1]. Recently, however, the use of SSL/TLS was popularized with rapid growth. According to Google’s Transparency Report [2], about 95 % of the traffic across Google is encrypted with HTTPS (HTTP with TLS). Even with the up-to-date version of TLS (TLS 1.3) approved in August 2018, it took less than one year for more than 15% of websites to support the up-to-date TLS, while TLS 1.2 required around 5 years to achieve the same 15% adoption rate [3].
In parallel with the rapid adoption of TLS, unfortunately, malware is used to hinder detection from traffic. For example, Ref. [4] reports that even 91.5% of malware was arrived from encrypted traffic in the 2nd quarter of 2021. However, existing network security solutions, such as signature-based intrusion detection system (IDS) and deep packet inspection (DPI), do not work, so current industrial approaches tend to utilize TLS interception mechanisms, which can violate the confidentiality goals of TLS [5].
In this context, recently, there were several research efforts directed toward detecting or classifying TLS-encrypted traffic generated by malware or specific malware family, utilizing statistical [6], machine learning-based [7,8,9], or neural network-based [10,11] methods. A majority of the works extract flow-level features, such as sequences of message type, packet length, and interarrival time (SPLT), pre-process the features in an appropriate representation, and select a better (statistical or machine learning-based) classifier from multiple classifiers. However, due to various goals and constraints in malware traffic classification, comparison among the classification methods is rarely conducted, especially in the context of malware family classification. Furthermore, while feature representation and learning for the classifiers are important issues in machine learning applications [12], existing research efforts in malware family classification rarely report the performance comparison among different feature representations and learning approaches.
To this end, in this article, we propose a systematic framework to evaluate malware family classification methods for TLS-encrypted traffic in a controlled environment. To evaluate the existing research efforts with different feature representation and learning fairly in a common environment, we utilize the framework to extract a common flow-level feature (i.e., flow length sequence and directions) from TLS-encrypted traffic and evaluate several malware family classification methods. By conducting experiments in our proposed framework, we discuss the existing methods more comprehensively.
In summary, our work makes the following contributions for the TLS-encrypted malware family classification problem:
  • We propose an evaluation framework for TLS-encrypted malware family classification with the same configuration and the same input, which allows different sequential information representations and classification algorithms to be evaluated. We discuss the reasons that such experimental evaluation should be conducted in Section 2.4.
  • In the evaluation of traffic classification methods especially for supervised learning-based methods, we need to obtain an appropriate labeled dataset. However, unfortunately, we find that the existing community efforts on labeled dataset with malware family traffic samples have some flaws. To this end, we describe a method to obtain better dataset in a public repository. More information can be found in Section 2.3.
  • We provide experimental evaluation results with various criteria for the state-of-the-art methods which utilize sequential information (e.g., packet length sequence and directions) and can be applied in the malware family classification problem. Our results show that the state-of-the-art methods have several advantages and limitations to be resolved by future work.
The rest of this article is organized as follows. In Section 2, we provide comprehensive backgrounds and related research efforts in encrypted traffic classification as well as  challenges of malware family classification for TLS-encrypted traffic. Section 3 describes our systematic framework for the malware family classification in terms of feature representations and classification algorithms. In Section 4, we discuss the evaluation results with the state-of-the-art methods with various criteria. Our conclusions are drawn in Section 5.

2. Backgrounds and Related Work

In this section, we describe the backgrounds and related research efforts in encrypted traffic classification and discuss the necessity of evaluating several malware family classification methods in a fair configuration. Note that correlating/associating multiple encrypted flows with the same characteristics (e.g., BLINC [13]) is out of our scope. That is, we only cover flow-level traffic classification methods, where each encrypted flow is classified independently.

2.1. Early Encrypted Traffic Classification Methods

Traffic classification has been investigated for more than 20 years with well-established literature [14]. To the best of our knowledge, however, the first comprehensive survey on encrypted traffic classification [15] appeared in 2015, in spite of the widespread use of secure network protocols. Before the early 2010s, many research efforts were conducted to classify encrypted traffic into a coarse-grained application type (e.g., chat, game, and web surfing) or application protocol (e.g., HTTPS, SSH, SFTP and Skype) as an alternative to port-based application protocol identification (which gives protocol information quickly with little complexity but was already known as an unreliable approach at that time [16]) and DPI solutions (which are no longer able to be utilized for encrypted traffic).
To this end, several methods were designed for near real-time classification of application protocol. As an example, focusing on SSL/TLS-encrypted traffic, Bernaille and Teixeira [17] proposed a semi-supervised machine learning-based classification method. In this approach, only the sizes and directions of the first few data packets in a SSL-encrypted flow are extracted so that near real-time classification is possible with more than 85% accuracy.
On the other hand, there are a lot of research efforts on non real-time application identification. As a notable instance, Sun et al. [18] proposed a naive Bayes classifier to identify application protocol from SSL/TLS-encrypted flows. The classifier utilizes several flow-level statistics, such as mean/max/min packet length, mean/max/min inter-arrival time, flow duration, and the number of packets as features. However, this work reports a simple binary protocol identification result (between HTTPS and ToR) with 94.52% accuracy. Note that the statistical features can be obtained only after completion of the flow so that real-time identification is not achievable.

2.2. Recent Advances in TLS-Encrypted Traffic Classification Methods

In the last decade, with the growing adoption of TLS, advanced classification methods for TLS-encrypted traffic were introduced in the literature. We discuss several notable approaches in three-fold.

2.2.1. Exploiting Sequential Information of TLS Flow

While application data are encrypted in a TLS flow, sequential feature of the TLS flow may contain information related to application’s behavior. In the early methods, there is a tendency to use some representative values (partly due to high space complexity), but recent works try to convert such sequential features into a compact representation to identify or detect a specific application (instead of application layer protocol).
Korczynski and Duda [6] proposed a Markov chain-based stochastic fingerprinting method, which derives a Markov chain model from TLS message type sequences of flows for each application. This work confirms that high accuracy classification is possible with the proposed method due to incorrect implementation, protocol misuse, diversity in server configuration, and the application nature. Shen et al. [19] extended the model to the second-order Markov chain. Similarly, Anderson and McGrew [20] generated Markov chains from packet length and interarrival time sequences of each flow for machine learning-based malware detection. In contrast, FS-Net [10] proposes an end-to-end recurrent neural network (RNN) classification model, which learns features from packet length sequences. FS-Net also reports that the packet length sequence is more representative than the message type.
Recently, Shen et al. [11] proposed the notion of the traffic interaction graph (TIG) to represent a packet length sequence with directions and introduced graph neural network-based representation learning for distributed application classification, called GraphDApp. Figure 1 shows an example of a packet length sequence and the corresponding TIG, where each node corresponds to a packet length, each vertical edge represents the order of consecutive packets in each burst, and each horizontal edge indicates the range between neighboring bursts. To this end, TIG is a powerful representation which summarizes the packet direction, packet length, packet burst, and packet ordering information.
In this paper, we evaluate a hybrid version of [6,9] (i.e., deriving a Markov chain model from packet length sequences of flows for each malware family), FS-Net, and GraphDApp [11].

2.2.2. Fine-Grained Classification for TLS-Encrypted Traffic in Mobile Apps

With the massive adoption of mobile devices and a wide range of mobile applications, several research efforts were directed toward encrypted mobile traffic classification to infer fine-grained private information.
For example, Conti et al. [21] collected TLS-encrypted traffic of popular Android mobile apps, such as Gmail, Facebook, Twitter, Dropbox, Evernote, etc., and inferred specific user action within each app from the packet length sequences and directions. This work utilized both supervised (i.e., random forest) and unsupervised (i.e., agglomerative clustering) machine learning algorithms with a dynamic time warping (DTW)-based distance metric. AppScanner [22], Taylor et al. [23] proposes a novel method for automatic fingerprinting and the real-time identification of Android apps from encrypted or unencrypted network traffic based on support vector machine (SVM) and random forest classifiers. Since AppScanner’s classification framework is designed for high scalability, 110 applications are used to generate its test set.
The aforementioned advances in mobile apps can be applicable for malware family classification, but due to different goals and constraints, the direct adoption of the classification methods into malware family classification seems to be infeasible.

2.2.3. Malware Detection and Family Classification from TLS-Encrypted Traffic

As described in Section 1, research efforts to detect or classify TLS flows generated by malware or malware family have appeared in recent years.
In particular, a set of works by Anderson and McGrew in Cisco Systems [7,8,20] proposes to collect more flow features which are not supported in the standard NetFlow records for network telemetry. The enhanced flow features include SPLT (i.e., packet length sequence and interarrival time sequence), the byte distribution of the encrypted packet payloads, and TLS flow metadata (which can be collected from TLS handshake messages). Furthermore, Anderson and McGrew [7] suggested the notion of contextual flows of a TLS flow, which are defined as DNS and HTTP flows from the same source IP address within a 5 min window, and showed that the enhanced flow features and contextual flow information can be used to detect malware traffic very accurately but with a controlled false discover rate. Anderson and McGrew [8] concluded that in TLS-encrypted malware detection, the random forest ensemble method outperforms popular supervised learning classifiers, such as linear regression, logistic regression, decision tree, SVM, and multi-layer perceptron, even with noisy labels. In addition, Lee et al. [24] proposed a malware detection method which uses incremental learning algorithms with carefully chosen contextual flow information.
For malware family classification for TLS-encrypted traffic, [9] showed that the L1 multinomial logistic regression classifier with the enhanced flow features can classify TLS-encrypted malware traffic into 1 of 18 classes (i.e., malware families) with a total accuracy of 90.3%. In [25], an XGBoost [26]-based malware family classification framework was proposed with a distance-based clustering method to measure the similarity between malware families. Ref. [27] proposed a multi-task hierarchical learning method, which is based on one-dimensional CNN and gives both mid-level class (e.g., malware family) and top-level class (e.g., either malware or benign) at the same time. In both [25,27], features were selected from the enhanced flow features.
In addition, Kim et al. [28] proposed an aligned and fixed-size TLS metadata representation method for malware family classification, which gives more than 93% accuracy in SVM and convolutional neural network (CNN) classifiers. The main motivation of the proposal was to visualize TLS metadata in images both for security experts and machine learning algorithms, inspired by research efforts in image visualization [29] from binary code and deep learning-based malware recognition [30,31,32]. More comprehensive discussion of the advantages of aligned, fixed-size, normalized, and complete packet representations for machine learning-based traffic classification for a variety of problems, including malware detection, was given in a recent work by Holland et al. [33].
While a majority of recent malware detection and malware family classification methods utilize a subset of the enhanced flow features, which can be exported by network devices [20], collecting such features may be inefficient in some scenarios, especially when there is no careful feature selection (e.g., [34]). To this end, MalClassifier [35] presents a malware family classification system from connection logs of a widely used real-time network monitoring framework called Bro (currently Zeek) [36]. Clearly, MalClassifier is efficient and can be operated in real time, but it is reported that a distance-based method [25] outperforms MalClassifer especially due to false positives due to the similarity of several malware families.
We should note that while we discussed some recent machine learning-based malware detection and family classification methods specialized for TLS-encrypted traffic, there is a broad range of machine learning-based techniques which complement or are used for network intrusion detection systems, which require diverse malicious network traffic (including TLS/SSL traffic) in general. Verkerken et al. [37] evaluated four unsupervised machine learning techniques on a modern real-world network traffic dataset. Gopalan et al. [38] provided a survey on research efforts to address the imbalanced dataset issue in machine learning-based techniques for network intrusion detection systems. Mauro et al. [39] gave a novel experimental-based review of neural network-based techniques for network intrusion management. Chou et al. [40] presented data-driven network intrusion detection methods from the past 10 years with a discussion on research trends and future directions.

2.3. Lack of Malware Family Dataset

As we observed in Section 2.2, research efforts toward malware family classification for TLS-encrypted traffic were conducted by only a few researcher groups in recent years. Amongst them, the set of works by Anderson and McGrew in Cisco Systems [20], Anderson and McGrew [7,8] gives arguably the most comprehensive and trustworthy results in this area. There are several reasons for the statement. At first, Cisco successfully commercialized the research effort with a name encrypted traffic analytics (ETA) [41]. Furthermore, the research team made their tools (Joy [42] and Mercury [43]) open-source with a fingerprint database for TLS metadata. However, unfortunately, the malware and legitimate TLS-encrypted traffic datasets in their works are not available publicly.
Actually, there are several research community efforts to collect and distribute unencrypted and encrypted malware traffic dataset [44]. In particular, as discussed by Thakkar and Lohiya [45], there are several malware traffic datasets, each of which has selected and pre-processed features especially for intrusion detection. However, these datasets typically do not provide sequential information of TLS flow discussed in Section 2.2.1, so recent research efforts in this area cannot be evaluated.
Therefore, many researchers obtain the sequential information from a raw malware traffic dataset, which is collected by themselves or acquired from a public repository. To the best of our knowledge, the most voluminous raw malware traffic dataset available publicly is offered by the Stratosphere IPS project [46]. With a feature dataset that is selectively chosen from this raw dataset, a recent malware traffic classification challenge called NetML 2020 [47] was held as a part of the NETAML workshop in conjunction with IJCAI-PRICAI 2020. In particular, the NetML feature dataset provides most of the enhanced feature set in [7]. However, while the community efforts should be appreciated, unfortunately, we have found that both datasets should be used with caution. For example, as shown in Figure 2b, the TrickBot samples in the NetML 2020 dataset have a simple Markov chain fingerprint due to the only communication pattern: ClientHello from the Trickbot and HandshakeFailure from the server due to the unsupported SSL/TLS version.
To this end, in this paper, we obtain malware family pcap samples from a public repository called https://www.malware-traffic-analysis.net (accessed on 15 November 2021) collected by a security expert from a sandbox. One of the important characteristics of the samples is validated by the expert with descriptions so that labeling the samples can be done consistently. Furthermore, the repository provides various malware family samples over time so that, although diverse, communication patterns due to the evolution of the malware family are captured. Figure 2a shows that the TrickBot samples in our dataset generate a complex Markov chain fingerprint due to diverse communication patterns. In this context, we believe that our dataset is suitable for fair evaluation among malware family classification methods. Note that technical details of our dataset are described in Section 4.1.

2.4. Need for Evaluation Based on Packet Length Sequences

Based on the previous discussion in this section, we insist that there is a need for evaluation based on packet length sequences, summarized as the following:
  • Recent research efforts [7,8,19,20] showed that we can successfully classify TLS-encrypted malware traffic without decryption in a coarse-grained manner (i.e., malware detection) and a fine-grained manner (i.e., malware family classification), provided that more features are collected from unencrypted parts of network traffic but selected by security experts. Similarly, more recent works [28,33] insisted that more generic representation of the unencrypted parts can leverage the burden of domain expertise with the introduction of machine learning.
  • Surprisingly, while there are various proposals to represent sequential information in TLS-encrypted traffic for machine learning-based classification, there is no clear discussion among the proposals, especially in the context of malware family classification due to diverse feature sets in the current methods. Considering a broad adoption of sequential information in recent research efforts, a fair experimental evaluation among the proposals (i.e., evaluation with the same configuration and the same input) should be given to understand which representations and classification algorithms are better than others.
  • In particular, the packet length sequence and directions in TLS-encrypted traffic can be easily obtained with lower overhead, compared with TLS metadata. In addition, the time complexity to obtain the packet length sequence is comparable with that of unique packet length features (e.g., mean, max, and min), while more space complexity is required [34]. Fortunately, the space complexity problem can be alleviated with the recent advances of storage technology in speed and volume or with the use of a fixed-size packet length sequence.
  • Currently, one minor but important advantage of flow sequential information is the measurability of the information in most scenarios of traffic classification. While the inclusion of TLS metadata as input improves accuracy, especially with the current dataset, a part of TLS metadata may be unavailable in some scenarios with TLS 1.2 session resumption, and a substantial part of TLS metadata is encrypted in TLS 1.3 [48] such that the information may be unavailable in near future.

3. Evaluation Framework

In this section, we describe our evaluation framework in detail. We first give an overview of our framework in brief, and we discuss the details in two parts: sequential information representationsand classification algorithms.

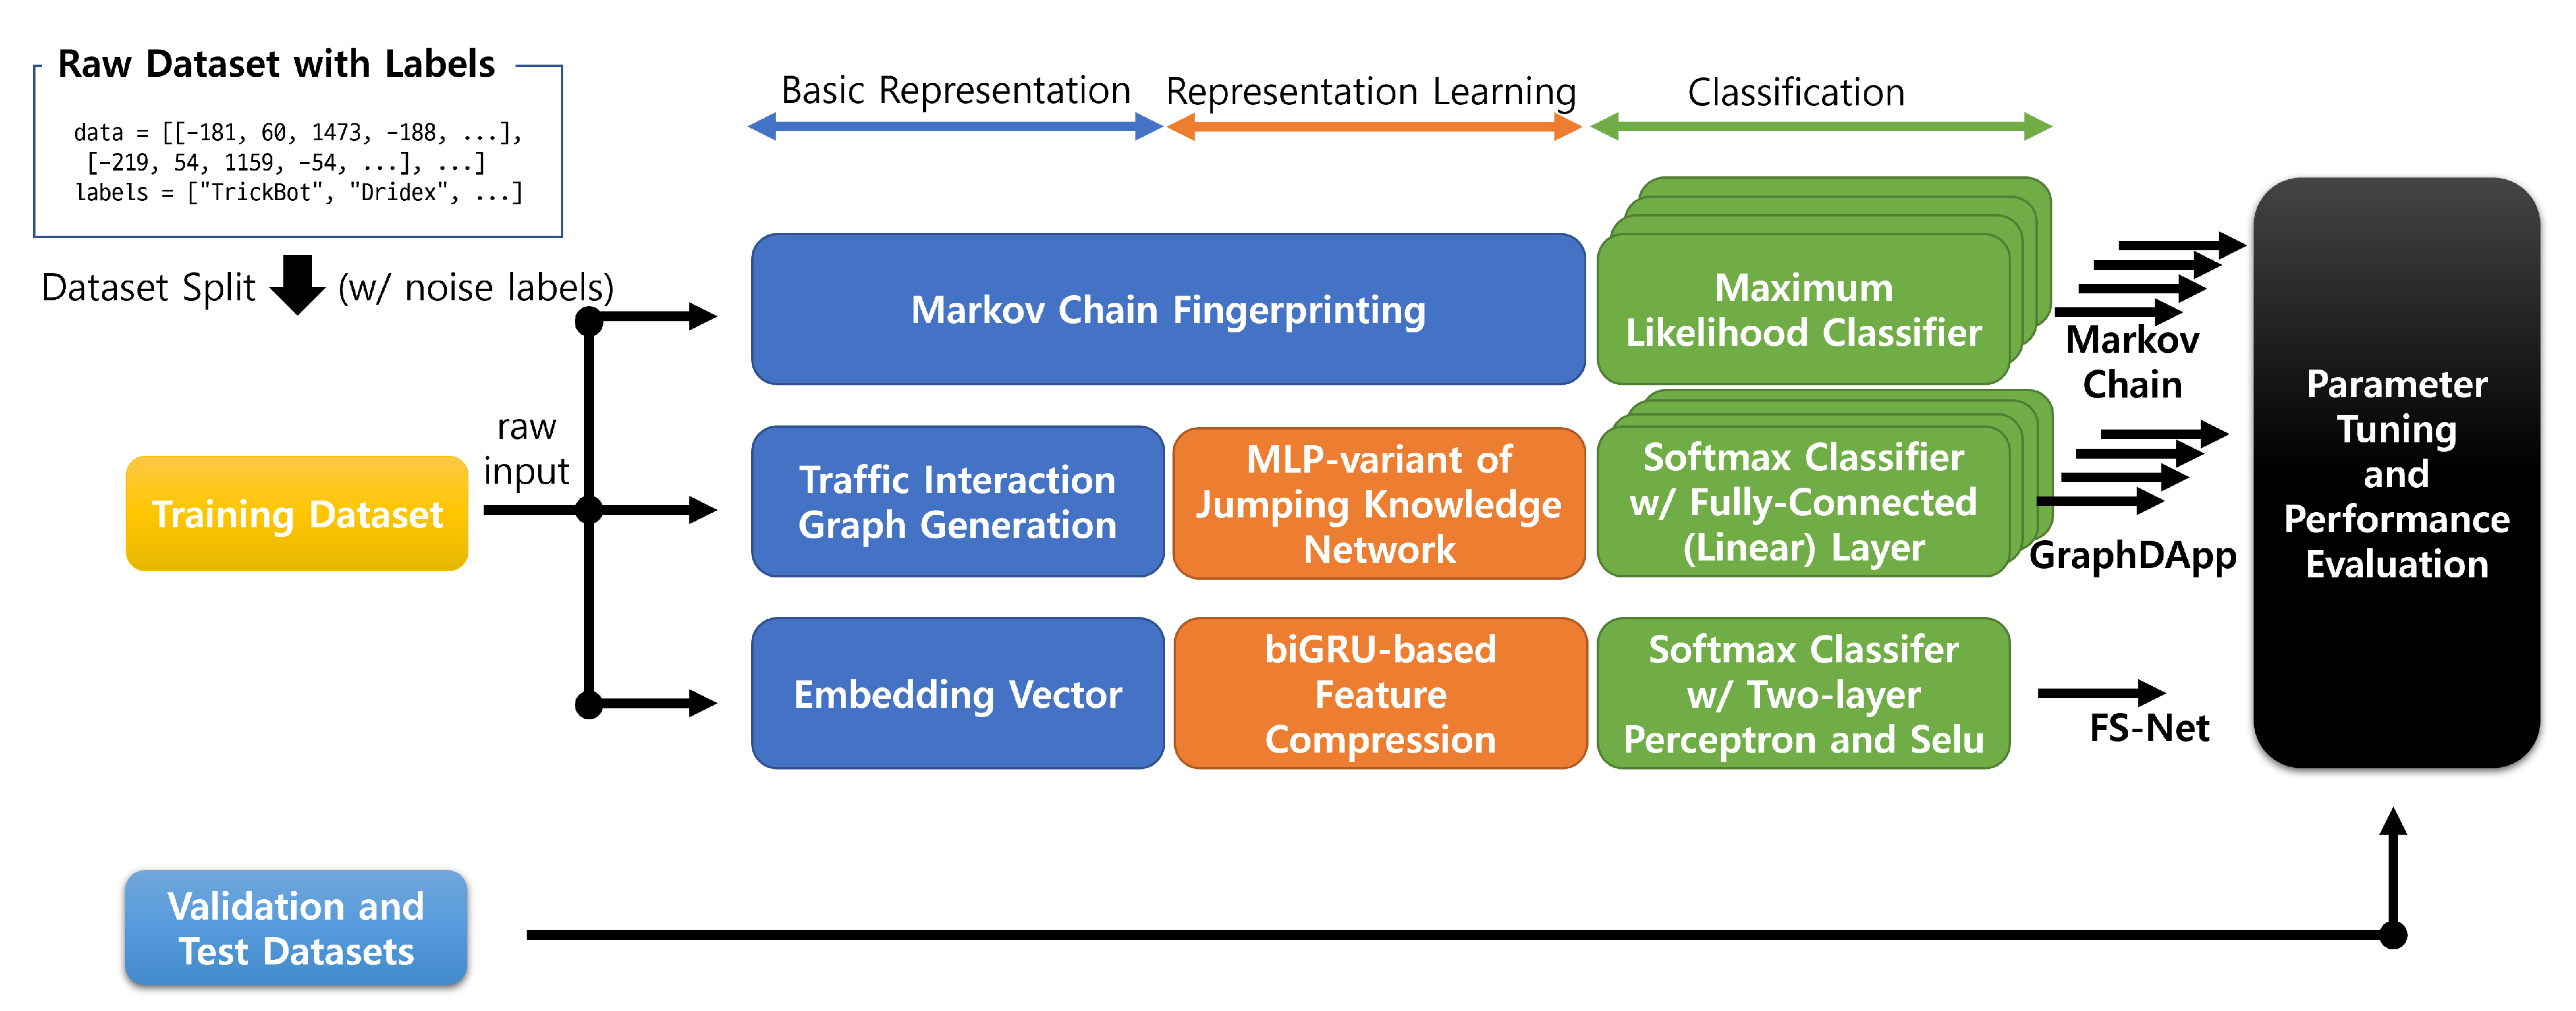
3.1. Framework Overview

As we discussed in Section 2.4, we focus on the evaluation of the state-of-the-art malware family classification methods in a evaluation framework with the same configuration and the same input, other than the sequential data representations and classification algorithms. Figure 3 sketches the overview of our evaluation framework.
In our framework, we use the packet length sequence and the directions of each TLS-encrypted traffic flow generated from the malware flow samples as raw input (i.e., a data point in the dataset). In an implementation perspective, the sequential flow information can be represented in a Python list of signed integers, where the sign represents the direction (as in Figure 1). We split the whole dataset into three datasets: training dataset for training, validation dataset for parameter tuning and test dataset for testing.
As we already described in Section 2.2.1, we evaluate three representative state-of-the-art methods: Markov chain fingerprinting (a hybrid of [6,9]), GraphDApp [11], and FS-Net [10]. The basic representations of each data point in the methods are Markov chain fingerprint, traffic interaction graph (TIG), and embedding vector, respectively.
In the training phase of Markov chain fingerprinting, a representative Markov chain fingerprint model is generated from all data points of each malware family. On the other hand, GraphDApp and FS-Net have their own representation learning methods described in Section 3.2.
In the classification phase, each method has its default classifier: the maximum likelihood classifier, the Softmax classifier with a fully-connected (linear) layer, and the software classifier with a two-layer perceptron and the Selu activation function, respectively. For the first two methods, we also include non-default classifiers, such as L1 logistic regression, linear SVM, decision tree, and random forest, some of which appeared in literature.
In the testing phase, we evaluate the trained classifiers with the test dataset with the standard metrics: accuracy, F1 score, recall, and precision. In addition, we also evaluate the classifiers with 3% noisy class labels to simulate inaccurate ground truth scenarios, which makes the adoption of machine learning slow in real deployments [8,49].

3.2. Feature Representations

In our framework, the following representation methods are applied.
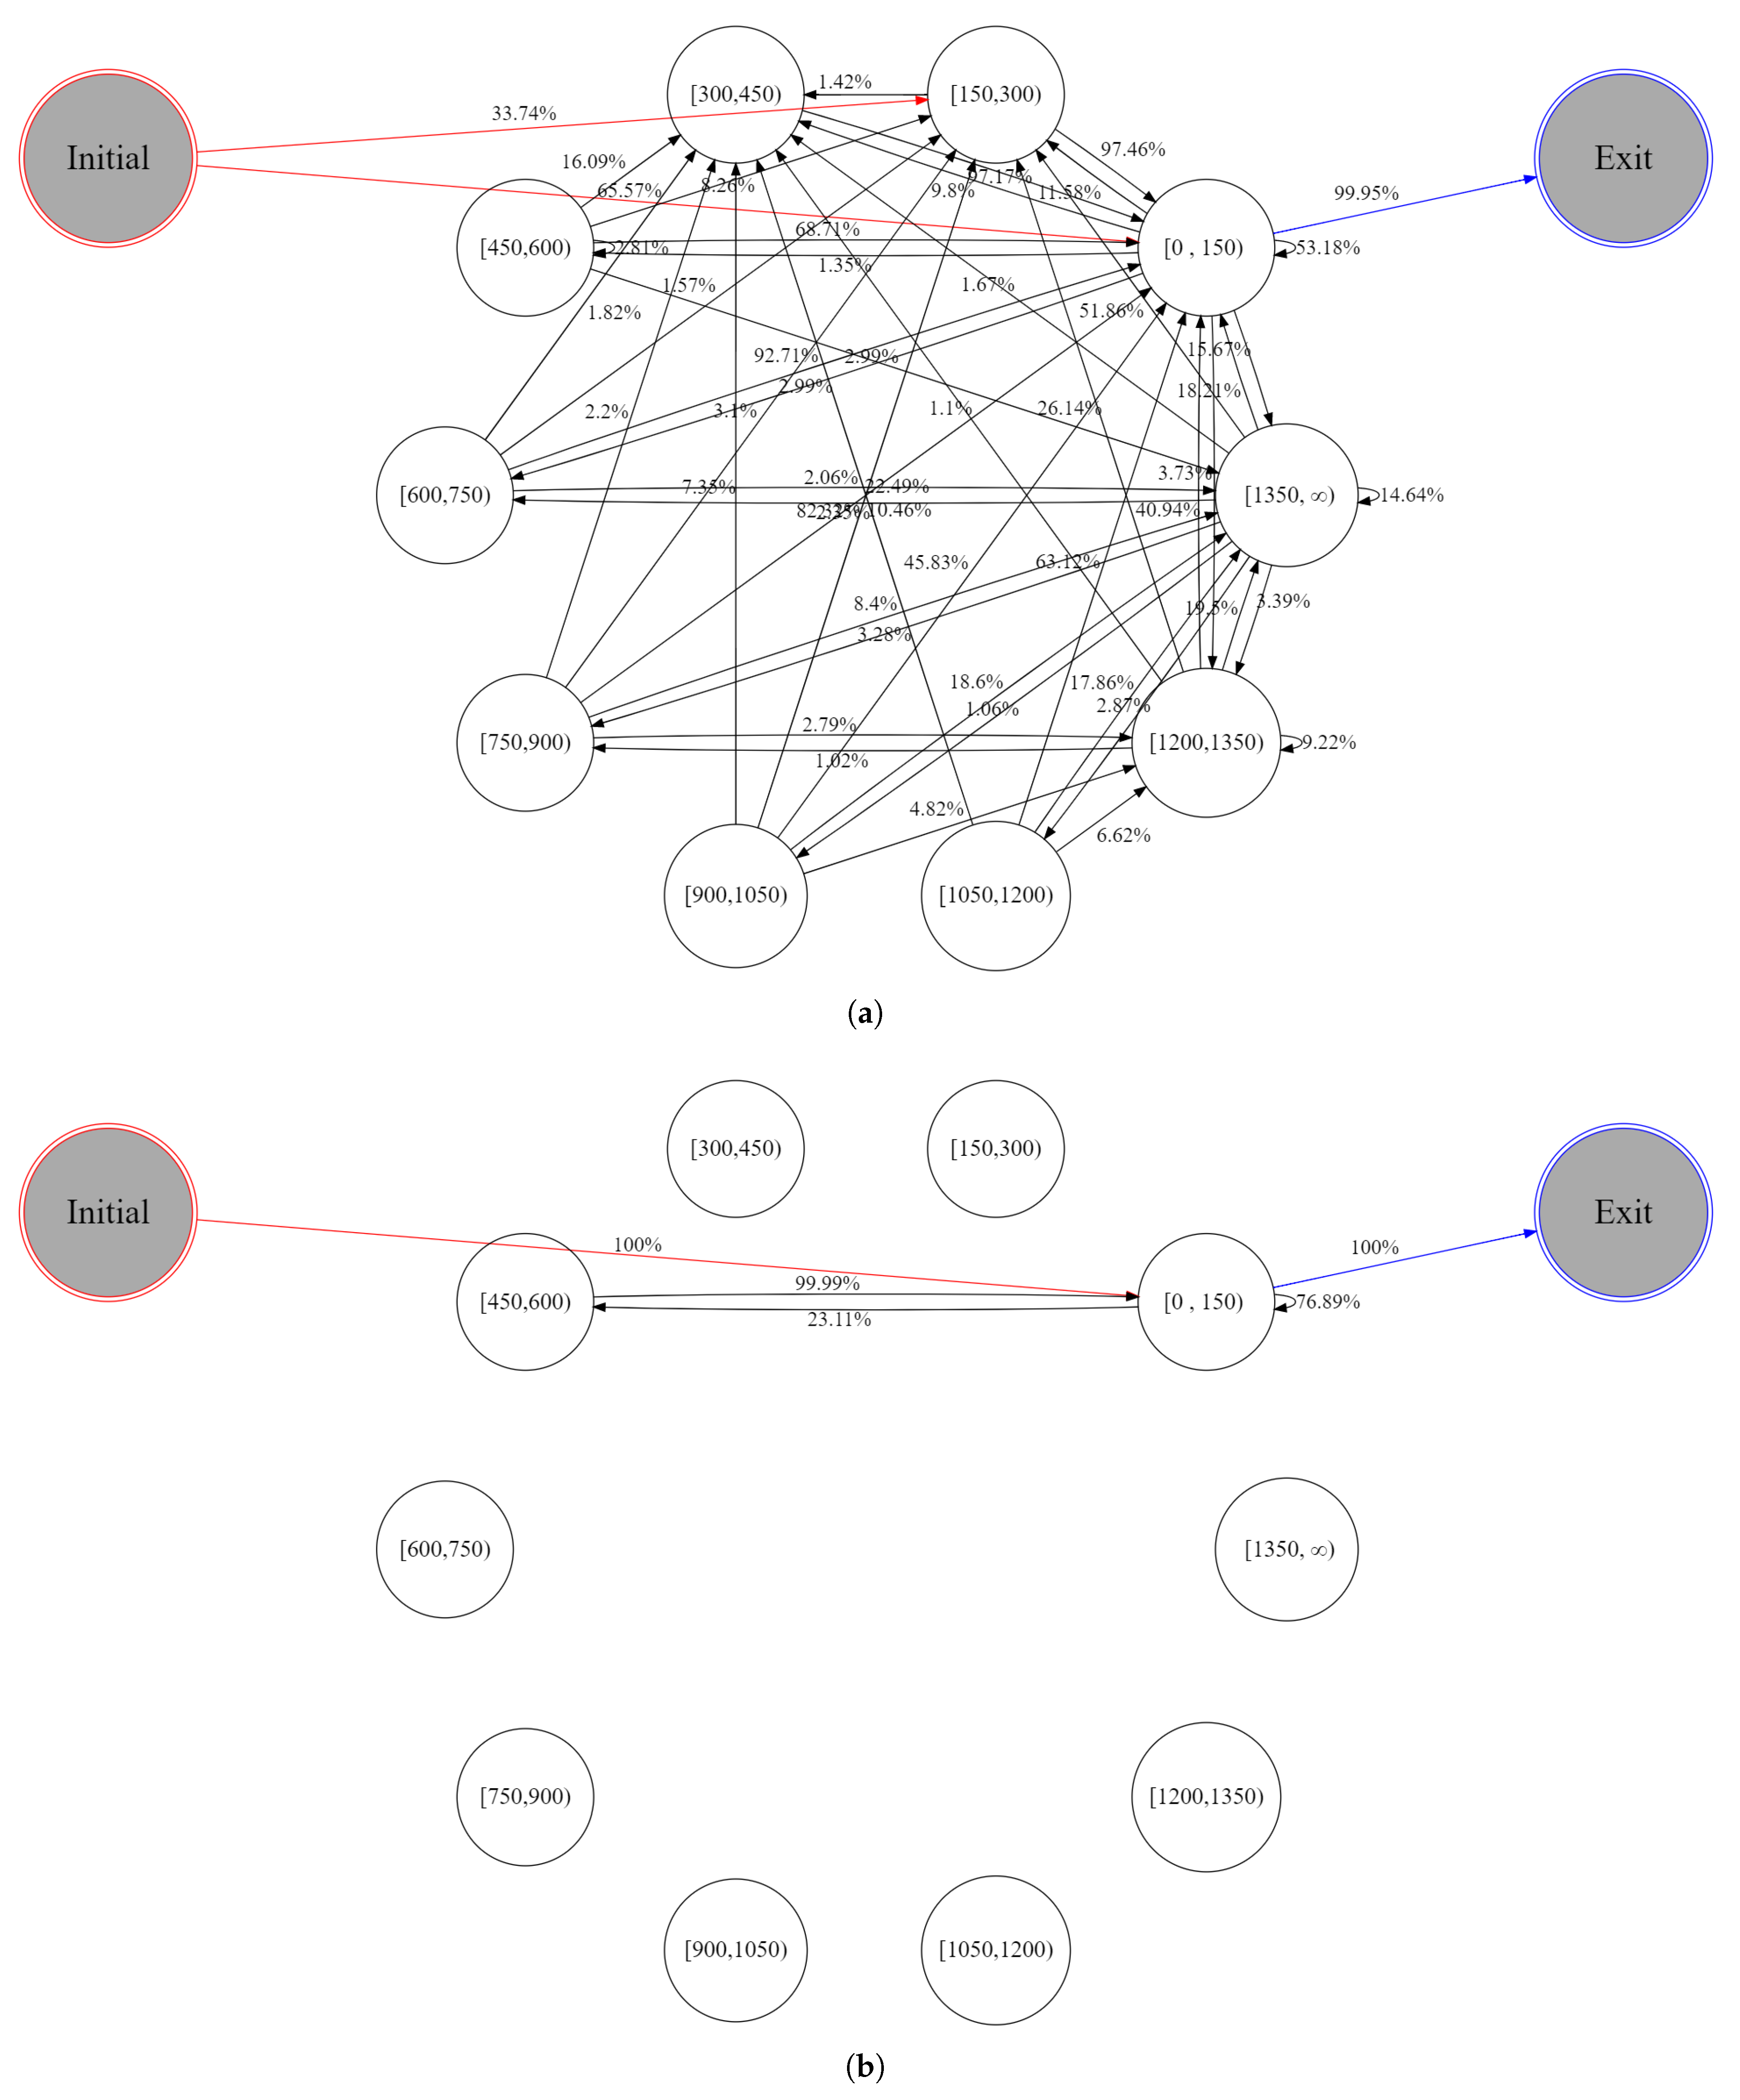
  • Markov chain fingerprinting: While the original paper on Markov chain fingerprinting [6] utilizes TLS message type sequences for feature representation of a TLS session (i.e., bidirectional flow), our input is the packet length sequence with their directions for the TLS session. On the other hand, the method used in [7,20] only considers the packet length sequence since each unidirectional flow is used in the method. To this end, we propose a hybrid method to use 150 byte bins for the packet length but allow the minus sign in order to represent the direction of the packet. It implies that a total of 20 states are available in our Markov chain fingerprints. We also generate the enter probability distribution Q = [ q i ] and the exist probability distribution W = [ w i ] described in [6] as features.
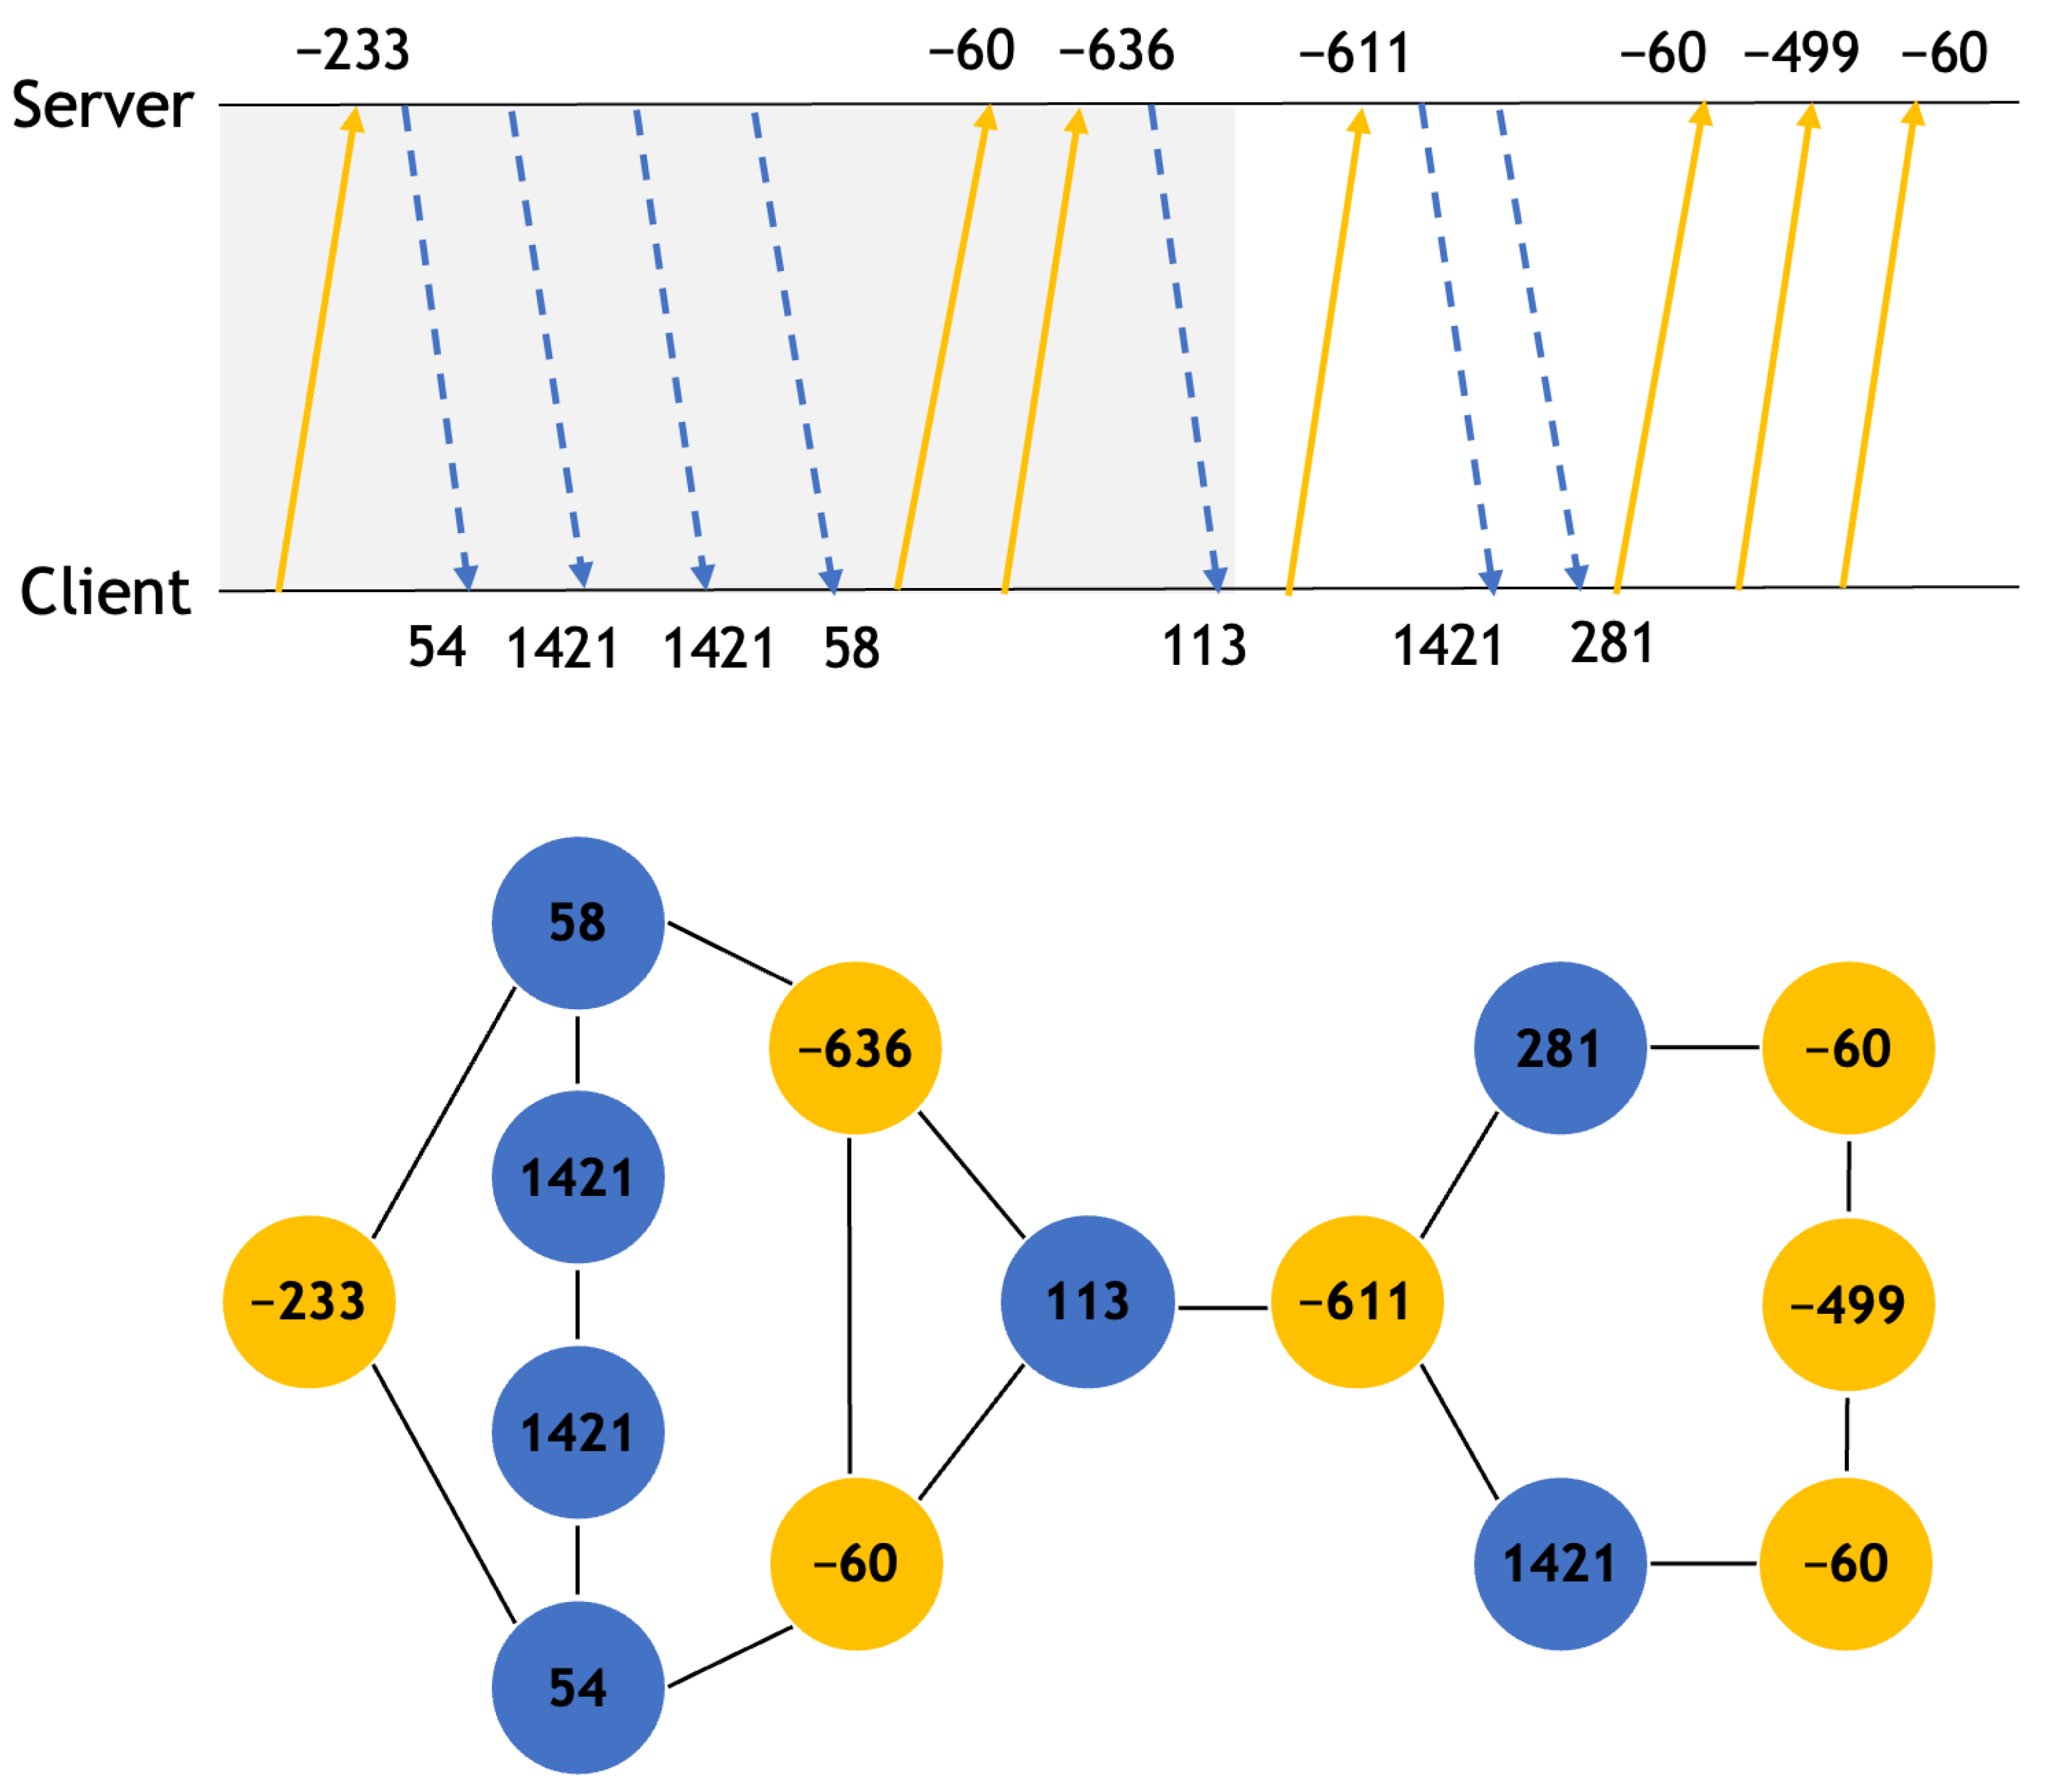
  • GraphDApp: To construct the traffic interaction graph, we implement the same algorithm described in Algorithm 1 of [11]. For the representation learning, we also implement the graph neural network (GNN) architecture described in Sections IV.B and IV.C of [11]. In the architecture, the representation learning part consists of n layers of perceptrons, where each layer follows a recursive neighborhood aggregation scheme as a variant of the work of Xu et al. [50]; all layers are concatenated by the jumping knowledge network proposed by Xu et al. [51].
  • FS-Net: In the embedding layer of FS-Net, the raw input is converted into a embedding vector sequence, which is widely used in natural language processing [52]. Since the representation learning part in FS-Net is highly related to the classification algorithm, we cover this part in Section 3.3.
We should note that in our experiment for GraphDApp and FS-Net, we restrict the maximum number of packets in the raw input as 25 since GraphDApp uses the parameter to achieve moderate time overhead.

3.3. Classification Algorithms

In our framework, the following classification algorithms are applied.
  • Maximum likelihood classifier for Markov chain fingerprinting [6]: When a raw input [ L 1 , L 2 , . . . , L T ] is given, we can compute the conditional probability that the raw input is occurred, given that the input is generated by a specific malware family G as
    P ( [ L 1 , L 2 , . . . , L T ] ) = q L 1 × w L T × t = 2 T p L t 1 , L t ,
    where p i , j is the state transition probability (from state i to state j) of the Markov chain fingerprint model for G. The maximum likelihood classifier outputs the most plausible family G (i.e., the family which maximizes the likelihood function) when the likelihood function for a family G is defined as Equation (1).
  • L1 logistic regression: We use a L1-multinomial logistic regression classifier implemented in scikit-learn v 1.0.1 as in [9]. Note that [20] gave the results for the L1 logistic regression classifier for the malware detection problem.
  • Linear SVM, decision tree, and random forest: We use a linear SVM-based classifier, a classification and regression tree (CART)-based decision tree classifier, and a random forest classifier implemented in scikit-learn v1.0.1 as in [8] both for Markov chain fingerprinting and the traffic interaction graph. Note that according to [9], there is no improvement in a statistically significant manner when we compare L1 logistic regression and linear SVM for the malware family classification problem.
  • Fully connected layer for GraphDApp [11]: Following GraphDApp [11], we use the softmax classifier with a fully-connected layer for malware family classification. To compute the loss, the cross entropy function is used.
  • FS-Net: The flow-sequence network (FS-Net) architecture consists of several layers: embedding layer, encoder layer, decoder layer, reconstruction layer (only for representation learning), dense layer, classification layer (for classification). The embedding vector sequence is generated in the embedding layer as described in Section 3.2. Then, the embedding vector sequence is given to the encoder layer and the decoder layer (both are stacked multi-layer bi-GRUs [53]) to generate compressed expressive features (i.e., encoder and decoder sequences). In addition, the Softmax classifier is used in both the reconstruction layer and the classification layer. For the dense layer, a two-layer perceptron with the Selu activation function [54] is used. We use the default parameters described in [10]. To compute the loss, the cross entropy function is used.
In particular, machine learning classifiers, such as SVM, decision tree, and random forest, are often used in state-of-the-art proposals to address the malware traffic classification problem [8,28,55]. So, we adopt these classifiers to confirm their performance when we combine them with different representations (i.e., Markov chain fingerprinting and GraphDApp with the traffic interaction graph-based feature representation), not only the maximum likelihood classifier and the fully-connected layer classifier, which are used in [6,11], as the default, respectively. Considering our evaluation results, we expect that adopting other classifiers (e.g., linear regression, MLP, and LightGBM) may not improve their performance dramatically, but it would be considered in future work.
In our experiment, the parameters used in the classifiers are hand-tuned. At first, we train the classification model with the default parameters in Python-based libraries (scikit-learn, PyTorch, and TensorFlow) and obtain the classification results with the validation set in terms of accuracy, F1 score, recall, and precision. Then, we increase or decrease each parameter to achieve better results repeatedly. Finally, we select the final parameters which show the best performance with the validation set and use them for experimental evaluation.

4. Experimental Evaluation

In this section, we first describe our dataset for malware family samples. Then, we discuss our evaluation results.

4.1. Traffic Dataset

As described in Section 2.3, we collected 14,980 TLS-encrypted malware flow samples from the https://www.malware-traffic-analysis.net (accessed on 15 November 2021) repository for the time period between July 2019 and May 2014. As summarized in Table 1, the resulting malware family labels include Angler-EK, Dridex, Gootkit, Hancitor, IcedID, Rig-EK, Trickbot, and Zeus.
Since the repository gives raw pcap files only, we develop a TLS flow feature extraction tool. In the tool, only TLS bidirectional flows in each pcap file are filtered using the tshark’s dissection heuristic, and each flow is identified by the four-tuple (i.e., source IP address, destination IP address, source port, and destination port). The resulting dataset is split into three parts (64% for training, 16% for validation, and 20% for testing).

4.2. Evaluation Results

In this subsection, we discuss the evaluation results.

4.2.1. Accuracy and F1 Score of the State-of-the-Art Methods

Table 2 shows our evaluation results for the 10 trained classifiers with the test dataset. In the table, we present four performance metrics: accuracy, F1 score, recall, and precision.
For the classification accuracy ranking, most of the results can be expected from existing research efforts [8,9,11], although the efforts mainly focus on application classification and malware detection. However, their detailed values are interesting. For example, Ref. [11] reports that Markov chain fingerprinting with maximum likelihood classifier [6] has very poor accuracy for decentralized application identification, but in our experiment, the accuracy of the Markov chain fingerprinting with various classifiers is within the range between 69% and 78%.
For traffic interaction graph, the fully connected layer classifier (i.e., the default classifier of GraphDApp) has the highest accuracy, which can also be expected, but other TIG-based classifiers show decreased but comparable performance in accuracy. It confirms the powerful capability of traffic interaction graph to represent the sequential information of TLS-encrypted traffic. FS-Net shows better accuracy than Markov chain-based classifiers, but most of TIG-based classifiers, except decision tree, outperform FS-Net.
For other performance metrics, there is no difference among representations, but one interesting result can be found within Markov chain-based classifiers. That is, the default classifier in [6] shows the highest precision and results in the highest F1 score. Considering the precision quantifies the number of correct predictions for each class and the data imbalance in our dataset, the maximum likelihood classifier can correctly classify malware families with small malware flow samples.

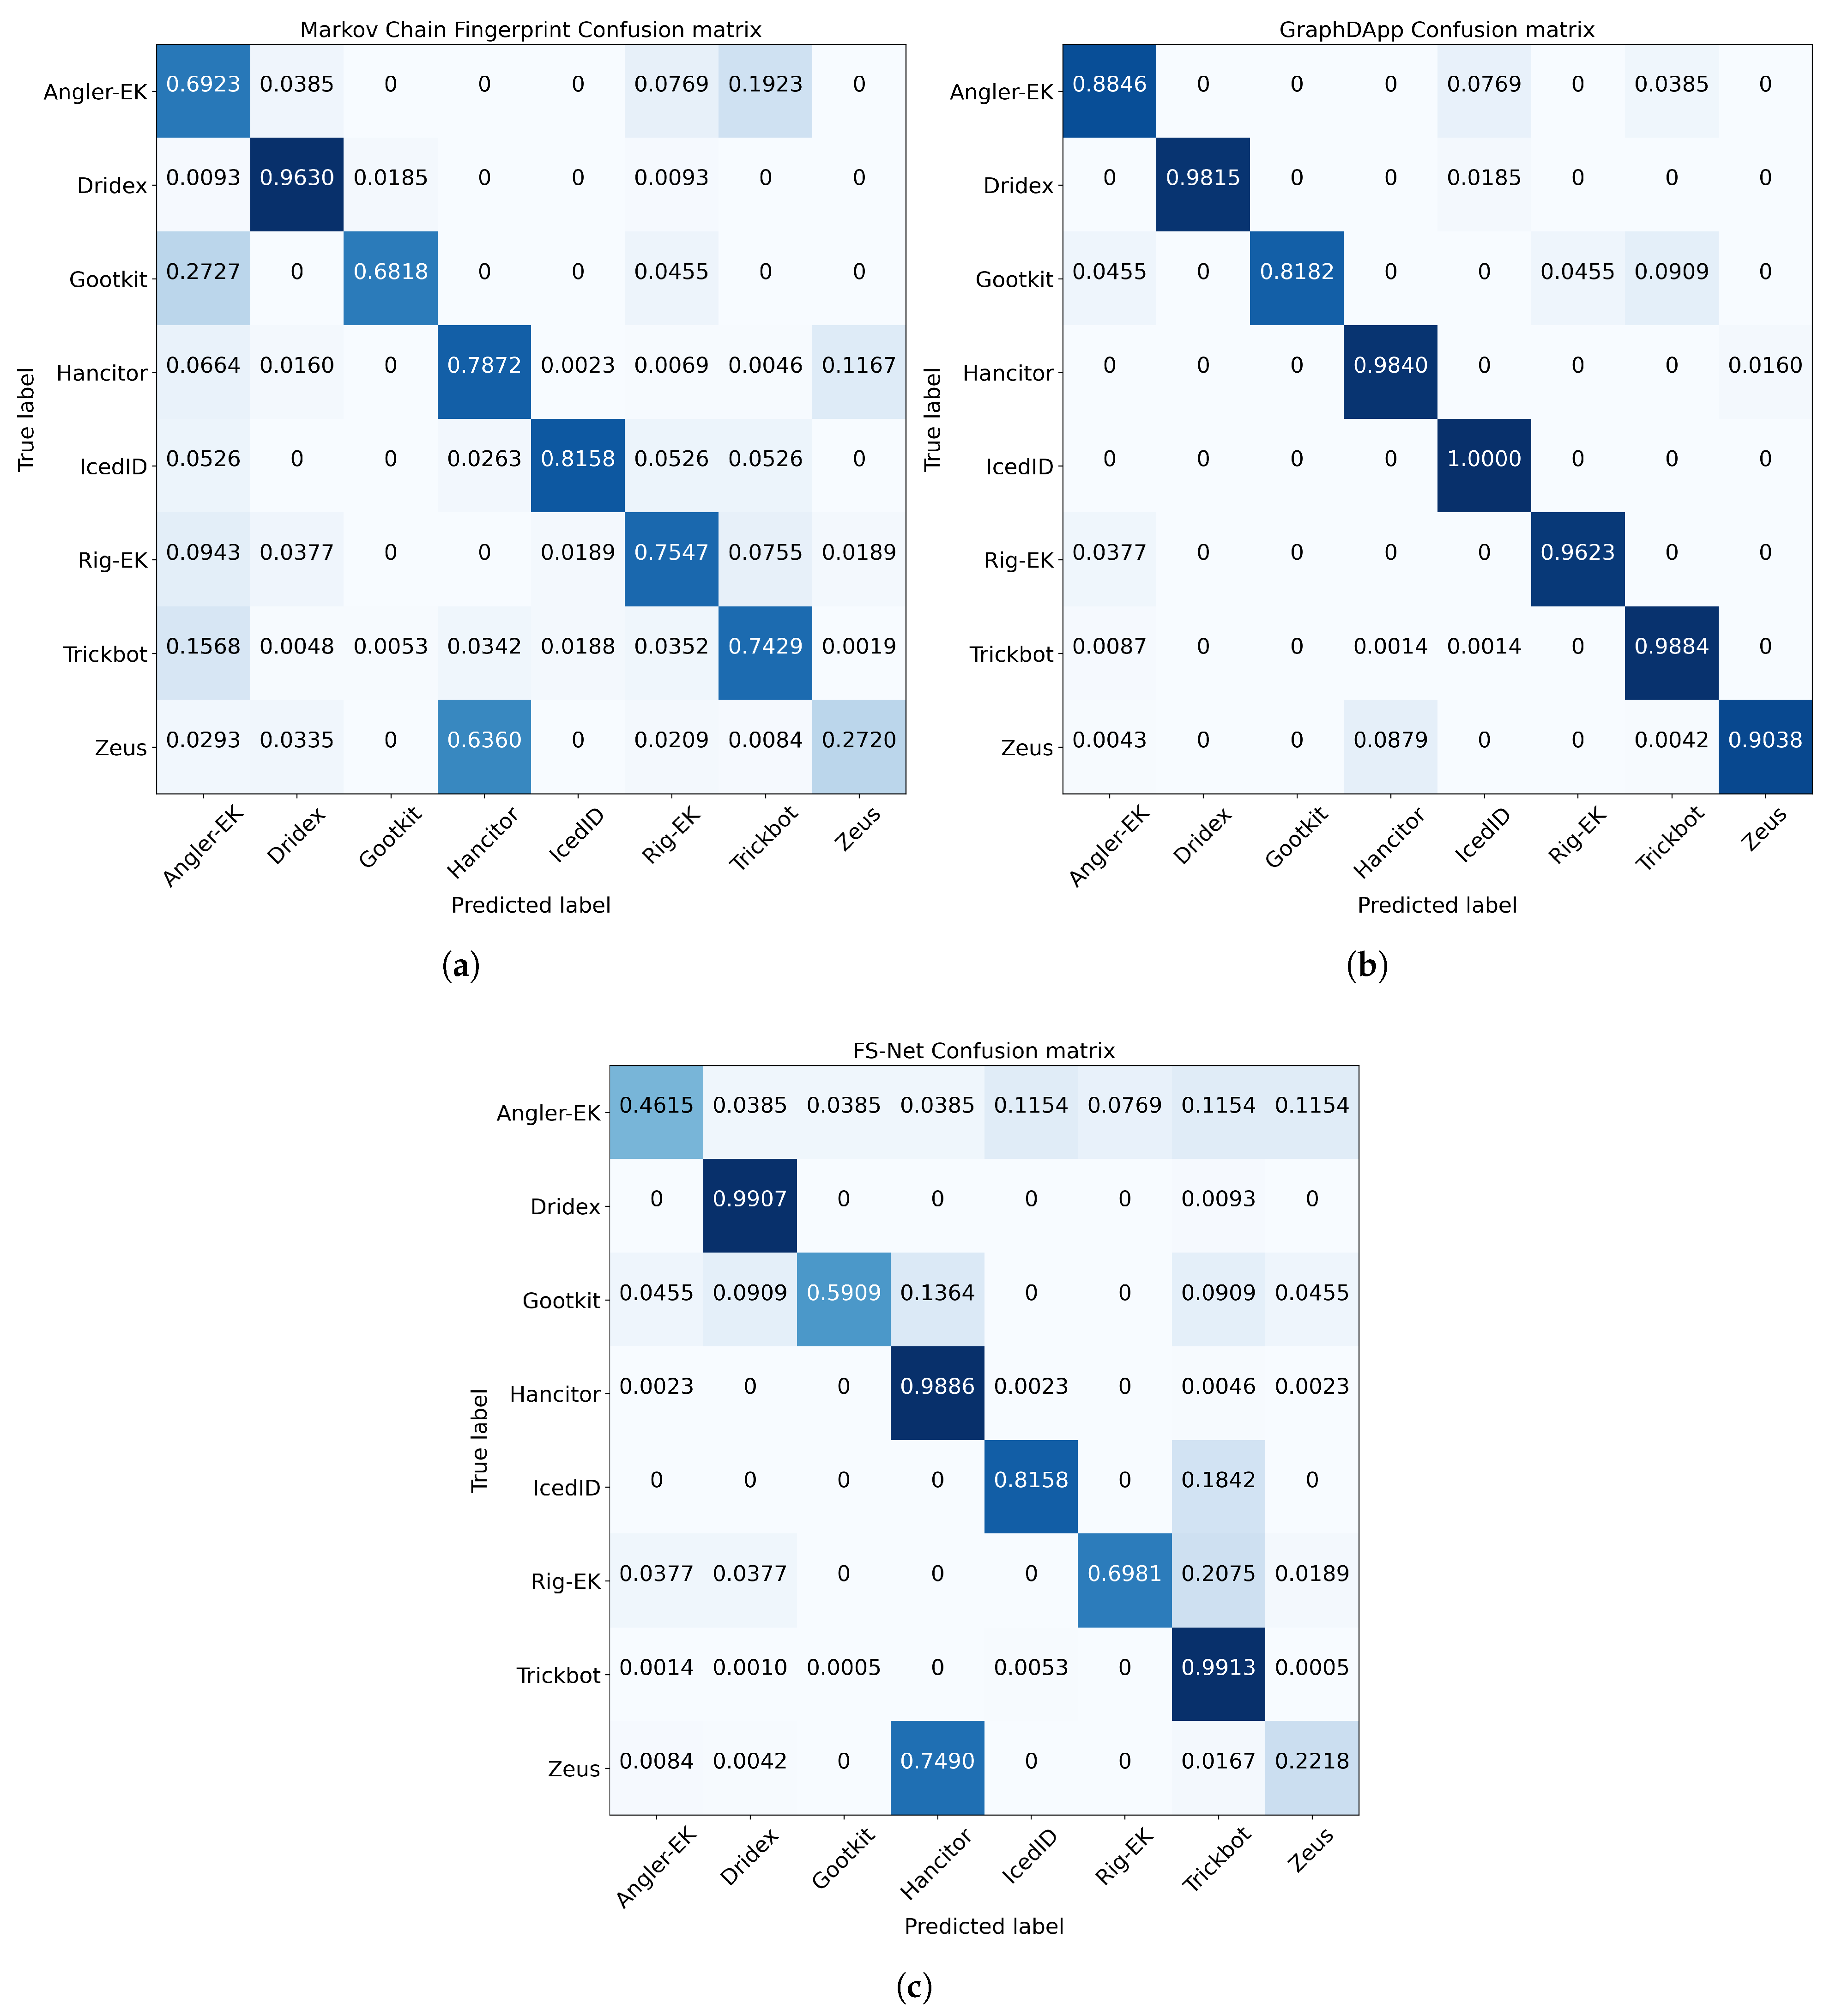
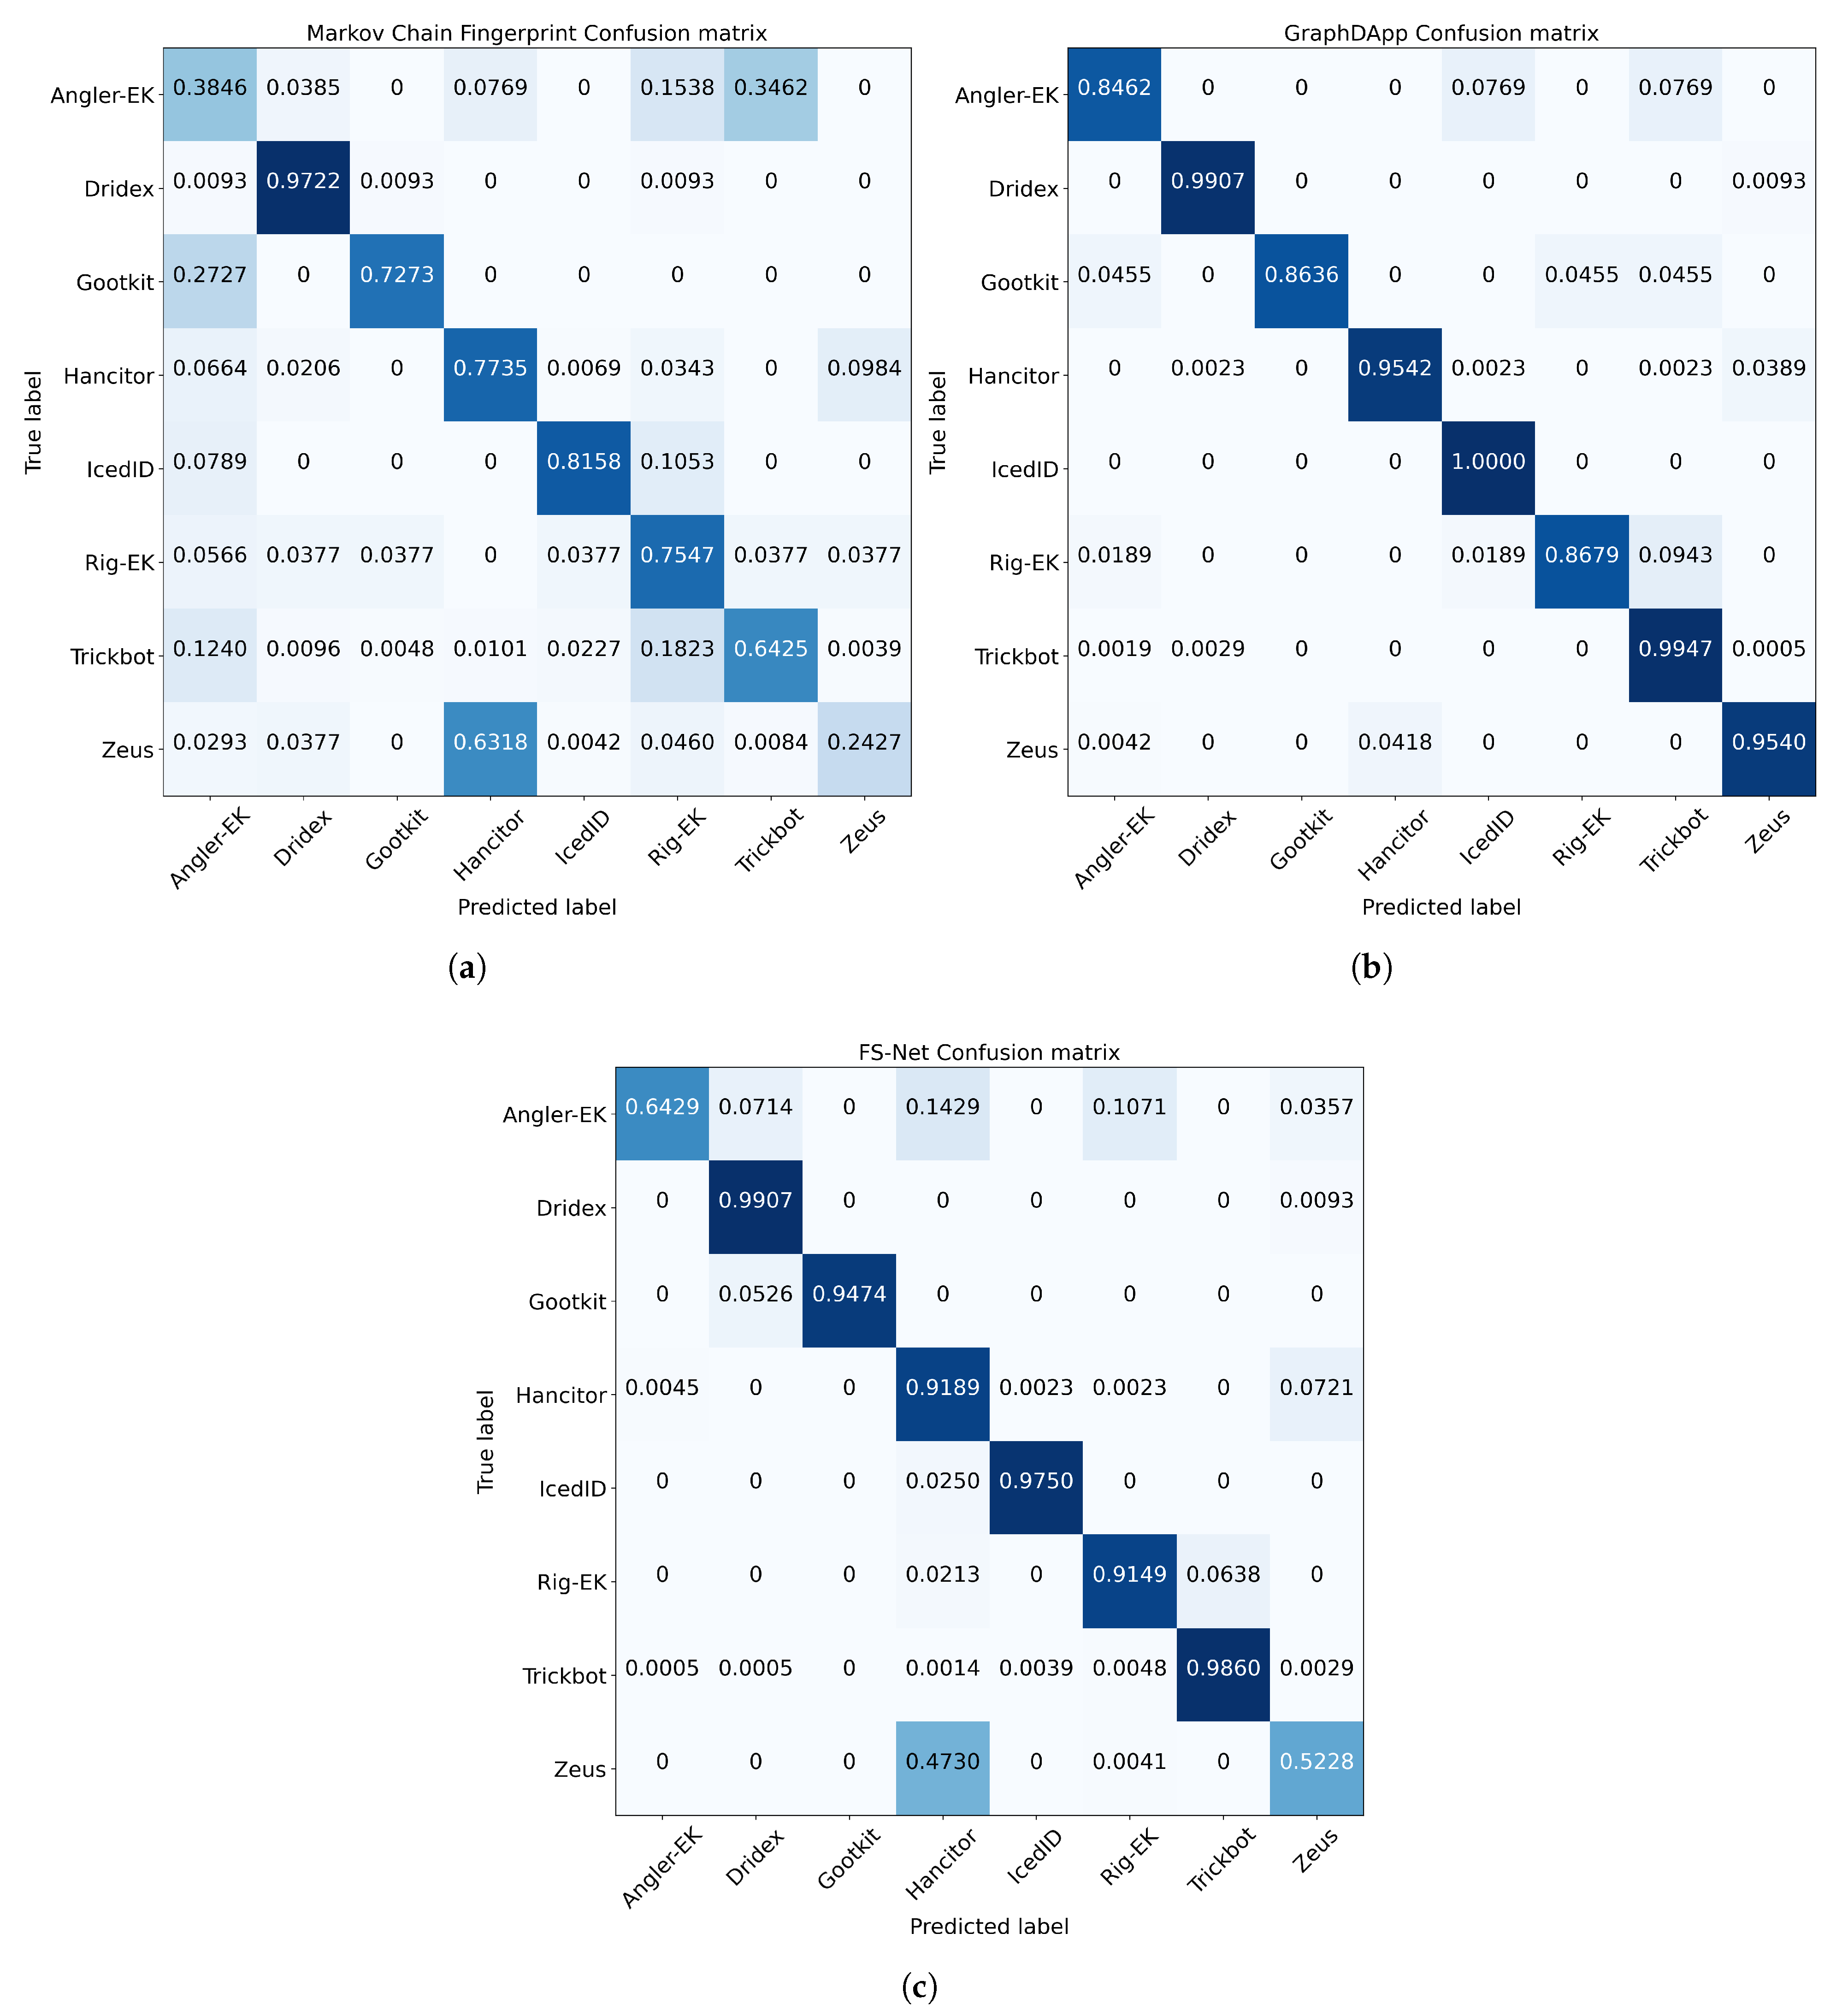
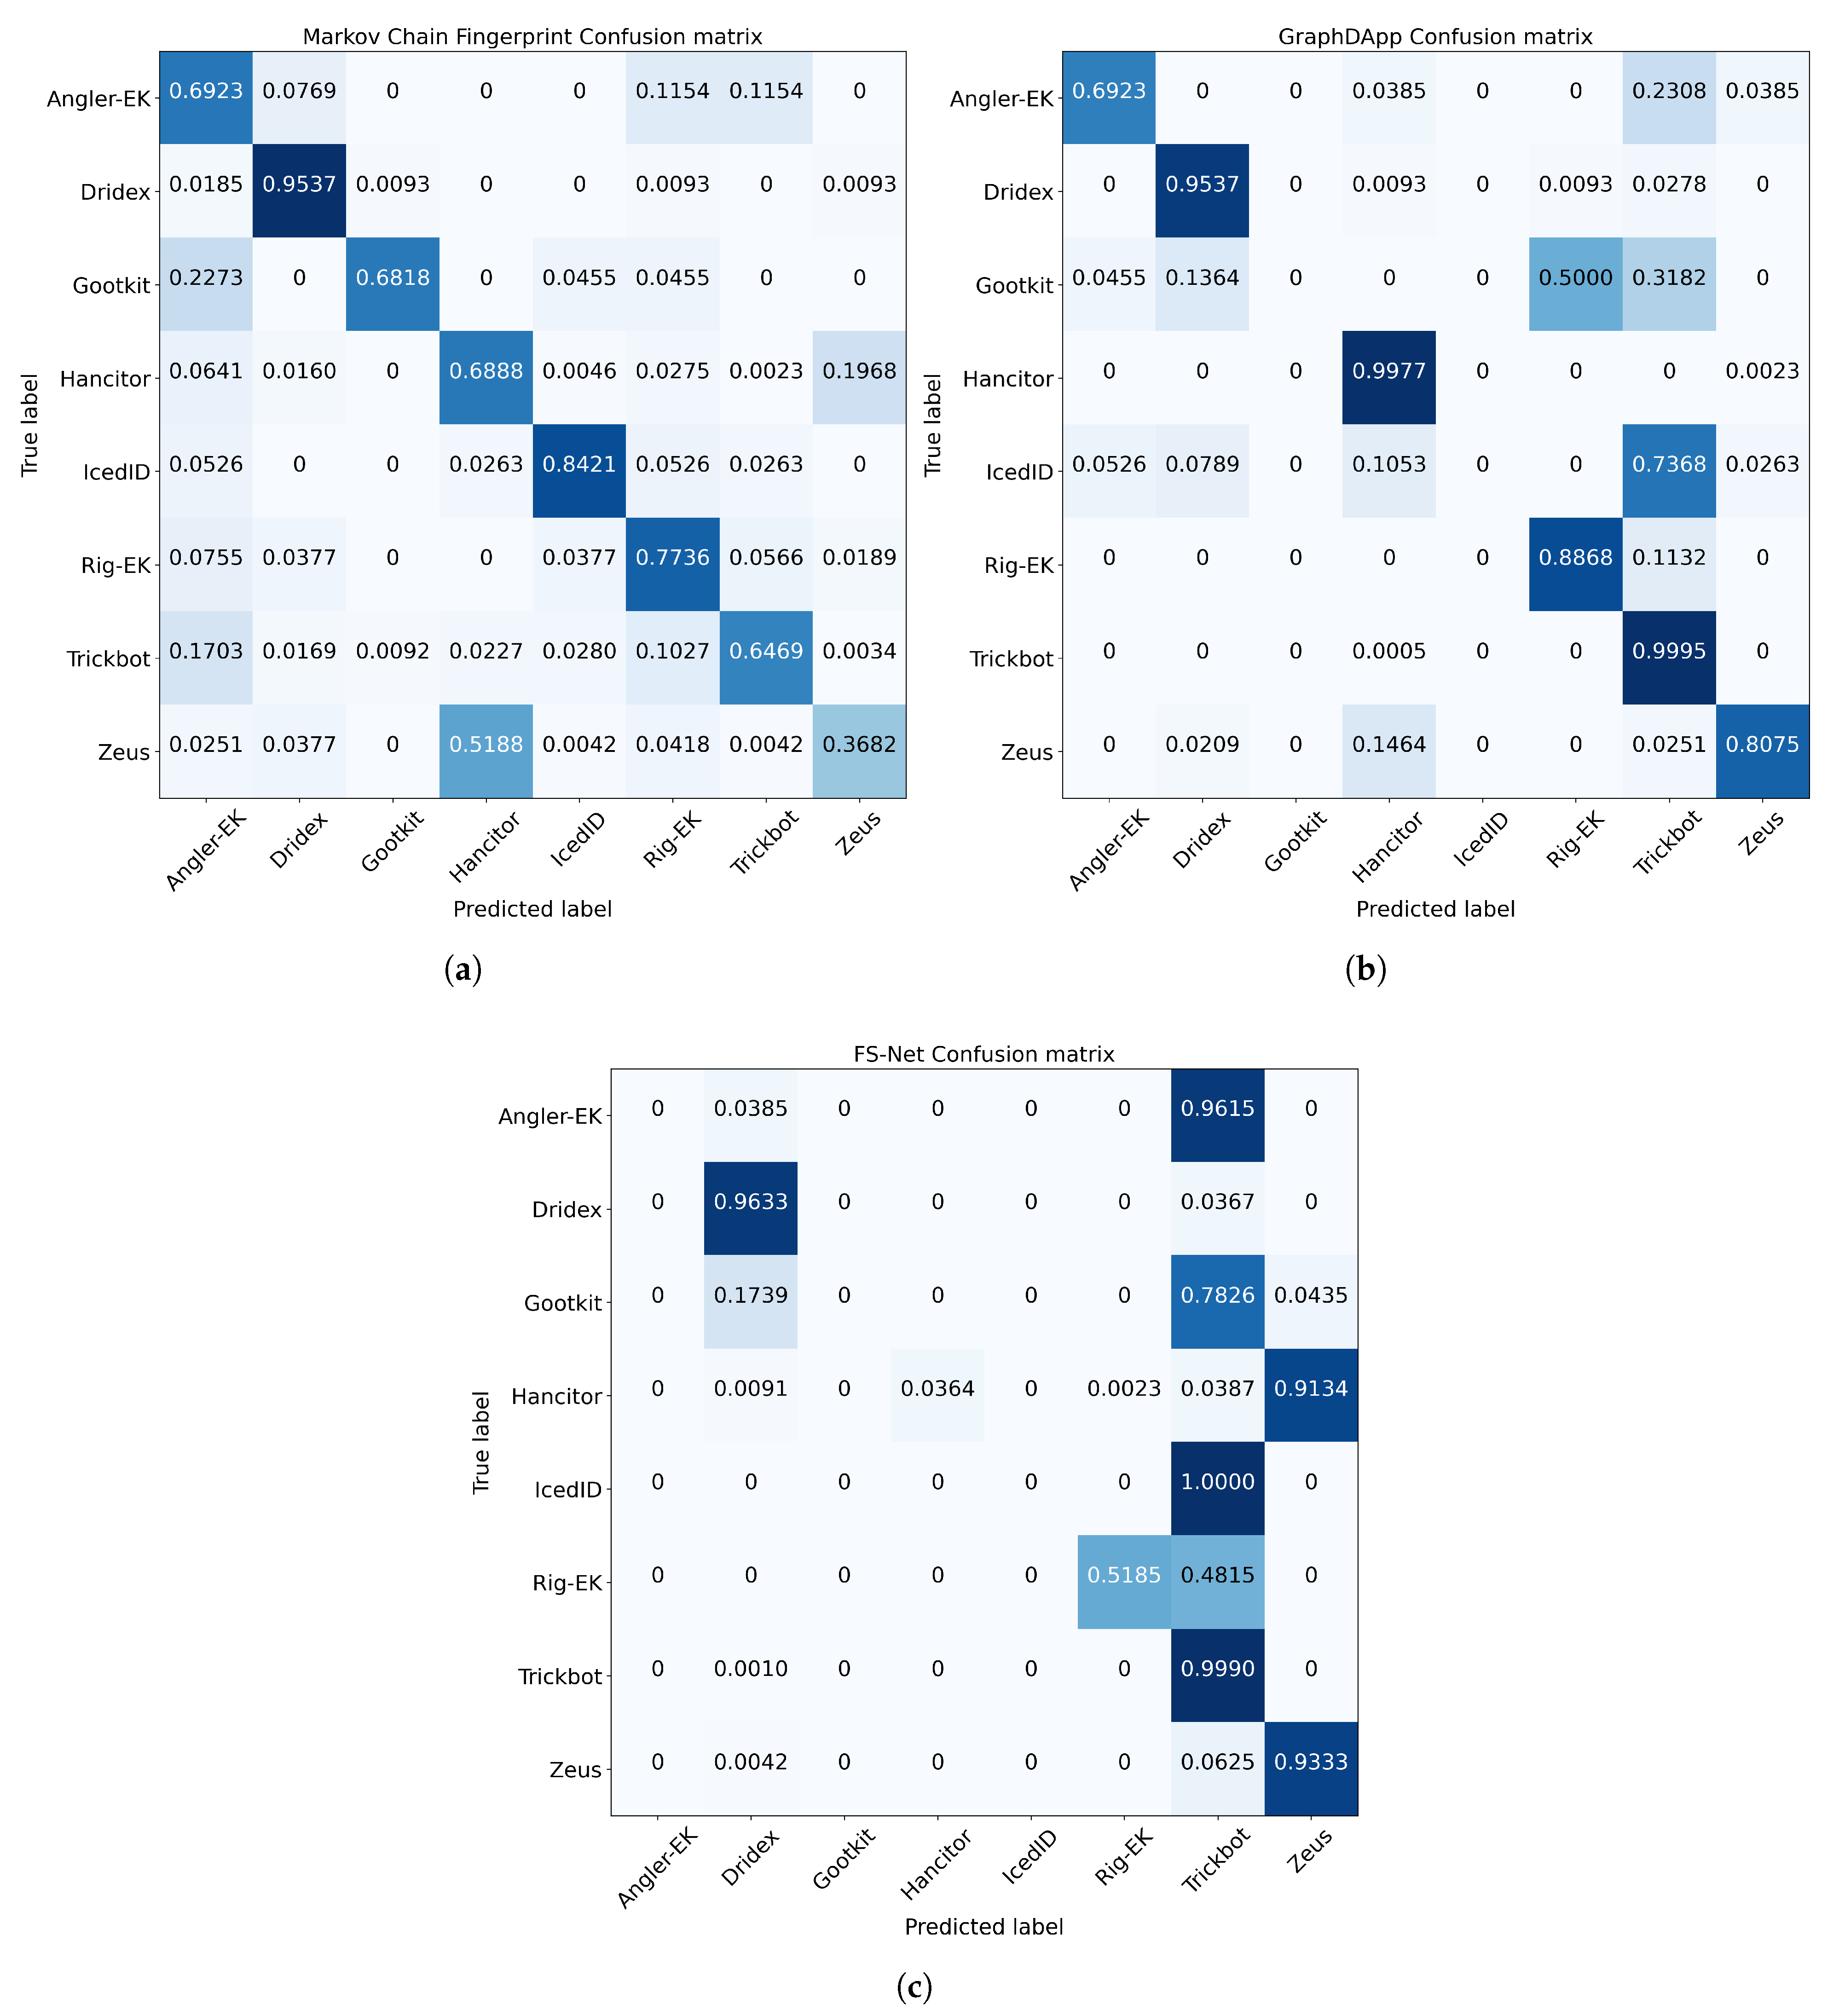
4.2.2. Confusion Matrices without Noisy Labels

Figure 4 depicts the confusion matrix for each representation with the most accurate classifier. As in Table 2, GraphDApp clearly shows the highest accuracy for each malware family, except TrickBot, compared with Markov chain fingerprinting and FS-Net.
There are two interesting points can be found in the figure. At first, FS-Net has a tendency to have higher accuracy for malware families with larger samples, which can be regarded as an evidence that FS-Net can be improved with more samples. Next, FS-Net tends to predict Zeus samples as Hancitor. Hancitor is often used to infect other malware such as Zeus and IcedID. Thus, such misprediction may result from the fact that some data points are mislabeled.
On the other hand, one may have a question that the used dataset is imbalanced, so the given experimental result may have flaws. To answer this potential issue, as shown in Figure 5, we also conduct an experiment with the balanced dataset using SMOTEENN [56] (a combination of over-sampling (SMOTE) and under-sampling (edited nearest neighbours) methods) to address the imbalanced dataset issue. In the experiment, the accuracy of the Markov chain fingerprinting, GraphDApp, and FS-Net are 64.4%, 98.09%, and 93.43%, respectively. Compared to the experimental results with the original dataset, the performance of the Markov chain fingerprinting classifier become worse, but the rest of two classifiers which are deep learning-based models, show a small improvement.

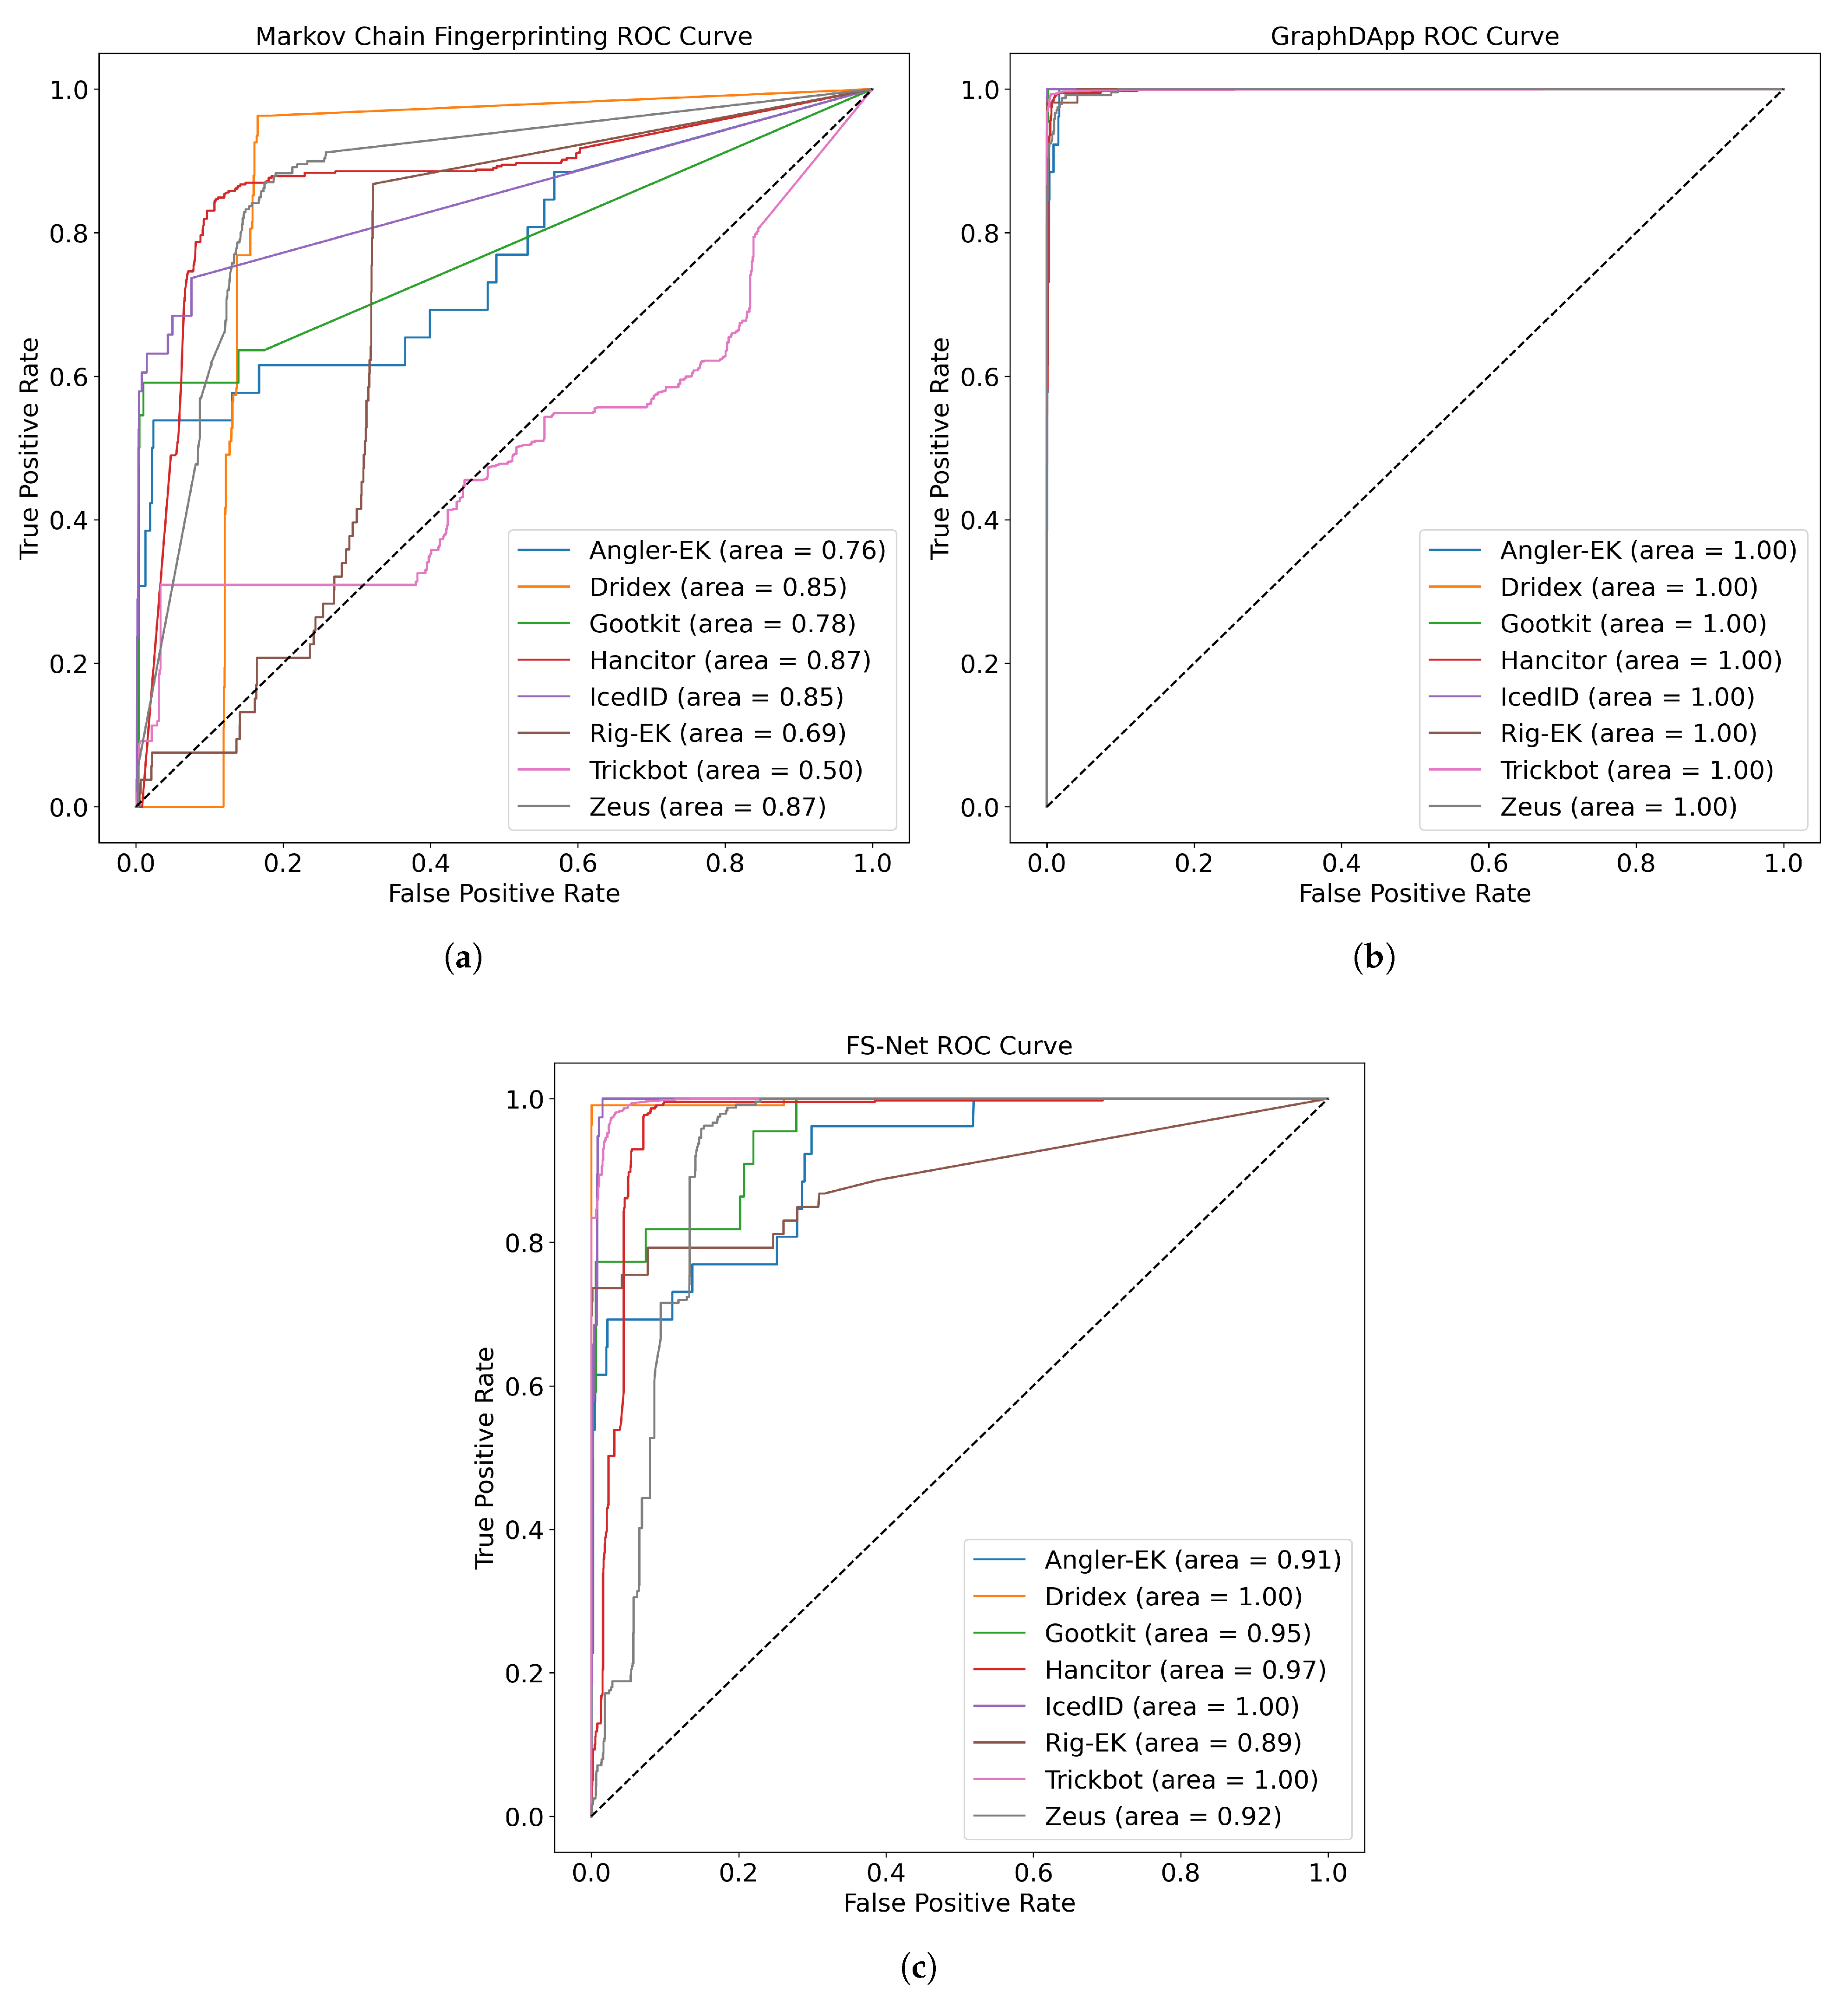
4.2.3. ROC Curves and AUC Values

We present ROC curves in Figure 6 by calculating true positive rates (TPR) and false positive rates (FPR) for the three classifiers. The total AUC values of each model are 0.7714, 0.9990, and 0.9540. In the Markov chain-based model, the increase in TPR with increase in FPR is relatively low, and the AUC value is the lowest. On the other hand, the TIG-based model shows outstanding performance in terms of TPR and FPR. Additionally, the model that used FS-Net shows good performance, quite similar to the TIG-based model, but there is a big difference in terms of the increase in TPR and the increase in FPR.

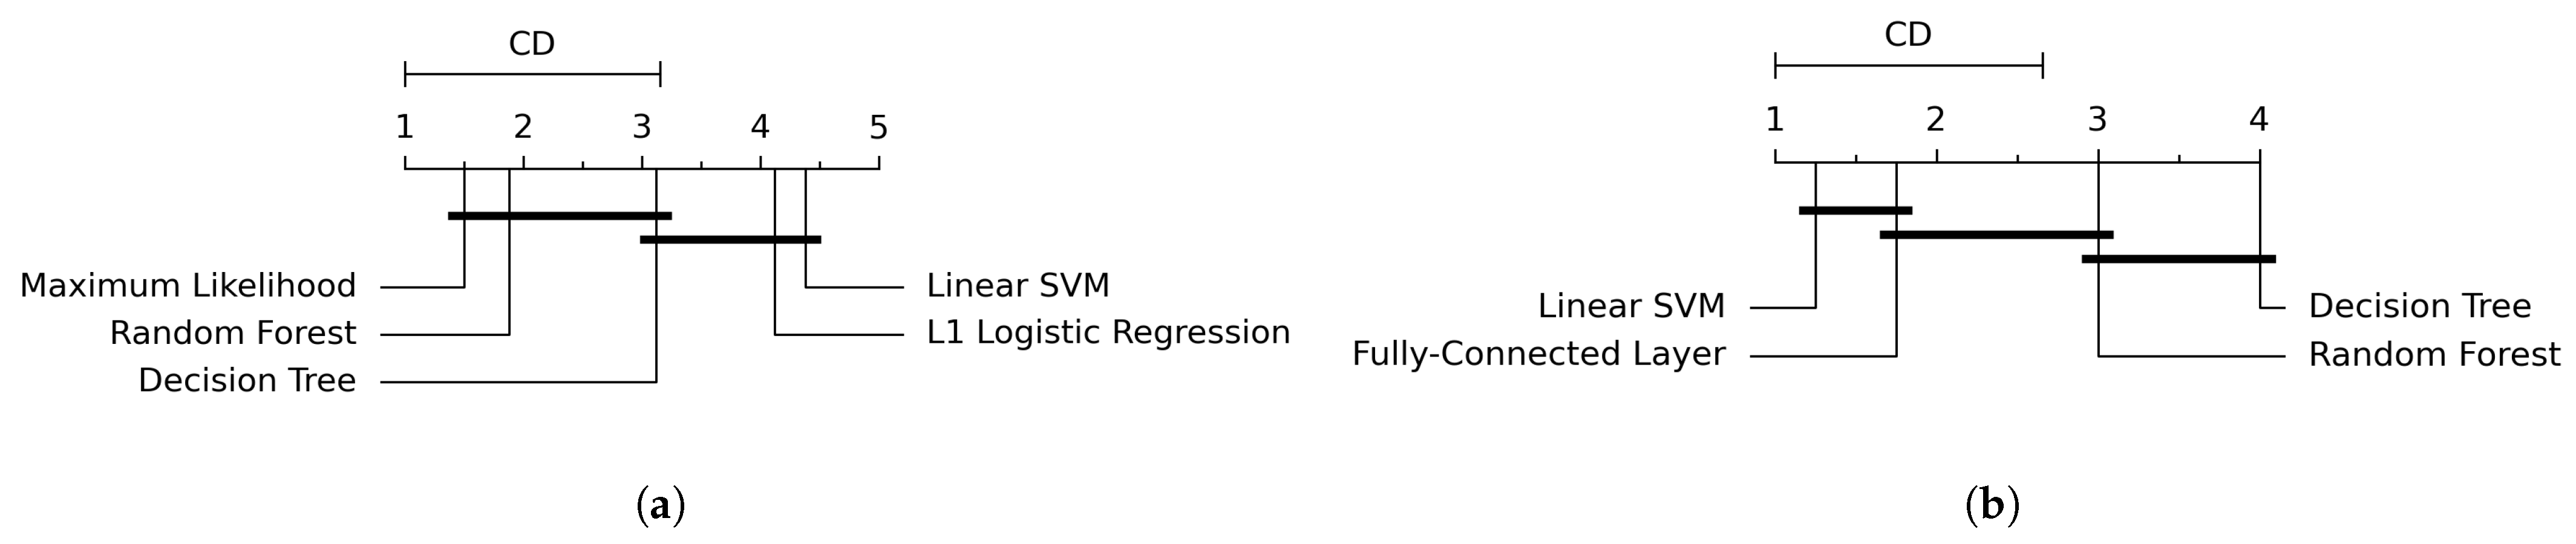
4.2.4. Non-Parametric Friedman Test and Post-Hoc Nemenyi Test

In the experiment, we conduct the non-parametric Friedman test and the post hoc Nemenyi test for comparison of the models which use the same feature representation, but using different classifiers.
In the non-parameteric Friedman test, the null hypothesis is that the mean of each classifier’s AUC values is the same, and the alternative hypothesis is that the least one of them is significantly different. For the Friedman test, we present the AUC values for each classifier in Table 3 and Table 4 with rankings. The result of the Frideman test for the Markov chain fingerprinting show the test statistic is 21.4 and the p-value is 0.0002, so we reject the null hypothesis since the p-value is less than 0.005. In addition, in GraphDApp-based models, the test statistic is 22.76923 and the p-value is 0.0000451, which rejects the null hypothesis. Therefore, we confirm that the least one of the classifiers is significantly different.
We also conduct the post hoc Nemenyi test at p-value 0.05, and we represent the result using the critical difference (Demšar) diagram in Figure 7. This shows that the maximum likelihood and random forest classifiers with Markov chain-based models are not significantly different, and the linear SVM and the L1 logistic regression classifier are not either. On the other hand, the difference of the GraphDApp-based models is quite clear, and just the performance of the linear SVM and fully-connected layer classifier are relatively similar.

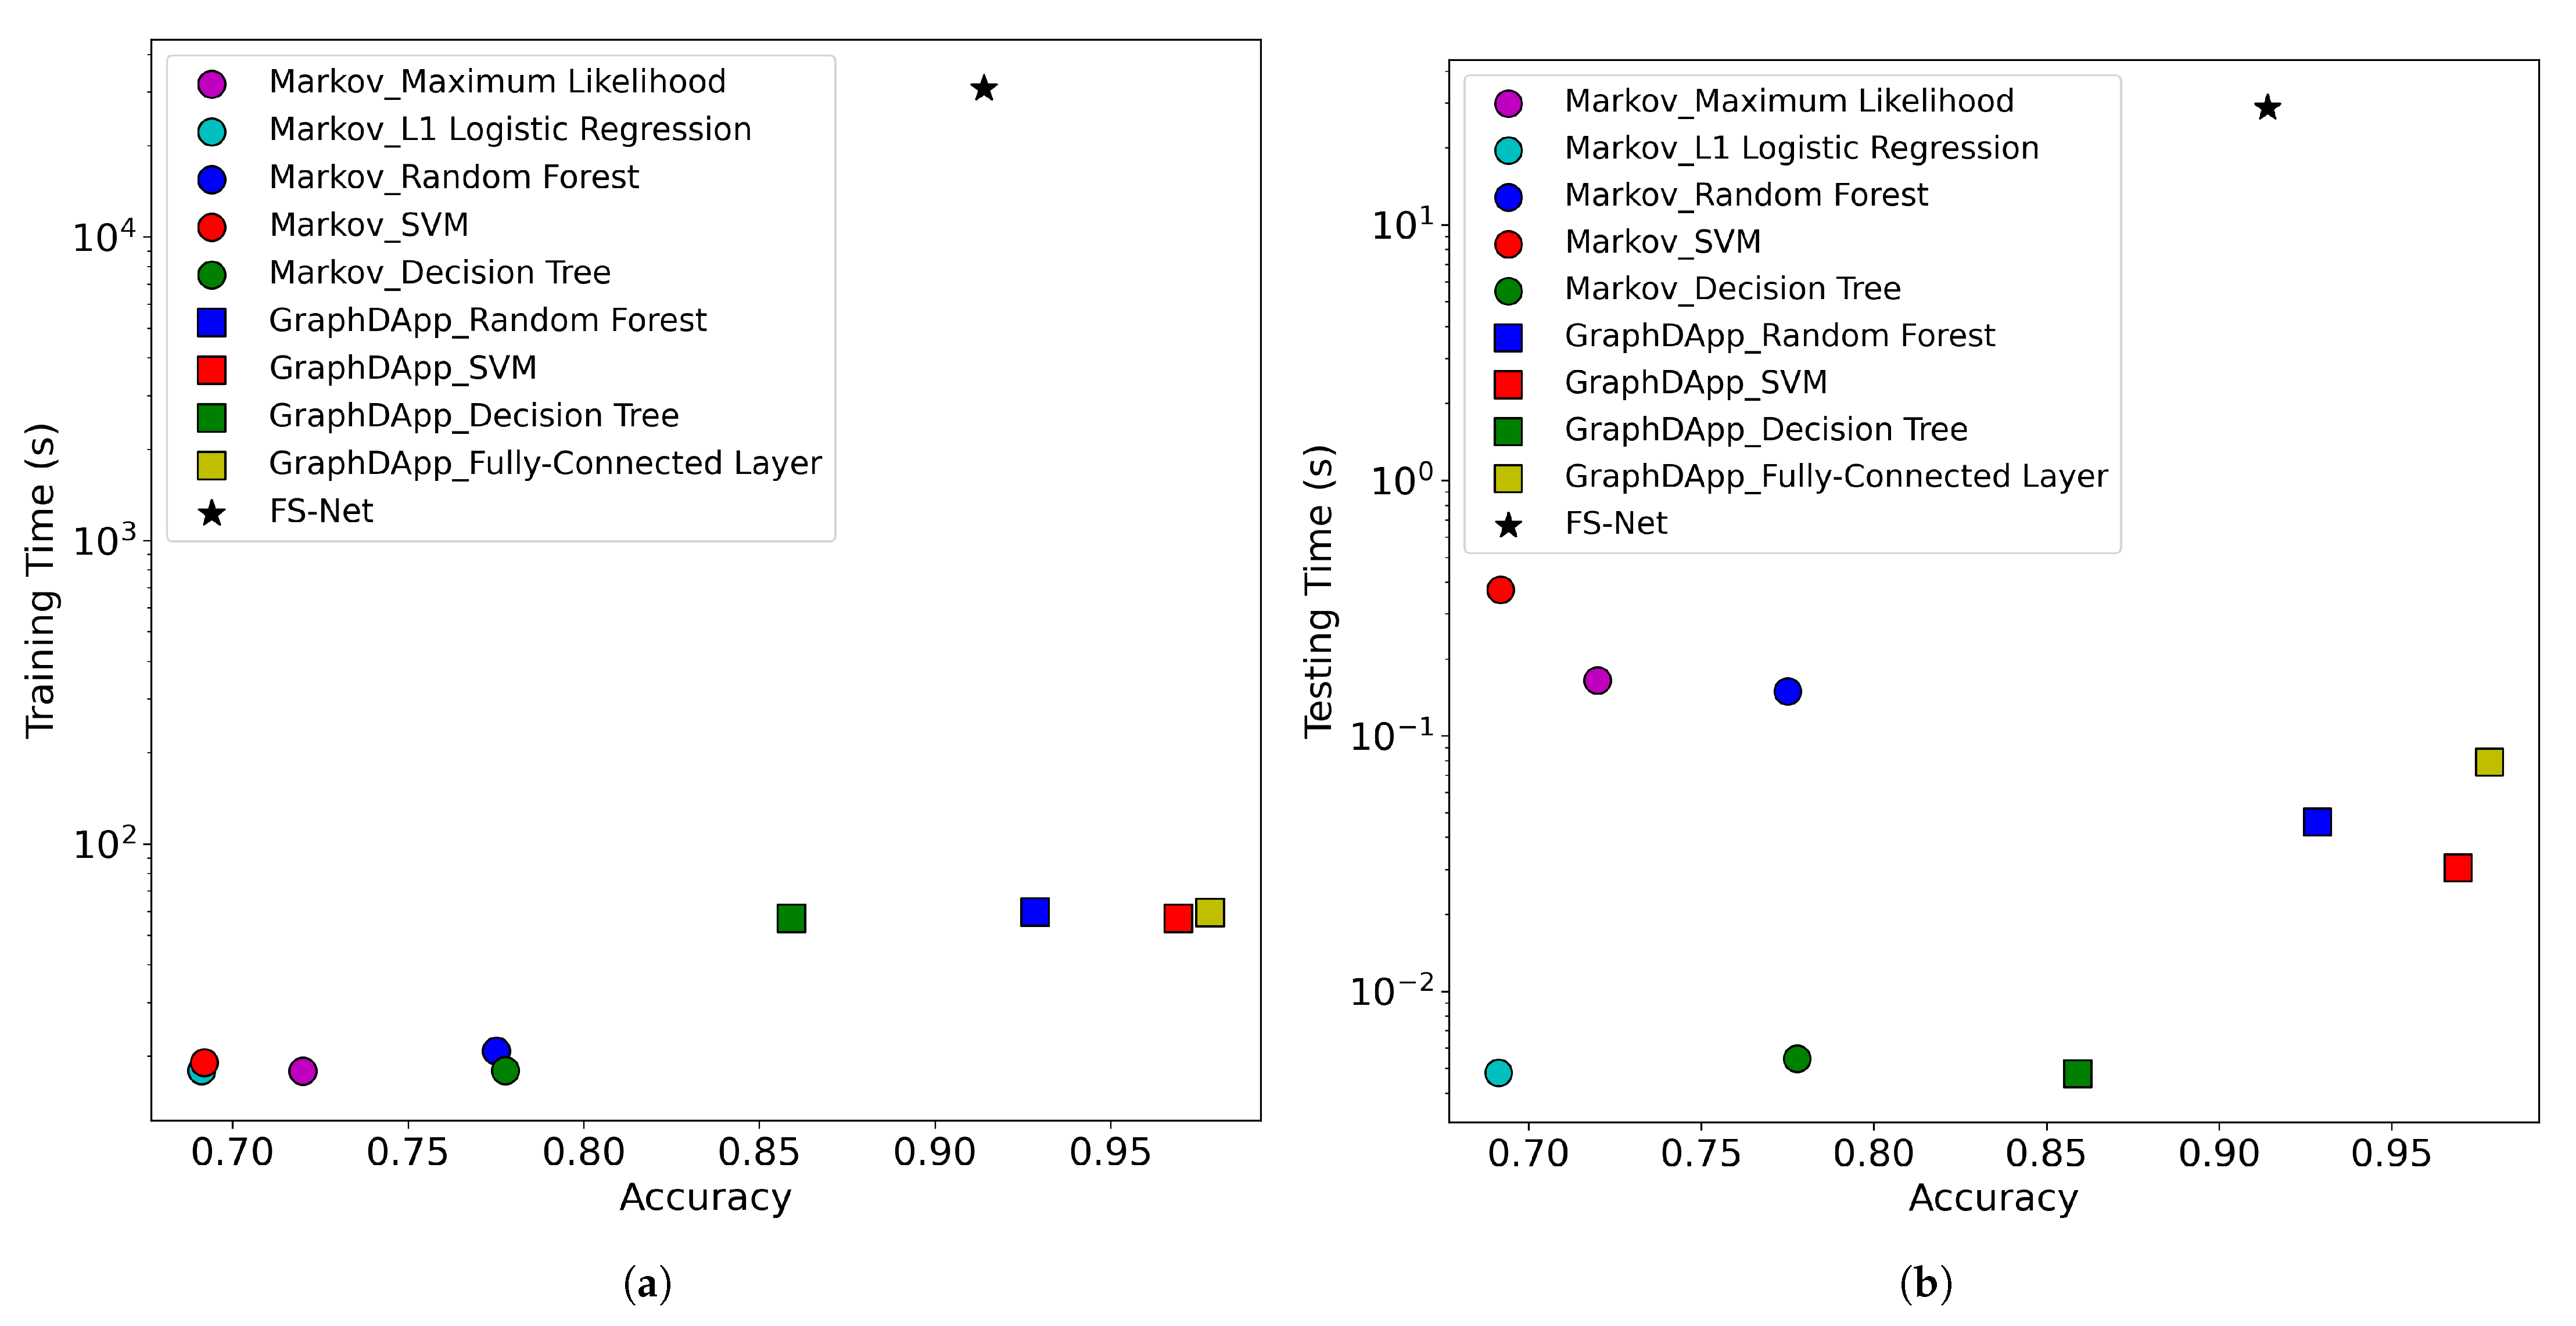
4.2.5. Training Time and Testing Time

The two plots in Figure 8 show (a) the training time and (b) the testing time of all malware family classifiers used in evaluation for all malware flow samples respectively. For each point in each plot, the x-coordinate represents its accuracy, and the y-coordinate represents the time for the corresponding dataset. In both training time and testing time, FS-Net takes the longest time since it heavily uses complex operations for neural networks.
Surprisingly, the difference between Markov chain fingerprinting and the traffic interaction graph in the training time is relatively small (i.e., only a few times larger), while the traffic interaction graph construction requires a lot of matrix multiplications. Partly, it may be due to an implementation problem: Markov chain fingerprinting is fully implemented in the Python + scikit-learn combination (which does not provide any GPU support) but GraphDApp is implemented in the Python + PyTorch combination, which utilizes graphic processing units (GPUs) for computation (where we use a nVIDIA RTX 3070 GPU). The training time of Markov chain fingerprinting can be improved by using other programming languages, such as C with code optimization.
In the testing time, the L1 logistic regression classifier and the decision tree classifiers take the lowest level time. It seems that the classifiers are simple enough to determine their output. For the random forest classifiers, their testing time seems to be correlated to a tunable parameter (i.e., the number of trees in the forest), each of which is hand-tuned to optimize the accuracy (800 for Markov chain-based random forest and 200 for TIG-based random forest). It implies that the raw input size (25) to construct the traffic interaction graph is optimized, as described in [11]. A similar tendency is observed in the SVM classifiers. Amongst the TIG-based classifiers, the Softmax classifier with a fully connected layer has the highest testing time. A similar result is reported in [8].
One interesting result in the testing time is the maximum likelihood classifier, which has the second highest testing time among the Markov chain-based classifiers. As in the training time, it would be due to the same implementation problem. However, computing the likelihood function value seems to be too simple (which requires a for loop for consecutive values in the state transition matrix). To this end, the result may come from the fact that we should compute the likelihood function value for each malware family (8 classes in our dataset) since such a loop does not appear in other classifiers. It concludes that with more malware families, the time complexity contribution may not be negligible.

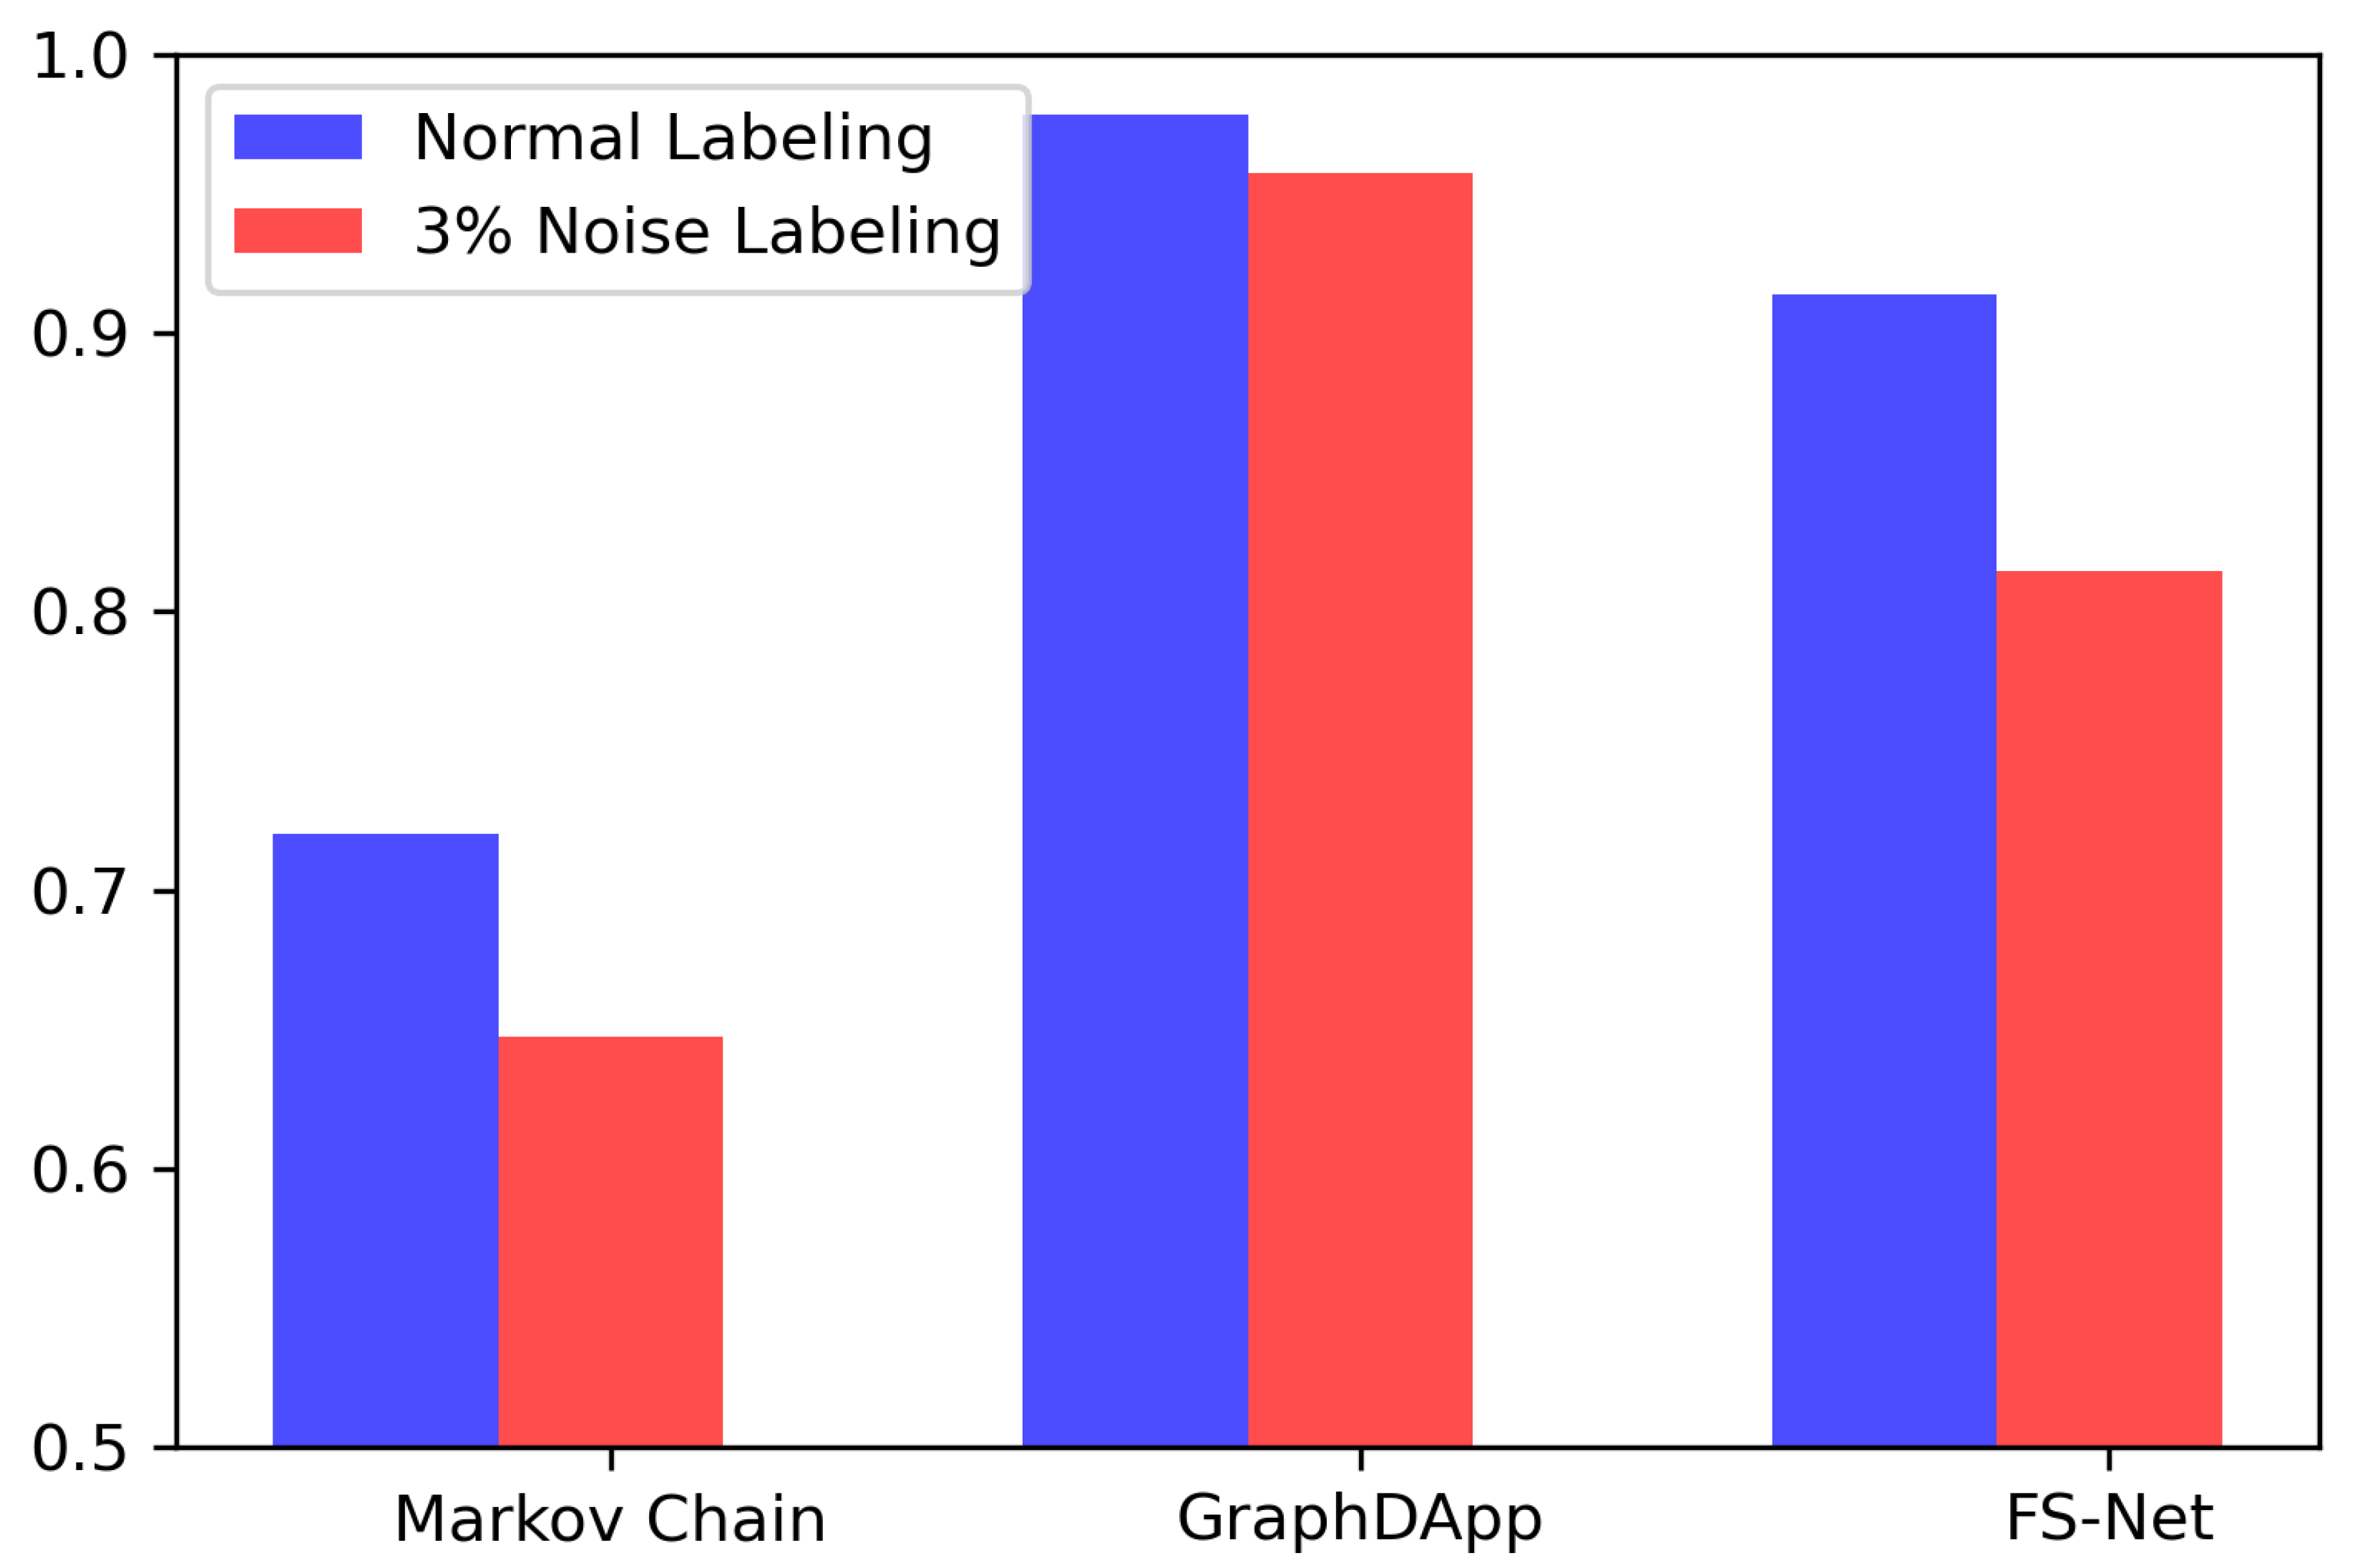
4.2.6. Performance Evaluation with Noisy Labels

In this subsection, we evaluate the classification methods to simulate inaccurate ground truth scenarios, which is an important challenge in real deployments. We randomly choose 3% of the malware traffic samples to be mislabeled. We use the 3% threshold from an observation in the work of Anderson and McGrew [8]: the accuracy of the several classifiers is changed near the 3% threshold. Figure 9 shows the classification accuracies of the three default classifiers in Markov chain fingerprinting, GraphDApp, and FS-Net, with or without noisy labels. The result shows that GraphDApp has the lowest degradation in accuracy.
However, when we observe their confusion matrices shown in Figure 10, we can find several interesting points. The confusion matrix of GraphDApp shows that the classifier completely mispredicts some malware families, such as Goodkit and IcedID (with 0% of precision). Furthermore, the confusion matrix of FS-Net shows a more severe result: most of the predictions output malware families with relatively larger samples (e.g., Dridex, TrickBot, and Zeus). Surprisingly, the confusion matrix of the Markov chain-based classifier seems to be normal (with some level of precision for each malware family), while there is a substantial amount of misprediction. Since Markov chain fingerprints store non-zero state transition probabilities when there is at least one sample, non-zero precision would be guaranteed with a lower level of noisy labels. However, there is no design consideration in other classifiers. These results show that the neural network-based methods need to be designed with the possibility of noisy labeling.

4.3. Discussion

Our experiment shows the advantages and limitations of the malware family classification methods for TLS-encrypted traffic. The classification methods using Markov chain fingerprinting show worse performance with 69.12–77.77% accuracy. However, the learning time is the fastest amongst the evaluated classifiers; in particular, the classifier which uses maximum likelihood shows robustness against noise. On the other hand, most of the TIG- and GraphDApp-based classifiers show better performance regardless of the evaluated classification methods. Finally, the classification model using FS-Net shows high performance that is nearly similar to the graph-based model, however the model trained the dataset with noise has a flaw.
There are several limitations in the proposed methodology. First, we only utilize the packet length sequence information in our experiments, although we could obtain other flow-level features, such as TLS metadata, HTTP contextual flow, etc. Evaluating diverse combinations of flow-level feature representations and classification algorithms could be a future work. In addition, in our experiment, we only focus on the malware family classification problem. For future work, we could expand our evaluation framework to the malware detection problem with legitimate network traffic datasets.

5. Conclusions

In this paper, we propose the evaluation framework of malware family classification methods for TLS-encrypted traffic. With this framework, we conducted the experimental evaluation of the state-of-the-art encrypted traffic classification methods, which utilize flow-level sequential information with novel representations. In the experiment, the TIG-based classifier had the best performance with 97.83% accuracy amongst the evaluated classifiers. However, with the 3% noise labeled training set, the classifier is prone to mispredict some malware families, while the maximum likelihood classifier for Markov chain fingerprinting, which has low accuracy, shows robustness. According to our experimental evaluation, the malware family classification problem for TLS-encrypted traffic has more room to design classifiers. One research direction is to improve the graph neural network architecture of GraphDApp with noisy labels.

Author Contributions

Conceptualization, J.H. and H.R.; methodology, J.H. and H.R.; investigation, J.H. and H.R.; writing—original draft preparation, H.R. and J.H.; writing—review and editing, H.R. and J.H.; funding acquisition, H.R. All authors have read and agreed to the published version of the manuscript.

Funding

This research was supported by the NRF grant (No. 2020R1F1A1076905), funded by the Korea government (MSIT).

Data Availability Statement

Data available in a publicly accessible repository that does not issue DOIs Publicly available datasets were analyzed in this study. This data can be found here: https://www.malware-traffic-analysis.net, accessed on 10 December 2021.

Acknowledgments

We would like to thank our anonymous reviewers for their service, and we also deeply thank Chaeyeon Oh for her feedback and guidance regarding the manuscript.

Conflicts of Interest

The authors declare no conflict of interest.

References

  1. Naylor, D.; Finamore, A.; Leontiadis, I.; Grunenberger, Y.; Mellia, M.; Munafò, M.; Papagiannaki, K.; Steenkiste, P. The Cost of the “S” in HTTPS. In Proceedings of the 10th Conference on Emerging Networking Experiments and Technologies (CoNEXT’2014), Sydney, Australia, 2–5 December 2014; pp. 133–139. [Google Scholar] [CrossRef] [Green Version]
  2. Google. HTTPS Encryption on the Web. 2021. Available online: https://transparencyreport.google.com/https/overview (accessed on 27 November 2021).
  3. Lee, H.; Kim, D.; Kwon, Y. TLS 1.3 in Practice: How TLS 1.3 Contributes to the Internet. In Proceedings of the Web Conference 2021, WWW ’21, Ljubljana, Slovenia, 19–23 April 2021; Association for Computing Machinery: New York, NY, USA, 2021; pp. 70–79. [Google Scholar] [CrossRef]
  4. WatchGuard Threat Lab. Internet Security Report: Q2 2021; Technical Report. Available online: https://www.watchguard.com/wgrd-resource-center/security-report-q2-2021 (accessed on 27 November 2021).
  5. de Carnavalet, X.d.C.; van Oorschot, P.C. A survey and analysis of TLS interception mechanisms and motivations. arXiv 2020, arXiv:2010.16388. [Google Scholar]
  6. Korczyński, M.; Duda, A. Markov Chain Fingerprinting to Classify Encrypted Traffic. In Proceedings of the 33rd IEEE International Conference on Computer Communications (INFOCOM’2014), Toronto, ON, Canada, 27 April–2 May 2014. [Google Scholar] [CrossRef]
  7. Anderson, B.; McGrew, D. Identifying Encrypted Malware Traffic with Contextual Flow Data. In Proceedings of the 2016 ACM workshop on artificial intelligence and security, Vienna, Austria, 24–28 October 2016; Association for Computing Machinery: New York, NY, USA, 2016; pp. 35–46. [Google Scholar] [CrossRef]
  8. Anderson, B.; McGrew, D. Machine Learning for Encrypted Malware Traffic Classification: Accounting for Noisy Labels and Non-stationarity. In Proceedings of the 23rd ACM SIGKDD International Conference on Knowledge Discovery and Data Mining (KDD’2017), Halifax, NS, Canada, 13–17 August 2017; Volume Part F1296. [Google Scholar] [CrossRef]
  9. Anderson, B.; Paul, S.; McGrew, D. Deciphering malware’s use of TLS (without decryption). J. Comput. Virol. Hacking Tech. 2018, 14, 195–211. [Google Scholar] [CrossRef] [Green Version]
  10. Liu, C.; He, L.; Xiong, G.; Cao, Z.; Li, Z. FS-Net: A Flow Sequence Network for Encrypted Traffic Classification. In Proceedings of the 38th IEEE International Conference on Computer Communications (INFOCOM’2019), Paris, France, 29 April–2 May 2019. [Google Scholar] [CrossRef]
  11. Shen, M.; Zhang, J.; Zhu, L.; Xu, K.; Du, X. Accurate Decentralized Application Identification via Encrypted Traffic Analysis Using Graph Neural Networks. IEEE Trans. Inf. Forensics Secur. 2021, 16, 2367–2380. [Google Scholar] [CrossRef]
  12. Bengio, Y.; Courville, A.; Vincent, P. Representation Learning: A Review and New Perspectives. IEEE Trans. Pattern Anal. Mach. Intell. 2013, 35, 1798–1828. [Google Scholar] [CrossRef] [PubMed]
  13. Karagiannis, T.; Papagiannaki, K.; Faloutsos, M. BLINC: Multilevel Traffic Classification in the Dark. In Proceedings of the 2005 Conference on Applications, Technologies, Architectures, and Protocols for Computer Communications, SIGCOMM ’05, Philadelphia, PA, USA, 22–26 August 2005; Association for Computing Machinery: New York, NY, USA, 2005; pp. 229–240. [Google Scholar] [CrossRef]
  14. Dainotti, A.; Pescapé, A.; Claffy, K.C. Issues and future directions in traffic classification. IEEE Netw. 2012, 26, 35–40. [Google Scholar] [CrossRef] [Green Version]
  15. Velan, P.; Čermák, M.; Čeleda, P.; Drašar, M. A survey of methods for encrypted traffic classification and analysis. Int. J. Netw. Manag. 2015, 25, 355–374. [Google Scholar] [CrossRef]
  16. Moore, A.W.; Papagiannaki, K. Toward the Accurate Identification of Network Applications. In Proceedings of the International Conference on Passive and Active Network Measurement, Boston, MA, USA, 31 March–1 April 2005; Dovrolis, C., Ed.; Springer: Berlin/Heidelberg, Germany, 2005; pp. 41–54. [Google Scholar]
  17. Bernaille, L.; Teixeira, R. Early recognition of encrypted applications. In Proceedings of the International Conference on Passive and Active Network Measurement, Louvain-la-neuve, Belgium, 5–6 April 2007; pp. 165–175. [Google Scholar] [CrossRef] [Green Version]
  18. Sun, G.L.; Xue, Y.; Dong, Y.; Wang, D.; Li, C. An Novel Hybrid Method for Effectively Classifying Encrypted Traffic. In Proceedings of the Conference and Exhibition on Global Telecommunications (GLOBECOM’2010), Miami, FL, USA, 6–10 December 2010. [Google Scholar]
  19. Shen, M.; Wei, M.; Zhu, L.; Wang, M. Classification of Encrypted Traffic with Second-Order Markov Chains and Application Attribute Bigrams. IEEE Trans. Inf. Forensics Secur. 2017, 12, 1830–1843. [Google Scholar] [CrossRef]
  20. McGrew, D.; Anderson, B. Enhanced telemetry for encrypted threat analytics. In Proceedings of the International Conference on Network Protocols, ICNP 2016, Singapore, 8–11 November 2016; pp. 1–6. [Google Scholar] [CrossRef]
  21. Conti, M.; Mancini, L.V.; Spolaor, R.; Verde, N.V. Analyzing Android Encrypted Network Traffic to Identify User Actions. IEEE Trans. Inf. Forensics Secur. 2016, 11, 114–125. [Google Scholar] [CrossRef]
  22. Taylor, V.F.; Spolaor, R.; Conti, M.; Martinovic, I. AppScanner: Automatic Fingerprinting of Smartphone Apps from Encrypted Network Traffic. In Proceedings of the 2016 IEEE European Symposium on Security and Privacy (EuroS&P), Saarbruecken, Germany, 21–24 March 2016; pp. 439–454. [Google Scholar] [CrossRef]
  23. Taylor, V.F.; Spolaor, R.; Conti, M.; Martinovic, I. Robust Smartphone App Identification via Encrypted Network Traffic Analysis. IEEE Trans. Inf. Forensics Secur. 2018, 13, 63–78. [Google Scholar] [CrossRef] [Green Version]
  24. Lee, I.; Roh, H.; Lee, W. Poster Abstract: Encrypted Malware Traffic Detection Using Incremental Learning. In Proceedings of the IEEE INFOCOM 2020-IEEE Conference on Computer Communications Workshops (INFOCOM WKSHPS), Toronto, ON, Canada, 6–9 July 2020; pp. 1348–1349. [Google Scholar] [CrossRef]
  25. Liu, J.; Tian, Z.; Zheng, R.; Liu, L. A Distance-Based Method for Building an Encrypted Malware Traffic Identification Framework. IEEE Access 2019, 7, 100014–100028. [Google Scholar] [CrossRef]
  26. Chen, T.; Guestrin, C. XGBoost: A Scalable Tree Boosting System. In Proceedings of the 22nd ACM SIGKDD International Conference on Knowledge Discovery and Data Mining, KDD ’16, San Francisco, CA, USA, 13–17 August 2016; Association for Computing Machinery: New York, NY, USA, 2016; pp. 785–794. [Google Scholar] [CrossRef] [Green Version]
  27. Barut, O.; Luo, Y.; Zhang, T.; Li, W.; Li, P. Multi-Task Hierarchical Learning Based Network Traffic Analytics. In Proceedings of the ICC 2021—IEEE International Conference on Communications, Montreal, QC, Canada, 14–23 June 2021; pp. 1–6. [Google Scholar] [CrossRef]
  28. Kim, D.; Han, J.; Lee, J.; Roh, H.; Lee, W. Feasibility of Malware Traffic Analysis through TLS-Encrypted Flow Visualization. In Proceedings of the 2020 IEEE 28th International Conference on Network Protocols (ICNP), Madrid, Spain, 13–16 October 2020; pp. 1–2. [Google Scholar] [CrossRef]
  29. Nataraj, L.; Karthikeyan, S.; Jacob, G.; Manjunath, B.S. Malware Images: Visualization and Automatic Classification. In Proceedings of the 8th International Symposium on Visualization for Cyber Security, VizSec ’11, Pittsburgh, PA, USA, 20 July 2011; Association for Computing Machinery: New York, NY, USA, 2011. [Google Scholar] [CrossRef]
  30. Jian, Y.; Kuang, H.; Ren, C.; Ma, Z.; Wang, H. A novel framework for image-based malware detection with a deep neural network. Comput. Secur. 2021, 109, 102400. [Google Scholar] [CrossRef]
  31. Awan, M.J.; Masood, O.A.; Mohammed, M.A.; Yasin, A.; Zain, A.M.; Damaševičius, R.; Abdulkareem, K.H. Image-Based Malware Classification Using VGG19 Network and Spatial Convolutional Attention. Electronics 2021, 10, 2444. [Google Scholar] [CrossRef]
  32. Hemalatha, J.; Roseline, S.A.; Geetha, S.; Kadry, S.; Damaševičius, R. An Efficient DenseNet-Based Deep Learning Model for Malware Detection. Entropy 2021, 23, 344. [Google Scholar] [CrossRef] [PubMed]
  33. Holland, J.; Schmitt, P.; Feamster, N.; Mittal, P. New Directions in Automated Traffic Analysis. In Proceedings of the 2021 ACM SIGSAC Conference on Computer and Communications Security, CCS ’21, Virtual Event, Korea, 15–19 November 2021; Association for Computing Machinery: New York, NY, USA, 2021; pp. 3366–3383. [Google Scholar] [CrossRef]
  34. Shen, M.; Liu, Y.; Zhu, L.; Xu, K.; Du, X.; Guizani, N. Optimizing feature selection for efficient encrypted traffic classification: A systematic approach. IEEE Netw. 2020, 34, 20–27. [Google Scholar] [CrossRef]
  35. AlAhmadi, B.A.; Martinovic, I. MalClassifier: Malware Family Classification Using Network Flow Sequence Behaviour. In Proceedings of the 13th APWG Symposium on Electronic Crime Research (eCrime’2018), San Diego, CA, USA, 15–17 May 2018; pp. 1–13. [Google Scholar] [CrossRef]
  36. Paxson, V. Bro: A system for detecting network intruders in real-time. Comput. Netw. 1999, 31, 2435–2463. [Google Scholar] [CrossRef]
  37. Verkerken, M.; D’hooge, L.; Wauters, T.; Volckaert, B.; De Turck, F. Unsupervised Machine Learning Techniques for Network Intrusion Detection on Modern Data. In Proceedings of the 2020 4th Cyber Security in Networking Conference (CSNet), UNIL, Lausanne, Switzerland, 21–23 October 2020; pp. 1–8. [Google Scholar] [CrossRef]
  38. Gopalan, S.S.; Ravikumar, D.; Linekar, D.; Raza, A.; Hasib, M. Balancing Approaches towards ML for IDS: A Survey for the CSE-CIC IDS Dataset. In Proceedings of the 2020 International Conference on Communications, Signal Processing, and Their Applications (ICCSPA), Sharjah, United Arab Emirates, 16–18 March 2021; pp. 1–6. [Google Scholar] [CrossRef]
  39. Mauro, M.D.; Galatro, G.; Liotta, A. Experimental Review of Neural-Based Approaches for Network Intrusion Management. IEEE Trans. Netw. Serv. Manag. 2020, 17, 2480–2495. [Google Scholar] [CrossRef]
  40. Chou, D.; Jiang, M. A Survey on Data-Driven Network Intrusion Detection. ACM Comput. Surv. 2021, 54. [Google Scholar] [CrossRef]
  41. Cisco. Cisco Encrypted Traffic Analytics. 2019. Available online: https://www.cisco.com/c/en/us/solutions/collateral/enterprise-networks/enterprise-network-security/nb-09-encrytd-traf-anlytcs-wp-cte-en.pdf (accessed on 27 November 2021).
  42. McGrew, D.; Anderson, B.; Perricone, P.; Hudson, B. Joy: A Package for Capturing and Analyzing Network Flow Data and Intraflow Data, for Network Research, Forensics, and Security Monitoring. 2016. Available online: https://github.com/cisco/joy (accessed on 27 November 2021).
  43. Anderson, B.; McGrew, D. TLS Beyond the Browser: Combining End Host and Network Data to Understand Application Behavior. In Proceedings of the 19th ACM SIGCOMM Internet Measurement Conference (IMC’2019), Amsterdam, The Netherlands, 21–23 October 2019. [Google Scholar] [CrossRef] [Green Version]
  44. Ring, M.; Wunderlich, S.; Scheuring, D.; Landes, D.; Hotho, A. A survey of network-based intrusion detection data sets. Comput. Secur. 2019, 86, 147–167. [Google Scholar] [CrossRef] [Green Version]
  45. Thakkar, A.; Lohiya, R. A Review of the Advancement in Intrusion Detection Datasets. Procedia Comput. Sci. 2020, 167, 636–645. [Google Scholar] [CrossRef]
  46. Stratosphere. Stratosphere Laboratory Datasets. 2015. Available online: https://www.stratosphereips.org (accessed on 27 November 2021).
  47. Barut, O.; Luo, Y.; Zhang, T.; Li, W.; Li, P. NetML: A Challenge for Network Traffic Analytics. arXiv 2020, arXiv:2004.13006. [Google Scholar]
  48. Andreasen, F.; Cam-Winget, N.; Wang, E. TLS 1.3 Impact on Network-Based Security. Internet-Draft draft-camwinget-tls-use-cases-05, Internet Engineering Task Force. 2019. Available online: https://tools.ietf.org/id/draft-camwinget-tls-use-cases-05.html (accessed on 27 November 2021).
  49. Arp, D.; Quiring, E.; Pendlebury, F.; Warnecke, A.; Pierazzi, F.; Wressnegger, C.; Cavallaro, L.; Rieck, K. Dos and Don’ts of Machine Learning in Computer Security. In Proceedings of the 31st USENIX Security Symposium (USENIX Security 22), Boston, MA, USA, 10–12 August 2022; USENIX Association: Boston, MA, USA, 2022. [Google Scholar]
  50. Xu, K.; Hu, W.; Leskovec, J.; Jegelka, S. How Powerful are Graph Neural Networks? In Proceedings of the 7th International Conference on Learning Representations, ICLR 2019, New Orleans, LA, USA, 6–9 May 2019. [Google Scholar]
  51. Xu, K.; Li, C.; Tian, Y.; Sonobe, T.; Kawarabayashi, K.; Jegelka, S. Representation Learning on Graphs with Jumping Knowledge Networks. In Proceedings of the 35th International Conference on Machine Learning, ICML 2018, Stockholmsmässan, Stockholm, Sweden, 10–15 July 2018; Volume 80, pp. 5449–5458. [Google Scholar]
  52. Mikolov, T.; Sutskever, I.; Chen, K.; Corrado, G.; Dean, J. Distributed Representations of Words and Phrases and Their Compositionality. In Proceedings of the 26th International Conference on Neural Information Processing Systems—Volume 2, NIPS’13, Douglas, NV, USA, 5–10 December 2013; Curran Associates Inc.: Red Hook, NY, USA, 2013; pp. 3111–3119. [Google Scholar]
  53. Cho, K.; van Merrienboer, B.; Gülçehre, Ç.; Bahdanau, D.; Bougares, F.; Schwenk, H.; Bengio, Y. Learning Phrase Representations using RNN Encoder-Decoder for Statistical Machine Translation. In Proceedings of the 2014 Conference on Empirical Methods in Natural Language Processing, EMNLP 2014, Doha, Qatar, 25–29 October 2014; pp. 1724–1734. [Google Scholar] [CrossRef]
  54. Klambauer, G.; Unterthiner, T.; Mayr, A.; Hochreiter, S. Self-Normalizing Neural Networks. In Proceedings of the Advances in Neural Information Processing Systems 30: Annual Conference on Neural Information Processing Systems 2017, Long Beach, CA, USA, 4–9 December 2017; pp. 971–980. [Google Scholar]
  55. Bartos, K.; Sofka, M.; Systems, C.; Franc, V.; Bartos, K.; Sofka, M. Optimized Invariant Representation of Network Traffic for Detecting Unseen Malware Variants. In Proceedings of the USENIX Security Symposium, Austin, TX, USA, 10–12 August 2016; pp. 807–822. [Google Scholar]
  56. Batista, G.E.A.P.A.; Bazzan, A.L.C.; Monard, M.C. Balancing Training Data for Automated Annotation of Keywords: A Case Study. In Proceedings of the II Brazilian Workshop on Bioinformatics, Macaé, Brazil, 3–5 December 2003; pp. 10–18. [Google Scholar]
Figure 1. An example of the traffic interaction graph (TIG) from a Angler-EK sample. The minus sign indicates that the corresponding packet is sent from client to server.
Electronics 10 03180 g001
Figure 2. Markov chain fingerprints from packet length sequences of TrickBot samples in our dataset (left) and NetML 2020 dataset (right). Note that for simplicity, edges with <1% state transition probability are removed in (a). (a) TrickBot fingerprint generated from our dataset, (b) TrickBot fingerprint generated from NetML 2020 dataset.
Electronics 10 03180 g002
Figure 3. An overview of our evaluation framework for the malware family classification methods.
Electronics 10 03180 g003
Figure 4. Confusion matrices of classification results using (a) Markov chain fingerprinting with maximum likelihood classifier, (b) traffic interaction graph with fully connected layer classifier (GraphDApp), and (c) embedding vector with FS-Net.
Electronics 10 03180 g004
Figure 5. Confusion matrices of classification results using (a) Markov chain fingerprinting with maximum likelihood classifier, (b) traffic interaction graph with fully connected layer classifier (GraphDApp), and (c) embedding vector with FS-Net with balanced train set.
Electronics 10 03180 g005
Figure 6. ROC curves using (a) Markov chain fingerprinting with maximum likelihood classifier, (b) traffic interaction graph with fully connected layer classifier (GraphDApp), and (c) embedding vector with FS-Net.
Electronics 10 03180 g006
Figure 7. The critical difference diagram of the post hoc Nemenyi test for (a) Markov chain fingerprinting and (b) traffic interaction graph (GraphDApp).
Electronics 10 03180 g007
Figure 8. Training and testing time of malware family classifiers used in evaluation. (a) Training time. (b) Testing time.
Electronics 10 03180 g008
Figure 9. Comparison of classification accuracy with normal labeling and 3% noise labeling.
Electronics 10 03180 g009
Figure 10. Confusion matrices of classification results using (a) Markov chain fingerprinting with maximum likelihood classifier, (b) traffic interaction graph with fully connected layer classifier (GraphDApp), and (c) embedding vector with FS-Net at 3% noisy labeling.
Electronics 10 03180 g010
Table 1. Flow samples of malware families used in evaluation.
Malware FamilyFlow SamplesTrain SetValidation SetTest Set
Angler-EK128802226
Dridex53935180108
Gootkit112702022
Hancitor21871392358437
IcedID1931253038
Rig-EK2641684353
Trickbot10,363663216582073
Zeus1194769186239
Total14,980958723972996
Table 2. Malware family classification results in terms of accuracy, F1 score, recall, and precision.
RepresentationClassification AlgorithmAccuracyF1 ScoreRecallPrecision
Markov Chain FingerprintMaximum Likelihood [6]71.99%76.74%71.99%86.02%
Markov Chain FingerprintL1 Logistic Regression [9] (cf. [20])69.12%56.56%69.12%47.86%
Markov Chain FingerprintLinear SVM [9] (cf. [8] for detection)69.19%56.59%69.19%47.87%
Markov Chain FingerprintDecision Tree (cf. [8] for detection)77.77%71.60%77.77%73.55%
Markov Chain FingerprintRandom Forest (cf. [8] for detection)77.50%71.30%77.50%75.87%
Traffic Interaction GraphFully-Connected Layer [11]97.83%97.93%97.83%98.18%
Traffic Interaction GraphLinear SVM96.92%97.08%96.92%97.44%
Traffic Interaction GraphDecision Tree85.91%87.72%85.91%91.56%
Traffic Interaction GraphRandom Forest92.85%91.93%92.85%92.50%
Embedding VectorFS-Net [10]91.40%89.91%91.40%92.46%
Table 3. AUC values for each classifiers using Markov chain fingerprinting with average rank.
Malware FamilyMaximum LikelihoodL1 Logistic RegressionRandom ForestLinear SVMDecision Tree
Angler-EK0.7611 (2)0.5979 (4)0.7635 (1)0.3281 (5)0.6960 (3)
Dridex0.8503 (1)0.5957 (3)0.6233 (2)0.3957 (5)0.5747 (4)
Gootkit0.7770 (1)0.5521 (4)0.6138 (2)0.5430 (5)0.5753 (3)
Hancitor0.8709 (1)0.2436 (5)0.7511 (2)0.2940 (4)0.7356 (3)
IcedID0.8498 (1)0.7120 (5)0.8169 (2)0.7139 (4)0.8069 (3)
Rig-EK0.6921 (1)0.6486 (2)0.5982 (3)0.4524 (5)0.5509 (4)
Trickbot0.4988 (4)0.3180 (5)0.7286 (1)0.6680 (3)0.7077 (2)
Zeus0.8710 (1)0.2520 (5)0.7347 (2)0.3130 (4)0.7229 (3)
Average Rank1.504.121.884.383.12
Table 4. AUC values for each classifiers using traffic interaction graph (GraphDApp) with average rank.
Malware FamilyFully Connected LayerRandom ForestLinear SVMDecision Tree
Angler-EK0.9975 (2.0)0.9764 (3.0)0.9984 (1.0)0.5558 (4.0)
Dridex0.9999 (1.5)0.9934 (3.0)0.9999 (1.5)0.9786 (4.0)
Gootkit0.9999 (1.5)0.9710 (3.0)0.9999 (1.5)0.5681 (4.0)
Hancitor0.9986 (2.0)0.9971 (3.0)0.9990 (1.0)0.9721 (4.0)
IcedID0.9999 (1.0)0.9918 (3.0)0.9980 (2.0)0.8785 (4.0)
Rig-EK0.9992 (2.0)0.9761 (3.0)0.9996 (1.0)0.9201 (4.0)
Trickbot0.9992 (2.0)0.9799 (3.0)0.9994 (1.0)0.9019 (4.0)
Zeus0.9979 (2.0)0.9921 (3.0)0.9985 (1.0)0.8891 (4.0)
Average Rank1.753.001.254.00
Publisher’s Note: MDPI stays neutral with regard to jurisdictional claims in published maps and institutional affiliations.

