Article

Privacy-Preserving Tampering Detection in Automotive Systems

Department of Electrical Engineering and Information Technology, Faculty of Engineering and Information Technology, “George Emil Palade” University of Medicine, Pharmacy, Science and Technology of Târgu Mureş, 540142 Targu Mures, Romania
*
Author to whom correspondence should be addressed.
Electronics 2021, 10(24), 3161; https://doi.org/10.3390/electronics10243161
Submission received: 20 November 2021 / Revised: 14 December 2021 / Accepted: 16 December 2021 / Published: 18 December 2021
(This article belongs to the Special Issue Security & Privacy in Intelligent Transportation Systems)

Abstract

:
Modern auto-vehicles are built upon a vast collection of sensors that provide large amounts of data processed by dozens of Electronic Control Units (ECUs). These, in turn, monitor and control advanced technological systems providing a large palette of features to the vehicle’s end-users (e.g., automated parking, autonomous vehicles). As modern cars become more and more interconnected with external systems (e.g., cloud-based services), enforcing privacy on data originating from vehicle sensors is becoming a challenging research topic. In contrast, deliberate manipulations of vehicle components, known as tampering, require careful (and remote) monitoring of the vehicle via data transmissions and processing. In this context, this paper documents an efficient methodology for data privacy protection, which can be integrated into modern vehicles. The approach leverages the Fast Fourier Transform (FFT) as a core data transformation algorithm, accompanied by filters and additional transformations. The methodology is seconded by a Random Forest-based regression technique enriched with further statistical analysis for tampering detection in the case of anonymized data. Experimental results, conducted on a data set collected from the On-Board Diagnostics (OBD II) port of a 2015 EUR6 Skoda Rapid 1.2 L TSI passenger vehicle, demonstrate that the restored time-domain data preserves the characteristics required by additional processing algorithms (e.g., tampering detection), showing at the same time an adjustable level of privacy. Moreover, tampering detection is shown to be 100% effective in certain scenarios, even in the context of anonymized data.

1. Introduction

Technological advancements have entirely reshaped the automotive industry. Modern auto-vehicles are built upon a vast collection of sensors that provide a large amount of data processed by dozens of Electronic Control Units (ECUs) [1]. ECUs monitor and control advanced technological systems providing an extensive palette of features to the vehicle’s end-users (e.g., automated parking, driverless vehicles). An overview of the vehicle’s internal architecture is shown in Figure 1.
As modern cars become more and more integrated with external systems (e.g., cloud-assisted monitoring and remote control), decisions are being taken at a rapid pace both locally, within ECUs, as well as in various external systems. These external components are aimed at facilitating advanced processing and, ultimately, to support the vehicle in delivering its modern features (e.g., anomaly detection modules, diagnostics systems). While, nowadays, vehicles are progressing towards the automotive Internet of Things [2], difficulties in securing in-vehicle communications are exposing the vehicle not only to cyber attacks [3,4], but also to tampering [5,6]. Tampering denotes deliberate and unauthorized manipulations of vehicle components, which alter vital vehicle functions aimed at gaining certain advantages (e.g., financial). Odometer tampering, for instance, is affecting used car dealers and consumers. As a result, several stakeholders have raised their concerns and have requested urgent solutions [7]. The European Commission estimated that up to 50% of used cars that are being traded across the borders within the European Union (EU) have their odometer manipulated. Other reports showed that a large number of trucks across various European Union countries have emissions much higher than their EURO norm, which suggests the presence of tampering (or the lack of maintenance) with vehicle’s emission control systems [8].
In light of such threats, it becomes imperative to transmit vehicle data to the relevant authorities for further processing and analysis. Especially in the context of tampering, where the vehicle is modified with the owner’s consent, data tampering detection cannot be contained only within the vehicle, since the vehicle owner may also tamper with the detection system. Therefore, a connected approach is required, where tampering detection is performed outside the vehicle. However, data transfers outside the vehicle are not trivially achievable, both from a security and, more significantly, from a data privacy perspective. The latter issue has recently come to the attention of policy-makers as well. Accordingly, the European Commission, through the European Data Protection Board, adopted on 28 January 2020 the “Guidelines 1/2020 on processing personal data in the context of connected vehicles and mobility related applications” [9]. The document defines personal data in the context of connected vehicles and distinguishes between different types of personal data, including geolocation, biometrics, and data revealing criminal offenses or other infractions. Subsequently, the document elaborates on the purpose and processing techniques of data. Consequently, in order to facilitate the implementation of regulatory directives, both policymakers and researchers need to work together and elaborate efficient techniques applicable both inside and outside the vehicle.
In line with recent policy-level requirements [9], this paper documents an efficient methodology for data privacy protection and tampering detection. The efficiency of the data anonymization methodology makes it suitable for in-vehicle implementation, while the tampering detection can be performed outside the vehicle, on the already anonymized data. This approach is in accordance with recent regulatory requirements, which explicitly stipulate that “wherever possible, use processes that do not involve personal data or transferring personal data outside of the vehicle (i.e., the data is processed internally)” [9]. The developed approach for data anonymization leverages data distortion [10] as a fundamental technique, and, more specifically, the Fast Fourier Transform (FFT) as a core data transformation algorithm. Observing that the complexity of the FFT is O ( n log n ) [11], we find it suitable for implementation in existing ECUs. Since the proposed approach filters data in the frequency domain, which inevitably results in data loss, the original data matrix can not be easily reconstructed from the distorted matrix. The data anonymization methodology is accompanied by a tampering detection technique that leverages the Random Forest ensemble machine learning technique and the cumulative sum algorithm. As demonstrated by experimental results conducted on a data set collected from the On-Board Diagnostics (OBD II) port of a 2015 EUR6 Skoda Rapid 1.2L TSI passenger vehicle, the restored data (i.e., in the time domain) preserves the required characteristics for tampering detection.
Compared to prior works [12,13,14], the approach documented in this paper distinguishes itself from several perspectives: (i) the transformations and pre-processing for data privacy are performed early, in the vehicle, to ensure end-to-end privacy protection; and (ii) the reduced complexity ( O ( n log n ) ) of the data anonymization makes it suitable for integration in vehicle controllers.
The remainder of the paper is organized as follows. Section 2 provides an overview of related techniques. The proposed approach is presented in Section 3. The experimental results are documented in Section 4, and the conclusions are formulated in Section 5.

2. Related Work

Various mechanisms have been proposed to preserve data privacy when potentially sensitive information is transmitted over the Internet (as sensor data is transferred from auto-vehicles to data analysis servers). Data needs to be protected both from the honest-but-curious [15], as well as from external attackers [16]. As data analysis and data mining do not necessarily require the exact values captured from sensors, original data can be distorted or/and aggregated while providing valuable input for further data processing. The remainder of this section documents both traditional techniques used for data anonymization and more recent privacy-preserving algorithms.

2.1. Background and Overview of Traditional Techniques

Time-series data collected from automotive systems contain information that may, for instance, lead to the identification of the driver [17]. Sensitive information (e.g., geolocation data, biometrics) should be hidden before leaving the vehicle and reaching an external system used for data analysis purposes (e.g., tampering detection). The following, potentially sensitive, characteristics of the time-series data have been identified [18] and should be considered while implementing data privacy techniques are: amplitude (the strength of a signal), average, peak and trough, trend, and periodicity (in the frequency domain).
Within the scientific literature we find three main directions for protecting time-series data: encryption, anonymization, and perturbation [19].
Encryption is a traditional privacy approach used to protect the data from unauthorized access. However, encryption may be challenging to implement in sensor-based systems due to their limited processing power. The anonymization (sometimes called sanitation [20]) consists of deleting, replacing, or hashing all the personally identifiable information (PII) within a data set. This process does not reduce the data quality, and anonymized data can be safely transported over the Internet. Popular approaches for data anonymization include k-anonymity [21], l-diversity [22], and t-closeness [23]. Perturbation, on the other hand, distorts data to protect the privacy of personal data [24]. The distortion decouples the resulting data from the original record values, and the perturbation algorithms use data to derive aggregate distributions. Two main advantages of perturbation are worth mentioning: it does not require additional knowledge of other records and its computational complexity is low [20].
The typical approach to hiding sensitive information in time series is data perturbation or distortion, which has been actively studied in recent years. Data perturbation techniques include randomization-based methods (additive perturbation [25], multiplicative perturbation [26,27], geometric perturbation [26], nonlinear perturbation [28], differential privacy (DP) [29]) and transformation-based methods [30,31,32,33,34].
Randomization-based methods consist of perturbing the original data using randomly generated values. Considering a set of data values, denoted by X = x 1 x N , collected from one sensor and the perturbed set, denoted by Y, the additive perturbation [25] consists of adding independent identically distributed (i.i.d.) random values extracted from a probability distribution (e.g., Uniform, Gaussian), denoted by E = e 1 e N , to the X vector of values, such that Y = x 1 + e 1 x N + e N . In the case of multiplicative perturbation [27], the perturbation is described as Y = X · E , where E has a specific variance and a mean of 1.0. Starting from the original data matrix X, a geometric perturbation is a mix of additive and multiplicative perturbations that maps the distorted data as: Y = R X + Φ + Δ , where X is the original data, R is a rotation permutation matrix, Φ is a random translation matrix, Δ is the noise matrix with independently and identically distributed values from a Gaussian distribution [26], and Y is the distorted data. Finally, the nonlinear randomization takes the following form: Y = B + Q · N ( A + R X ) , where B , Q , A , R are random matrices, N is a bounded nonlinear function [28], and Y is the distorted matrix. Generally speaking, perturbations based on randomization provide fair privacy, are good at preserving the distance between data points, are computationally efficient [27], and they may also provide lossy compression [30]. However, the noise can be filtered in many cases [35], thus the approach may be vulnerable to various types of attacks, such as “known-input attacks” [36] or MAP estimations [16].
Differential privacy (DP) is a newer approach for data perturbation that has been successfully used in various scenarios (e.g., centralized and federated learning [37,38]). Differential privacy protects data by adding the selected amount of noise to the original data using various mathematical algorithms (e.g., Laplace, Gaussian). However, obtaining the desired trade-off between privacy and accuracy may be difficult for time-series, and it may result in the reduction of data utility [19].
Another practical approach for data anonymization is data transformation: the collected values are firstly translated from the original feature space into a lower-dimensional feature space. Furthermore, high energy coefficients are considered [30], or noise is added to the resulting data matrix. In the end, the processed data is transformed back to the original space. Examples of such transformations that preserve Euclidean distances are the discrete Fourier transform (DFT) and the discrete Wavelet transform (DWT) [39]. Various algorithms that implement data transformations have been described in the literature, such as the Fourier perturbation algorithm (FPA) [32], clamping Fourier perturbation algorithm (CFPA) [34], wavelet perturbation algorithm (WPA) [33], and clamping wavelet perturbation algorithm (CWPA) [34]. These approaches are useful as they preserve Euclidean distances [30,31], make the reconstruction of original values difficult, and provide significant data reduction. The drawback of time-series data transformation is related to the usefulness of the perturbed data, as a trade-off between privacy and utility needs to be established.

2.2. Privacy-Preserving Detection Techniques

Considering that the developed approach for tampering detection leverages anomaly detection principles, the remainder of this section focuses on the analysis of prior privacy-preserving anomaly detection techniques.
In general, anomaly detection is a well-established direction of research with applications in various domains. In the case of industry-grade anomaly detection Genge, et al. [40] adopted Principle Component Analysis (PCA) for dimensionality reduction, alongside statistical analysis for anomaly detection. The applicability of data clustering techniques for anomaly detection was explored in the work of Kiss, et al. [41]. In this approach, Gaussian Mixture Model (GMM) was compared to the K-means clustering technique, and the superior performance of the former was demonstrated in the context of a chemical process. A similar attempt for the classification of different events was undertaken by Wang and Mao in [42]. Here, an ensemble of two models of one-class classification was developed. Its performance was demonstrated in the context of two industrial installations (an electric arc furnace and a wind tunnel) and several public datasets. In the direction of multivariate statistical analysis, we find the work of Daegeun Ha, et al. [43]. Here, the multi-mode PCA was used together with the K-nearest neighbor algorithm for process monitoring and data classification. The approach was evaluated in the context of a mixed refrigeration physical process. In a similar direction, Portnoy, et al. [44] developed a weighted adaptive recursive PCA approach for fault detection in a natural gas transmission pipeline. Conversely, Chen, et al. [45], aimed at reducing the size of the monitored parameter space with the help of a multisensor fusion strategy. The approach was tested in the context of state estimation of a small power network.
Similar works related to anomaly detection can be found in Internet of Things [46], and automotive systems [47]. In the remainder of this section, however, we focus on privacy-preserving anomaly detection. To this end, Keshk, et al. [12] used feature selection based on Pearson’s correlation coefficient (PCC) to approximate the linear correlation between two or more different variables. This was followed by the GMM to combine different features and to detect anomalous behavior. Essentially, data privacy was implemented via the PCC and the GMM, which combine the features and ensure that the original information is hidden. Compared to the approach proposed by Keshk, et al., the work at hand distinguishes itself by leveraging transformations and pre-processing early in the vehicle to ensure that data is already anonymized before being transmitted to any further processing (e.g., tampering detection).
Moving towards computation-intensive techniques, we find homomorphic encryption. Homomorphic encryption is a recent direction in cryptography, which has risen from the need to apply mathematical computations on encrypted data. Accordingly, the scenario entails that data is appropriately encrypted, and subsequent computations need to be applied in order to detect abnormal data. To this end, Alabdulatif, et al. [13] developed a privacy-preserving anomaly detection technique in a cloud-based approach. The solution entails the presence of data centers where sensitive data is stored and further processed for the detection of anomalies. The approach builds on Domingo-Ferrer’s additive and multiplicative privacy homomorphism scheme [48]. The scheme implies public/private parameters alongside modulo operation with large integers. Other techniques leveraging homomorphic techniques have been documented in the scientific literature, which has been applied in various directions [14,49].
More recently, Gyawali, et al. [50] developed an approach for a privacy-preserving misbehavior detection system in vehicular communication networks. The approach leverages several external components, alongside homomorphic encryption to enforce privacy, while detecting abnormal vehicle behavior. As already mentioned, and in comparison with Gyawali’s work, the approach documented in the paper at hand can be viewed as complementary. That is, its high computational efficiency (in terms of data anonymization) enables its provisioning within vehicles. However, in the case of external and collaborative data analysis, Gyawali’s approach could be applied on top of the approach at hand. This would ensure end-to-end data privacy, starting from the first component (e.g., the Engine Control Unit), up to the point where additional data processing techniques would be applied (e.g., cloud storage).
Lastly, in Table 1, we summarize the main advantages of the approach documented in this paper, with respect to the most relevant prior studies. As shown in this table, our approach has several advantages/distinct applicability when compared to the lightweight homomorphic encryption proposed by Alabdulatif, et al. [13], and the PPMDS (Privacy-preserving misbehavior detection system) method proposed by Gyawali, et al. [50]. Accordingly, homomorphic encryption can only be applied on an external host (e.g., server). However, the communication between automotive systems and the encryption server could raise major security challenges. Therefore, processing data locally is not only preferred, but recommended by regulatory authorities [9]. On the other hand, while the PPMDS method can be applied locally, the flexibility of the FFT-based methodology documented in this paper is superior from several perspectives: it supports the simultaneous anonymization of several sensor measurements, thus reducing the computation complexity; and, it provides an adjustable level of privacy, while taking into account the desired level of data utility. We further note that the efficiency of the data anonymization methodology makes it suitable for other applications as well, including smart parking systems [51], vehicle to vehicle communications [52], or, in general, vehicle to cloud communications [53]. However, for each scenario, the data utility needs to be further analyzed since other applications may require adjusting the method’s parameters.

3. Privacy-Preserving Tampering Detection

The developed approach embraces Fast Fourier Transform (FFT) as the core element for achieving data distortion. Briefly, the approach is applied in a scenario consisting of data distortion in the frequency domain, followed by data reconstruction for tampering detection. The envisioned steps for applying the documented approach are the following: (i) collect data from sensors and apply FFT; (ii) apply a suitable filter in the frequency domain to reduce data dimension; (iii) add Gaussian white noise to a selection of frequencies in order to amplify data distortion and increase data privacy; (iv) reconstruct the data (with the Inverse Fast Fourier Transform (IFFT)) and proceed with additional processing (e.g., anomaly/tampering detection).

3.1. FFT-Based Data Distortion

The Fourier transform is a reversible transformation, which describes a function as a sum of sine and cosine waves. The developed approach leverages the fundamental properties of FFT to decompose sensor data into frequencies and to reconstruct it after a prior filtering phase. FFT is an algorithm for computing the discrete Fourier transform (DFT). It converts a data sequence from its original domain (time in our case) to the frequency domain.
Consider sets of N discrete values collected from M sensors, which describe the state of a vehicle. Let A be a matrix of size M × N containing the sensor data. Then, for a function f ( x , y ) of size M × N , the DFT decomposition in the frequency domain is defined as:
F ( u , v ) = x = 0 M 1 y = 0 N 1 f ( x , y ) e 2 π i ( u x M + v y N )
The exponential in (1) can be expanded into sine and cosine components, and the variables u and v determine their frequencies. The following equation describes the inverse of the above discrete Fourier transform:
f ( x , y ) = 1 M N u = 0 M 1 v = 0 N 1 F ( u , v ) e 2 π i ( u x M + v y N )
The value of the Fourier transform at the origin F ( 0 , 0 ) of the frequency domain is called the Dominant Component and represents M · N times the average value of f ( x , y ) . As it is a base-2 algorithm, FFT assumes that the number of points N to be processed satisfy the relationship N = 2 γ , where γ is an integer value [54]. This results in essential savings in computation time, hence reducing the complexity of DFT from O ( n 2 ) to O ( n log n ) .
Thus, matrix A needs to be transformed such that its width and height are integers power of 2. The simplest way to achieve this is to zero pad the matrix. The size of the new zero-padded matrix A ¯ is M ¯ × N ¯ , where both M ¯ and N ¯ are integers power of 2. The next step is to move the Dominant Component located at F ( 0 , 0 ) to the center of the transformed matrix, F ( M 2 , N 2 ) , in order to perform the filtering more efficiently. This can be achieved by multiplying each entry ( x , y ) of the A ¯ matrix with e π i ( x + y ) [55]. The new matrix is denoted by A ^ , and its size remains the same M ¯ × N ¯ .
The first transformation in the FFT-based data distortion is filtering. Low-pass filtering, high-pass filtering, or other types of filtering can be applied in the frequency domain in order to modify the original sensor data. After applying the filter, additional transformations (e.g., adding a Gaussian white noise) can increase distortion and decrease the chances of restoring the exact original signal.
Let us consider the matrix F + ¯ as the result of all transformations performed in the frequency domain. Then, the distorted data from the matrix F + ¯ is restored in the matrix D ¯ by applying the Inverse Fast Fourier Transform. As the size of the distorted matrix D ¯ is larger than that of the original matrix A, due to the zero padding, only the data from the top-left corner of the matrix is considered. Therefore, D ¯ is cropped to matrix D of size  M × N .
In a nutshell, by applying the above described FFT-based data distortion procedure the matrix D is obtained, which is similar to A, but not identical.

3.2. Data Distortion by Filtering Fourier Frequencies and Adding Gaussian Noise

As stated earlier, once the data is transformed to the frequency domain, a basic filter can be applied to cut off a selection of frequencies. Several types of filters, often used in image processing [56], can be applied, such as low-pass, high-pass, band-pass, band-reject, and threshold filters.
When applied to sensor measurements, the data restored from the frequency domain to the time domain needs to maintain its main characteristics but, at the same time, hide sensitive data. The approach we consider consists of applying low-pass filters and cutting off the high frequencies from the Fourier space, usually regarded as noise frequencies, while keeping the Dominant Component unaltered. Thus, the filtered matrix F ¯ becomes:
F ¯ ( u , v ) = H ( u , v ) · F ( u , v )
where H is a low-pass filter function that removes high frequencies, and F ¯ contains the remaining Fourier frequencies after the filter is applied.
Further, the ideal 2D low-pass filter (ILPF) [56] is applied to data. This filter keeps all frequencies inside a radius f c and discards all the rest. The ILPF involves a simple computational process, and it can be obtained rapidly:
H ( u , v ) = 1 , if u 2 + v 2 f c 0 , otherwise ,
where f c is the cut-off frequency. The helper function ComputeFilter mentioned in Algorithm 1 computes the H matrix.
In addition to filtering, other data transformations are possible. These can be applied in the frequency domain either before or after the filtering. In this context, our choice is to apply a Gaussian white noise with a given variance in the frequency domain after filtering, to enhance the distortion of the resulting data and ensure data privacy.
The selected method [31] defines the discord  σ as the standard deviation of the added perturbation. The discord σ determines the maximum information loss that the system is willing to tolerate and the maximum uncertainty that can be introduced. By design, the perturbation technique of adding Gaussian white noise with variance σ 2 preserves the signal’s spectral and “smoothness” properties [31]. Thus, the approach preserves both privacy and utility of time series. To increase resistance to filtering and other types of attacks, we add the noise to only a fraction of the frequencies such that the total noise variance is maintained at σ 2 .
Algorithm 1: FFT-based data distortion.
Input: A (Sensor data); f c (Cut-off frequency); σ (Noise variance)
Output: D (The distorted data)
Electronics 10 03161 i001
Proposition 1.
A standard deviation of σ N / K for K out of N frequencies maintains the overall variance of the Gaussian white noise at σ 2 .
Proof. 
We denote with n i the Gaussian noise to be applied to frequency values. The variance V a r [ n i ] is by definition:
V a r [ n i ] = 1 N i I ( n i μ ) 2 = 1 N i I n i 2 ,
where N is the total number of non-filtered frequencies ( N = s u m ( F ¯ > 0 ) ), μ is the mean of noise values, μ = 0, and I is the set of indices of the non-filtered frequencies. Further, we separate the noise applied to the selected frequencies ( i I , where I is the set of indices of frequencies with the magnitude greater than σ ) from the noise applied to the rest of the frequencies ( i I I ):
V a r [ n i ] = 1 N i I n i 2 = 1 N i I n i 2 + i I I n i 2 .
The variance of the noise values greater than σ is:
σ 2 N K = 1 K i I n i 2 , a n d i I n i 2 = σ 2 N .
By replacing (7) into Equation (6), and taking into account that n i is zero for frequencies with magnitude less than σ , we obtain that V a r [ n i ] = σ 2 :
V a r [ n i ] = 1 N σ 2 N + ( N K ) · 0 = σ 2 .
 □
Lastly, we added the above-described Gaussian noise to the entire frequency matrix F ¯ resulted after applying the low-pass filter. To every non-zero frequency from F ¯ with a magnitude greater than σ , a complex Gaussian random number was added to the real and imaginary parts, in order to distort the amplitude and the phase independently. The transformed matrix F + ¯ contains the filtered frequencies, part of them distorted by the noise, such that the result enforces data privacy and maintains utility. The described procedure, alongside the addition of noise, are summarized as Algorithm 1 and Algorithm 2, respectively.
Algorithm 2: Add Gaussian white noise to the frequency matrix.
Input: F ¯ (The filtered frequency matrix); σ (Noise variance)
Output: F + ¯ (The distorted frequency matrix)
Electronics 10 03161 i002

3.3. Data Distortion Measurements

In order to compare the original data matrix A to the distorted data matrix D, metrics are necessary to evaluate and control the distortion process. By comparing the original data to the distorted one, one may decide to re-apply the distortion process in order to keep the distortion metrics between the desired parameters.
The distorted data resulting by applying the FFT-based method depends on the chosen cut-off frequency ( f c ) and the discord σ . Consequently, if the distortion is higher than expected, an additional data distortion may be necessary having a higher cut-off frequency or a lower discord σ value.
We measure the performance of the proposed perturbation solution and compare the 1D and 2D sensor data distortion using the Mean Absolute Error (MAE) index:
M A E = 1 N i N | X ( i ) Y ( i ) | ,
where N is the length of the time series, X the original data vector, and Y the distorted data.

3.4. Tampering Detection with Anonymized Data

This section complements the prior data distortion technique with a tampering detection methodology. More specifically, we leverage random forest-based regression, accompanied by statistical analysis, for detection purposes.

3.4.1. Random Forest

Random forest (RF) is an ensemble machine learning methodology introduced by Breiman in 2001 [57]. It can be applied for classification or regression, alongside other tasks (e.g., feature ranking and selection). In this work, we leverage the RF for regression purposes, with the ultimate goal to detect tampering.
More formally, let us consider X a matrix of m variables X = [ X 1 X 2 . . . X m ] , denoting raw measurements. Each X i , i [ 1 , m ] is a column vector of n observations. Each column denotes measurements associated with a particular feature; these features are also known as the “predictors”. Let Y denote a column vector of n observations, containing (at least for the approach documented in this paper) a single feature, also known as the “label”. Essentially, the predictors are used as input to the RF methodology in order to predict the label feature.
In the following, we distinguish between two sub-sets of X , namely: the training dataset consisting of ( X T r a i n , Y T r a i n ), where X T r a i n X , Y T r a i n Y ; and the evaluation (test) dataset consisting of ( X T e s t , Y T e s t ), where X T e s t X , Y T e s t Y .
Next, by training an RF on ( X T r a i n , Y T r a i n ) we obtain a model M R F that can be used for prediction purposes:
Y P = M R F . p r e d i c t ( X T e s t ) ,
where Y P is a column vector of predicted values.

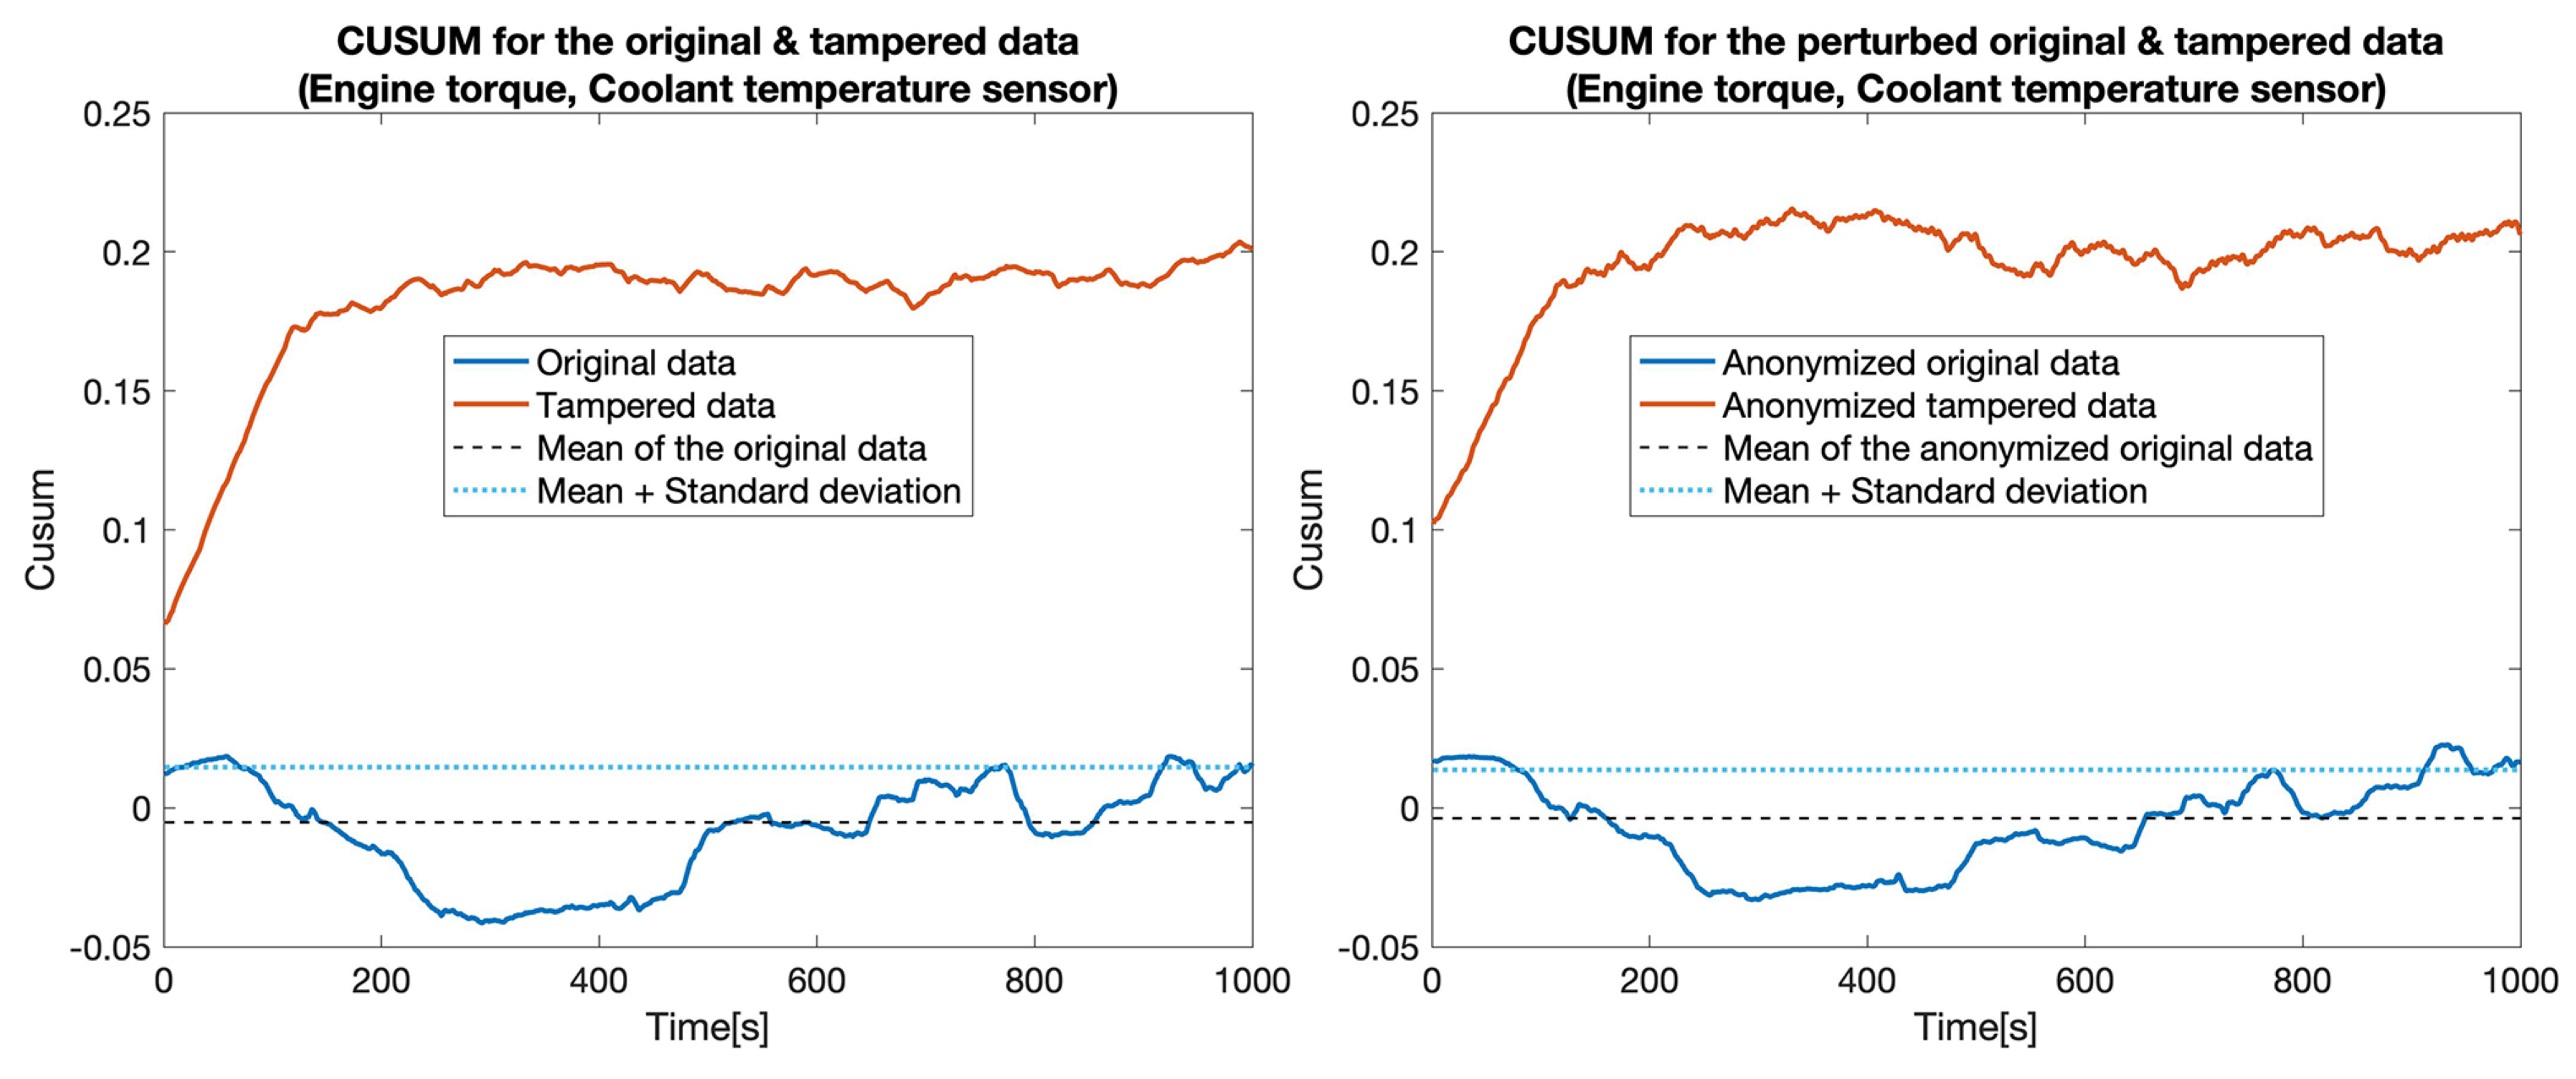
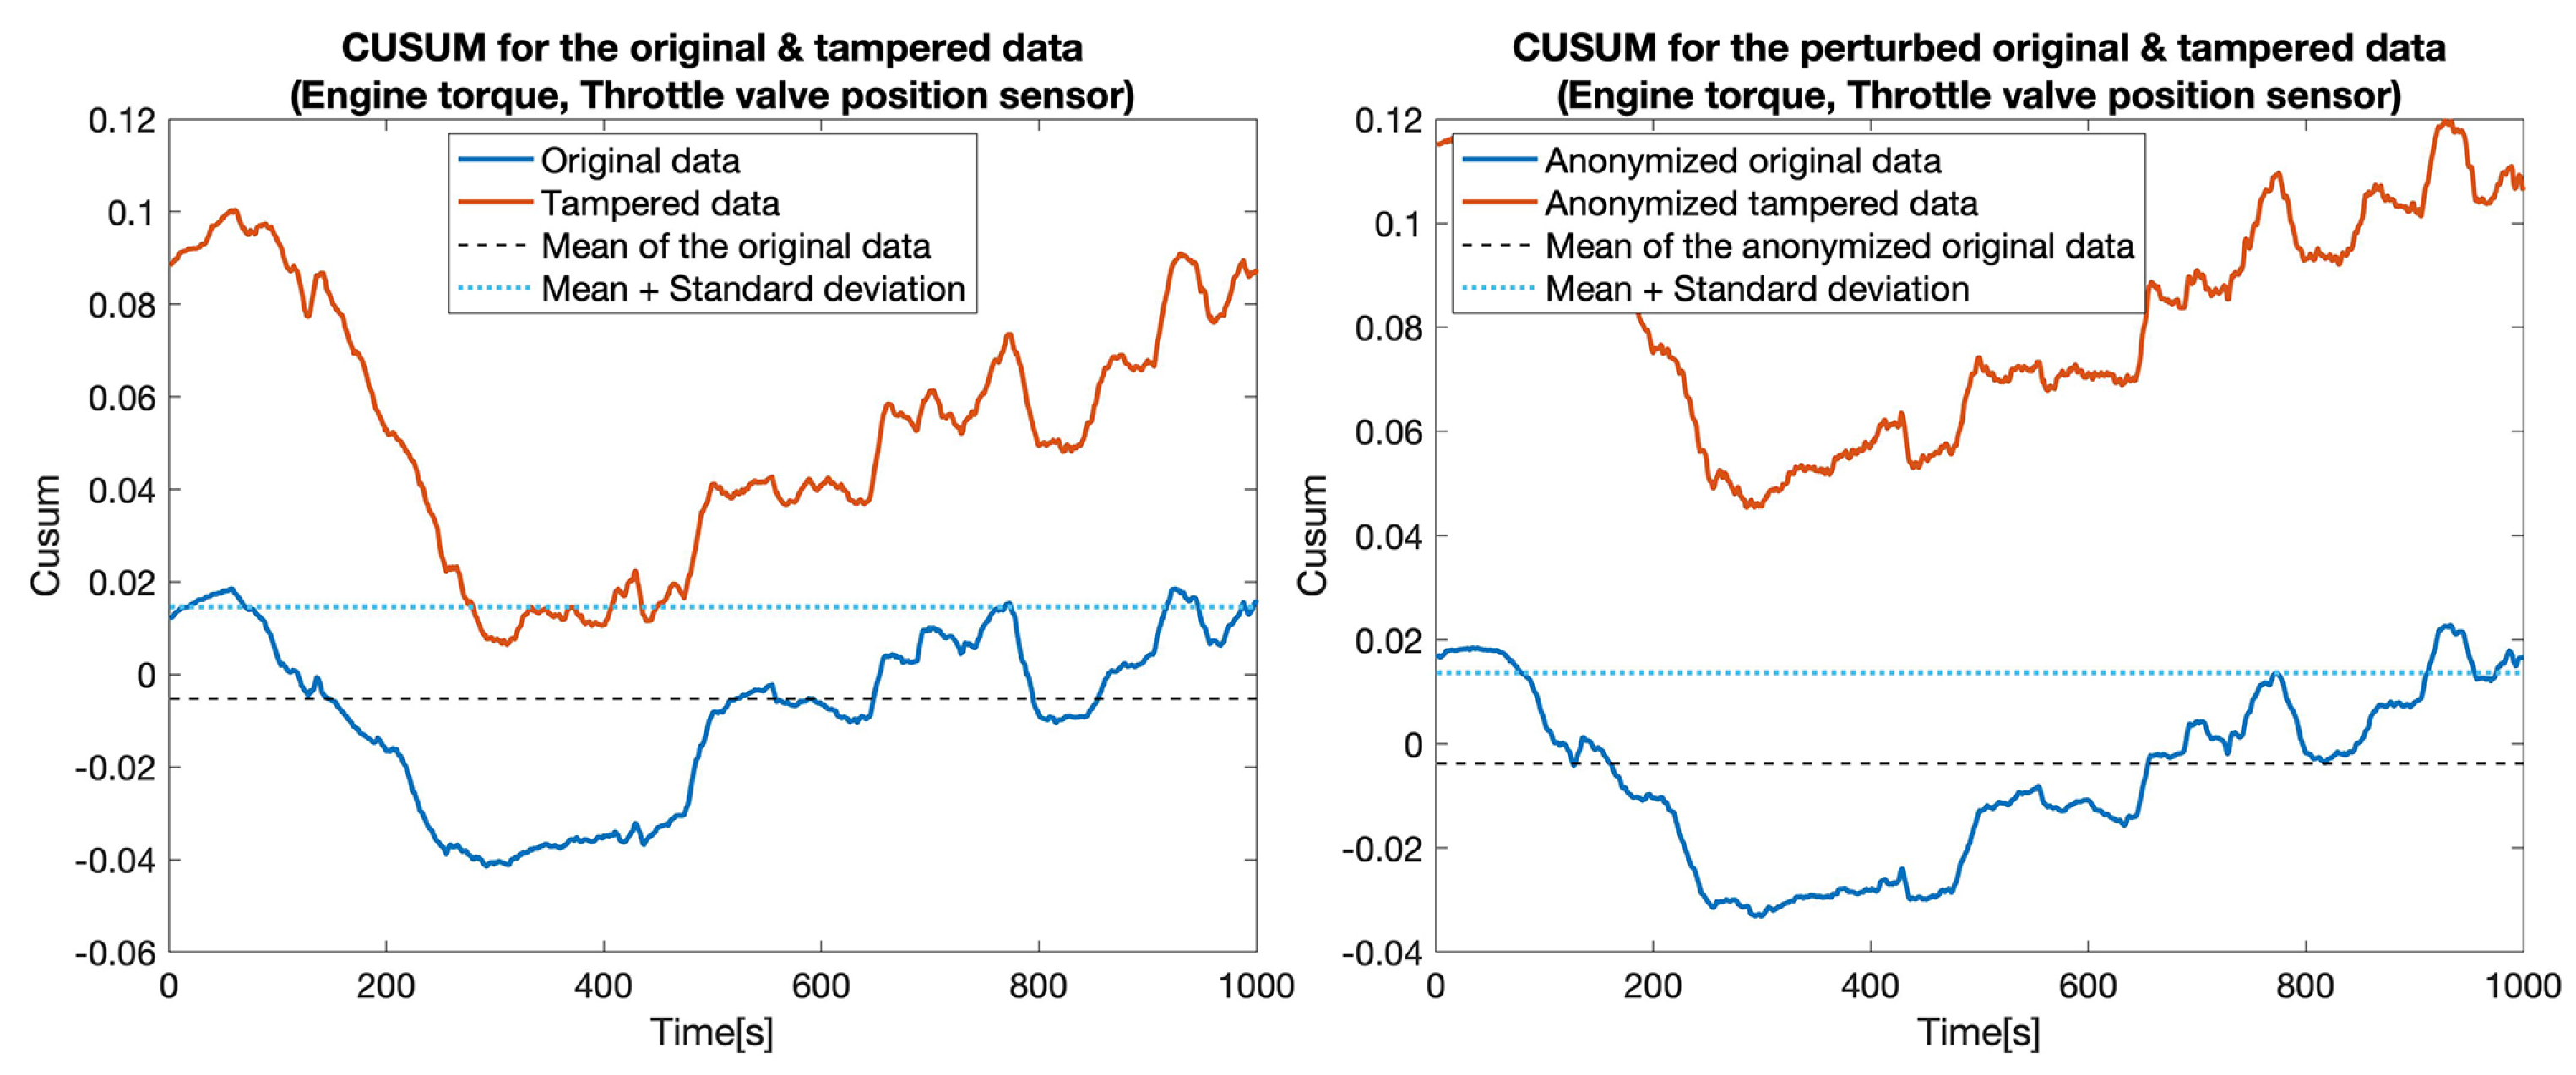
3.4.2. The Univariate Cumulative Sum

Univariate cumulative sum (UCUSUM)-based approaches have been known to provide an efficient solution for detecting the gradual change of the monitored variables. They have been first proposed in [58], and presume one change-point in the mean value of the recorded time series. However, they are also capable of detecting small changes by accumulating the deviations from several samples.
The simplest form of a UCUSUM is the one that records the changes in the parameters of an independent random series X. In this case, it is presumed that the parameter μ 0 (the mean value) is a reference value computed in a tampering-free scenario. The UCUSUM is computed over a moving window of size W according to Algorithm 3. Here, the notation X ( i : i + W 1 ) denotes a sub-vector of elements starting from index i up to index i + W 1 .
Algorithm 3: UCUSUM computation over a sliding window.
Input: X (Column vector); W (Sliding window size);
Output: CS (The cumulative sum as a column vector)
Electronics 10 03161 i003

3.4.3. Tampering Detection

The tampering detection methodology leverages the RF technique alongside the UCUSUM. Namely, the output of the data distortion procedure is the input to the RF model. The prediction error is then cumulated with the help of the UCUSUM methodology. The same procedure is applied in the tampering-free and the tampering scenario.
More formally, we presume that a M R F was obtained by training a RF model in a tampering free scenario against a particular label feature Y T r a i n . By leveraging a test dataset ( X T e s t , Y T e s t ), in the tampering-free scenario we obtain the following:
e r r T F r e e = | M R F . p r e d i c t ( X T e s t ) Y T e s t | ,
C S T F r e e = C u m u l a t i v e S u m ( e r r T F r e e , W ) .
That is, we compute the prediction error e r r T F r e e in the tampering-free scenario. Then, we apply the UCUSUM over the e r r T F r e e column vector and obtain C S T F r e e . By leveraging C S T F r e e , the detection threshold D T H is set at one standard deviation from the mean value μ 0 computed in the tampering-free scenario:
D T H = μ 0 + s t d ( C S T F r e e ) .
Next, in the tampering scenario, consisting of the dataset ( X T a m p , Y T a m p ), we compute the following:
e r r T a m p = | M R F . p r e d i c t ( X T a m p ) Y T a m p | ,
C S T a m p = C u m u l a t i v e S u m ( e r r T a m p , W , μ 0 ) .
Then, for detection purposes, each value in C S T a m p is compared to D T H . A successful detection point is considered for C S T a m p ( i ) > D T H .
For estimating the performance of the detection strategy, the True Positive Rate (TPR) and the False Positive Rate (FPR) are computed. TPR is the proportion of correctly detected anomaly/tampered values and is computed as:
T P R = T P T P + F N .
On the other hand, the FPR is the proportion of wrongly detected anomaly/tampered values, that is:
F P R = F P F P + T N .
The TPR and FPR measures depend on: the true positive (TP), denoting the number of values correctly categorized as anomalies; the true negative (TN), which refers to the number of values that are not anomalies and detected as such; false negative (FN), which are values that are anomalous but not detected; and, false positive (FP), which refers to the number of values that are not anomalies but categorized as ones.

3.5. Computational Complexity

Since one of the objectives of the paper is to find a suitable implementation for existing ECUs, we analyze the computational complexity of the perturbation phase, as the detection takes place on external systems. FFT can be computed in O ( n log n ) [11], and no additional complexity is added by the filtering phase and the noise addition. The approach is time-efficient even in the case of processing larger amounts of data (as presented in Section 4.3, in the scalability analysis).

4. Experimental Results

To validate the proposed approach, we experimented on a data set collected from the On-Board Diagnostics (OBD II) port of a 2015 EUR6 Skoda Rapid 1.2 L TSI passenger vehicle. The data was collected with VCDS, an aftermarket Windows-based diagnostic software for VAG (VW-Audi Group) motor vehicles, using an OBD II - USB interface cable. The data set consisted of data collected from 12 sensors. Matlab was used to implement the proposed approach and all the subsequent experiments. Firstly, we started with the data provided by only one sensor, and afterward, we extended the procedure to a larger data set.

4.1. 1D Sensor Data FFT-Based Distortion

The data used in this experiment, collected via the OBD II port, originates from the oxygen sensor ( O 2 ), also known as the lambda sensor. This sensor is located in the vehicle’s exhaust stream and provides the engine control unit (ECU) a voltage corresponding to the oxygen content in the exhaust gases. By means of a feedback loop, the ECU controls the air to fuel ratio (AFR) of the engine, which is uniquely related to the oxygen concentration. In order to meet exhaust pollution requirements, the ECU has to maintain the AFR close to the stoichiometric ratio of 14.7:1 (for gasoline fuel) or the normalized AFR λ = 1 . At this ideal ratio, the output of the O 2 —the sensor is approximately 450 mV.
The normalized AFR λ represents the ratio of actual AFR ( A F R a c t ) to stoichiometric AFR ( A F R s t ) : λ = A F R a c t / A F R s t . As the AFR becomes unbalanced, varying around the desired value ( λ = 1 ), the output of the sensor changes abruptly from 100 mV to 900 mV, denoting either a lean ( λ > 1 : too much air and too little fuel) or a rich ( λ < 1 : too much fuel and too little air) operation of the combustion engine [59].
Figure 2 shows the raw measurements (lambda) collected from the lambda sensor over a time interval of 400s and the distorted signal resulting by applying the perturbation procedure described in the previous section (Algorithm 1). Two sets of parameters ( f c and σ ) have been utilized, as indicated in the figures.

4.2. 2D Sensor Data FFT-Based Distortion

For data provided by multiple sensors, two approaches may be used: the first one applies the FFT-based distortion method to the data values of each sensor, and the second one applies the distortion to the entire data set.
The second approach is intuitively faster (see Table 2) and provides similar distortion properties. Rather than applying the FFT on every sensor data, it is much more efficient to process them all at once. We computed the data reduction by comparing the number of non-zero values of F + ¯ to the total number of values from the original matrix A. As seen in Table 2, the data reduction depends on the data dimensions (the number of sensors and the number of values). The closer these dimensions are to a power of 2, the greater is the gain in data reduction.
Figure 3 shows the processed data from the lambda sensor after the FFT method was applied on the A matrix containing data from five selected sensors (Current of oxygen sensor, Oxygen jump sensor voltage, Engine torque, Throttle valve position, Coolant temperature). The same cut-off frequency and discord σ were used as in the test shown in Figure 2. By comparing the M A E values for the 1D and 2D distortions, one may conclude that both approaches provide similar perturbation. Further, the utility of the distorted data has to be demonstrated.

4.3. Privacy-Preserving Tampering Detection

An essential purpose of our research is to demonstrate that the proposed perturbation maintains the utility of the data set. In the case of anomaly or tampering detection, the objective is to be able to detect the anomalous data points, even after the data was distorted due to privacy reasons.
The experimental setup used a second data set collected in the same conditions as the original one. We used the two data sets to create a tampered data set (Figure 4), denoted by T. In order to recreate a realistic tampering scenario, we replaced measurements in the second data set with measurements from the original data set. This way, we were able to simulate the presence of a real tampering device, similar to those already available on the market, which operate as signal emulators replacing the original signal values with emulated ones, in order to deceive the ECUs [60].
Briefly, we applied the methodology developed in this paper for each original and tampered data set to protect the data (Algorithm 1 described in Section 3.1), and, secondly, to detect tampering (process described in Section 3.4).
At first, we constructed five data sets by replacing the values for one particular sensor: T C u r r e n t O f O x y g e n S e n s o r , T O x y g e n J u m p S e n s o r V o l t a g e , T C o o l a n t T e m p e r a t u r e , T T h r o t t l e V a l v e P o s i t i o n , and T E n g i n e T o r q u e . Then, for each pair of data sets (the original one and a tampered data set), which we called the clear data set, we applied the tampering detection using the Random forest (RF) and UCUSUM approach described earlier. By computing the T P R and F P R (Table 3, Clear data column), we noticed that the tampering was detected with high probability rates using the proposed approach (i.e., reaching 100% for most of the considered sensors). Next, we applied the distortion on both data sets. The distortion considered a filtering in the frequency domain ( f c = 350 ) and a Gaussian noise ( σ = 5 ). Afterwards, the T P R and F P R were measured for the distorted data as well (Table 3, Anonymized data column). This showed that, even if data is distorted (i.e., anonymized), tampering detection is still highly likely to succeed. Accordingly, the value of TPR decreased from 77.4% to 76% in the case of tampering with the T C u r r e n t O f O x y g e n S e n s o r . Subsequently, we recorded a reduction of TPR in the case of the T E n g i n e T o r q u e (from 100% to 82.7%). Nevertheless, the remaining tampering scenarios did not exhibit a reduction in the value of the TPR. However, an increase in the FPR was still recorded in all of the considered scenarios (from 18.5% to 21.5%). The CUSUM values for all experiments involving a singletampered sensor are shown in Figure 5, Figure 6, Figure 7, Figure 8 and Figure 9.
Secondly, we increased the level of complexity for the tampering by replacing (i.e., simulating) measurements for two sensors at once: T C u r r e n t O f O x y g e n S e n s o r / O x y g e n J u m p S e n s o r V o l t a g e , T C u r r e n t O f O x y g e n S e n s o r / E n g i n e T o r q u e , T E n g i n e T o r q u e / C o o l a n t T e m p e r a t u r e , and T E n g i n e T o r q u e / T h r o t t l e V a l v e P o s i t i o n . The same procedure as before was followed to measure the performance of the developed approach. As depicted in Figure 10, Figure 11, Figure 12 and Figure 13 and Table 3, the developed approach still exhibits a high level of precision for most of the considered scenarios.
Lastly, we considered a scenario in which the tamperer replaces (simulates) the values reported by four sensors (Current of oxygen sensor, Coolant temperature, Engine torque, Throttle valve position). As shown in Figure 14 the detection is still not affected, even in this extreme case. In fact, the superior performance of the approach is confirmed by the computation of the T P R and F P R , as shown in Table 3.
Figure 15 showcases the scalability of the developed data anonymization strategy. Accordingly, the approach scales linearly with respect to the number of features (sensors). To this end, we investigated the scalability for various window sizes (60, 120, 300, 600, 1200) denoting the number of samples considered for anonymization purposes. Subsequently, we gradually increased the number of features from 1 to 100. As shown in the same figure, the approach exhibits a linear behavior with respect to the window size and the number of features (e.g., signals). This further confirms our initial statement that the data anonymization approach is suitable for being hosted inside the vehicle.

5. Conclusions

This paper investigated the possible use of FFT-based distortion techniques to preserve data privacy of sensor data collected from auto vehicles. As shown, the proposed FFT-based approach involves filtering and the addition of Gaussian white noise to preserve the main characteristics of data, while enforcing data privacy. We have demonstrated that the approach has additional benefits: it is fast even for an increasing number of sensors, and, it may, under certain conditions, lead to a reduction in the size of the data to be transmitted to external processing components.
The data distortion procedure was seconded by a tampering detection methodology. The detection embraces Random Forest regression and statistical analysis. The detection strategy on both clear and anonymized data was applied on a real dataset collected from a 2015 EUR6 Skoda Rapid 1.2 L TSI passenger vehicle. A realistic tampering scenario was simulated by injecting measurements from a distinct data set. The obtained results have shown that the approach is promising in terms of TPR, exhibiting up to a 100% detection rate. However, the rate of FPR can, in some cases, reach 21%, which requires further research. To this end, we note, however, that the main novelty and contribution to the state of the art is the actual data distortion procedure. Therefore, the tampering detection should be viewed as a secondary contribution, which can be improved by leveraging other techniques documented in the scientific literature [41,47].
As future work, we intend to further improve on the tampering detection methodology, but also, to improve the technique for data anonymization. A further extension will constitute the implementation of a prototype within an embedded environment, similar to what is found within auto-vehicles. A key challenge will constitute the extension of the proposed technique with data pre-processing techniques to ensure real-time execution.

Author Contributions

Conceptualization, A.-S.R. and B.G.; data curation, A.-S.R. and B.G.; formal analysis, A.-S.R.; investigation, A.-S.R. and B.G.; methodology, A.-S.R.; project administration, A.-S.R., B.G. and P.H.; resources, A.-S.R. and B.G.; software, A.-S.R. and B.G.; supervision, B.G. and P.H.; validation, A.-S.R., B.G. and A.-V.D.; visualization, A.-S.R.; writing—original draft, A.-S.R., B.G. and A.-V.D.; writing—review & editing, A.-S.R. and B.G. All authors have read and agreed to the published version of the manuscript.

Funding

This work was funded by the European Union’s Horizon 2020 Research and Innovation Programme through the DIAS project (https://dias-project.com/, accessed on 10 November 2021) under Grant Agreement No. 814951. This document reflects only the author’s view and the Agency is not responsible for any use that may be made of the information it contains.

Conflicts of Interest

The authors declare no conflict of interest.

References

  1. Coppola, R.; Morisio, M. Connected Car: Technologies, Issues, Future Trends. ACM Comput. Surv. 2016, 49, 1–36. [Google Scholar] [CrossRef]
  2. Rahim, M.A.; Rahman, M.A.; Rahman, M.; Asyhari, A.T.; Bhuiyan, M.Z.A.; Ramasamy, D. Evolution of IoT-enabled connectivity and applications in automotive industry: A review. Veh. Commun. 2021, 27, 100285. [Google Scholar] [CrossRef]
  3. Khan, S.K.; Shiwakoti, N.; Stasinopoulos, P.; Chen, Y. Cyber-attacks in the next-generation cars, mitigation techniques, anticipated readiness and future directions. Accid. Anal. Prev. 2020, 148, 105837. [Google Scholar] [CrossRef]
  4. Tian, J.; Wang, B.; Guo, R.; Wang, Z.; Cao, K.; Wang, X. Adversarial Attacks and Defenses for Deep Learning-based Unmanned Aerial Vehicles. IEEE Internet Things J. 2021, 1. [Google Scholar] [CrossRef]
  5. Baldini, G.; Giuliani, R.; Gemo, M. Mitigation of Odometer Fraud for In-Vehicle Security Using the Discrete Hartley Transform. In Proceedings of the 2020 11th IEEE Annual Ubiquitous Computing, Electronics Mobile Communication Conference (UEMCON), New York, NY, USA, 28–31 October 2020; pp. 479–485. [Google Scholar] [CrossRef]
  6. Thirumalini, S.; Malemutt, P. Investigations on anti-Tampering of diesel particulate filter. Mater. Today Proc. 2021, 46, 4988–4992. [Google Scholar] [CrossRef]
  7. Ertug, I. Motion for a European Parliament Solution with Recommendations to the Commission on Odometer Manipulation in Motor Vehicles: Revision of the EU Legal Framework. Report of the European Parliament. 2018. Available online: https://www.europarl.europa.eu/doceo/document/A-8-2018-0155_EN.html (accessed on 15 November 2021).
  8. Grelier, F. CO2 Emissions from Cars: The Facts. European Federation for Transport and Environment AISBL. 2018. Available online: https://www.transportenvironment.org/wp-content/uploads/2021/07/2018_04_CO2_emissions_cars_The_facts_report_final_0_0.pdf (accessed on 15 November 2021).
  9. European Data Protection Board. Guidelines 1/2020 on Processing Personal Data in the Context of Connected Vehicles and Mobility Related Applications. 2020. Available online: https://edpb.europa.eu/our-work-tools/documents/public-consultations/2020/guidelines-12020-processing-personal-data_en (accessed on 15 November 2021).
  10. Agrawal, D.; Aggarwal, C.C. On the Design and Quantification of Privacy Preserving Data Mining Algorithms. In Proceedings of the 20th ACM SIGACT-SIGMOD-SIGART Symposium on Principles of Database Systems, New York, NY, USA, 21–23 May 2001; pp. 247–255. [Google Scholar]
  11. Johnson, S.; Frigo, M. Implementing FFTs in Practice, ch. 11; Rice University: Houston, TX, USA, 2008. [Google Scholar]
  12. Keshk, M.; Sitnikova, E.; Moustafa, N.; Hu, J.; Khalil, I. An Integrated Framework for Privacy-Preserving Based Anomaly Detection for Cyber-Physical Systems. IEEE Trans. Sustain. Comput. 2021, 6, 66–79. [Google Scholar] [CrossRef]
  13. Alabdulatif, A.; Kumarage, H.; Khalil, I.; Yi, X. Privacy-preserving anomaly detection in cloud with lightweight homomorphic encryption. J. Comput. Syst. Sci. 2017, 90, 28–45. [Google Scholar] [CrossRef]
  14. Spathoulas, G.; Theodoridis, G.; Damiris, G.P. Using homomorphic encryption for privacy-preserving clustering of intrusion detection alerts. Int. J. Inf. Secur. 2021, 20, 347–370. [Google Scholar] [CrossRef]
  15. Wang, Z.; Liu, W.; Pang, X.; Ren, J.; Liu, Z.; Chen, Y. Towards Pattern-aware Privacy-preserving Real-time Data Collection. In Proceedings of the IEEE INFOCOM 2020-IEEE Conference on Computer Communications, Toronto, ON, Canada, 6–9 July 2020; pp. 109–118. [Google Scholar]
  16. Liu, K.; Giannella, C.; Kargupta, H. A Survey of Attack Techniques on Privacy-Preserving Data Perturbation Methods; Springer: Boston, MA, USA, 2008; pp. 359–381. [Google Scholar] [CrossRef] [Green Version]
  17. Hallac, D.; Sharang, A.; Stahlmann, R.; Lamprecht, A.; Huber, M.; Roehder, M.; Sosic, R.; Leskovec, J. Driver identification using automobile sensor data from a single turn. In Proceedings of the 2016 IEEE 19th International Conference on Intelligent Transportation Systems (ITSC), Rio de Janeiro, Brazil, 1–4 November 2016; pp. 953–958. [Google Scholar] [CrossRef] [Green Version]
  18. Zhu, Y.; Fu, Y.; Fu, H. On Privacy in Time Series Data Mining; Springer: Berlin/Heidelberg, Germany, 2008; pp. 479–493. [Google Scholar] [CrossRef]
  19. Hassan, M.U.; Rehmani, M.H.; Chen, J. Differential Privacy Techniques for Cyber Physical Systems: A Survey. IEEE Commun. Surv. Tutorials 2020, 22, 746–789. [Google Scholar] [CrossRef] [Green Version]
  20. Wang, T.; Zheng, Z.; Rehmani, M.H.; Yao, S.; Huo, Z. Privacy Preservation in Big Data From the Communication Perspective—A Survey. IEEE Commun. Surv. Tutor. 2019, 21, 753–778. [Google Scholar] [CrossRef]
  21. Sweeney, L. k-Anonymity: A Model for Protecting Privacy. IEEE Secur. Priv. 2002, 10, 1–14. [Google Scholar] [CrossRef] [Green Version]
  22. Machanavajjhala, A.; Gehrke, J.; Kifer, D.; Venkitasubramaniam, M. l-Diversity: Privacy Beyond k-Anonymity. ACM Trans. Knowl. Discov. Data 2006, 1, 24. [Google Scholar]
  23. Li, N.; Li, T.; Venkatasubramanian, S. t-Closeness: Privacy Beyond k-Anonymity and l-Diversity. In Proceedings of the 2007 IEEE 23rd International Conference on Data Engineering, Istanbul, Turkey, 17–20 April 2007; Volume 2, pp. 106–115. [Google Scholar]
  24. Kreso, I.; Kapo, A.; Turulja, L. Data mining privacy preserving: Research agenda. Wiley Interdiscip. Rev. Data Min. Knowl. Discov. 2021, 11, e1392. [Google Scholar] [CrossRef]
  25. Agrawal, R.; Srikant, R. Privacy-Preserving Data Mining. In Proceedings of the 2000 ACM SIGMOD International Conference on Management of Data, SIGMOD ’00, New York, NY, USA, 15–18 May 2000; pp. 439–450. [Google Scholar] [CrossRef]
  26. Chen, K.; Liu, L. Privacy preserving data classification with rotation perturbation. In Proceedings of the Fifth IEEE International Conference on Data Mining (ICDM’05), Houston, TX, USA, 27–30 November 2005; p. 4. [Google Scholar] [CrossRef]
  27. Bingham, E.; Mannila, H. Random Projection in Dimensionality Reduction: Applications to Image and Text Data. In Proceedings of the Seventh ACM SIGKDD International Conference on Knowledge Discovery and Data Mining, KDD ’01, New York, NY, USA, 26–29 August 2001; pp. 245–250. [Google Scholar] [CrossRef]
  28. Bhaduri, K.; Stefanski, M.D.; Srivastava, A.N. Privacy-Preserving Outlier Detection through Random Nonlinear Data Distortion. IEEE Trans. Syst. Man, Cybern. Part B (Cybern.) 2011, 41, 260–272. [Google Scholar] [CrossRef] [PubMed] [Green Version]
  29. Dwork, C. Differential privacy: A survey of results. In Proceedings of the International Conference on Theory and Applications of Models of Computation, Xi’an, China, 25–29 April 2008; Springer: Berlin/Heidelberg, Germany, 2008; pp. 1–19. [Google Scholar]
  30. Mukherjee, S.; Chen, Z.; Gangopadhyay, A. A privacy-preserving technique for Euclidean distance-based mining algorithms using Fourier-related transforms. VLDB J. 2006, 15, 293–315. [Google Scholar] [CrossRef]
  31. Papadimitriou, S.; Li, F.; Kollios, G.; Yu, P.S. Time Series Compressibility and Privacy. In Proceedings of the 33rd International Conference on Very Large Data Bases, VLDB Endowment, VLDB ’07, Vienna, Austria, 23–27 September 2007; pp. 459–470. [Google Scholar]
  32. Rastogi, V.; Nath, S. Differentially Private Aggregation of Distributed Time-Series with Transformation and Encryption. In Proceedings of the 2010 ACM SIGMOD International Conference on Management of Data, Indianapolis, IN, USA, 6–10 June 2010; pp. 735–746. [Google Scholar]
  33. Lyu, L.; Law, Y.W.; Jin, J.; Palaniswami, M. Privacy-Preserving Aggregation of Smart Metering via Transformation and Encryption. In Proceedings of the 2017 IEEE Trustcom/BigDataSE/ICESS, Sydney, NSW, Australia, 1–4 August 2017; pp. 472–479. [Google Scholar]
  34. Lako, F.L.; Lajoie-Mazenc, P.; Laurent, M. Privacy-Preserving Publication of Time-Series Data in Smart Grid. Secur. Commun. Net. 2021, 2021, 6643566. [Google Scholar] [CrossRef]
  35. Huang, Z.; Du, W.; Chen, B. Deriving Private Information from Randomized Data. In Proceedings of the 2005 ACM SIGMOD International Conference on Management of Data, SIGMOD ’05, New York, NY, USA, 14–16 June 2005; pp. 37–48. [Google Scholar] [CrossRef] [Green Version]
  36. Giannella, C.; Liu, K.; Kargupta, H. Breaching Euclidean Distance-Preserving Data Perturbation Using Few Known Inputs. Data Knowl. Eng. 2013, 83, 93–110. [Google Scholar] [CrossRef] [Green Version]
  37. Jiang, L.; Lou, X.; Tan, R.; Zhao, J. Differentially Private Collaborative Learning for the IoT Edge. In Proceedings of the International Conference on Embedded Wireless Systems and Networks (EWSN) 2019, Beijing, China, 25–27 February 2019. [Google Scholar]
  38. Grigorescu, S.; Cocias, T.; Trasnea, B.; Margheri, A.; Lombardi, F.; Aniello, L. Cloud2Edge Elastic AI Framework for Prototyping and Deployment of AI Inference Engines in Autonomous Vehicles. Sensors 2020, 20, 5450. [Google Scholar] [CrossRef]
  39. Hong, S.K.; Gurjar, K.; Kim, H.S.; Moon, Y.S. A Survey on Privacy Preserving Time-Series Data Mining. In Proceedings of the 3rd International Conference on Intelligent Computational Systems ICICS, Singapore, 29–30 April 2013. [Google Scholar]
  40. Genge, B.; Haller, P.; Enăchescu, C. Anomaly Detection in Aging Industrial Internet of Things. IEEE Access 2019, 7, 74217–74230. [Google Scholar] [CrossRef]
  41. Kiss, I.; Genge, B.; Haller, P.; Sebestyén, G. Data clustering-based anomaly detection in industrial control systems. In Proceedings of the 2014 IEEE 10th International Conference on Intelligent Computer Communication and Processing (ICCP), Cluj-Napoca, Romania, 4–6 September 2014; pp. 275–281. [Google Scholar] [CrossRef]
  42. Wang, B.; Mao, Z. One-class classifiers ensemble based anomaly detection scheme for process control systems. Trans. Inst. Meas. Control. 2018, 40, 0142331217724508. [Google Scholar] [CrossRef]
  43. Ha, D.; Ahmed, U.; Pyun, H.; Lee, C.J.; Baek, K.H.; Han, C. Multi-mode operation of principal component analysis with k-nearest neighbor algorithm to monitor compressors for liquefied natural gas mixed refrigerant processes. Comput. Chem. Eng. 2017, 106, 96–105. [Google Scholar] [CrossRef]
  44. Portnoy, I.; Melendez, K.; Pinzon, H.; Sanjuan, M. An improved weighted recursive PCA algorithm for adaptive fault detection. Control. Eng. Pract. 2016, 50, 69–83. [Google Scholar] [CrossRef]
  45. Chen, B.; Ho, D.W.C.; Zhang, W.A.; Yu, L. Distributed Dimensionality Reduction Fusion Estimation for Cyber-Physical Systems Under DoS Attacks. IEEE Trans. Syst. Man Cybern. Syst. 2019, 49, 455–468. [Google Scholar] [CrossRef]
  46. Thaseen, I.S.; Mohanraj, V.; Ramachandran, S.; Sanapala, K.; Yeo, S.S. A Hadoop Based Framework Integrating Machine Learning Classifiers for Anomaly Detection in the Internet of Things. Electronics 2021, 10, 1995. [Google Scholar] [CrossRef]
  47. Longari, S.; Nova Valcarcel, D.H.; Zago, M.; Carminati, M.; Zanero, S. CANnolo: An Anomaly Detection System Based on LSTM Autoencoders for Controller Area Network. IEEE Trans. Netw. Serv. Manag. 2021, 18, 1913–1924. [Google Scholar] [CrossRef]
  48. Domingo-Ferrer, J. A Provably Secure Additive and Multiplicative Privacy Homomorphism. In Proceedings of the 5th International Conference on Information Security, ISC ’02, Sao Paulo, Brazil, 30 September–2 October 2002; Springer: Berlin/Heidelberg, Germany, 2002; pp. 471–483. [Google Scholar]
  49. Alabdulatif, A.; Khalil, I.; Yi, X. Towards secure big data analytic for cloud-enabled applications with fully homomorphic encryption. J. Parallel Distrib. Comput. 2020, 137, 192–204. [Google Scholar] [CrossRef]
  50. Gyawali, S.; Qian, Y.; Hu, R.Q. A Privacy-Preserving Misbehavior Detection System in Vehicular Communication Networks. IEEE Trans. Veh. Technol. 2021, 70, 6147–6158. [Google Scholar] [CrossRef]
  51. Tsiropoulou, E.E.; Baras, J.; Papavassiliou, S.; Sinha, S. RFID-based smart parking management system. Cyber-Phys. Syst. 2017, 3, 1–20. [Google Scholar] [CrossRef]
  52. Abbasi, I.A.; Shahid Khan, A. A review of vehicle to vehicle communication protocols for VANETs in the urban environment. Future Internet 2018, 10, 14. [Google Scholar] [CrossRef] [Green Version]
  53. Shon, T. In-Vehicle Networking/Autonomous Vehicle Security for Internet of Things/Vehicles. Electronics 2021, 10, 637. [Google Scholar] [CrossRef]
  54. Brigham, E.O. The Fast Fourier Transform and its Applications; Prentice-Hall, Inc.: Hoboken, NJ, USA, 1988; pp. 131–166. [Google Scholar]
  55. Xu, S.; Lai, S. Fast Fourier Transform Based Data Perturbation Method for Privacy Protection. In Proceedings of the 2007 IEEE Intelligence and Security Informatics, New Brunswick, NJ, USA, 23–24 May 2007; pp. 221–224. [Google Scholar]
  56. Dewangan, S.; Sharma, A. Image Smoothening and Sharpening using Frequency Domain Filtering Technique. Int. J. Emerg. Technol. Eng. Res. 2017, 5, 169–174. [Google Scholar]
  57. Breiman, L. Random Forests. Mach. Learn. 2001, 45, 5–32. [Google Scholar] [CrossRef] [Green Version]
  58. Page, E.S. Continuous inspection schemes. Biometrika 1954, 41, 100–115. [Google Scholar] [CrossRef]
  59. Franklin, G.F.; Powell, J.D.; Emami-Naeini, A. Feedback Control of Dynamic Systems, 8th ed.; Pearson: New York, NY, USA, 2019. [Google Scholar]
  60. AliExpress. Automotive Sensor Simulators. 2021. Available online: https://www.aliexpress.com/popular/automotive-sensor-simulator.html (accessed on 15 November 2021).
Figure 1. Internal architecture of the modern vehicle.
Electronics 10 03161 g001
Figure 2. 1D FFT-based data distortion for the Lambda sensor data ( f c -cut-off frequency, σ -discord, M A E -Mean Absolute Error): original data values (blue), filtered values in frequency domain (green), filtered and perturbed values in the frequency domain using additive Gaussian noise (red). (a) Time domain. (b) Frequency domain.
Electronics 10 03161 g002
Figure 3. 2D FFT-based data distortion for the Lambda sensor data ( f c -cut-off frequency, σ -discord, M A E -Mean Absolute Error): original data values (blue), filtered values in frequency domain (green), filtered and perturbed values in the frequency domain using additive Gaussian noise (red).
Electronics 10 03161 g003
Figure 4. Lambda sensor (Current of oxygen sensor) values for the original and the tampered data sets: original data values (blue) and tampered data values (orange).
Electronics 10 03161 g004
Figure 5. CUSUM for the original data (blue) and tampered data (orange) for the Current of oxygen sensor.
Electronics 10 03161 g005
Figure 6. CUSUM for the original data (blue) and tampered data (orange) for the Oxygen jump sensor voltage sensor.
Electronics 10 03161 g006
Figure 7. CUSUM for the original data (blue) and tampered data (orange) for the Coolant temperature sensor.
Electronics 10 03161 g007
Figure 8. CUSUM for the original data (blue) and tampered data (orange) for the Throttle valve position sensor.
Electronics 10 03161 g008
Figure 9. CUSUM for the original data (blue) and tampered data (orange) for the Engine torque sensor.
Electronics 10 03161 g009
Figure 10. CUSUM for the original data (blue) and tampered data (orange) for sensors: Current of oxygen sensor and Oxygen jump sensor voltage.
Electronics 10 03161 g010
Figure 11. CUSUM for the original data (blue) and tampered data (orange) for sensors: Current of oxygen sensor and Engine torque.
Electronics 10 03161 g011
Figure 12. CUSUM for the original data (blue) and tampered data (orange) for sensors: Engine torque and Coolant temperature.
Electronics 10 03161 g012
Figure 13. CUSUM for the original data (blue) and tampered data (orange) for sensors: Engine torque and Throttle valve position.
Electronics 10 03161 g013
Figure 14. CUSUM for the original data (blue) and tampered data (orange) for four sensors tampered.
Electronics 10 03161 g014
Figure 15. The scalability of the proposed perturbation method according to the number of features and the window size (i.e., the number of samples).
Electronics 10 03161 g015
Table 1. Comparison to the closest related privacy-preserving anomaly detection techniques applicable to automotive systems.
Privacy Preservation TechniqueComputation OperationsPrivacy Preservation LocationApplicable on Multiple
Sensors
Simultaneously
Adjustable Level of PrivacyComputation Complexity
Lightweight homomorphic encryption [13]additive and multiplicative homomorphic encryptionon an external trusted servernonohigh
PPMDS [50]additive homomorphic encryption and signinglocallynonomedium
FFT-based data perturbationdata transformation, frequency filtering, noise additionlocallyyesyeslow
Table 2. Execution times (FFT + frequency filtering + noise addition) and data reduction ( f c = 100 , σ = 5 ).
No. ofOverall Exec.Exec. Time/SensorData
SensorsTime (ms)(ms)Reduction (%)
19.59.534.3
29.74.934.6
39.93.313.0
510.22.0−4.18
1011.11.1−4.11
1212.61.013.23
Table 3. TPR and FPR for the described tampering detection process.
# of Tampered SensorsTampered Sensor(s)Clear DataAnonymized Data
TPRFPRTPRFPR
1Current of oxygen sensor77.4%18.5%76%21.5%
1Oxygen jump sensor voltage100%18.5%100%21.5%
1Coolant temperature100%18.5%100%21.5%
1Throttle valve position100%18.5%100%21.5%
1Engine torque100%18.5%82.7%21.5%
2Current of oxygen sensor, Oxygen jump sensor voltage100%18.5%100%21.5%
2Current of oxygen sensor, Engine torque100%18.5%99.4%21.5%
2Engine torque, Coolant temperature100%18.5%100%21.5%
2Engine torque, Throttle valve position87.4%18.5%100%21.5%
4Current of oxygen sensor, Coolant temperature, Engine torque, Throttle valve position100%18.5%100%21.5%
Publisher’s Note: MDPI stays neutral with regard to jurisdictional claims in published maps and institutional affiliations.

