Article

Malware Detection Based on Graph Attention Networks for Intelligent Transportation Systems

1
Department of Computer Science and Engineering, Qatar University, Doha 2713, Qatar
2
Department of Software Engineering, Kocaeli University, İzmit 41001, Turkey
3
Department of Computer Engineering, Akdeniz University, Antalya 07058, Turkey
*
Author to whom correspondence should be addressed.
Electronics 2021, 10(20), 2534; https://doi.org/10.3390/electronics10202534
Submission received: 14 September 2021 / Revised: 12 October 2021 / Accepted: 13 October 2021 / Published: 18 October 2021
(This article belongs to the Special Issue Security & Privacy in Intelligent Transportation Systems)

Abstract

:
Intelligent Transportation Systems (ITS) aim to make transportation smarter, safer, reliable, and environmentally friendly without detrimentally affecting the service quality. ITS can face security issues due to their complex, dynamic, and non-linear properties. One of the most critical security problems is attacks that damage the infrastructure of the entire ITS. Attackers can inject malware code that triggers dangerous actions such as information theft and unwanted system moves. The main objective of this study is to improve the performance of malware detection models using Graph Attention Networks. To detect malware attacks addressing ITS, a Graph Attention Network (GAN)-based framework is proposed in this study. The inputs to this framework are the Application Programming Interface (API)-call graphs obtained from malware and benign Android apk files. During the graph creation, network metrics and the Node2Vec model are utilized to generate the node features. A GAN-based model is combined with different types of node features during the experiments and the performance is compared against Graph Convolutional Network (GCN). Experimental results demonstrated that the integration of the GAN and Node2Vec models provides the best performance in terms of F-measure and accuracy parameters and, also, the use of an attention mechanism in GAN improves the performance. Furthermore, node features generated with Node2Vec resulted in a 3% increase in classification accuracy compared to the features generated with network metrics.

1. Introduction

Intelligent Transport Systems (ITS) apply several cutting-edge Information and Communication (ICT) technologies for transportation and traffic management and it is one of the main emerging phenomena being discussed and implemented by the governments and private sectors. The main aim of these sophisticated systems is to make transportation smart without affecting and disturbing the current infrastructure [1] and it should provide safer, more reliable, and environmentally friendly mechanisms [2]. To build such a reliable and smart system, multiple advanced technologies from different application domains such as communication, transportation, engineering, finance, and computer science need to be integrated seamlessly to achieve the maximum benefit [3]. Some of the well-known applications of ITS are automatic number-plate recognition, car navigation, smart traffic signal management, and automatic parking.
Security is one of the main concerns in ITS as it manages various integrated devices and sensors from multiple application domains. There are many opportunities for attackers to exploit as in the case of IoT-based systems. Attackers can damage the complete infrastructure as security threats can misuse and manipulate different services. As such, security and privacy are the main concerns for ITS [4]. For example, attackers can inject malicious software (a.k.a., malware) code triggering different actions, such as confidential data retrieval and remote control of the ITS-based system, which in turn leads to catastrophic events in the worst-case scenario.
Malware detection is one of the major challenges in ITS because many different applications and IoT devices are used. For instance, self-driving vehicles are more vulnerable to hacks as they are connected to the Internet and can receive different commands from mobile applications. However, older cars do not have these advanced features. These hacks are very dangerous for passengers in the vehicle, other people in other vehicles, and also, pedestrians. It is very tough to detect this kind of illegal activity in real-time. However, many machine learning and deep learning techniques have been used to detect these behaviors. Machine learning methods that are generally used in this area are K-Nearest Neighbors, Support Vectors Machines, Naive Bayes, Random Forest, and Decision Trees [4,5,6,7,8]. These methods are mostly used for the classification of malware. Recently, deep learning has shown promising results in several application domains. The robustness and power of solving complex problems have attracted many researchers. Several deep learning models such as Convolutional Neural Networks (CNN), Artificial Neural Networks (ANN), Boltzmann Machines, Recurrent Neural Networks (RNN) have been used to detect the malware [9,10,11,12].
Malware is growing exponentially and researchers are facing several difficulties to overcome the challenges due to different reasons. One challenge is the lack of high-quality, industry-scale public datasets because of the potential security concerns. The other reason is the continuous emergence of new malware types. There are no specific rules and regulations to solve this problem easily. The other challenge is the evaluation of malware that is limited to a specific number of malware types in the literature. Some of the other challenges are scalability for large datasets and the required computational power for deep learning-based models. Some of the challenges in ITS include information theft, hacking activities, cyber terrorism, and intelligence gathering [13]. There are two major motives to inject the malware into ITS. The first one is the financial motivation that aims to gain economical profits by damaging the infrastructure and requesting some ransom fee (i.e., ransomware). The other motivation is information gathering that can be used for different purposes. In this modern era, many different datasets are shared publicly and hackers can access some private information using these public data. Relevant authorities must regularize proper legislation and standard procedures. The other major issue is that users do not have self-awareness and this leads to different attacks in ITS [3].
Recently, graph-based techniques have been adopted in different application domains because they capture more information and relationship between the nodes and edges. For instance, graph techniques such as Graph Convolutional Neural Networks (GCNs), Graph Neural Networks (GNNs), and Graph Attention Networks (GANs) include a rich source of information that can provide better performance compared to the traditional machine learning and deep learning techniques [14,15]. Deep Graph Convolutional Neural Networks (DGCNNs) that learn from the API call sequences are also applied [16]. The advantage of graphical-based methods is that they can capture the behavioral features and information accurately, which lacks in other methods.
The main objective of this study is to improve the performance of malware detection models using Graph Attention Networks because the performance of current models for ITS is not at an acceptable level yet. Any false positive and false negative can cause serious problems in ITS. Therefore, this paper presents two GNN models for detecting malware. Particularly, a novel GNN architecture that combines the strengths of GAN and node feature generator, Node2Vec, was proposed and the performance was evaluated on two public datasets. The first dataset is ISCX-AndroidBot-2015 that comprises 14 botnet families (https://www.unb.ca/cic/datasets/android-botnet.html, accessed on 10 August 2021).
The dataset includes 1929 samples from all families. The second dataset is CICMalDroid that contains 17,341 android samples (https://www.unb.ca/cic/datasets/maldroid-2020.html, accessed on 10 August 2021).
The contribution of this study is listed as follows:
  • This study proposed a novel framework that applies GAN model together with the API call graph data. This model is different than the studies in literature [17,18];
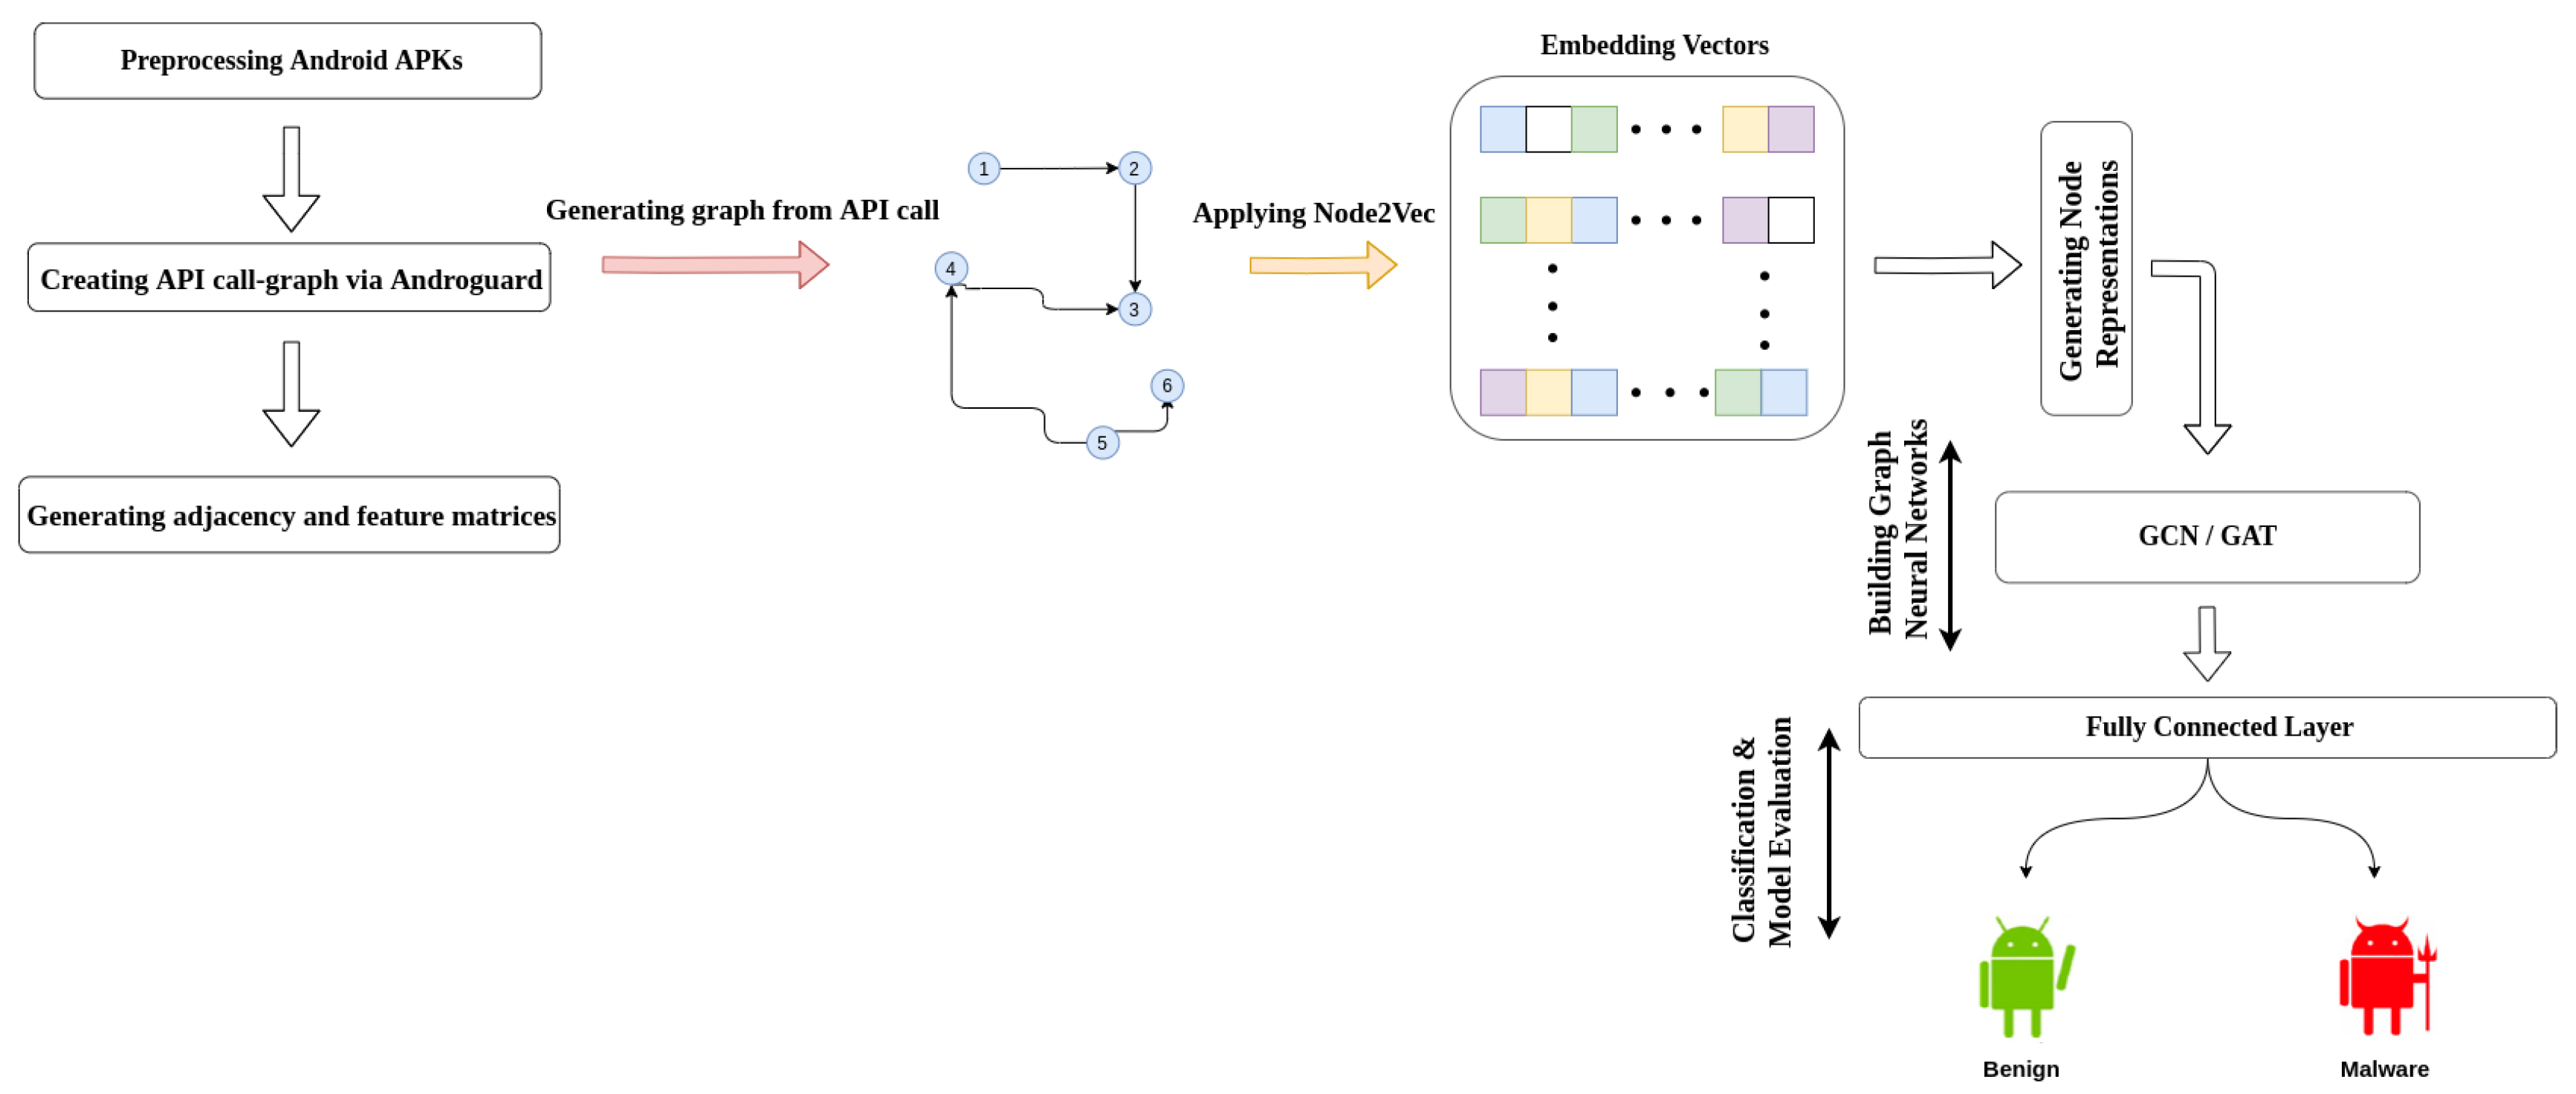
  • This study integrated the Node2Vec with the GAN model, which obtains richer and adaptive node feature representations;
  • The proposed model can be applied to detect malware in ITS, which has integrated mobile application interface.
The paper is organized as follows: Section 2 presents the related studies. Section 3 explains the methods. Section 4 discusses the proposed approach. Results are shown in Section 5. Section 6 presents the discussion and Section 7 concludes the paper.

2. Related Work

In ITS, infrastructure is connected to the external or public networks. For instance, self-driving vehicles communicate using public wireless communication channels and they operate using built-in equipment such as modems. Moreover, the interface needed to operate these services is provided by a mobile application or a built-in application by the manufacturer, which is mostly based on the Android operating system. Malware detection approaches are generally divided into three main categories, namely static analysis, dynamic analysis, and hybrid analysis. In this section, we discuss Machine Learning, Deep Learning, and Graph-based techniques that can detect malware.

2.1. Machine Learning Techniques

Rieck et al. [19] applied the SVM on a dataset including 10,072 data points and classified them into the 14 categories. This study managed to achieve up to 88% accuracy. Firdausi et al. [20] analyzed malware by using dynamic analysis on the malware and benign files. This study collected 220 malware and 250 benign files for classification. Several classifiers such as k-Nearest Neighbour, Support Vector Machines, Decision Trees, Naive Bayes, and Multi-Layer Perceptron were trained on the dataset. The best accuracy was achieved using Decision Trees (i.e., 96.8%). Sahs and Khan [21] used Support Vector Machines to detect malware. The dataset comprises 2081 benign files and 91 malicious Android applications. Rana et al. [22] applied machine learning algorithms on the Android application dataset that deals with permission access. The best accuracy is achieved by using k-Nearest Neighbours (i.e., 96%) and SVM obtained an accuracy of 93%.

2.2. Deep Learning-Based Techniques

Recently, Deep Neural Networks have shown promising results in many different application domains. Deep learning-based models such as Convolutional Neural Networks (CNN), Recurrent Neural Networks (RNN), Long Short-Term Memory (LSTM), and Auto-Encoders (AE) achieved better performance to detect malware. Static approaches use features such as API calls, commands, and permissions [23,24]. On the other hand, dynamic approaches operate on the Android applications in a controlled environment [25,26].
Sewak et al. [10] used different combinations of deep learning architectures including auto-encoders. The previously reported best accuracy was 98% and false-positive rate was 1.07%. In this study, features are extracted automatically and the model achieved an accuracy of 99.21% and obtained a false positive ratio of 0.19% [10]. Another study proposed a lightweight PC malware detection system to overcome the time complexity of deep learning models. This system is based on the Convolutional Neural Network (CNN) algorithm that learns features automatically based on the given input, which is a sequence of group instructions. The accuracy is 95% achieved on the dataset including 70,000 data points [23]. Alzaylaee et al. [24] proposed a deep learning-based malware detection model called DL-Droid. It detects malicious Android applications by using input generations through dynamic analysis. The dataset size is 30,000 and comprises malware and benign applications. Moreover, experiments are performed by using both dynamic and hybrid features (dynamic + static). In the case of dynamic features, the model achieved an accuracy of 97.8% and, in the case of the hybrid, it has an accuracy of 99.6%.

2.3. Graph-Based Techniques

Recently, Graph Neural Networks (GNN) received the attention of researchers in the field of cybersecurity. In GNN, each node is associated with a label and the goal is to predict the label of unknown nodes by using the neighborhood information. The edge between two specific nodes contains specific features about its neighbors and this process is known as a neighborhood problem. Generally, embeddings are used to represent the features and neighboring nodes. Xu et al. [27] presented a GNN-based malware detection system and the categorization technique is based on the function call graph. In this study, the Android application graph structure is transformed into vectors and the model classifies the malware families. The accuracy of 99.6% is achieved for malware detection and the accuracy of 98.7% is obtained for classification. Graph Convolutional Network (GCN) is a semi-supervised approach that deals with graphical data. It is the variant of the traditional CNN, but it uses the graphical data and works on the spectral graph convolutions via local approximation [14]. Gao et al. [17] proposed a GCN-based model named Gdriod for malware classification. The idea of this study was to map the Android application and APIs to a heterogeneous graph and build edge-based relationships. The accuracy obtained is 98.99% and the false-positive ratio is less than 1%. In the case of classification, this study achieves an accuracy of 97%. Other studies [16,18] also utilized the GCN for malware detection and classification.
Graph Attention Network is a neural network architecture that also operates on graphical data. Veličković et al. [15] proposed a model to overcome the shortcomings of previous models that use an attention mechanism. In this study, attention layers are used, which are stacked over one another to interact with the neighbors. The main advantage of this method is that it does not depend on the structure of the graph. This study not only achieved better results than the previous ones but also resolve transductive and inductive problems that were discussed in the literature. Kipf et al. presented a Variational Graph Autoencoder (VGAE) for unsupervised learning that applies the VAE over the graphical data [28]. The basic idea of this framework is to generate new graphs. As the input data is graphical, the general VAE is not applicable because the graph structure is irregular. The features matrix is generated and represents the feature embeddings of each node. Further, the encoder of the VGAE consists of GCNs and as an input, it takes adjacency matrix and feature matrix and generates latent variables as output. The decoder is the inner product of latent vectors. This study was used for the link prediction tasks in Cora, Citeseer, and PubMed and achieved higher accuracy.

3. Methods

This section explains graph-based classification models, types of attributes, and model evaluation metrics.

3.1. Graph-Based Classification Models

Nowadays, a lot of information is represented with graphs such as Google’s Knowledge Graph, which helps for Search Engine Optimization (SEO), chemical molecular structure, document citation networks (e.g., document A cited document B), and social media networks (i.e., who linked whom). A graph consists of two main elements: nodes (vertices or points) and edges (connections or lines). For example, in the CORA dataset, which is a document citation network, nodes represent the documents in the network, the edge connecting one node to another indicates that this document is citing another document [29]. Due to having the arbitrary size of nodes and complex topology, end-to-end deep models such as Convolutional Neural Networks (CNNs), Recurrent Neural Networks (RNNs), or Autoencoders failed to model graph structures under the assumption of independence of the instances [30]. While these models are capable of capturing hidden patterns of structured data (e.g., images, text, video), they fail to capture patterns from graph structures due to the interconnection of graph nodes by various edges.
GCNs are a type of deep learning method designed to make inferences on data defined by graph structures. GCNs are neural networks that can be applied directly to graphs and provide an easy way to perform node-level, edge-level, and graph-level prediction tasks [30]. The concept of node embedding in GNNs was introduced to compensate for the failure of CNN in modeling graph networks. Node embedding allows nodes with similar properties in the graph to be projected to nearby points in a d-dimensional embedding space [31].
GCNs utilize adjacency and feature matrices for node embedding. Adjacency matrices can represent the existence of edges connecting pairs of nodes. Unlike adjacency matrices that model the relationship between nodes, graphs have a feature matrix representing the properties or attributes of each node. If a graph has N nodes and each node has K number of attributes, the dimension of the feature matrix is N by K [14]. In the example of the CORA dataset, we need to have a corpus containing words from all documents. Each document is represented by a node, while node features are the bag of words that indicates the presence of a word in the document. In this case, K represents the size of the corpus (i.e., the total number of unique words), while N is the total number of documents available.
GCNs can perform network training using Spatial Graph Convolution Networks and Spectral Graph Convolution Networks methods. Spectral Based Graph Convolutional Networks are more preferred because they are less costly in terms of computation [32]. In neural networks, the following equation is applied to propagate the feature representation to the next layer:
H i + 1 = σ W i H i + b i .
This operation is basically the same as y = m x + b in linear regression. In the equation, m is the weights, x is the input features, and b is the bias. The rearrangement of Equation (1) for the first hidden layer (i = 0) is as follows:
H [ 1 ] = σ W T [ 0 ] X + b [ 0 ] .
In Equation (2), the feature representations in layer 0 are basically input features (X). This forward propagation process in Artificial Neural Networks differs in GCNs. The underlying idea of Spectral GCN is based on signal/wave propagation. Information propagation between nodes in a spectral GCN is characterized as signal propagation across nodes. Spectral GCNs make use of the Eigen-decomposition of the graphical Laplacian matrix to implement the information propagation method. Eigen-decomposition is an important tool for understanding graph structure and is similar to Principal Component Analysis (PCA) and Linear Discrimination Analysis (LDA) methods used for dimensionality reduction and clustering [32].
The Fast Approximate Spectral Graph Convolutional Networks method uses the adjacency matrix of graphs (A) and node properties in the forward propagation process of the network. The matrix A represents the connections between the nodes in the forward propagation equation, as mentioned earlier. The presence of A in the forward pass enables the network to learn feature representations based on node connections during learning. Thus, the resulting GCN is a type of message passing network, in which information is propagated across neighboring nodes [14]. With the addition of the adjacency matrix, the forward pass equation is as follows:
H [ i + 1 ] = σ A H [ i ] W [ i ] .
By adding A to the forward pass and doing the dot product of A and H simplifies the process of constructing the feature representation of the model. The feature representations generated by the dot product of the adjacency matrix and the node features are basically equal to the sum of the neighboring node features. While using the attributes of the neighboring node in the creation of the feature representations in the A H operation, it does not benefit from the attributes of the node itself. To solve this problem, self-loops are added to each node of the graph, and the diagonal elements of A adjacency matrix are changed to 1. Thus, the feature vector X is dot-producted with this matrix called A ^ and the neighboring node features are also used together with the node features during calculating the node representations [33].
H [ i + 1 ] = σ D 1 A ^ H [ i ] W [ i ] .
The fact that the matrix elements have different numerical ranges in A H dot-product causes numerical instability and vanishing gradient in network training, as in artificial neural networks. In order to prevent this situation, a data pre-processing step such as the normalization process in neural networks should be performed. Normalization in GCNs is done using the Degree (D) matrix. The degree matrix expresses the number of edges to which the nodes in a graph are connected. In GCN, the normalization process is done by computing the inverse of D matrix and performing the dot-product with A ^ H . Another graph neural network used in our study is the Graph Attention Network (GAN). Unlike GCNs, where each neighbor node contributes equally to generating the central node representation, GANs have an attention mechanism that assigns different importance to each neighbor node’s contribution [15].

3.2. Node2Vec Embedding

Node2Vec is an embedding method that transforms nodes in a graph into dense and low-dimensional attribute representations. Node2Vec considers edges and edge weights between nodes during the vector creation process. Similar representations are created for nearby nodes in the network while the structure of the original network is preserved during the representation process. Node2vec generates the feature representation of each node in the graph via a second-order random walk. The main difference between the second-order walk and the first order walk is that the transitions from one node to the other nodes depend not only on the current state but also on the previous state [34].
In the second-order walk, a bias factor called alpha is used to calculate the transition probabilities between nodes. There are five parameters that need to be determined in the Node2Vec embedding process. These are the size of the feature embedding, the number of random walks to be executed for each node, the maximum number of nodes to be visited for each walk, and the p and q parameters for determining the alpha value [35].
In Node2Vec, each node in the graph is determined as the starting point and a certain number of random walks are created from these points. The walks generated for each node form a corpus, which is given as an input to the Word2Vec model to generate node representations. The aim in the training of the Word2Vec is to maximize the probability of predicting the correct context nodes given the central node. Word2Vec model outputs to the predefined size of embedding vectors belonging to each node in the graphs [36]. To get rich representations, Node2Vec takes advantage of flexible parameters in exploring neighborhoods in the graph, helping to ensure the exploration and exploitation trade-off involved in graph-optimization problems [34].

3.3. Performance Evaluation Metrics

Although accuracy is the most used measure in performance measurement, it does not provide sufficient information to demonstrate the class discrimination ability of the model. Besides accuracy, the F-measure metric is also used to assess the performance of the model in distinguishing between different class instances. Accuracy and F-measure metrics are calculated based on Confusion Matrix (CM). CM simply refers to the number of correctly and incorrectly classified samples per class in a binary classification task (Table 1). True positive ( t p ), false positive ( f p ), false negative ( f n ), and true negative ( t n ) are matrix elements that are used to calculate aforementioned metrics.
Accuracy indicates the ratio of the number of correctly predicted samples to the total number of samples. However, where the difference between the f p and f n values is too large, precision, recall, and F-measure metrics need to be considered. Precision is the ratio of the true positive samples to the positively predicted samples (Equation (5). Recall represents the ratio of correctly classified positive samples ( t p ) to the total number of true positive samples (Equation (6)). A low precision means that the model produces a large number of false positive samples, while low recall rate indicates that the model result contains a large number of false negatives [37]. F-measure is defined as a harmonic mean of precision and recall. F-measure considers both false positive and false negative samples in the evaluation and can directly measure the class discrimination of the models. In addition, F-measure can measure the performance of models trained on unbalanced datasets [38]. Based on the confusion matrix, F-Measure is calculated as follows:
precision = t p t p + f p
recall = t p t p + f n
F-Measure = 2 × p r e c i s i o n × r e c a l l p r e c i s i o n + r e c a l l .

4. Proposed Framework and Properties

4.1. Framework

The proposed malware detection framework can be considered as an end-to-end model that takes the Android apk files as inputs and decides whether these files are malware or not as output (Figure 1). This framework consists of four steps. In the first step, Android apk files used in model training were collected from two datasets. To detect malware applications on ITS devices, a new dataset was collected by compiling public datasets. While 1843 benign apk files were obtained from the CICMalDroid [39] dataset, apk files containing malware were collected from the ISCX-AndroidBot-2015 [40] dataset.
API-call graphs, which represented calling relationships between methods in a computer program, were created from apk files by the Androguard tool (https://androguard.readthedocs.io/en/latest/, accessed on 10 August 2021). After the call graph generation, the attributes of the nodes in the graphs were determined. At this step, two feature generation approaches were implemented.
In the first approach, four features were generated for each node using four different graph topology metrics. In-degree, out-degree, closeness, and Katz centrality were employed as network metrics. With the help of these metrics, information was obtained from the nearby local regions of each node. In the second approach, the Node2Vec model was used as a feature generator to expand the local regions of the nodes. With the Node2Vec, 50 dimensional feature representations were generated for each node. The third step of the framework carries out the model training process. At this step, popular two graph neural network models, namely GAN and GCN architectures, were employed for malware detection. A total of four model combinations were created for classification. In the last step of the framework, the predictive performance of models were assessed. Accuracy and F-measure metrics were used during the evaluation process.

4.2. Framework Properties to Detect Malware for ITS

Security threats have increased due to the increasing connectivity of vehicles. Malicious software can flow into the internal network of the vehicle if an infected device is connected to the vehicle, which in turn can create a backdoor that can allow attackers to elevate the account privileges [41]. As such, we have to detect malware in self-driving vehicles. In their paper, Park and Choi (2020) also used the same dataset as we have used. The idea in this paper is to use malicious software in the Android OS because malware can have a detrimental effect on many ITS.
Malware detection problems encountered in ITS can be approached from two perspectives. The first perspective is related to the malware issues that occur in Vehicle-to-Device Communications [42]. This type of communication, which is defined as vehicle-to-everything, includes mostly Android-based smartphones as the basic component. Service information about the vehicle such as fuel consumption, filter status, battery status, and vehicle anomalies such as insufficient tire pressure can be detected with the help of applications installed on smartphones. In the early years, communication between devices and smartphones was provided locally via serial communication or Bluetooth interfaces. With the emergence of the Internet of Things (IoT), vehicle manufacturers placed Telematic Control Units (TCUs) in vehicles, which provide access to vehicles over mobile networks [43]. As such, information about both the vehicle and the driver became available for collection and management easily. However, extracting information regarding the vehicles and driving patterns causes different threats.
The most common threat is the transmission of the vehicle information to third parties by using malicious code injected into the software of the vehicles. Another threat is that some services of the vehicles are disabled by malware while during the vehicle software update over the Internet. Therefore, preventive intervention is needed to protect both the software of the vehicle and the server traffic against malware. From this perspective, we can state that our proposed model presents a graph-based solution that is capable of catching malicious software code both in vehicles and devices during Vehicle-To-Device communication.
The second perspective is that malware can also trigger hacking attacks such as leaking private/confidential information or denial of service (DoS). Especially, in the case of Android OS, malware is usually integrated into the system from a web page or due to an email attachment without the user‘s intention/knowledge. This malware can collect user and device information and transmit them to a remote server. Malicious software can also initiate a backdoor service that allows the attacker to gain access to the device and control of the device. This is particularly dangerous when an Android-based device is connected to an autonomous vehicle [44]. When the device hijacked by the malware code is integrated with the autonomous vehicle, the hijacker can transmit malicious code to the vehicle’s built-in software in order to malfunction the autonomous behaviours. Our proposed model can be used to detect malware with the help of Graph Attention Networks on Android-based devices and as such, prevent the infection of the functions of autonomous vehicles.
The performance of graph neural networks is directly proportional to the quality of the node features. In both GCN and GAN models, the representations produced for each node are taken into account when performing the classification process. In order to evaluate the performance of the node features, both the static network attributes and the features generated by traversing the graphs are used. It has been observed that robust features produced by exploring graphs with the Node2Vec method cause performance increase in both GCN and GAN models. Hence, the proposed model is generic enough to be used in different malware detection scenarios including self-driving vehicles.

5. Experimental Results

Experiments were performed on a dataset created from the combination of two public datasets. Since graph data require high computational power, experiments were run on a computer with an Intel i7 7700 HQ processor with GTX 1070 Graphics Processing Unit (GPU) support. Pytorch-Geometric module [45] of the Pytorch framework was utilized to create graph neural networks. Compared to Keras and Tensorflow, Pytorch provides rich and diverse options in generating graph neural networks with the help of the Pytorch-Geometric package. Pytorch-Geometric has an integration with several graph modules such as Networkx for the easy processing of graph data. The first graph neural network was Gconv that was a variant of the GCN model. The second network was the Graph Attention Network, which was the attention boosted version of GCN. Both network architectures consist of five layers except the input layer. The next three layers of the networks after the input layer are the consecutive convolution layers where abstract feature representations of the specified size are produced for each node. In order to use these produced outputs in graph classification, dimensionality reduction was performed with the global pooling layer. At the last stage, the outputs produced in the global pooling layer were given to the softmax layer and it was decided whether the apk file was malware or not. The hyperparameters of the created architectures are shown in Table 2.
Experiments with two established network architectures were performed using a 10-fold cross-validation approach. Despite mostly used technique in performance evaluation is hold-out method that divides the dataset into two partitions as training and test set, this approach cannot cover all instances in the dataset and cause biases in performance evaluation. In order to handle this issue, 10-fold cross-validation was employed for the assessment of our model performance. Cross-validation is easy to understand and is less prone to biased estimation in the validation of the predictive performance. During the training, every fold was trained for 100 epochs with 64 batch sizes. Although there were many feasible optimizers, such as AdaBelief, Adagrad, and Rmsprop, Adam was selected as an optimizer due to fast convergence and high accuracy properties [46]. In order to prevent over-fitting during the model training, both dropout and regularizer layers were added after convolution and global pooling layers. In addition, early stopping was performed to check the decrease in the training error for every 15 iterations during the model training. Node2Vec model was used in the generation of node features. Unlike Deepwalk and Randomwalk models, which assign equal probabilities to each neighbor node in generation random paths, Node2vec uses the parameters p and q, which indicate how quickly neighbors can be discovered in graph traversals.
The hyperparameters of the Node2Vec model were listed in Table 3.
In model training, different experimental setups were conducted by changing the number of hidden units in the convolutional layers of GAN and GCN models. 16, 32, 64, and 128 were selected as the number of hidden units in the proposed framework. In order to test the statistical significance of the experimental results, the Wilcoxon Signed Rank Test was applied using a 0.05 significance level.
According to the 10-fold cross-validation, results are shown in Table 4 and Table 5. The predictive performance of the GAT model was significantly larger than the GAN model in both node feature types. Results showed that the highest accuracy rate was obtained by the GAT model with Node2Vec generated features. This model provided an accuracy rate of 0.961 with an F-measure rate of 0.941 using 64 hidden units in its convolutional layers. The same model achieved an accuracy of 0.955 and an F-measure of 0.938 when using 128 hidden units. In the combination of Node2Vec and GCN, the highest classification accuracy was reached with 0.933 (0.918 F-measure rate), again using 64 hidden units. When the results of the GAN and GCN models were compared, the use of attention mechanism in GAN resulted in a performance increase of about three percent. The same performance increase was also seen when node features generated with the Node2Vec model were used instead of the network metrics. Compared to the results obtained with the network metrics, there was a performance improvement of approximately two percent with Node2Vec in both the GAN and GCN models.

6. Discussion

Experimental studies have some limitations and threats to validity. In this study, experiments were carried out in two different datasets. The performance of the proposed model on other datasets might be slightly different; however, we do not expect too much change in the performance. We focused on malware detection in ITS; however, there are also other threats that need to be considered. A complete security framework for an ITS must address these additional components instead of focusing only on malicious software. Different researchers might develop new models using new deep learning algorithms and reach better performance results than the one reported in this study. We applied widely applied evaluation approaches in this study, however, the results might be slightly different if the evaluation strategy is changed during the experiments.
The main difference between GCNs and GANs is that GANs use attention mechanisms that assign greater weights to more important nodes, walks, or patterns. To generate node representations, GCNs consider only neighboring node representations and weigh the neighbor representations equally. On the other hand, GANs combine random walks or outputs from multiple candidate models, as well as representations of neighboring nodes, to produce node representations. While combining the outputs, the attention mechanism weights learned adaptively in the training of the network are used.
Our proposed model has a general structure that can be extended to many areas including node and edge data types. Tasks in bioinformatics, social network analysis, transportation management systems are some examples of these areas where our model can be adopted.

7. Conclusions

A typical ITS consists of several complex advanced and emerging technologies including autonomous vehicles, payment applications, management applications, communication applications, and real-time traffic flow controls. Many different parties, such as different nations, cyber-criminals, and hacktivists might have different motives to cause chaos in ITS. Previously, roadside boards, surveillance cameras, and emergency sirens have been hacked. Since these Intelligent Transportation Systems include many different software components, the detection of malicious software in ITS with high performance is crucial. This study aimed to improve the performance of malware detection models using Graph Attention Networks (GAN). The proposed model integrated the Node2Vec and GAN. Experimental results showed that node features that are created with Node2Vec provide better accuracy compared to the features generated with network metrics. It was shown that the GAN-based detection model provides remarkable results. Future work will evaluate the performance of the model against adversarial machine learning attacks and will involve new case studies. We will also cover the use of deep learning models in the intelligent transportation systems from the perspectives of Explainable Artificial Intelligence (XAI).

Author Contributions

Conceptualization, C.C., H.G. and A.O.; methodology, H.G., C.C. and A.O.; software, H.G. and A.O.; validation, H.G., A.O. and C.C.; formal analysis, H.G. and A.O.; investigation, H.G., A.O. and C.C.; resources, H.G. and A.O.; data curation, H.G., A.O. and C.C.; writing—original draft preparation, H.G., A.O. and C.C.; writing—review and editing, H.G., C.C. and A.O.; visualization, H.G., A.O. and C.C; supervision, C.C.; project administration, A.O. All authors have read and agreed to the published version of the manuscript.

Funding

This research received no external funding.

Data Availability Statement

Public datasets have been used.

Conflicts of Interest

The authors declare no conflict of interest.

References

  1. Qi, L. Research on Intelligent Transportation System Technologies and Applications. In Proceedings of the Workshop on Power Electronics and Intelligent Transportation System, Guangzhou, China, 4–5 August 2008; pp. 529–531. [Google Scholar]
  2. Mokaddem, Y.; Jawab, F. Researches and applications of intelligent transportations systems in urban area: Systematic literature review. ARPN J. Eng. Appl. Sci. 2019, 14, 639–652. [Google Scholar]
  3. Harvey, J.; Kumar, S. A Survey of Intelligent Transportation Systems Security: Challenges and Solutions. In Proceedings of the 2020 IEEE 6th Intl Conference on Big Data Security on Cloud (BigDataSecurity), IEEE Intl Conference on High Performance and Smart Computing, (HPSC) and IEEE Intl Conference on Intelligent Data and Security (IDS), Baltimore, MD, USA, 25–27 May 2020; pp. 263–268. [Google Scholar]
  4. Hahn, D.; Munir, A.; Behzadan, V. Security and Privacy Issues in Intelligent Transportation Systems: Classification and Challenges. IEEE Intell. Transp. Syst. Mag. 2019, 13, 181–196. [Google Scholar] [CrossRef] [Green Version]
  5. Chumachenko, K. Machine Learning Methods for Malware Detection and Classification. Bachelor’s Thesis, Lahti University of Technology LUT, Lappeenranta, Finland, March 2017. [Google Scholar]
  6. Alkasassbeh, M.; Mohammed, S.; Alauthman, M.; Almomani, A. Feature Selection Using a Machine Learning to Classify a Malware; Springer: Cham, Switzerland, 2020; pp. 889–904. [Google Scholar]
  7. Mahajan, G.; Saini, B.; Anand, S. Malware Classification Using Machine Learning Algorithms and Tools. In Proceedings of the Second International Conference on Advanced Computational and Communication Paradigms, Gangtok, India, 25–28 February 2019; pp. 1–8. [Google Scholar]
  8. Park, H.; Piamrat, K.; Singh, K.; Chen, H. Data Analysis for Self-Driving Vehicles in Intelligent Transportation Systems. J. Adv. Transp. 2020, 2020, 9386148. [Google Scholar] [CrossRef]
  9. Hardy, W.; Chen, L.; Hou, S.; Ye, Y.; Li, X. DL 4 MD: A Deep Learning Framework for Intelligent Malware Detection. In Proceedings of the International Conference on Data Mining, Las Vegas, NV, USA, 25–28 July 2016. [Google Scholar]
  10. Sewak, M.; Sahay, S.; Rathore, H. An investigation of a deep learning based malware detection system. In Proceedings of the 13th International Conference on Availability, Reliability and Security (ARES 2018), New York, NY, USA, 27–30 August 2018. [Google Scholar]
  11. Zhu, D.; Jin, H.; Yang, Y.; Wu, D.; Chen, W. DeepFlow: Deep learning-based malware detection by mining Android application for abnormal usage of sensitive data. In Proceedings of the IEEE Symposium on Computers and Communications (ISCC), Heraklion, Crete, Greece, 3–6 July 2017; pp. 438–443. [Google Scholar]
  12. Saxe, J.; Berlin, K. Deep neural network based malware detection using two dimensional binary program features. In Proceedings of the 10th International Conference on Malicious and Unwanted Software (MALWARE), Fajardo, PR, USA, 20–22 October 2015; pp. 11–20. [Google Scholar]
  13. Naseer, M.; Rusdi, J.; Shanono, N.; Salam, S.; Muslim, Z.; Abu, N.; Abadi, I. Journal of Physics: Conference Series. In Proceedings of the International Conference of Science and Information Technology in Smart Administration (ICSINTeSA), Balikpapan Kota, Indonesia, 16–17 October 2019. [Google Scholar]
  14. Kipf, T.; Welling, M. Semi-Supervised Classification with Graph Convolutional Networks. In Proceedings of the 5th International Conference on Learning Representations, ICLR 2017, Toulon, France, 24–26 April 2017. [Google Scholar]
  15. Veličković, P.; Cucurull, G.; Casanova, A.; Romero, A.; Liò, P.; Bengio, Y. Graph Attention Networks. In Proceedings of the 6th International Conference on Learning Representations, ICLR 2018, Vancouver, BC, Canada, 30 April–3 May 2018. [Google Scholar]
  16. Oliveira, A.; Sassi, R. Behavioral Malware Detection Using Deep Graph Convolutional Neural Networks. TechRxiv, 2019; under review. [Google Scholar]
  17. Gao, H.; Cheng, S.; Zhang, W. GDroid: Android malware detection and classification with graph convolutional network. Comput. Secur. 2021, 106, 102264. [Google Scholar] [CrossRef]
  18. John, T.; Thomas, T.; Emmanuel, S. Graph Convolutional Networks for Android Malware Detection with System Call Graphs. In Proceedings of the Third ISEA Conference on Security and Privacy (ISEA-ISAP), Guwahati, India, 27 February–1 March 2020. [Google Scholar]
  19. Rieck, K.; Holz, T.; Willems, C.; Düssel, P.; Laskov, P. Learning and Classification of Malware Behavior. In Proceedings of the 5th International Conference on Detection of Intrusions and Malware, and Vulnerability Assessment DIMVA, Paris, France, 10–11 July 2008. [Google Scholar]
  20. Firdausi, I.; Lim, C.; Erwin, A.; Nugroho, A. Analysis of machine learning techniques used in behavior-based malware detection. In Proceedings of the International Conference on Advances in Computing, Control and Telecommunication Technologies, Jakarta, Indonesia, 2–3 December 2010. [Google Scholar]
  21. Sahs, J.; Khan, L. A machine learning approach to android malware detection. In Proceedings of the European Intelligence and Security Informatics Conference, Odense, Denmark, 22–24 August 2012. [Google Scholar]
  22. Rana, J.S.; Gudla, C.; Sung, A.H. Evaluating machine learning models for android malware detection: A comparison study. In Proceedings of the 2018 VII International Conference on Network, Communication and Computing, New York, NY, USA, 14–16 December 2018. [Google Scholar]
  23. Kan, Z.; Wang, H.; Xu, G.; Guo, Y.; Chen, X. Towards Light-Weight Deep Learning Based Malware Detection. In Proceedings of the IEEE 42nd Annual Computer Software and Applications Conference (COMPSAC), Tokyo, Japan, 23–27 July 2018. [Google Scholar]
  24. Alzaylaee, M.K.; Yerima, S.Y.; Sezer, S. DL-Droid: Deep Learning Based Android Malware Detection Using Real Devices. Comput. Secur. 2020, 89, 101663. [Google Scholar] [CrossRef]
  25. Aafer, Y.; Wenliang, D.; Yin, H. DroidAPIMiner: Mining API-Level Features for Robust Malware Detection in Android. In Proceedings of the International Conference on Security and Privacy in Communication Systems, Sydney, Australia, 25–28 September 2013; pp. 86–103. [Google Scholar]
  26. Yerima, S.Y.; Sezer, S. DroidFusion: A Novel Multilevel Classifier Fusion Approach for Android Malware Detection. IEEE Trans. Cybern. 2019, 49, 453–466. [Google Scholar] [CrossRef] [PubMed]
  27. Xu, P.; Eckert, C.; Zarras, A. Detecting and categorizing Android malware with graph neural networks. In Proceedings of the 36th Annual ACM Symposium on Applied Computing (SAC ’21), New York, NY, USA, 22–26 March 2021; pp. 409–412. [Google Scholar]
  28. Kipf, T.; Welling, M. Variational Graph Auto-Encoders. In Proceedings of the 30th International Conference on Neural Information Processing Systems, (NIPS’16), Barcelona, Spain, 5–10 December 2016. [Google Scholar]
  29. Goyal, P.; Ferrara, E. Graph embedding techniques, applications, and performance: A survey. Knowl.-Based Syst. 2018, 151, 78–94. [Google Scholar] [CrossRef] [Green Version]
  30. Wu, Z.; Pan, S.; Chen, F.; Long, G.; Zhang, C.; Philip, S. A comprehensive survey on graph neural networks. IEEE Trans. Neural Netw. Learn. Syst. 2020, 32, 4–24. [Google Scholar] [CrossRef] [PubMed] [Green Version]
  31. Cavallari, S.; Zheng, V.; Cai, H.; Chang, K.; Cambria, E. Learning community embedding with community detection and node embedding on graphs. In Proceedings of the 2017 ACM on Conference on Information and Knowledge Management, Singapore, 6–10 November 2017; pp. 377–386. [Google Scholar]
  32. Qin, A.; Shang, Z.; Tian, J.; Wang, Y.; Zhang, T.; Tang, Y. Spectral–spatial graph convolutional networks for semisupervised hyperspectral image classification. IEEE Geosci. Remote Sens. Lett. 2018, 16, 241–245. [Google Scholar] [CrossRef]
  33. Zhang, S.; Tong, H.; Xu, J.; Maciejewski, R. Graph convolutional networks: A comprehensive review. Comput. Soc. Netw. 2019, 6, 1–23. [Google Scholar] [CrossRef] [Green Version]
  34. Grover, A.; Leskovec, J. node2vec: Scalable feature learning for networks. In Proceedings of the 22nd ACM SIGKDD International Conference on Knowledge Discovery and Data Mining, San Francisco, CA, USA, 13–17 August 2016; pp. 855–864. [Google Scholar]
  35. De Winter, S.; Decuypere, T.; Mitrović, S.; Baesens, B.; De Weerdt, J. Combining temporal aspects of dynamic networks with Node2Vec for a more efficient dynamic link prediction. In Proceedings of the 2018 IEEE/ACM International Conference on Advances in Social Networks Analysis and Mining (ASONAM), Barcelona, Spain, 28–31 August 2018; pp. 1234–1241. [Google Scholar]
  36. Grohe, M. word2vec, node2vec, graph2vec, x2vec: Towards a theory of vector embeddings of structured data. In Proceedings of the 39th ACM SIGMOD-SIGACT-SIGAI Symposium on Principles of Database Systems, Portland, OR, USA, 14–19 June 2020; pp. 1–16. [Google Scholar]
  37. Gunduz, H. An efficient stock market prediction model using hybrid feature reduction method based on variational autoencoders and recursive feature elimination. Financ. Innov. 2021, 7, 1–24. [Google Scholar] [CrossRef]
  38. Gunduz, H. An efficient dimensionality reduction method using filter-based feature selection and variational autoencoders on Parkinson’s disease classification. Biomed. Signal Process. Control. 2021, 66, 102452. [Google Scholar] [CrossRef]
  39. Mahdavifar, S.; Kadir, A.; Fatemi, R.; Alhadidi, D.; Ghorbani, A. Dynamic Android Malware Category Classification using Semi-Supervised Deep Learning. In Proceedings of the 2020 IEEE Intl Conf on Dependable, Autonomic and Secure Computing, Intl Conf on Pervasive Intelligence and Computing, Intl Conf on Cloud and Big Data Computing, Intl Conf on Cyber Science and Technology Congress (DASC/PiCom/CBDCom/CyberSciTech), Calgary, AB, Canada, 17–22 August 2020; pp. 515–522. [Google Scholar]
  40. Kadir, A.; Stakhanova, N.; Ghorbani, A. Android botnets: What urls are telling us. In International Conference on Network and System Security; Springer: Cham, Switzerland, 2015; pp. 78–91. [Google Scholar]
  41. Park, S.; Choi, J. Malware detection in self-driving vehicles using machine learning algorithms. J. Adv. Transp. 2020, 14, 3035741. [Google Scholar] [CrossRef] [Green Version]
  42. Bian, K.; Zhang, G.; Song, L. Toward secure crowd sensing in vehicle-to-everything networks. IEEE Netw. 2017, 32, 126–131. [Google Scholar] [CrossRef]
  43. Luo, Q.; Liu, J. Wireless telematics systems in emerging intelligent and connected vehicles: Threats and solutions. IEEE Wirel. Commun. 2018, 25, 113–119. [Google Scholar] [CrossRef]
  44. Al-Sabaawi, A.; Al-Dulaimi, K.; Foo, E.; Alazab, M. Addressing Malware Attacks on Connected and Autonomous Vehicles: Recent Techniques and Challenges. In Malware Analysis Using Artificial Intelligence And Deep Learning; Springer: Cham, Switzerland, 2021; pp. 97–119. [Google Scholar]
  45. Fey, M.; Lenssen, J. Fast graph representation learning with PyTorch Geometric. arXiv 2019, arXiv:1903.02428. [Google Scholar]
  46. Bock, S.; Weiß, M. A proof of local convergence for the Adam optimizer. In Proceedings of the 2019 International Joint Conference on Neural Networks (IJCNN), Budapest, Hungary, 14–19 July 2019; pp. 1–8. [Google Scholar]
Figure 1. Diagram of proposed malware detection framework.
Electronics 10 02534 g001
Table 1. Confusion matrix for two-class classification.
Actual/Predicted asPositiveNegative
Positive t p f n
Negative f p t n
Table 2. Hyperparameters of proposed GCN and GAN models.
ParameterValue
#epoch100
#hidden units{16, 32, 64, 128}
#layers3
Dropout rate0.2
L2-regularization rate0.01
OptimizerAdam
Table 3. Hyperparameters of Node2Vec model.
ParameterValue
size of the feature embeddings50
# random walks5
maximum # nodes to be visited80
p0.5
q2
Table 4. Classification results using node features generated with network metrics.
GATGCN
# NeuronsAccuracyF-MeasureAccuracyF-Measure
160.9240.9010.9000.870
320.9340.9160.9010.875
640.9470.9270.9150.898
1280.9370.9200.9060.887
Table 5. Classification results using node features generated with Node2Vec model.
GATGCN
# NeuronsAccuracyF-MeasureAccuracyF-Measure
160.9450.9180.9140.889
320.9530.9320.9230.902
640.9610.9480.9330.918
1280.9550.9380.9270.908
Publisher’s Note: MDPI stays neutral with regard to jurisdictional claims in published maps and institutional affiliations.

